Embed Size (px)
Citation preview
C. Ebeling, Intro to Reliability & Maintainability Engineering, 2nd ed. Waveland Press, Inc. Copyright © 2010
Chapter 8 Design for Reliability
8.1 Reliability Specification8.2 Reliability Allocation8.3 Design Methods
Chapter 8 1
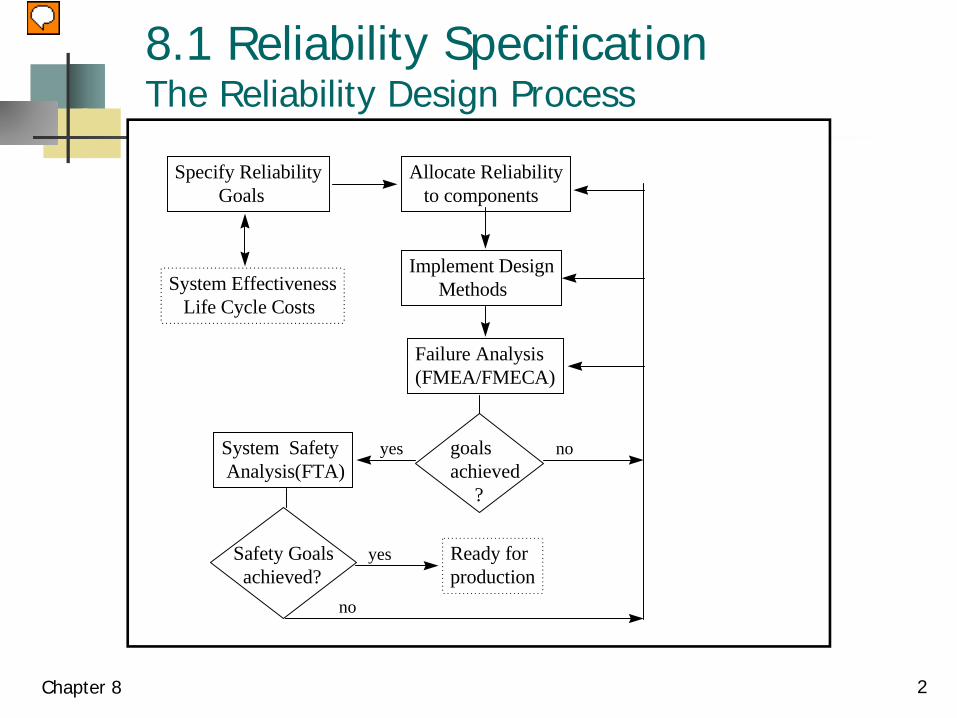
8.1 Reliability SpecificationThe Reliability Design Process
Chapter 8 2
Specify Reliability Goals
Allocate Reliability to components
Implement Design Methods
Failure Analysis(FMEA/FMECA)
goalsachieved ?
System Safety Analysis(FTA)
System Effectiveness Life Cycle Costs
Safety Goals achieved?
yes no
Ready forproduction
yes
no

Reliability Activities & Product Life Cycle
Chapter 8 3
Development
Phase
Conceptual &
Preliminary
Design
Detailed Design,
Development &
Prototyping
Production &
Manufacture
Product Use &
Support
Specification
Allocation
Design Methods
Design Methods
Failure Analysis
Growth Testing
Safety Analysis
Acceptance test
Quality Control
Burn-in & Screen
Testing
Preventive &
Predictive
Maintenance
Modifications
Parts Replacement
System Effectiveness
Chapter 8 4
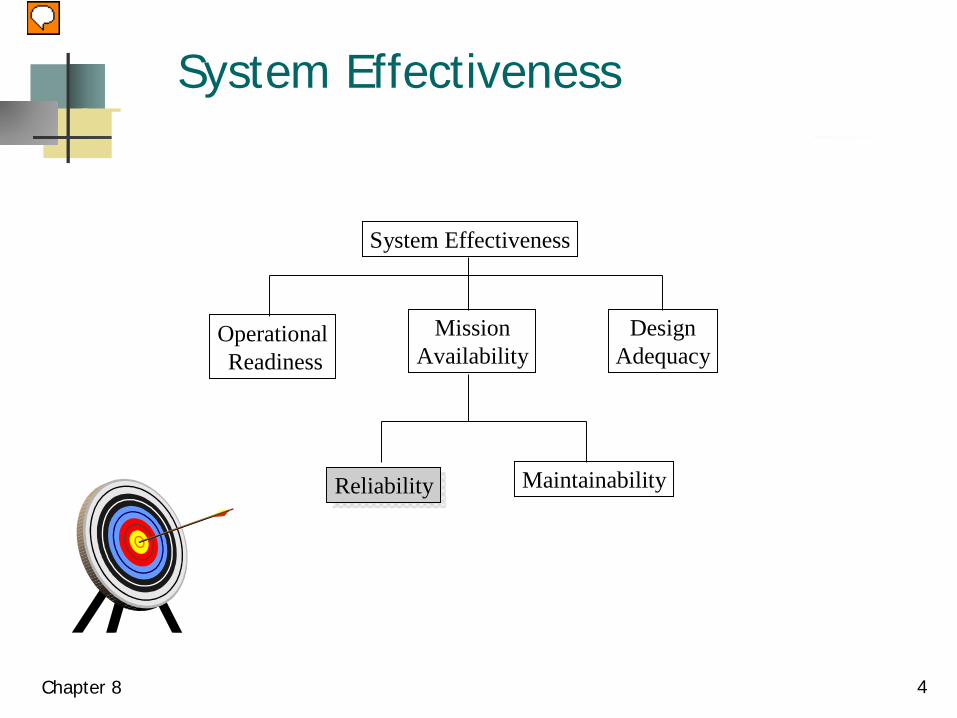
System Effectiveness
OperationalReadiness
MissionAvailability
DesignAdequacy
ReliabilityReliability Maintainability

Life Cycle Cost Categories
Chapter 8 5
Acquisition Costs Operations and Support Costs Phase-out
Research and Development
Management
Engineering
Design and Prototyping
Engineering Design
Fabrication
Testing & evaluation
Production
Manufacturing
Plant facilities & overhead
Marketing & Distribution
Operations
Facilities
Operators
Consumables (energy & fuel)
Unavailable time or downtime
Support
Repair resources
Supply resources
repairables
expendables
tools, test & spt equip
Failure Costs
Training
Technical Data
Salvage value
Disposal Costs
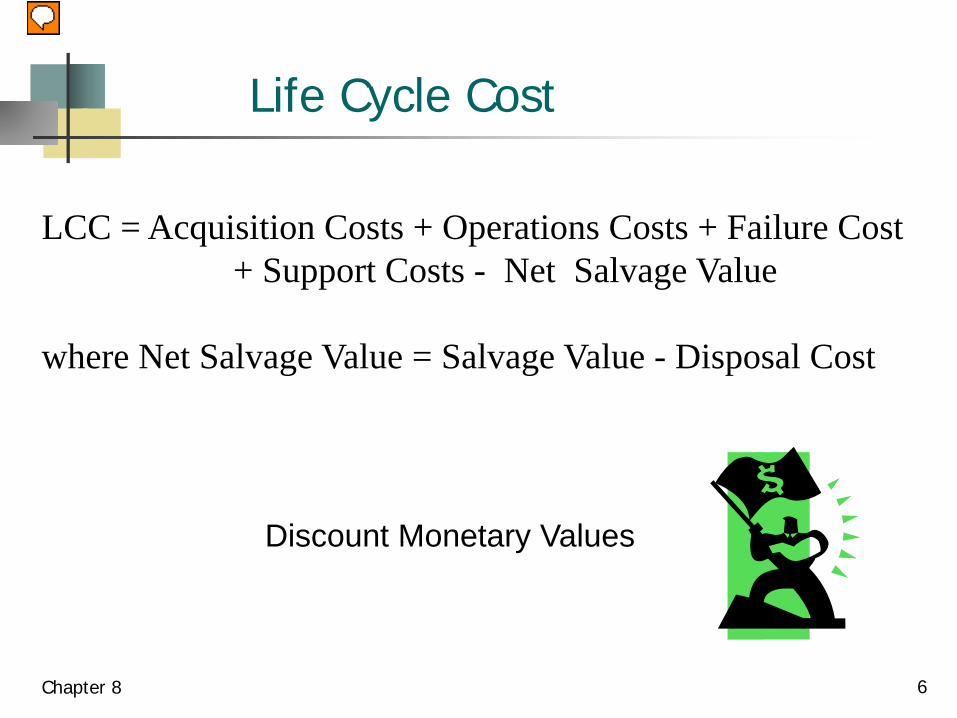
Life Cycle Cost
Chapter 8 6
LCC = Acquisition Costs + Operations Costs + Failure Cost + Support Costs - Net Salvage Value
where Net Salvage Value = Salvage Value - Disposal Cost
Discount Monetary Values
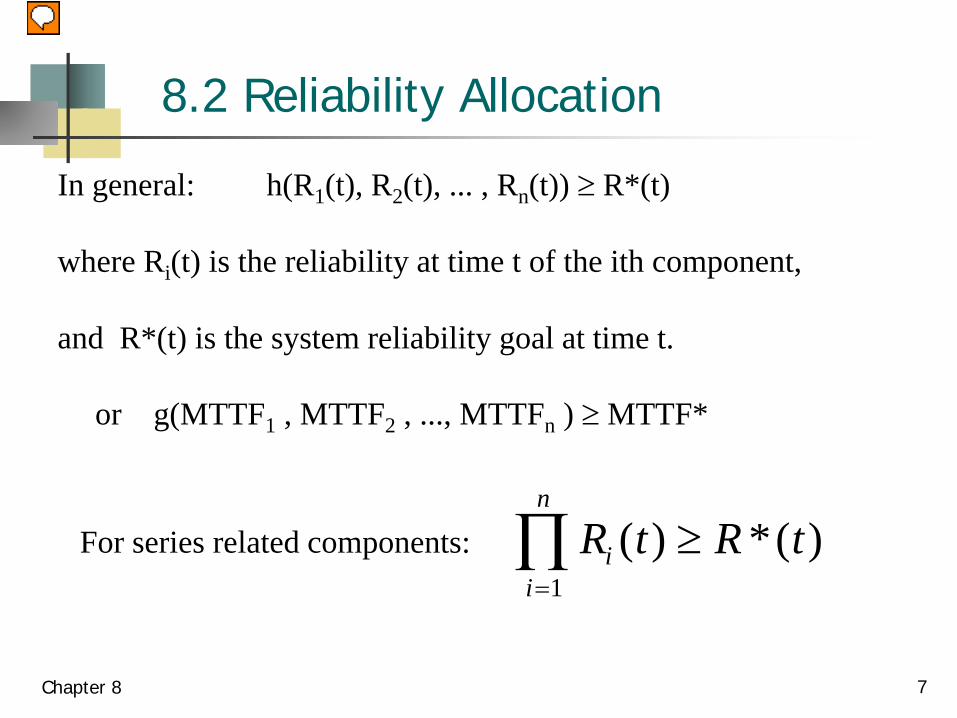
8.2 Reliability Allocation
Chapter 8 7
In general: h(R1(t), R2(t), ... , Rn(t)) ≥ R*(t)
where Ri(t) is the reliability at time t of the ith component,
and R*(t) is the system reliability goal at time t.
or g(MTTF1 , MTTF2 , ..., MTTFn ) ≥ MTTF*
For series related components: R t R tii
n
( ) *( )≥=∏
1
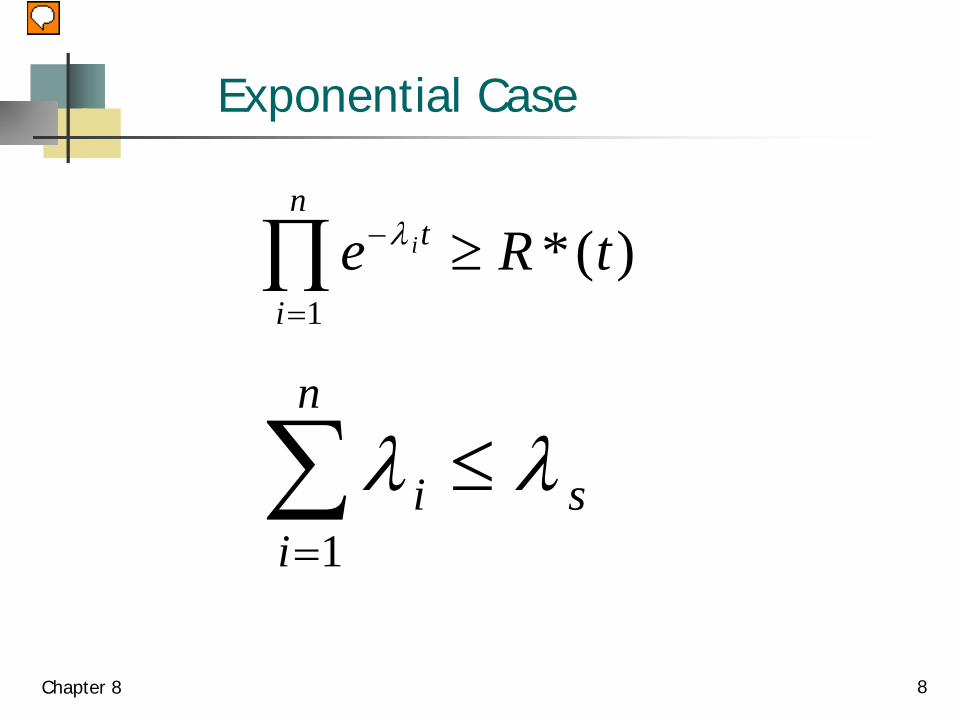
Exponential Case
Chapter 8 8
e R tit
i
n−
=∏ ≥λ
1
*( )
λ λii
n
s=∑ ≤
1

ARINC Method
Chapter 8 9
Assume components are in series, are independent, andhave constant failure rates.
*
1* *
* *
1 1 1 1
1 1
new
1,2,..., ; since
new
i i
ii n
ii
n n n ni
i i in ni i i i
i ii i
w
w i n
w
λ λλ
λ
λ λ λλ λ λ λλ λ
=
= = = =
= =
=
= =
= = = =
∑
∑ ∑ ∑ ∑∑ ∑
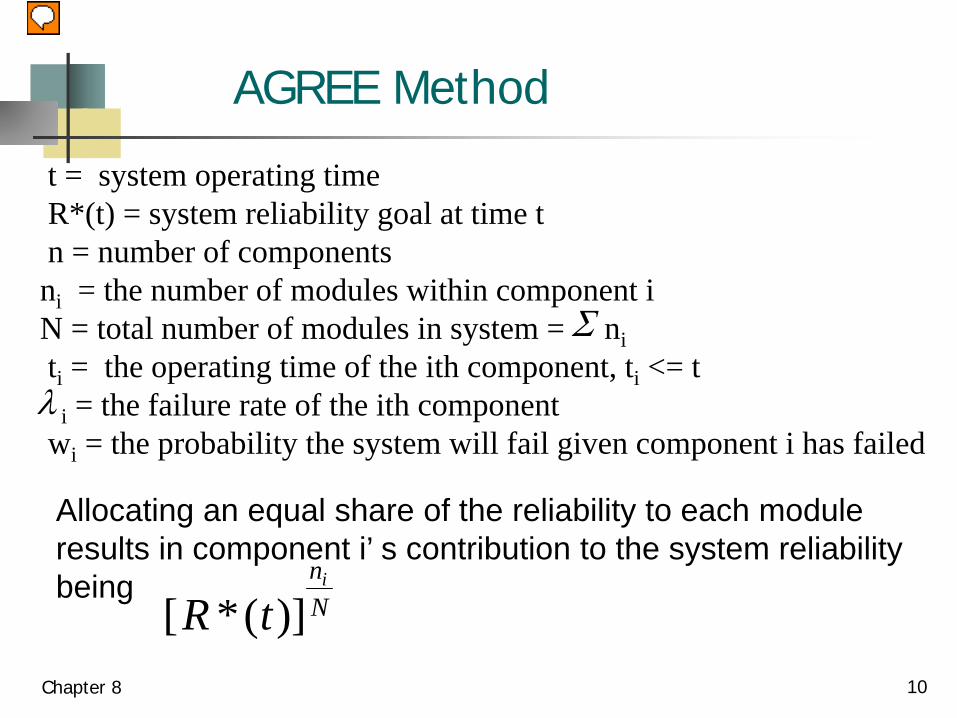
AGREE Method
Chapter 8 10
t = system operating timeR*(t) = system reliability goal at time tn = number of componentsni = the number of modules within component iN = total number of modules in system = niti = the operating time of the ith component, ti <= t
i = the failure rate of the ith componentwi = the probability the system will fail given component i has failed λ
[ *( )]R tnN
i
Allocating an equal share of the reliability to each moduleresults in component i’ s contribution to the system reliabilitybeing
Σ

AGREE Method
Chapter 8 11
w eiti i( )1− −λ [ *( )]R t
nN
i
= 1 -
λ ii
n N
itR t
w
i
= − −−1 1 1ln( *( ) )
/
e R ti it
i
n−
=∏ ≤λ
1
*( )note that

AGREE Method - Example
Chapter 8 12
Component Import Index (wi) Oper hrs (ti) Nbr of modules -niReceiver .8 1000 25Antenna 1 1000 15Transmitter .7 500 23Power Supply 1 1000 70
The total module count is 133. If the system reliability goal is .99,then the reliability to be allocated to the ith component is .99ni /133 .

AGREE Method - Example
Chapter 8 13
Component Failure Rate MTTF Reliability System Rel
Receiver 2.362 x 10⁻⁶ 423,369 .99764 .99811Antenna 1.1335 x 10⁻⁶ 882,227 .99887 .99887Transmitter 4.9676 x 10⁻⁶ 201,303 .99752 .99826Power Supply 5.2896 x 10⁻⁶ 189,048 .99472 .99472System 1.3753 x 10⁻⁵ 72,713 .98879 .99
From the above table, the probabilityof a component failure is 1-.98879 while the probability of a system failure is 1-.99.
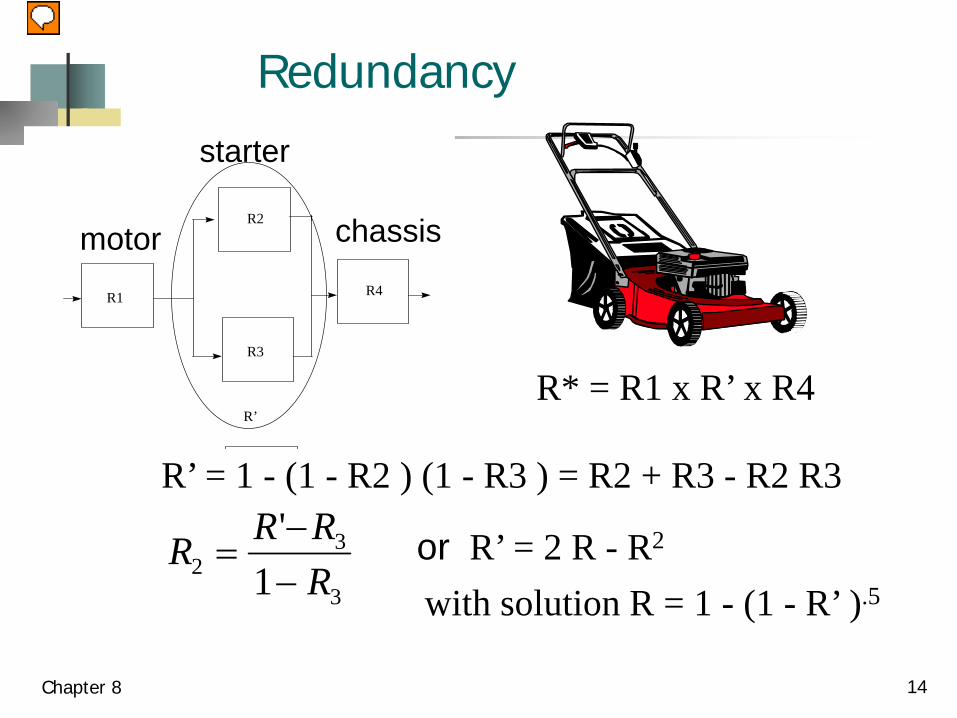
Redundancy
Chapter 8 14
R1
R2
R3
R4
R’R* = R1 x R’ x R4
R’ = 1 - (1 - R2 ) (1 - R3 ) = R2 + R3 - R2 R3
R R RR2
3
31=
−−' or R’ = 2 R - R2
with solution R = 1 - (1 - R’ ).5
starter
motor chassis

8.3 Design Methods
Parts and Material SelectionDeratingStress-Strength AnalysisComplexityChoice of TechnologyRedundancy
Chapter 8 15

Material Selection
Chapter 8 16
Structureatomic bondingcrystal structuredefect structuremicrostructure
MATERIALSSCIENCE
MaterialPropertiesyield strengthhardnessfatigue lifecreep
MATERIALSENGINEERING
ManufacturingProcesscastingmachining (cutting)joiningheat treatmentassembly
ServicePerformanceStressescorrosiontemperatureradiationvibration
MANUFACTURINGENGINEERING
R(t)
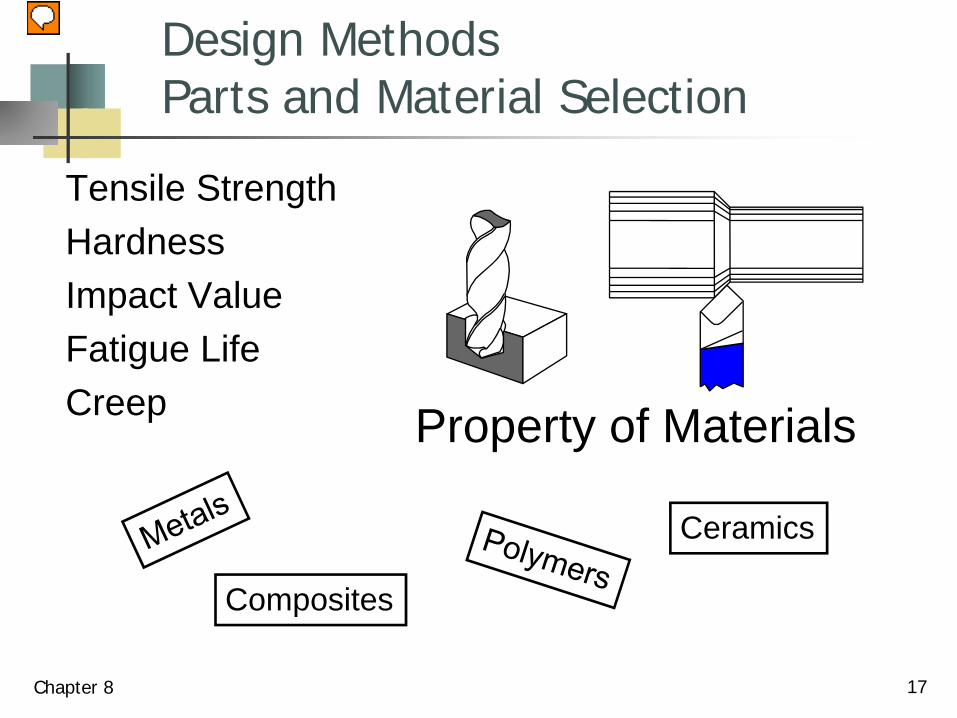
Design MethodsParts and Material Selection
Tensile StrengthHardnessImpact ValueFatigue LifeCreep
Chapter 8 17
Property of Materials
Ceramics
Composites

Material Selection
Metals Ceramics Polymers
strong strong weak
stiff stiff compliant
tough brittle durable
electricallyconducting
electricallyinsulating
electricallyinsulating
high thermalconductivity
low thermalconductivity
temperaturesensitive
Chapter 8 18

Tensile strength Tensile strength measures the force required to pull something
such as rope, wire, or a structural beam to the point where it breaks.Specifically, the maximum amount of stress that it can be subjected
to before failureYield strength - The stress a material can withstand without
permanent deformation. Ultimate strength - The maximum stress a material can withstand. Breaking strength - The stress coordinate on the stress-strain curve at
the point of rupture. Compressive strength is the capacity of a material to withstand
axially directed pushing forces. When the limit of compressive strength is reached, materials are crushed. Concrete can be made to have high compressive strength.
Chapter 8 19

Parts and Material SelectionTensile Strength
Chapter 8 20
strain (in/in)
stress(lbs/in2)
ultimate strength
yield strengthX
breaking strength
slope = E
Hooke’s Law: Stress = E x Strain
modulus of elasticity (lbs/in2)

Another Stress-Strain Curve
Chapter 8 21
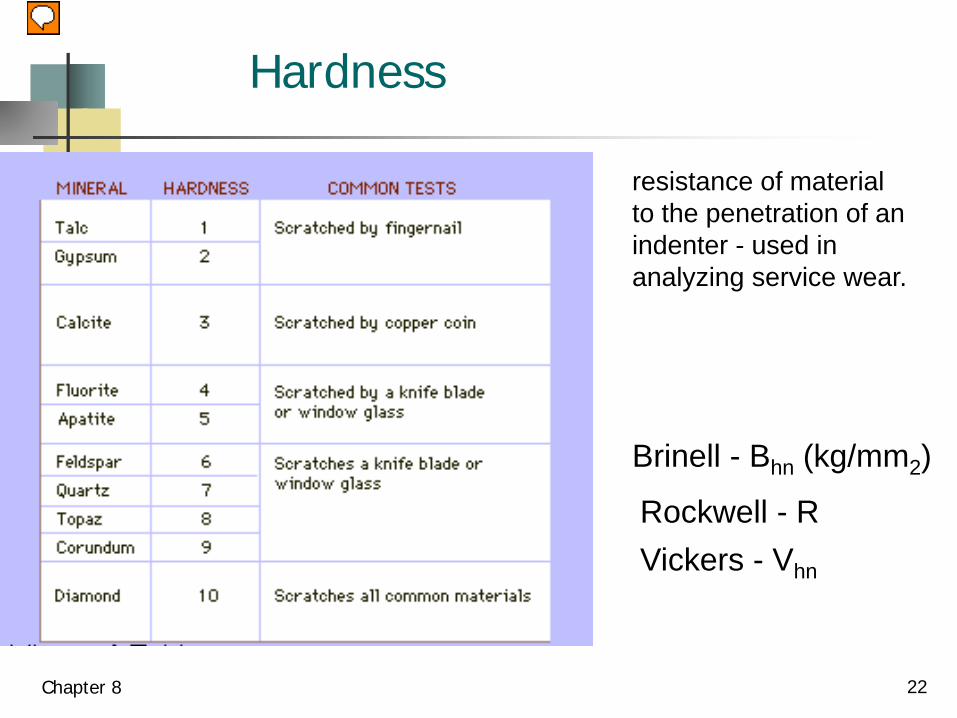
Hardness
Chapter 8 22
Brinell - Bhn (kg/mm2)
Rockwell - RVickers - Vhn
resistance of materialto the penetration of anindenter - used in analyzing service wear.
Fatigue
• The progressive, localized, and permanent structural damage that occurs when a material is subjected to cyclic or fluctuating strains at nominal stresses that have maximum values less than the static yield strength of the material.
• The resulting stress may be below the ultimate tensile stress, or even the yield stress of the material, yet still cause catastrophic failure.
• In high-cycle fatigue situations, materials performance is commonly characterized by an S-N curve. This is a graph of the magnitude of a cyclical stress (S) against the cycles to failure (N).
Chapter 8 23

Parts and Material SelectionFatigue Life
Chapter 8 24
nbr of cycles - N
stress - S(lbs/in2)
endurancelimit
steel
S-N Curve: N = c S-m where c, m > 0
Creep
• The tendency of a material to move or to deform permanently to relieve stresses.
• Material deformation occurs as a result of long term exposure to levels of stress that are below the yield or ultimate strength of the material.
• Creep is more severe in materials that are subjected to heat for long periods and near melting point.
• The rate of damage is a function of the material properties and the exposure time, exposure temperature and the applied load (stress).
Chapter 8 25

Parts and Material Selection - Creep
Chapter 8 26
strain
time
FailureFailure
moderate temperature
high temperature
ε ε β= +01 31( )/t e k t

Failure modes
gross yieldingbucklingcreepbrittle fractureLow cycle fatiguehigh cycle fatiguecorrosionwearthermal fatigue
yield strengthcompressive strengthcreep rateimpact energyductilityfatigue propertieselectrochemical potentialhardnesscoefficient of expansion
Chapter 8 27
Failure Mode Material Property

Material Failure Mechanisms
Overstress Failuresbrittle fractureductile fractureyieldbucklinglarge elastic deformationthermal breakdown
Wear-out Failurescorrosiondendritic growth (electrolytic process)
interdiffusionfatigue crack propagationdiffusion (molecular migration)
radiationcreepadhesive wear
Chapter 8 28
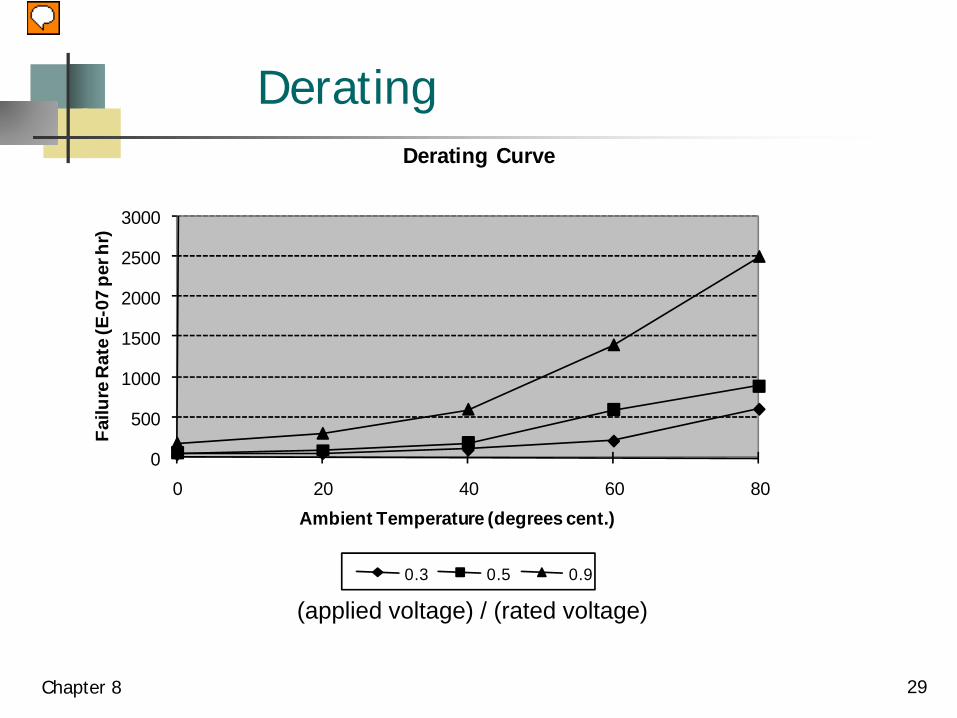
Derating
Chapter 8 29
0
500
1000
1500
2000
2500
3000
0 20 40 60 80
Failu
re R
ate
(E-0
7 pe
r hr)
Ambient Temperature (degrees cent.)
Derating Curve
0.3 0.5 0.9
(applied voltage) / (rated voltage)
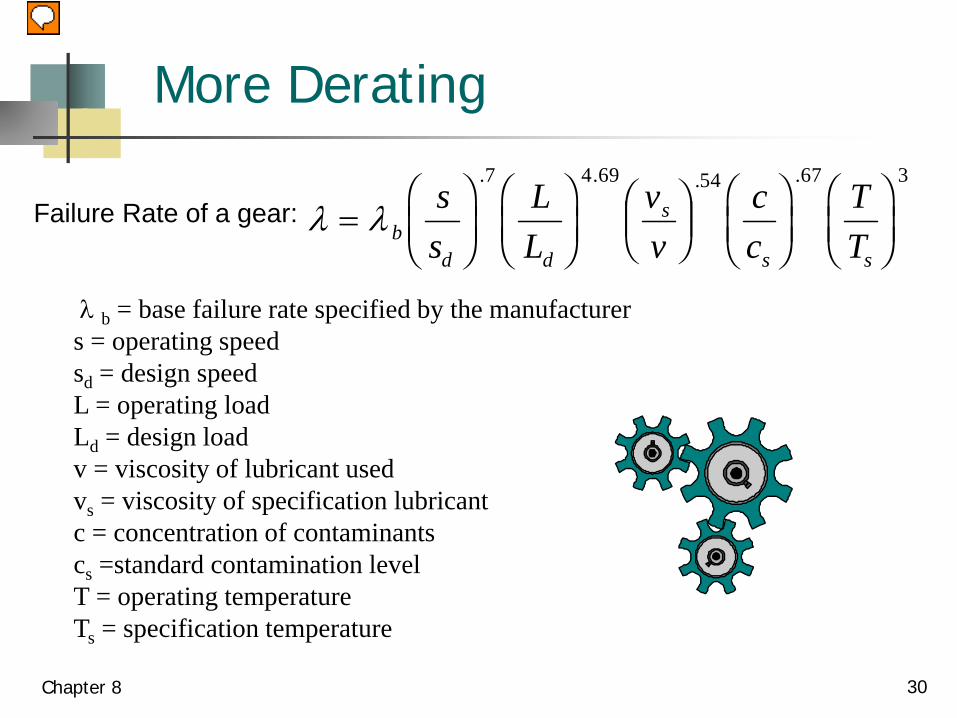
More Derating
Chapter 8 30
λ λ=FHGIKJFHGIKJFHGIKJFHGIKJFHGIKJb
d d
s
s s
ss
LL
vv
cc
TT
. . . .7 4 69 54 67 3
Failure Rate of a gear:
λ b = base failure rate specified by the manufacturers = operating speedsd = design speedL = operating loadLd = design loadv = viscosity of lubricant usedvs = viscosity of specification lubricantc = concentration of contaminantscs =standard contamination levelT = operating temperatureTs = specification temperature

Stress-Strength Analysis
• Concerned when abnormal loads are possible• Probabilistic compare the magnitude of the stress with the
design strength.• Use physical models• Major categories of stress
• electrical• thermal• mechanical• chemical
• Two design approaches• select parts with sufficient strength against max load• protect part against excessive stresses
Chapter 8 31
Looking for strength tocope with the stress!

Stress - Strength Analysis
Chapter 8 32
2 2
ln y
xy x
mSFR w here SFms s
⎛ ⎞⎜ ⎟= Φ =⎜ ⎟+⎝ ⎠
0
0.1
0.2
0.3
0.4
0.5
0.6
1 2 3 4 5 6 7 8 9 10
Probability of Failure
Safety Factor
Lognormal Distribution
denom= 0.8 denom= 1 denom= 1.2
Safety Factor = Y/X
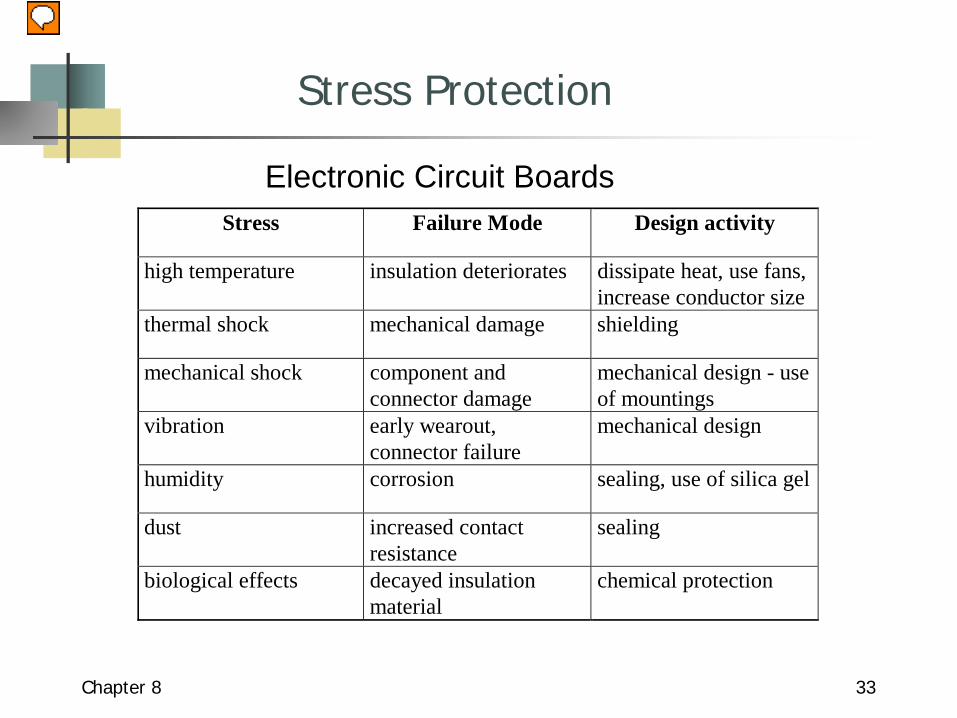
Stress Protection
Stress Failure Mode Design activity
high temperature insulation deteriorates dissipate heat, use fans,increase conductor size
thermal shock mechanical damage shielding
mechanical shock component andconnector damage
mechanical design - useof mountings
vibration early wearout,connector failure
mechanical design
humidity corrosion sealing, use of silica gel
dust increased contactresistance
sealing
biological effects decayed insulationmaterial
chemical protection
Chapter 8 33
Electronic Circuit Boards
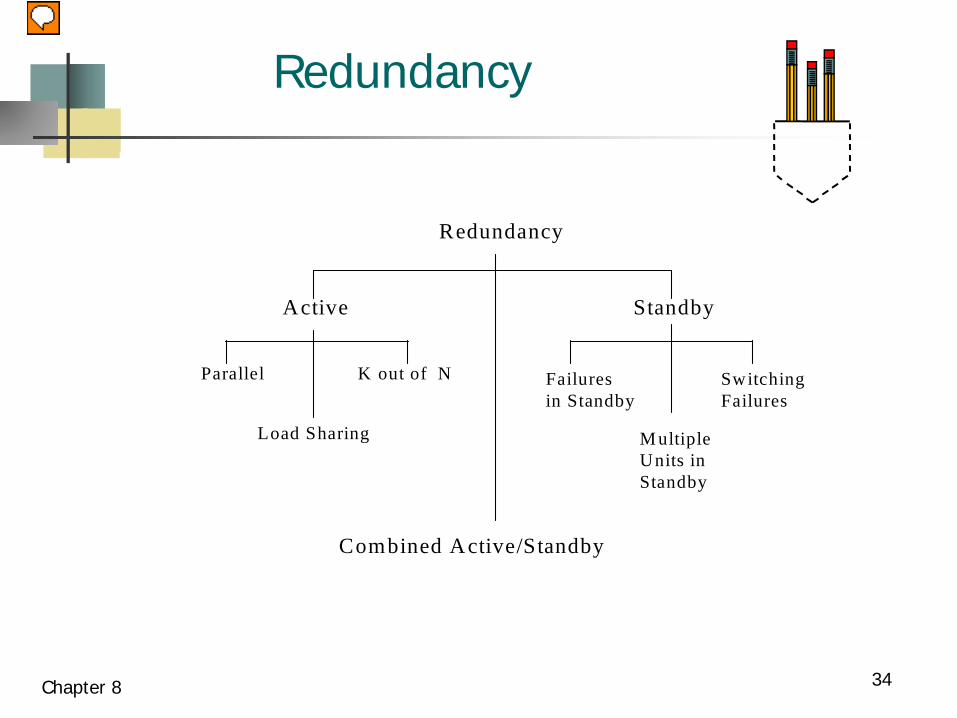
Redundancy
Active Standby
Parallel K out of N
Load Sharing
Failuresin Standby
SwitchingFailures
M ultipleUnits inStandby
Combined Active/Standby
Redundancy
Chapter 8 34

Redundancy
AdvantagesQuickest way to improve reliabilityMay be cheapest vs. cost of redesignMay be the only solution if specified reliability is beyond the state of the art
Disadvantages⌦ Sensors and switching
may increase cost and reduce reliability
⌦ May exceed size, weight or power constraints
⌦ Increases maintainability requirements
Chapter 8 35
Conclusion
Chapter 8 36
As an engineer, I can assure you that these design methods work.


![Shipyard and Cadmium (59.1) [Correc y Enm]](https://img.pdfslide.us/doc/110x75/5695cf171a28ab9b028c8aa2/shipyard-and-cadmium-591-correc-y-enm.jpg)