Embed Size (px)
DESCRIPTION
Chapter 8. Human Capital: Education and Health in Economic Development. 8.1 The Central Roles of Education and Health. Health and education are important objectives of development, as reflected in Amartya Sen’s capability approach, and in the core values of economic development - PowerPoint PPT Presentation
Citation preview

Copyright © 2012 Pearson Addison-Wesley. All rights reserved.
Chapter 8
Human Capital: Education and Health in Economic Development

Copyright © 2012 Pearson Addison-Wesley. All rights reserved. 8-2
8.1 The Central Roles of Education and Health
• Health and education are important objectives of development, as reflected in Amartya Sen’s capability approach, and in the core values of economic development
• Health and education are also important components of growth and development – inputs in the aggregate production function

Copyright © 2012 Pearson Addison-Wesley. All rights reserved. 8-3
Education and Health as Joint Investments for Development
• These are investments in the same individual• Greater health capital may improve the returns to
investments in education– Health is a factor in school attendance– Healthier students learn more effectively– A longer life raises the rate of return to education– Healthier people have lower depreciation of education
capital• Greater education capital may improve the returns to
investments in health– Public health programs need knowledge learned in school– Basic hygiene and sanitation may be taught in school– Education needed in training of health personnel

Copyright © 2012 Pearson Addison-Wesley. All rights reserved. 8-4
Improving Health and Education: Why Increasing Incomes Is Not Sufficient
• Increases in income often do not lead to substantial increases in investment in children’s education and health
• But better educated mothers tend to have healthier children at any income level
• Significant market failures in education and health require policy action

Copyright © 2012 Pearson Addison-Wesley. All rights reserved. 8-5
8.2 Investing in Education and Health: The Human Capital Approach
• Initial investments in health or education lead to a stream of higher future income
• The present discounted value of this stream of future income is compared to the costs of the investment
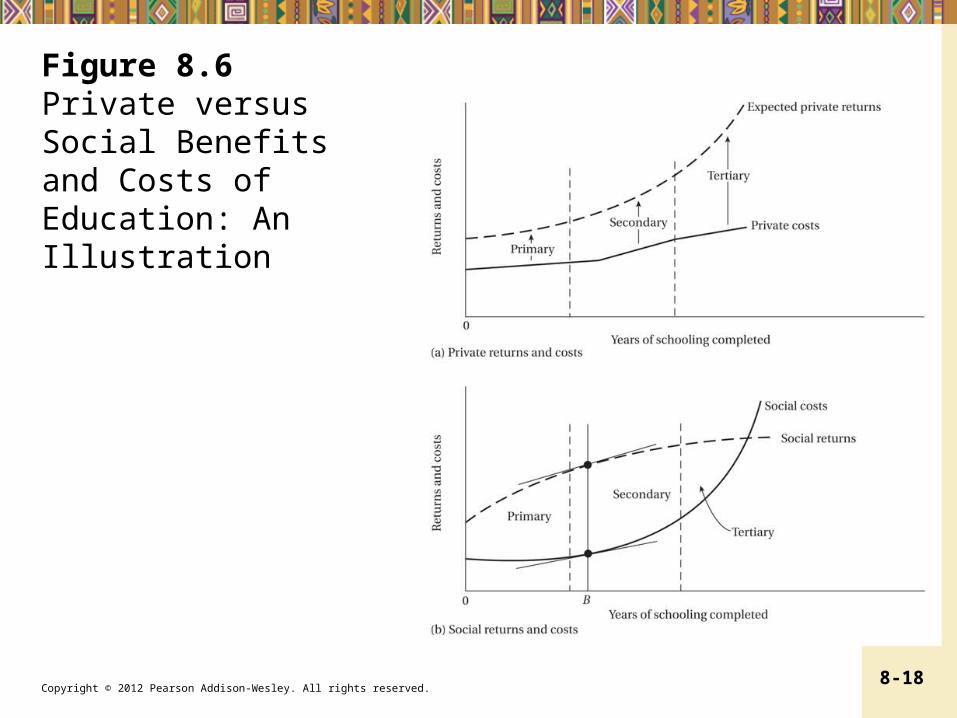
• Private returns to education are high, and may be higher than social returns, especially at higher educational levels

Copyright © 2012 Pearson Addison-Wesley. All rights reserved. 8-6
Figure 8.1 Age-Earnings Profiles by Level of Education: Venezuela

Copyright © 2012 Pearson Addison-Wesley. All rights reserved. 8-7
Figure 8.2 Financial Trade-Offs in the Decision to Continue in School

Copyright © 2012 Pearson Addison-Wesley. All rights reserved. 8-8
Table 8.1 Sample Rates of Return to Investment in Education by Level of Education, Country, Type, and Region

Copyright © 2012 Pearson Addison-Wesley. All rights reserved. 8-9
8.3 Child Labor
• Child labor is a widespread phenomenon• The problem may be modeled using the
“multiple equilibria” approach• Government intervention may be called for
to move to a ‘better’ equilibrium• Sometimes this shift can be self-enforcing,
so active intervention is only needed at first

Copyright © 2012 Pearson Addison-Wesley. All rights reserved. 8-10
Assumptions of the Child Labor Multiple Equilibria Model
• Luxury Axiom: A household with sufficiently high income would not send its children to work
• Substitution Axiom: Adult and child labor are substitutes (perfect substitutes in this model), in which the quantity of output by a child is a given fraction of that of an adult: QC = γQA, 0 < γ < 1.

Copyright © 2012 Pearson Addison-Wesley. All rights reserved. 8-11
Figure 8.3 Child Labor as a Bad Equilibrium

Copyright © 2012 Pearson Addison-Wesley. All rights reserved. 8-12
Other approaches to child labor policy• Get more children into school (as in Millennium Development
Goals), e.g. new village schools; and enrollment incentives for parents such as in Progresa/ Oportunidades
• Consider child labor an expression of poverty, so emphasize ending poverty generally (a traditional World Bank approach, now modified)
• If child labor is inevitable in the short run, regulate it to prevent abuse and provide support services for working children (UNICEF approach)
• Ban child labor; or if impossible, ban child labor in its most abusive forms (ILO strategy; “Worst Forms of Child Labor Convention”)
• Activist approach: trade sanctions. Concerns: could backfire when children shift to informal sector; and if modern sector growth slows
Copyright © 2012 Pearson Addison-Wesley. All rights reserved. 8-13
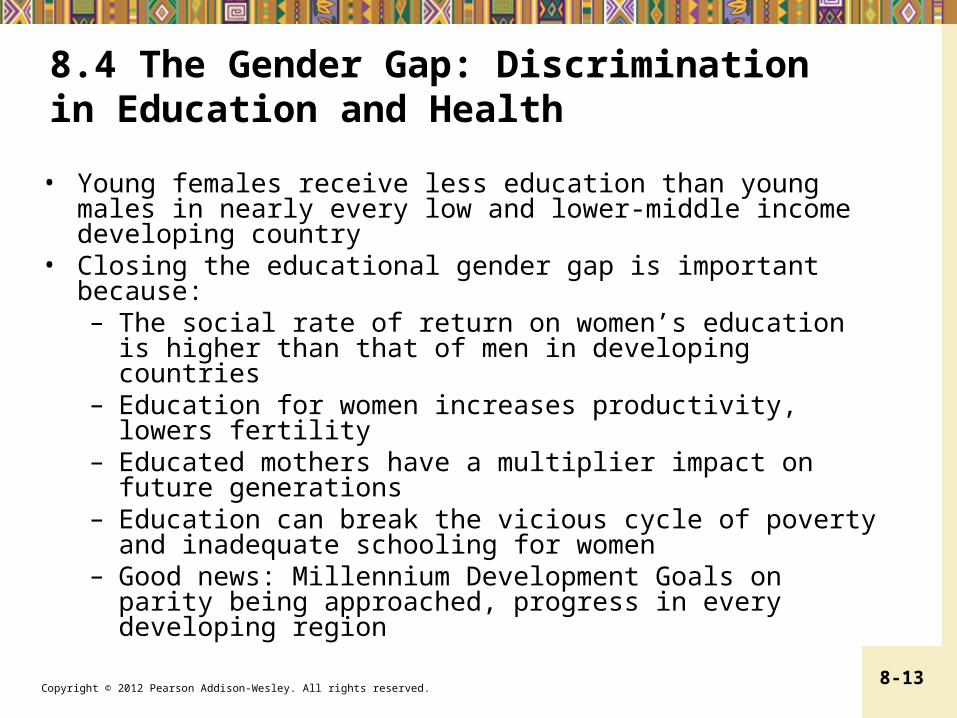
8.4 The Gender Gap: Discrimination in Education and Health
• Young females receive less education than young males in nearly every low and lower-middle income developing country
• Closing the educational gender gap is important because:– The social rate of return on women’s education is higher
than that of men in developing countries– Education for women increases productivity, lowers
fertility– Educated mothers have a multiplier impact on future
generations– Education can break the vicious cycle of poverty and
inadequate schooling for women– Good news: Millennium Development Goals on parity
being approached, progress in every developing region

Copyright © 2012 Pearson Addison-Wesley. All rights reserved. 8-14
Figure 8.4 Youth Literacy Rate, 2008
Copyright © 2012 Pearson Addison-Wesley. All rights reserved. 8-15
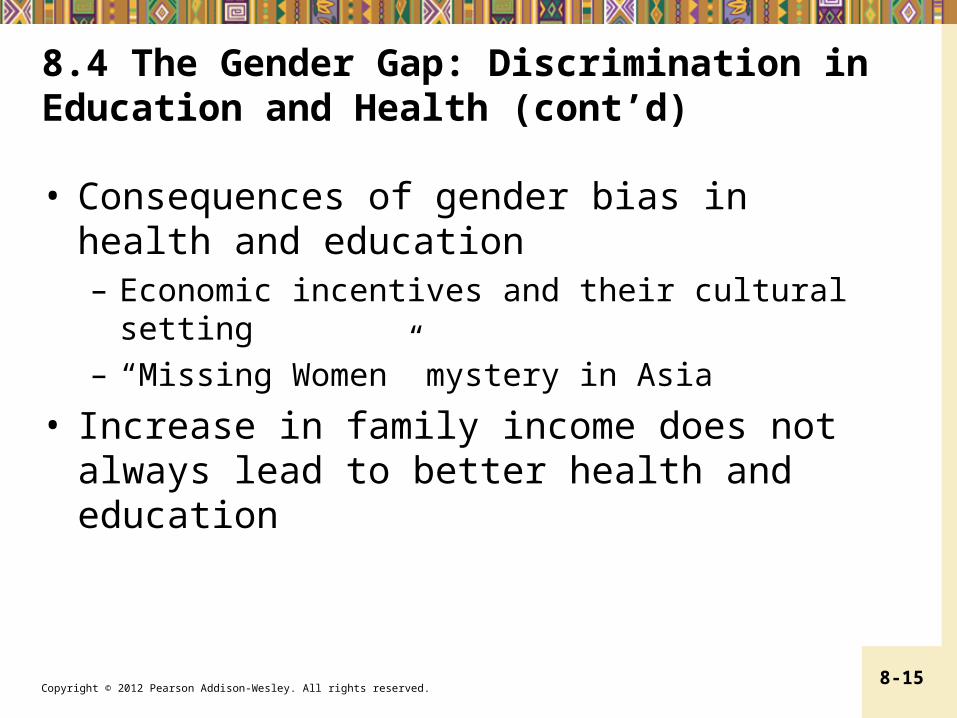
8.4 The Gender Gap: Discrimination in Education and Health (cont’d)
• Consequences of gender bias in health and education– Economic incentives and their cultural setting– “Missing Women” mystery in Asia
• Increase in family income does not always lead to better health and education

Copyright © 2012 Pearson Addison-Wesley. All rights reserved. 8-16
Figure 8.5 Female-Male Ratios in Total Population in Selected Communities

Copyright © 2012 Pearson Addison-Wesley. All rights reserved. 8-17
8.5 Educational Systems and Development
• The Political Economy of Educational Supply and Demand: The Relationship between Employment Opportunities and Educational Demands
• Social versus Private Benefits and Costs
Copyright © 2012 Pearson Addison-Wesley. All rights reserved. 8-18
Figure 8.6 Private versus Social Benefits and Costs of Education: An Illustration

Copyright © 2012 Pearson Addison-Wesley. All rights reserved. 8-19
8.5 Educational Systems and Development
• Distribution of Education– Lorenz curves for the distribution of education
• Education, Inequality, and Poverty

Copyright © 2012 Pearson Addison-Wesley. All rights reserved. 8-20
Figure 8.7 Lorenz Curves for Education in India and South Korea

Copyright © 2012 Pearson Addison-Wesley. All rights reserved. 8-21
Figure 8.8 Gini Coefficients for Education in 85 Countries
Copyright © 2012 Pearson Addison-Wesley. All rights reserved. 8-22
8.5 Educational Systems and Development (cont’d)
• Educational supply and demand: the relationship between employment opportunities and educational demands
• Social versus private benefits and costs• Distribution of education• Education, inequality, and poverty• Education, Internal Migration, and the Brain Drain

Copyright © 2012 Pearson Addison-Wesley. All rights reserved. 8-23
8.6 Health Measurement and Distribution
• World Health Organization (WHO): The key United Nations agency concerned with global health matters.

Copyright © 2012 Pearson Addison-Wesley. All rights reserved. 8-24
Figure 8.9 Life Expectancy in Various World Regions

Copyright © 2012 Pearson Addison-Wesley. All rights reserved. 8-25
Figure 8.10 Under-5 Mortality Rates in Various World Regions

Copyright © 2012 Pearson Addison-Wesley. All rights reserved. 8-26
Figure 8.11 Deaths of Children under Age 5
Copyright © 2012 Pearson Addison-Wesley. All rights reserved. 8-27
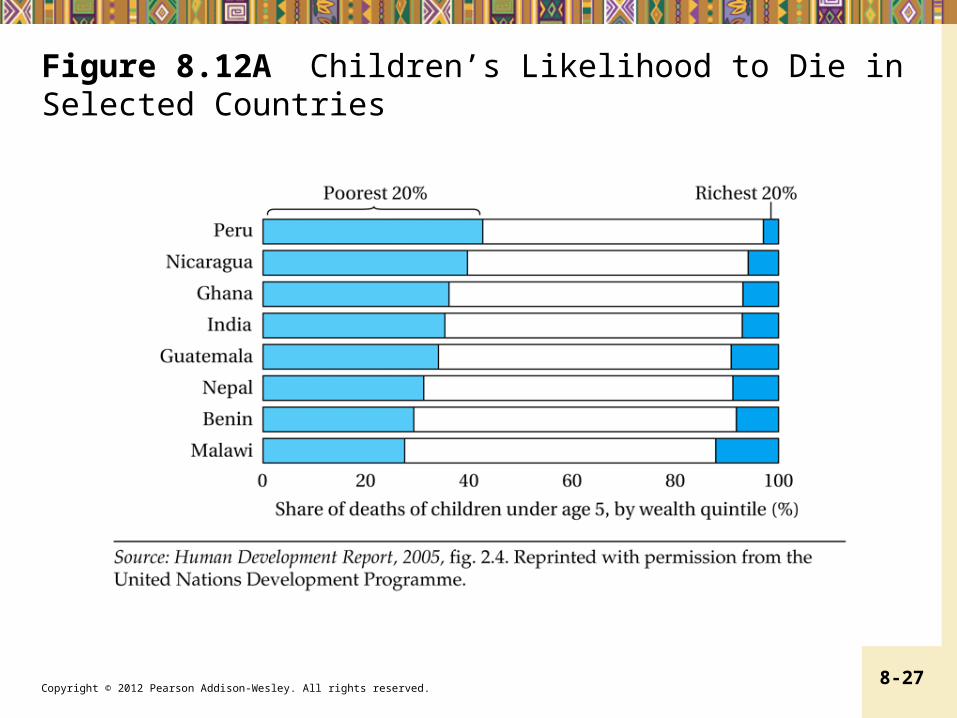
Figure 8.12A Children’s Likelihood to Die in Selected Countries

Copyright © 2012 Pearson Addison-Wesley. All rights reserved. 8-28
Figure 8.12B Proportion of Under-Five Children Who Are Underweight, by Household Wealth, around 2008

Copyright © 2012 Pearson Addison-Wesley. All rights reserved. 8-29
8.7 Disease Burden
• HIV/AIDS• Malaria• Parasitic Worms and Other “Neglected
Tropical Diseases”

Copyright © 2012 Pearson Addison-Wesley. All rights reserved. 8-30
Figure 8.13 Proportion of Children under 5 Who Are Underweight, 1990 and 2005

Copyright © 2012 Pearson Addison-Wesley. All rights reserved. 8-31
Table 8.2 Regional HIV and AIDS Statistics, 2009

Copyright © 2012 Pearson Addison-Wesley. All rights reserved. 8-32
Table 8.3 The Major Neglected Tropical Diseases, Ranked by Prevalence

Copyright © 2012 Pearson Addison-Wesley. All rights reserved. 8-33
8.8 Health, Productivity, and Policy
• Productivity– Is there a connection?
• Health Systems Policy– Great variability in the performance of health
systems at each income level

Copyright © 2012 Pearson Addison-Wesley. All rights reserved. 8-34
Figure 8.14 Wages, Education, and Height of Males in Brazil and the United States

Copyright © 2012 Pearson Addison-Wesley. All rights reserved. 8-35
Figure 8.15 GNI Per Capita and Life Expectancy at Birth, 2002

Copyright © 2012 Pearson Addison-Wesley. All rights reserved. 8-36
Concepts for Review
• Acquired immunodeficiency syndrome (AIDS)
• Basic education• Brain drain• Conditional cash transfer
(CCT) programs• Derived demand• Discount rate • Educational certification• Educational gender gap
• Health system • Human capital• Human immunodeficiency
virus (HIV)• Literacy• Neglected tropical diseases • Private benefits of
education
Copyright © 2012 Pearson Addison-Wesley. All rights reserved. 8-37
Concepts for Review (cont’d)
• Private costs of education• Social benefits of education• Social costs of education• World Health Organization
(WHO)