Embed Size (px)
Citation preview

132
Chapter 7
The Virtual Laboratory: Enabling Drug Design on the Grid
This chapter presents the design and development of a virtual laboratory environment that enablesmolecular modelling for drug design on geographically distributed data and computational resources. Itleverages existing Grid technologies such as the Nimrod-G parameter specification language to transformthe existing molecular docking application into a parameter sweep application and the Nimrod-G broker forscheduling jobs on distributed resources. It provides additional tools for enabling and providing distributedaccess to ligand records/molecules in the chemical databases (CDB) located remotely. The results ofmolecular docking application scheduling on the World-Wide Grid (WWG) resources are being presentedto demonstrate the ease of use and the effectiveness of Nimrod-G and virtual laboratory tools for Gridcomputing.
7.1 IntroductionComputational Grids serve as a scalable computing platform for executing large-scale computational anddata intensive applications in parallel through the aggregation of geographically distributed computationalresources. They enable exploration of large problems in science, engineering, and business with huge datasets, which is essential for creating new insights into the problem. Molecular modelling for drug design isone of the scientific applications that can benefit from the availability of such a large computationalcapability.
Drug Discovery Process
Drug discovery is an extended process that can take as many as 15 years from the first compound synthesisin the laboratory until the therapeutic agent, or drug, is brought to market [25]. Reducing the researchtimeline in the discovery stage is a key priority for pharmaceutical companies worldwide. Many suchcompanies are trying to achieve this goal through the application and integration of advanced technologiessuch as computational biology, chemistry, computer graphics, and high performance computing (HPC).Molecular modelling has emerged as a popular methodology for drug design—it can combinecomputational chemistry and computer graphics. Molecular modelling can be implemented as a master-worker parallel application, which can take advantage of HPC technologies such as clusters [93] and Gridsfor large-scale data exploration.
Drug design using molecular modelling techniques involve screening a very large number (of the orderof a million) of ligand4 records or molecules of compounds in a chemical database (CDB) to identify thosethat are potential drugs. This process is called molecular docking. It helps scientists in predicting how smallmolecules, such as drug candidates, bind to an enzyme or a protein receptor of known 3D structure (seeFigure 7.1). Docking each molecule in the target chemical database is both a compute and data intensivetask. It is our goal to use Grid technologies to provide cheap and efficient solutions for the execution ofmolecular docking tasks on large-scale, wide-area parallel and distributed systems.
While performing docking, information about the molecule must be extracted from one of the manylarge chemical databases. As each chemical database requires storage space in the order of hundreds of
4 An ion, a molecule, or a molecular group that binds to another chemical entity to form a larger complex.

133
megabytes to terabytes, it is not feasible to transfer the chemical database to all resources in the Grid. Also,each docking job only needs a ligand or module record, not the whole database. Therefore, access to achemical database must be provided as a network service (see Figure 7.2). The chemical databases need tobe selectively replicated on a few nodes to avoid any bottleneck, which might happen due to providingaccess to the database from a single source. Intelligent mechanisms (e.g., CDB broker) need to besupported for selecting optimal sources for CDB services depending on the location of resources selectedfor processing docking jobs.
Protein
Molecules
Protein
Molecules
Figure 7.1: X-ray crystal structure of a target protein receptor and small molecules to be docked.
Fundamentally, drug design is a computational and data challenge problem since it involves screeningmillions of compounds in chemical databases. Screening each compound, depending on structuralcomplexity, can take from a few minutes to hours on a standard PC, which means screening all compoundsin a single database can take years! For example, we are looking into a drug design problem that involvesscreening 180,000 compounds. Each job screening a compound is expected to take up to 3 hours ofexecution time on a desktop computer (e.g., Pentium-based Linux/Windows PC). That means, if we aim toscreen all these compounds on a single PC, it can take up to 540000 hours, which is roughly equivalent to61 years! If we use a typical cluster-based supercomputer with 64 nodes, we can solve this problem in oneyear. The problem can be solved with a large scale Grid of hundreds of supercomputers within a day. If weuse a massive network of peer-to-peer style Grid computing infrastructure such as SETI@Home [141], thedrug discovery problem could be solved within a few hours.
The rest of this chapter is organized as follows. A high-level operational model for molecular modellingon the Grid is presented in Section 7.2. A layered architecture for building the Virtual Laboratoryenvironment is discussed in Section 7.3. The virtual laboratory implementation leverages the existing Gridtechnologies and supports new tools that are essential for Grid-enabling the chemical database and thedocking application on distributed resources. Formulation of molecular docking as a parameter sweepapplication is presented in Section 7.4. The results of two experiments on scheduling molecular dockingjobs for processing on the WWG (World Wide Grid) [111] testbed resources are presented in Section 7.5.The final section summarizes the chapter along with suggestions for future works.
7.2 Operational ModelThe Virtual Laboratory tools transform the existing molecular modelling application (without the need formaking any changes to it) into a parameter sweep application for executing jobs docking molecules in theCDBs in parallel on distributed resources. The parameterized application contains multiple independentjobs, each screening different compounds to identify their drug potential. These jobs are computationally

134
intensive in nature and only a small proportion of the execution time is spent on data communication (e.g.,fetching molecular information on demand from remote databases). Applications expressed with this task-farming computational model have high computation to communication ratio. Hence, they can tolerate highnetwork latency, which makes them suitable for executing in parallel on Internet-wide distributedresources.
A high-level operation model of docking molecules on the Grid is shown in Figure 7.2. The drugdesigner formulates the molecular docking problem, submits the application to the Grid resource broker(e.g., Nimrod-G [100]) along with performance and optimisation requirements—“screen 2000 moleculeswithin 30 minutes and the available budget for processing is $10”. The broker discovers resources,establishes their cost and capability, and then prepares a schedule to map docking jobs to resources. Let ussay, it identified a GSP (Grid Service Provider), say GSP2, and assigned a job of screening a molecule 5 toit. A job has a task specification that specifies a list of operations to be performed. To process a job onGSP2, the broker dispatcher deploys its Agent on resource GSP2. The agent executes a list of commandsspecified in the job’s task specification. A typical task specification contains necessary commands to copyexecutables and input files from the user machine, substitution of parameters declared in the input file,execution of the program, and finally copying results back to the user. It can also contain special commandsfor accessing the input data from the remote database. For example, a docking task can contain a specialcommand (e.g., an instruction to fetch molecule record from the CDB) to make a request to the data broker(e.g., CDB broker) for a molecule record. The data broker looks at the replica catalogue for a list of sitesproviding CDB services, checks the status of those sites, and selects a suitable site (e.g., a node with fastnetwork connectivity) and recommends the same. The molecule fetch command can then request the CDBservice provider for a molecule record and write the molecule structure to a file that acts as an input to thedocking program. After executing the docking program, the agent executes commands related to copyingdocking results to the user home node.
Nim rod/ GCom putat ional
Grid Broker
Data ReplicaCatalogueCDB Broker
Algorithm1
AlgorithmN
. . .
CDBService
“Screenm ol.5please?”
GSP1 GSP2 GSP4GSP3(Grid Service Provider)
GSPm
CDBService
GSPn
1
“advise CDBsource?
2“select ion &advise: useGSP4 !”
5Grid I nfo.
Serv ice
3
“I s GSP4healthy?”
4
“m ol.5 please?”6
“CDB replicasplease?”
“Screen 2K moleculesin 30min. for $10”
7
“process& sendresults”
Figure 7.2: Resource brokering architecture for screening molecules on distributed resources.
7.3 Architecture – The Software StackThe Virtual Laboratory builds on the existing Grid technologies and tools for performing data intensivecomputing on distributed resources. It provides new tools for managing and accessing remote chemicaldatabases as a network service. There are many scientific and commercial applications (e.g., molecularmodelling, high-energy physics events processing, and financial investment risk-analysis) that explore arange of scenarios. Instead of explicitly developing them as parallel applications using interfaces such as

135
MPI, they can be composed as parameter sweep applications using tools such as Nimrod [21]. Suchapplication jobs can be executed in parallel on distributed resources using the Nimrod-G resource broker(see Figure 7.2). A layered architecture and the software stack essential for performing molecularmodelling on distributed resources is depicted in Figure 7.3. The components of the Virtual Laboratorysoftware stack are:
• The DOCK software for Molecular Modelling [11].• The Nimrod Parameter Modelling Tools [135] for enabling DOCK as a parameter sweep
application.• The Nimrod-G Grid Resource Broker [100] for scheduling DOCK jobs on the Grid.• Chemical Database (CDB) Management and Intelligent Access Tools:
o CDB database lookup/Index table generation.o CDB and associated index-table replication.o CDB replica catalogue for CDB resource discovery.o CDB servers for providing CDB serviceso CDB broker for selecting a suitable CDB service (Replica Selection).o CDB clients for fetching molecular records (Data Movement).
• The GrACE software for resource trading toolkit [99].• The Globus middleware for secure and uniform access to distributed resources [49].
Globus [security, information, job management] and GRACE
[Distributed computers and databases with different Arch, OS, and local resource management systems]
Nimrod-G and CDB Data Broker
[task farming engine, scheduler, dispatcher, agents, CDB (chemical database) server]
Nimrod and Virtual Lab Tools
[parametric programming language, GUI tools, and CDB indexer]
Nimrod and Virtual Lab Tools
[parametric programming language, GUI tools, and CDB indexer]
Molecular Modelling for Drug DesignMolecular Modelling for Drug Design
FABRIC
APPLICATIONS
COREMIDDLEWARE
USER LEVELMIDDLEWARE
PROGRAMMINGTOOLS
PDBPDB
CDBCDB
Worldwide Grid
Figure 7.3: Layered architecture of Virtual Laboratory for drug design.
The Grid resources (e.g., multiprocessors or clusters) at each location are generally presented as a singleentity using resource management systems such as OS-fork, LSF, Condor, and SGE.
In the current implementation, operational steps 2-6 (shown in Figure 7.2) are integrated within thechemical database server. That is, the CDB server deployed at one of the resource sites directly providesthe remote access to molecules in the selected databases.
7.3.1 Docking Code
The original docking code developed by researchers at the University of California in San Francisco(UCSF) is one of the most popular molecular docking applications [130]. The docking program evaluates

136
the chemical and geometric complementarities between a small molecule and a macromolecular bindingsite. It explores ways in which two molecules, such as a drug and an enzyme or protein receptor, might fittogether. Compounds that might bind tightly to the target receptor must have complementary chemical andspatial natures. Thus docking can be seen as a 3 dimensional puzzle searching for pieces that will fit intothe receptor site. It is important to be able to identify small molecules (compounds), which may bind to atarget macromolecule. This is because a compound, which binds to a biological macromolecule, maymodulate its function, and with further development eventually become a drug candidate. An example ofsuch a drug is the anti influenza drug Relenza which functions by binding to influenza virus attachmentproteins thus preventing viral infection.
The relationship between the key programs in the dock suite is depicted in Figure 7.4 (source [130]).The receptor coordinates at the top represent the three-dimensional (3D) structure of a protein. Themolecular modeller identifies the active site, and other sites of interest, and uses the program sphgen togenerate the sphere centers, which fill the site [52]. The program grid generates the scoring grids [11]. Theprogram dock matches spheres (generated by sphgen) with ligand atoms and uses scoring grids (from grid)to evaluate ligand orientations [11]. It also minimizes energy-based scores [26]. The focus of our work ison docking molecules in CDB with receptors to identify potential compounds that act as a drug. Hence,discussion in this chapter is centered on the execution of the program dock as a parameter sweepapplication on world-wide distributed resources.
Figure 7.4: Relation between key programs in the dock suite.
The docking code is highly portable—we have been able to compile and produce executables for Sun-Solaris, PC Linux, SGI IRIX, and Compaq Alpha/OSF1 architectures. For docking on heterogeneousresources, the Nimrod-G broker selects the correct executable automatically based on the resources itdiscovers at runtime.
7.3.2 Nimrod-G Tools
The Nimrod-G toolkit provides a suite of tools and services for creating parameter sweep applications,managing resources and scheduling applications on the world-wide distributed resources. It provides asimple declarative programming language or GUI tools for parameterization of application input data filesand creation of task-script to be performed by each job; and a programmable Grid resource broker forprocessing jobs on Grid resources.
The steps involved in distributed parametric execution are:
a) parameterise input files,
b) prepare a plan file containing the commands that define parameters and their values,
c) generate a run file, which converts the generic plan file to a detailed list of jobs,
d) schedule jobs for processing on distributed machines, and
e) control and monitor the execution of the jobs.

137
The application execution environment handles online creation of input files and command line argumentsthrough parameter substitution. The GUI tools supported by enFuzion, a commercial version of Nimrod,can also be used for parameterising applications. enFuzion uses the same syntax as Nimrod for parameterspecification [135]. In Section 7.4, we discuss the capabilities of Nimrod-G tools by composing amolecular modelling program as a parameter sweep application for docking compounds in CDB databases.In Section 7.5, we discuss the results of the Nimrod-G broker scheduling a molecular modelling applicationon the Grid with DBC time and cost optimization scheduling algorithms.
7.3.3 Chemical Database Management and Intelligent Access Tools
The chemical databases contain records of a large number of molecules from commercially availableorganic synthesis libraries, and natural product databases. The molecules in the CDB are represented inMOL2 file (.mol2) format [132], which is a portable representation of a SYBYL [133] molecule. TheMOL2 file is an ASCII file that contains all the information needed to reconstruct a SYBYL molecule.Each ligand record in a chemical database represents the three-dimensional structural information of acompound. The number of compounds in each CDB can be in the order of tens of thousands and thedatabase size be anywhere from tens of Megabytes to Gigabytes and even Terabytes. We have developedtools for turning the CDB into a network service and accessing them from remote resources. They includetools for indexing ligand records in the CDB, a multithreaded CDB Server for serving requests formolecule records, and a tool for fetching molecule/ligand record from remote CDB via the network [109].
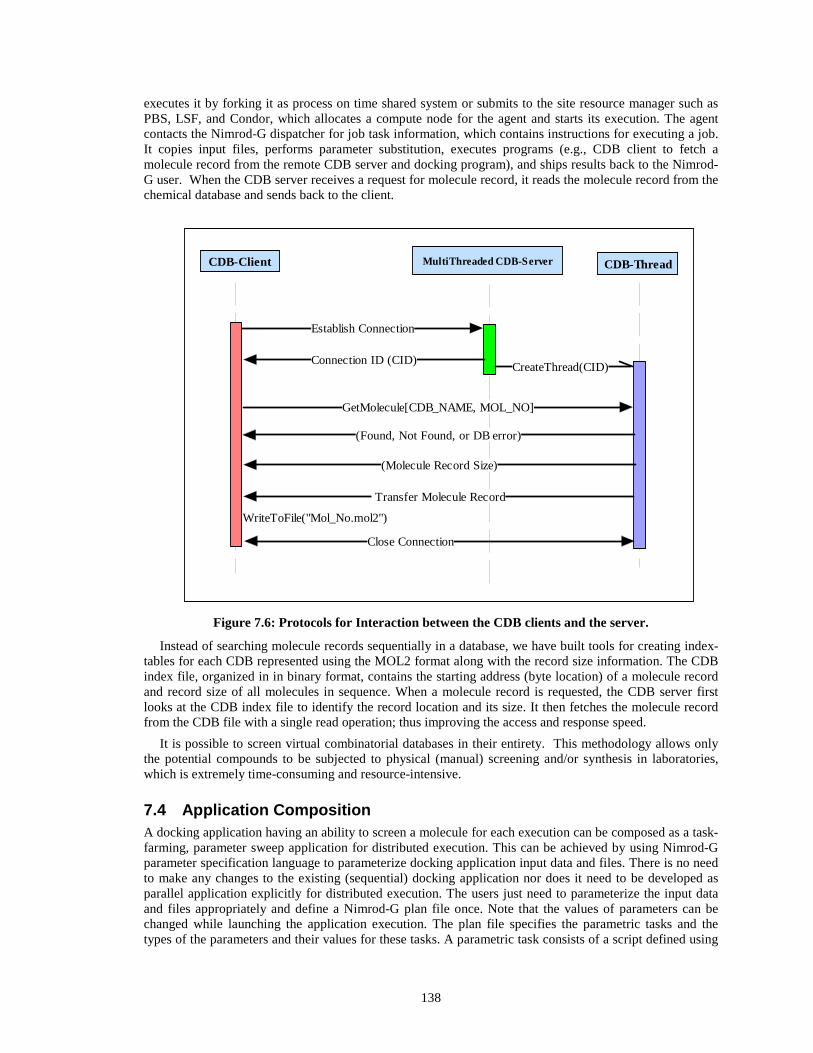
When a chemical database is available from more than one source (replica site), a suitable strategy suchas a source with high network speed or lightly loaded, can be used for selecting one of them. It is likely thatmultiple users from different locations issue requests for accessing the CDB, the server should be able toprocess such simultaneous requests concurrently. Therefore, we have developed a multithreaded CDBserver that can service requests from multiple users concurrently. An interaction between a Grid node and anode running the CDB server while performing docking is shown in Figure 7.5. We developed andimplemented protocols shown in Figure 7.6 for interaction between the CDB clients and the server. Bothfigures illustrate the operational model and the flow of control between CDB clients and servers.
Grid InfoServer
Grid InfoServer
ProcessServer
ProcessServer
UserProcess
UserProcess
File accessFile accessFileServer
FileServer
Grid Node
NimrodAgent
NimrodAgent
Compute NodeUser Node
GridDispatcher
GridDispatcher
Grid TradeServer
Grid TradeServer
GridScheduler
GridScheduler
LocalResourceManager
LocalResourceManager
Nimrod-G Grid Broker
TaskFarmingEngine
Nimrod-G Grid Broker
TaskFarmingEngine
Grid ToolsAnd
Applications
Grid ToolsAnd
Applications
Do this in 30min. for $10?Do this in 30min. for $10?
CDBClientCDBClient
Get molecule “n” record from “abc” CDBGet molecule “n” record from “abc” CDB
DockingProcessDockingProcess
CDBServer
Index and CDB1
..
.. .... ..
..
CDBm
Molecule “n”Location ?
Get mol. record
CDB Service on Grid
CDBServer
Index and CDB1
..
....
.. ........ ..
....
..
CDBm
Molecule “n”Location ?
Get mol. record
CDB Service on Grid
Figure 7.5: Deployment of Virtual Laboratory components at runtime and their interaction.
When the Nimrod-G broker schedules a docking job for processing on one of the Grid resources, itactually submits an agent to Globus GRAM, which acts as a process server. The process server either
138
executes it by forking it as process on time shared system or submits to the site resource manager such asPBS, LSF, and Condor, which allocates a compute node for the agent and starts its execution. The agentcontacts the Nimrod-G dispatcher for job task information, which contains instructions for executing a job.It copies input files, performs parameter substitution, executes programs (e.g., CDB client to fetch amolecule record from the remote CDB server and docking program), and ships results back to the Nimrod-G user. When the CDB server receives a request for molecule record, it reads the molecule record from thechemical database and sends back to the client.
CDB-Client MultiThreaded CDB-Server
Establish Connection
CDB-Thread
GetMolecule[CDB_NAME, MOL_NO]
Connection ID (CID)
(Found, Not Found, or DB error)
Transfer Molecule Record
(Molecule Record Size)
WriteToFile("Mol_No.mol2")
CreateThread(CID)
Close Connection
Figure 7.6: Protocols for Interaction between the CDB clients and the server.
Instead of searching molecule records sequentially in a database, we have built tools for creating index-tables for each CDB represented using the MOL2 format along with the record size information. The CDBindex file, organized in in binary format, contains the starting address (byte location) of a molecule recordand record size of all molecules in sequence. When a molecule record is requested, the CDB server firstlooks at the CDB index file to identify the record location and its size. It then fetches the molecule recordfrom the CDB file with a single read operation; thus improving the access and response speed.
It is possible to screen virtual combinatorial databases in their entirety. This methodology allows onlythe potential compounds to be subjected to physical (manual) screening and/or synthesis in laboratories,which is extremely time-consuming and resource-intensive.
7.4 Application CompositionA docking application having an ability to screen a molecule for each execution can be composed as a task-farming, parameter sweep application for distributed execution. This can be achieved by using Nimrod-Gparameter specification language to parameterize docking application input data and files. There is no needto make any changes to the existing (sequential) docking application nor does it need to be developed asparallel application explicitly for distributed execution. The users just need to parameterize the input dataand files appropriately and define a Nimrod-G plan file once. Note that the values of parameters can bechanged while launching the application execution. The plan file specifies the parametric tasks and thetypes of the parameters and their values for these tasks. A parametric task consists of a script defined using

139
a sequence of simple commands, providing the ability to copy files to and from the remote node, performparameter substitutions in input files, execute certain programs, and copy output files back to the user homenode. The parametric plan can be submitted to the Nimrod-G runtime machinery, which createsindependent docking jobs, and schedules these jobs for concurrent execution on distributed resources. Ittakes care of replacing the actual value of parameters in the parameterized input files before executingdocking jobs.
A sample configuration input file of the docking application is shown in Figure 7.7. It specifies dockingconfiguration parameters and molecule to be docked by indicating a name of the file in which moleculerecord is stored using the parameter variable "ligand_atom_file". To perform a parameter sweep ofdifferent molecules, the value specified by the parameter variable "ligand_atom_file" needs to beparameterized. This is accomplished by replacing the current value, which represents the name of a filecontaining molecule record, by a substitution place marker. The place marker T consists of a dollar-sign ($)followed by the name of the parameter controlling the substitution, optionally surrounded by braces.
score_ligand yes
minimize_ligand yesmultiple_ligands no
random_seed 7anchor_search no
torsion_drive yesclash_overlap 0.5conformation_cutoff_factor 3
torsion_minimize yesmatch_receptor_sites no
random_search yes. . . . . .. . . . . .
maximum_cycles 1ligand_atom_file S_1.mol2
receptor_site_file ece.sphscore_grid_prefix ecevdw_definition_file parameter/vdw.defn
chemical_definition_file parameter/chem.defnchemical_score_file parameter/chem_score.tbl
flex_definition_file parameter/flex.defnflex_drive_file parameter/flex_drive.tblligand_contact_file dock_cnt.mol2
ligand_chemical_file dock_chm.mol2ligand_energy_file dock_nrg.mol2
Molecule toMolecule tobe screenedbe screenedMolecule toMolecule tobe screenedbe screened
Figure 7.7: A configuration input file for docking application.
A parameterized input file with several attributes replaced by substitution place markers is shown inFigure 7.8. For example, a place marker called for the parameter “ligand_number” has replaced the firstpart of the “ligand_atom_file” attribute value. The actual value of these parameters is defined in theNimrod-G plan file that contains parameter definition and task specification. The parameter definitionsection of the plan file is shown in Figure 7.9. Each parameter is defined by a keyword "parameter",followed by the parameter name, an optional label, and a parameter type. The remaining information oneach line defines valid values for the parameter.
The parameter, for example, "database_name" has a label, and is of type text. Its valid values are listed,and the user will be able to select one of the values for the duration of the entire experiment. Most of theremaining parameters are single values, either text strings or integers, selected by the user, but with defaultvalues provided if the user does not wish to choose a value.The range parameter, "ligand_number", used to select the molecule, is defined as an integer variable withbounds. For example, to process the first 2000 molecules in the CDB, this range parameter can vary from 1to 2000 with the step size of 1.

140
score_ligand $score_ligand
minimize_ligand $minimize_ligandmultiple_ligands $multiple_ligands
random_seed $random_seed
anchor_search $anchor_searchtorsion_drive $torsion_drive
clash_overlap $clash_overlap
conformation_cutoff_factor $conformation_cutoff_factortorsion_minimize $torsion_minimize
match_receptor_sites $match_receptor_sites
random_search $random_search. . . . . .
. . . . . .
maximum_cycles $maximum_cyclesligand_atom_file ${ligand_number}.mol2
receptor_site_file $HOME/dock_inputs/${receptor_site_file}
score_grid_prefix $HOME/dock_inputs/${score_grid_prefix}vdw_definition_file vdw.defn
chemical_definition_file chem.defn
chemical_score_file chem_score.tblflex_definition_file flex.defn
flex_drive_file flex_drive.tbl
ligand_contact_file dock_cnt.mol2
ligand_chemical_file dock_chm.mol2ligand_energy_file dock_nrg.mol2
Molecule to beMolecule to bescreenedscreened
Molecule to beMolecule to bescreenedscreened
Figure 7.8: Parameterisation of a configuration input file.
parameter database_name label "database_name" text select oneof "aldrich""maybridge" "maybridge_300" "asinex_egc" "asinex_epc" "asinex_pre""available_chemicals_directory" "inter_bioscreen_s" "inter_bioscreen_n""inter_bioscreen_n_300" "inter_bioscreen_n_500" "biomolecular_research_institute""molecular_science" "molecular_diversity_preservation""national_cancer_institute" "IGF_HITS" "aldrich_300" "molecular_science_500""APP" "ECE" default "aldrich_300";
parameter CDB_SERVER text default "bezek.dstc.monash.edu.au";
parameter CDB_PORT_NO text default "5001";
parameter score_ligand text default "yes";
parameter minimize_ligand text default "yes";
parameter multiple_ligands text default "no";
parameter random_seed integer default 7;
parameter anchor_search text default "no";
parameter torsion_drive text default "yes";
parameter clash_overlap float default 0.5;
parameter conformation_cutoff_factor integer default 5;
parameter torsion_minimize text default "yes";
parameter match_receptor_sites text default "no";
. . . . . .
. . . . . .
parameter maximum_cycles integer default 1;
parameter receptor_site_file text default "ece.sph";
parameter score_grid_prefix text default "ece";
parameter ligand_number integer range from 1 to 2000 step 1;
Molecules to beMolecules to bescreenedscreened
Figure 7.9: A plan file defining parameters type and their values.
The parameters “receptor_site_file” and “score_grid_prefix” indicate the data input files. Their valuesindicate that data input files are located in the user home directory on Grid nodes. Instead of pre-staging,these files can be copied at runtime by defining necessary “copy” operations in the job’s “nodestart” or“main” task (see Figure 7.10). However, it is advisable to copy or “pre-stage” large input files in thebeginning of application execution instead of copying them during execution of every job. This savestransmission time particularly when those files are going to be used for docking with many databases.
The plan file is submitted to a job generation tool, such as the EnFuzion Generator, in order to create arun file that contains specific instances of jobs to be run, which is then submitted to the Nimrod-G runtime

141
machinery for processing on the Grid. The run file contains a job for each combination of parameters.Hence the number of jobs is the product of the number of values chosen for each parameter. Since most ofthe parameters except "ligand_number" are single-valued, they have no effect on the number of jobs.
task nodestart
copy ./parameter/vdw.defn node:.
copy ./parameter/chem.defn node:.
copy ./parameter/chem_score.tbl node:.
copy ./parameter/flex.defn node:.
copy ./parameter/flex_drive.tbl node:.
copy ./dock_inputs/get_molecule node:.
copy ./dock_inputs/dock_base node:.
endtask
task main
node:substitute dock_base dock_run
node:substitute get_molecule get_molecule_fetch
node:execute sh ./get_molecule_fetch
node:execute $HOME/bin/dock.$OS -i dock_run -o dock_out
copy node:dock_out ./results/dock_out.$jobname
copy node:dock_cnt.mol2 ./results/dock_cnt.mol2.$jobname
copy node:dock_chm.mol2 ./results/dock_chm.mol2.$jobname
copy node:dock_nrg.mol2 ./results/dock_nrg.mol2.$jobname
endtask
Figure 7.10: Task definition of docking jobs.
It is also possible to set concrete values for each of the parameters at runtime when job Generator isinvoked. For the parameter "ligand_number", the user may choose not to select all values from 1 to 2000,but may select a subset of these values. By default, this generated 2000 jobs, each docking a singlemolecule.
The second part of Nimrod-G plan file is task specification that defines a series of operations that eachjob needs to perform to dock a molecule (see Figure 7.10). The "nodestart" task is performed once for eachremote node. Following that, the files copied during that stage are available to each job when it is started.The "main" task controls the actions performed for each job.
The first line of the "main" task performs parameter substitution on the file "dock_base", creating a file"dock_run". This is the action that replaces the substitution place markers in our input file with the actualvalues for the job.
As each docking operation is performed on a selected molecule in the CDB database, it is not necessaryto copy such large databases on all Grid nodes. Hence, not only is the molecule file named in theconfiguration file, we also go to particular lengths to copy only the data for the molecule being tested. Theexecutable script "get_molecule_fetch" (see Figure 7.11) is also created using parameter substitution, andruns the "vlab-cdb-get-molecule" executable, which fetches the molecule record from the CDB moleculeserver based on the parameter "ligand_number". The molecule record is saved in a file whose name is thesame as integer value of the “ligand_number” parameter and “mol2” as its extension. For instance, if theparameter ligand_number value is 5, then molecule record will be saved in a file “5.mol2”.
#!/bin/sh
$HOME/bin/vlab-cdb-get-molecule.$OS $CDB_SERVER $CDB_PORT_NO ${database_name}.db $ligand_number
Figure 7.11: Parameterisation of script for extracting molecule from CDB.
The main code is the "dock" executable. Note that in the “execute” command, there are pseudo-parameters that do not appear in the plan file. These include environment variables, such as "HOME", aswell as other useful parameters, such as "OS" indicating the operating system on the node. This allows us toselect the correct executable for the node. If the “dock” executable files do not exist on Grid nodes, theyneed to be copied at runtime as part of the job’s “nodestart” task similar to copying input files.

142
The dock_run file created in the substitution step previously is now provided as the input configurationfile for the docking process. The output files are then copied back to the local host, and renamed withanother pseudo-parameter, the unique "jobname" parameter.
7.5 Scheduling ExperimentationsWe have performed scheduling experiments from a Grid resource in Australia along with four resourcesavailable in Japan and one in USA. Table 7.1 shows the list of resources and their properties, Grid services,access cost or price in terms of Grid dollar (G$) per CPU-second, and the number of jobs processed onresources with deadline-and-budget constrained (DBC) time optimization (TimeOpt) or cost optimization(CostOpt) strategies. The resource price in terms of G$ is assigned arbitrarily at runtime in theseexperiments, however, they can be set to match the power of resources and job turn around time as valuedin supercomputing centers such as the Manchester computing services. The G$ can be equated to realmoney or tokens charged to users for accessing resources. In the current scenario, the users get allocation oftokens via funding from the project sponsoring agents or partnerships. There are supercomputing centersthat sell tokens to commercial users and the value of tokens correspond to the quantity of resourceallocations. It is also possible to price resources based on the real world economic models [102] that aredriven by the supply and demand for resources.
Table 7.1: The WWG testbed resources used in scheduling experiments, job execution and costing.
Number of JobsExecuted
Organization &Location
Vendor, Resource Type,# CPU, OS, hostname
Grid Services andFabric, Role
Price
(G$/CPUsec.) TimeOpt CostOpt
Monash University,Melbourne, Australia
Sun: Ultra-1, 1 node,bezek.dstc.monash.edu.au
Globus, Nimrod-G,CDB Server, Fork(Master node)
-- -- --
AIST, Tokyo, JapanSun: Ultra-4, 4 nodes,Solaris, hpc420.hpcc.jp
Globus, GTS, Fork(Worker node)
1 44 102
AIST, Tokyo, JapanSun: Ultra-4, 4 nodes,Solaris, hpc420-1.hpcc.jp
Globus, GTS, Fork(Worker node)
2 41 41
AIST, Tokyo, JapanSun: Ultra-4, 4 nodes,Solaris, hpc420-2.hpcc.jp
Globus, GTS, Fork(Worker node)
1 42 39
AIST, Tokyo, JapanSun: Ultra-2, 2 nodes,Solaris, hpc220-2.hpcc.jp
Globus, GTS, Fork(Worker node)
3 11 4
Argonne NationalLab, Chicago, USA
Sun: Ultra -8, 8 nodes,Solaris,pitcairn.mcs.anl.gov
Globus, GTS, Fork(Worker node)
1 62 14
Total Experiment Cost (G$) 17702 14277
Time to Finish Experiment(Min.)
34.00 59.30
We have performed a trial screening 200 molecules (from the aldrich_300 CDB) on a target receptorcalled endothelin converting enzyme (ECE), which is involved in hypotension. The three dimensionalstructure of the receptor is derived from homology modelling using related receptor structures. In theseexperimentations, for faster evaluation purpose, the range parameter “ligand_number” is defined with thebounds 1 and 200 and the step size as 1, which produces 200 jobs for docking molecules. As shown inFigure 12, the dock program takes two different types of inputs files: a) common input files, the same filesare required for all docking jobs and b) ligand specific input files, which vary from one job to another. Thelarge common input files (receptor structure and pre-calculated score potentials) are pre-staged onresources instead of copying them at runtime. The files are copied using the globus-rcp command andstored in the directory location “$HOME/dock_inputs/” on resources as specified by the parameters“receptor_site_file” and “score_grid_prefix” (see Figure 7.8). The two application-specific executable files,“dock” and “vlab-cdb-get-molecule” invoked in the task scripts (see Figure 7.10 and Figure 7.11) are alsopre-staged. The executable files are stored in the “$HOME/bin/” directory on resources.

143
Common Input FilesLigand Specific Files
Dock.in(InputSpec.)
LigandRecord(2.mol2)
ReceptorStructure(ece.sph)
Parameters:vdw.defn, chem.defn,
chem_score.tbl,flex.defn, flex_drive.tbl
PrecalculatedScore Potentials:ece.bmp, ece.cnt,ece.chm, ece.nrg
DockProgram
Ligand Specific Files
Dock.in(InputSpec.)
LigandRecord(1.mol2)
Ligand Specific Files
Dock.in(InputSpec.)
LigandRecord
(200.mol2)...
job1Dock
Programjob2 DockProgramjob200...
Figure 7.12: Static and Dynamic Input Files of Docking program.
We conducted deadline and budget constrained scheduling experiments for two different optimizationstrategies [105]:
1. Optimize for Time - this strategy aims to produce results at the earliest possible time before adeadline, and within a budget limit. It process as many jobs as possible cheapest resources for thedeadline period and uses expensive ones just to meet the deadline.
2. Optimize for Cost - this strategy aims to minimize the cost of execution (spending from the givenbudget) and complete the experiment on or before the deadline. It uses all resources aggressivelyas long as it can afford them and tries to process all jobs at the earlier possible time.
In both experiments, we have set 60 minutes as the deadline limit and 50,000 G$ as the budget limit atruntime using the Nimrod-G scheduler steering and control monitor. The value of these constraints can bechanged at anytime during the execution, of course not less than the time and budget that is already spent!
Figure 7.13: A snapshot of the Nimrod-Gmonitor during “Optimize for Time” scheduling.
Figure 7.14: A snapshot of the Nimrod-Gmonitor during “Optimize for Cost” scheduling.
The first experiment, Optimize for Time scheduling, was performed on November 3, 2001 at 23:23:00,

144
Australian Eastern Standard Time (AEST), with a 60-minute deadline and finished on November 3, 2001by 23:57:00. A snapshot of the Nimrod-G monitoring and steering client taken a few minutes (~5min.)before the completion of application processing is shown in Figure 7.13. This experiment took 34 minutesto finish the processing of all jobs using resources available at that time with an expense of 17,702 G$.Figure 7.15 shows the number of jobs processed on different resources selected depending on their cost andavailability. Figure 7.16 shows the corresponding expenses of processing on resources. Figure 7.17 showsthe number of jobs in execution on resources at different times. From the graphs it can be observed that thebroker selected resources to ensure that the experiment was completed at the earliest possible time giventhe current availability of resources and the budget limitations. After 30 minutes, it discovered that it couldstill complete early without using the most expensive resource, hpc220-2.hpcc.jp.
It should be noted that for each job scheduled for execution on the Grid, the Nimrod-G runtimemachinery (actuator) deploys Nimrod-G agents on remote resources. The Nimrod agents setup runtimeenvironments (generally in scratch file space, “/tmp”) on remote resources and execute commands specifiedin the task definition script (see Figure 7.10). The docking parameter files and ligand specific files aretransferred from the home node, bezek.dstc.monash.edu.au in this case. The agent uses http protocols tofetch files via the http-based file server running on the home node. All parameter variables in theparameterized input files (see Figure 7.8 and Figure 7.9) are substituted by their concrete values beforeprocessing. The ligand record is fetched from the CDB database server running on the home node. Theagent then executes the dock program and stores output files in the scratch area. The required output filesare then transferred to the home node and stored with the job number as their extension. All these stepsinvolved in the execution of the dock program on Grid resources were completely hidden from the user.
0
10
20
30
40
50
60
70
0.00
2.27
4.76
7.00
8.97
11.38
13.43
15.56
17.74
20.46
22.41
24.84
26.62
28.88
31.10
33.18
35.28
Time (in min.)
No
.o
fJo
bs
Fin
ish
ed
AIST-Sun-hpc420.hpcc.jp
AIST-Sun-hpc420-1.hpcc.jp
AIST-Sun-hpc420-2.hpcc.jp
AIST-Sun-hpc220-2.hpcc.jp
ANL-Sun-pitcairn.mcs.anl.gov
Figure 7.15: No. of jobs processed on Grid resources during DBC time optimization scheduling.

145
0
1000
2000
3000
4000
5000
6000
7000
0.00
2.27
4.76
7.00
8.97
11.38
13.43
15.56
17.74
20.46
22.41
24.84
26.62
28.88
31.10
33.18
35.28
Time (in min.)
G$
spen
tfo
rp
roce
ssin
gjo
bs
AIST-Sun-hpc420.hpcc.jp
AIST-Sun-hpc420-1.hpcc.jp
AIST-Sun-hpc420-2.hpcc.jp
AIST-Sun-hpc220-2.hpcc.jp
ANL-Sun-pitcairn.mcs.anl.gov
Figure 7.16: The amount spent on resources during DBC time optimization scheduling.
0
1
2
3
4
5
6
7
8
9
0.00
2.27
4.76
7.00
8.97
11.38
13.4
315
.56
17.7
420
.46
22.4
124
.84
26.6
228
.88
31.1
033.
1835
.28
Time (in M in.)
No
.of
Job
sin
Exe
c.
AIST-Sun-hpc420.hpcc.jp
AIST-Sun-hpc420-1.hpcc.jp
AIST-Sun-hpc420-2.hpcc.jp
AIST-Sun-hpc220-2.hpcc.jp
ANL-Sun-pitcairn.mcs.anl.gov
Figure 7.17: No. of jobs in execution on Grid resources during DBC time optimization scheduling.
The second experiment, Optimize for Cost scheduling, was performed on November 4, 2001 at 00:08:00,AEST, with a 60-minute deadline and finished on November 4, 2001 by 01:07:30. A snapshot of theNimrod-G monitoring and steering client taken few minutes (~5min.) before the completion of applicationprocessing is shown in Figure 7.14. This experiment took almost 59.30 minutes to finish the processing ofall jobs using resources available at that time with an expense of 14,277 G$. It can be noted that the secondexperiment took an extra 25.30 minutes and saved 3,425 G$ in the process. Figure 7.18 shows the numberof jobs processed on different resources selected depending on their cost and availability. Figure 7.19shows the corresponding expenses of processing on resources. Figure 7.20 shows the number of jobs inexecution on resources at different times. From the graphs it can be observed that the broker selected thecheapest resources to ensure that the experiment was completed with minimum expenses, but before the

146
deadline limit. In the beginning expensive resources are used to ensure that the deadline can be met. If forany reason cheapest resources are unable to deliver expected performance, then the broker seeks the help ofexpensive resources to meet the deadline.
0
20
40
60
80
100
120
0.00 3.50 6.25 9.2412.1
814.7
118.1
421.1
823.9
727.6
531.1
234.5
137.3
541.0
544.3
047.3
150.3
853.1
155.8
158.9
9
Time (in min.)
No
.o
fJo
bs
Exe
cute
d
AIST-Sun-hpc420.hpcc.jp
AIST-Sun-hpc420-1.hpcc.jp
AIST-Sun-hpc420-2.hpcc.jp
AIST-Sun-hpc220-2.hpcc.jp
ANL-Sun-pitcairn.mcs.anl.gov
Figure 7.18: No. of jobs processed on Grid resources during DBC Cost optimization scheduling.
0
1000
2000
3000
4000
5000
6000
0.00
4.54
7.79
11.48
14.71
19.05
22.62
26.68
31.12
35.12
39.24
43.62
47.31
51.02
54.26
58.31
Time (in min.)
G$
spen
tfo
rjo
bp
roce
ssin
g
AIST-Sun-hpc420.hpcc.jp
AIST-Sun-hpc420-1.hpcc.jp
AIST-Sun-hpc420-2.hpcc.jp
AIST-Sun-hpc220-2.hpcc.jp
ANL-Sun-pitcairn.mcs.anl.gov
Figure 7.19: The amount spent on resources during DBC Cost optimization scheduling.

147
0
1
2
3
4
5
6
7
8
9
10
0.00
4.54
7.79
11.48
14.71
19.05
22.62
26.68
31.12
35.12
39.24
43.62
47.31
51.02
54.26
58.31
Time (in min.)
No
.o
fJo
bs
inE
xecu
tio
n
AIST-Sun-hpc420.hpcc.jp
AIST-Sun-hpc420-1.hpcc.jp
AIST-Sun-hpc420-2.hpcc.jp
AIST-Sun-hpc220-2.hpcc.jp
ANL-Sun-pitcairn.mcs.anl.gov
Figure 7.20: No. of jobs in execution on Grid resources during DBC Cost optimization scheduling.
7.6 Related WorkAlthough many researchers have explored the use of parallel computing techniques in molecular dockingfor drug design [35][116], there are only a few efforts that use the world wide distributed computers forprocessing docking jobs in parallel. One of the most related efforts is the FightAIDS@Home project [27],which is based on the Entropia’s distributed computing network and the Scripps Research Institute’sdocking application. In this case, volunteers need to download Entropia’s screen saver program that runs inthe background on the volunteer computer. The volunteer PC contacts the Entropia server to download thedata to perform docking. When docking on an assigned data is completed, it uploads the results to theserver. This execution model is different from our model where the scheduler (Nimrod-G) assigns the workto computers that are available and initiates the execution.
Most of the efforts explicitly develop docking application as a parallel application using a specialpurpose, legacy or standard, parallel programming languages and interfaces such as PVM and MPI, whichrequires extra development effort and time. The scalability of such applications and runtime systems islimited to resources available in a single domain and they need powerful computers and networks for fasterprocessing.
Our techniques are novel in many ways. To perform parallel and distributed docking using our tools,there is no need to develop docking application as a parallel application. Our framework supports thecomposition of the existing molecular docking application as a parameter sweep application withoutmaking any changes to it. Our runtime machinery, the Nimrod-G resource broker, creates independentdocking jobs automatically and launches their parallel execution on world-wide distributed computers. Ithides all the complexity associated with scheduling jobs, shipping appropriated input files, starting andmonitoring their execution, and shipping results back to the user. Our scheduler also supports the deadlineand budget based scheduling, which prioritizes the processing depending on the user requirements—howquickly they need results, how much they want to spend, and which one to optimise.
7.7 Summary and ConclusionComputational Grids enable the sharing and aggregation of geographically distributed resources forsolving large-scale, resource and data-intensive problems. However, application development, resourcemanagement, and scheduling in these environments is a complex undertaking. We have developed a Virtual

148
Laboratory environment and tools for formulating molecular docking for drug design as a parameter sweepapplication, chemical database management, and scheduling docking jobs for processing on a wide areadistributed resources by leveraging existing Grid technologies. The new tools developed include a chemicaldatabase indexer, CDB server for providing access to molecules in chemical databases as a networkservice, clients for accessing CDB services from a selected CDB service. We have used the Nimrod-Gparameter specification language for composing an existing docking application as a parameter sweepapplication and the Nimrod-G Grid resource broker for processing molecular docking jobs on distributedresources.
We have conducted deadline and budget constrained scheduling experiments for concurrent processingof docking jobs on the WWG testbed under two different optimization scenarios. The results of thismolecular docking application scheduling on a large-scale distributed resources demonstrate the potentialof the Virtual Laboratory tools for service oriented computing. They demonstrate the suitability of Gridsand Grid technologies (like Globus and Nimrod-G) for computational and data intensive computing and atthe same time prove the effectiveness of computational economy and quality of services (QoS) drivenscheduling as an efficient mechanism for the management of supply-and-demand for resources dependingon the value delivered to the user. Also, this framework with economic incentive encourages the users toreveal their true requirements and allows them to trade-off between the deadline and budget. Thus allowingthe allocation of resources to users with high priority jobs and requirements.