Embed Size (px)
Citation preview
Chapter 7
The impact of NAFTA on foreign investment in third countries
First version: December 9, 2002 This version: March 6, 2003
1
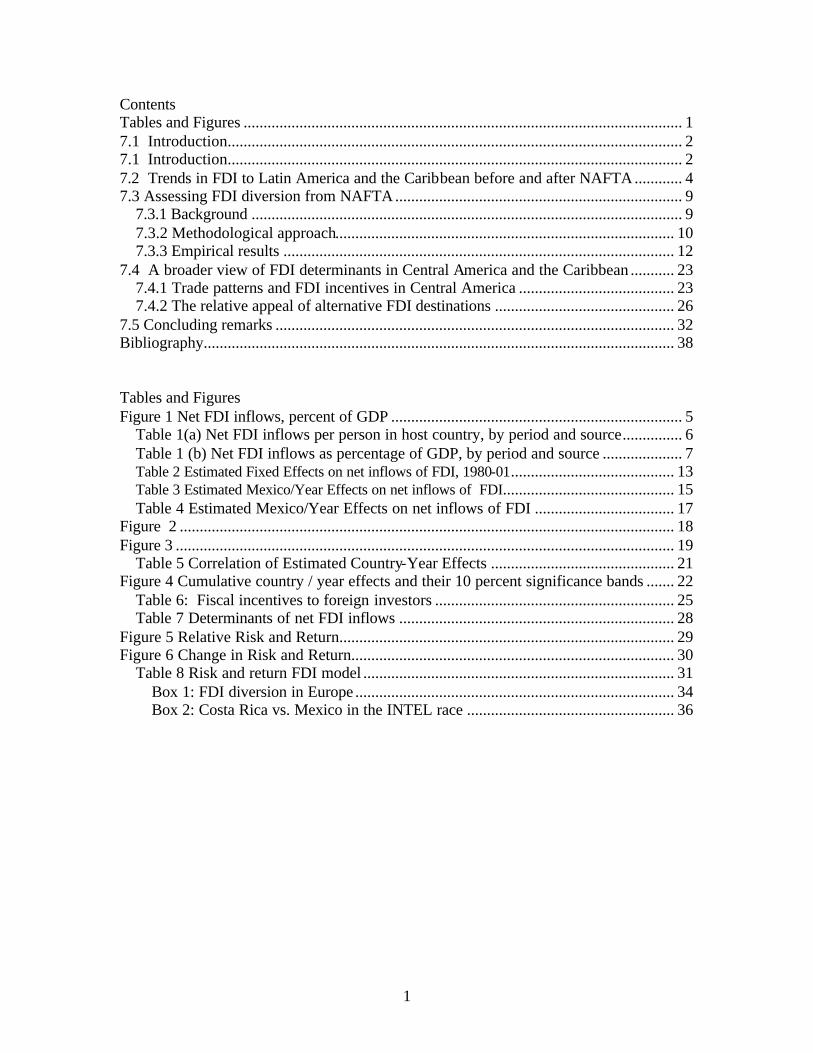
Contents Tables and Figures .............................................................................................................. 1 7.1 Introduction.................................................................................................................. 2 7.1 Introduction.................................................................................................................. 2 7.2 Trends in FDI to Latin America and the Caribbean before and after NAFTA............ 4 7.3 Assessing FDI diversion from NAFTA........................................................................ 9
7.3.1 Background ............................................................................................................ 9 7.3.2 Methodological approach..................................................................................... 10 7.3.3 Empirical results .................................................................................................. 12
7.4 A broader view of FDI determinants in Central America and the Caribbean ........... 23 7.4.1 Trade patterns and FDI incentives in Central America ....................................... 23 7.4.2 The relative appeal of alternative FDI destinations ............................................. 26
7.5 Concluding remarks .................................................................................................... 32 Bibliography...................................................................................................................... 38 Tables and Figures Figure 1 Net FDI inflows, percent of GDP ......................................................................... 5
Table 1(a) Net FDI inflows per person in host country, by period and source............... 6 Table 1 (b) Net FDI inflows as percentage of GDP, by period and source .................... 7 Table 2 Estimated Fixed Effects on net inflows of FDI, 1980-01......................................... 13 Table 3 Estimated Mexico/Year Effects on net inflows of FDI........................................... 15 Table 4 Estimated Mexico/Year Effects on net inflows of FDI ................................... 17
Figure 2 ............................................................................................................................ 18 Figure 3 ............................................................................................................................. 19
Table 5 Correlation of Estimated Country-Year Effects .............................................. 21 Figure 4 Cumulative country / year effects and their 10 percent significance bands ....... 22
Table 6: Fiscal incentives to foreign investors ............................................................ 25 Table 7 Determinants of net FDI inflows ..................................................................... 28
Figure 5 Relative Risk and Return.................................................................................... 29 Figure 6 Change in Risk and Return................................................................................. 30
Table 8 Risk and return FDI model .............................................................................. 31 Box 1: FDI diversion in Europe ................................................................................ 34 Box 2: Costa Rica vs. Mexico in the INTEL race .................................................... 36
2
7.1 Introduction Chapter 4 examined the effects of FTAs on foreign investment in member
countries, focusing on the case of Mexico under NAFTA. As discussed in that chapter, an FTA may both raise the profitability and reduce the risk from investing in FTA member countries, prompting an increase in their investment inflows. Some evidence of this effect was found in the case of Mexico.
However, this also means that, other things equal, an FTA makes nonmember
countries relatively less attractive investment destinations. From the perspective of international investors, this may prompt a portfolio reallocation away from these countries and thus a significant change in the allocation of investment across countries -- an ‘investment diversion’ effect analogous to the trade diversion effect analyzed in Chapter 6.1 Has the rise in FDI to Mexico implied a reduction in FDI to other Latin American countries ? If so, which countries and why ? And what can they do to remedy this situation ? While the investment creation effect of FTAs has attracted increased attention in recent years, few studies have examined the impact on investment flows to nonmember countries. On a priori grounds, the redirection of FDI inflows is likely to be more marked for those host countries most ‘similar’ to (i.e., closer substitutes for) the FTA members in terms of location, endowments and overall investment environment. Thus, like with trade diversion, in the case of NAFTA the neighboring countries of Central America and the Caribbean would be among the prime candidates for investment diversion, since from the location perspective they are relatively close substitutes for Mexico as FDI destinations.2
Like with FDI to FTA member countries, the impact on FDI to nonmembers depends also to a large extent on whether investment flows are horizontally or vertically motivated. As explained in Chapter 4, horizontal FDI is aimed at serving the local market of the host country, and is usually motivated by trade costs such as transportation and tariffs. Vertical FDI is typically aimed at exporting the production to third countries or back to the source country, and aims to exploit a cost advantage of the host country. Obviously, many intermediate forms of FDI are possible. If FDI into nonmember countries is mainly horizontal, it is unlikely to be strongly affected by the creation or enlargement of an FTA. 3 If FDI is vertically motivated instead, then flows to host countries excluded from the FTA are likely to decline as source countries substitute investment within the FTA for investment outside it. This applies to all investors, both from within and outside the FTA, who export back from their host to
1 The concepts of foreign investment creation and diversion in the context of trade integration date back to Kindleberger (1966). 2 See Leamer et al (1995) for an ex-ante assessment of the potential effects of NAFTA on investment in Central America, including an evaluation of the location similarities between Mexico and Central America. 3 If the FTA does have an impact, it is likely to be negative, as the relative size of the local market of nonmember countries decreases vis -à-vis the now enlarged local market of the FTA.
3
the FTA, since now it will be cheaper to do so from member countries than from nonmember countries.
While foreign investment into industrial countries is of the horizontal variety, in
developing countries vertical investments account for a significant share of FDI.4 Historically, both forms of FDI have been present in Central and South America. The early waves of FDI were directed to the most traditional sectors of the region (agricultural and mineral goods), which constituted the main exports of the host countries. Copper, bananas, oil, etc. were originally produced across Latin America by foreign companies. During the import substitution era, Central and South America significantly raised tariffs, which attracted significant flows of horizontal FDI.5
In recent years, however, much of the FDI flowing to Central America and the Caribbean has been of a vertical nature. During the 1980s, the debt crisis, along with political instability in Nicaragua and El Salvador, practically shut down the Central American Common Market. In response, most countries in the area adopted a strategy of promotion of exports to alternative markets, first with direct fiscal subsidies and later with tax exemptions in the framework of the Export Processing Zones (EPZs) already discussed in the previous chapter. These incentives, which spread across the region, exempt domestic and foreign producers from import, export and income taxes, and typically require that most of the production be targeted to exports.
As a result of those incentives, much of FDI in Central America, aside from FDI in tourism and the privatizations recently observed in some countries (Guatemala, Panama and El Salvador) is closely linked to the EPZs. These flows are vertically motivated and, therefore, highly sensitive to relative cost considerations. This is so particularly in the case of textiles and apparel, which use easily-movable equipment and, as noted in Chapter 6, constitute a major fraction of the region’s exports to NAFTA countries. As already noted in Chapter 6, in these sectors NAFTA introduced, at least temporarily, a preference advantage for Mexico over the excluded Central American and Caribbean countries, which might have encouraged redirection of their FDI inflows towards Mexico in the years following the FTA implementation.
In contrast, FDI flows to South America appear less closely linked to exports. The average market size of host countries in South America is considerably larger than that of Central American countries, which provides a strong incentive to horizontal FDI. Moreover, during the 1990s most South American economies, especially Argentina and Brazil, received considerable FDI inflows from privatization of public utilities and concessions of public works. These flows should be relatively insensitive to whatever free trade agreements exist in the region, as they target the local market for non-traded
4 See Shatz and Venables (2001). 5 During this period, major multinational companies (e.g., Firestone, Pfizer, Colgate, Sherwin Williams and many others) established production plants in Central America. Automakers established production units in Brazil, Argentina, and Mexico. Tariff jumping was one of the major motivations for those investments.
4
goods.6 Thus, on a priori grounds, if NAFTA did have an effect on FDI flows to excluded count ries, its magnitude should have been smaller for South America than for NAFTA’s Central American neighbors.
However, as already noted in Chapter 6, FTAs are only a subset of the broad array
of determinants of FDI inflows identified in the analytical and empirical literature. Much, or indeed most, of the variation in FDI inflows across countries can be explained quite apart from their preferential trading arrangements.7 Thus, the above discussion of FDI creation and diversion has to be put in context. The FDI impact of an FTA may be dwarfed by the effects of changes in other FDI fundamentals.
This chapter assesses the impact of NAFTA on FDI flows to nonmember
countries.8 We first review the changing trends in FDI flows across Latin America and the Caribbean before and after NAFTA. Because FDI displays a generalized upward trend in most countries, in Section 3 we then examine in more detail the relative post-NAFTA performance of each host country -- relative to the other hosts and to its own history as FDI destination -- paying particular attention to the neighboring countries of Central America and the Caribbean. Section 4 takes a broader view of FDI determinants to Latin America beyond NAFTA, and reviews their evolution in the countries under analysis. Section 5 provides some concluding remarks and policy lessons.
7.2 Trends in FDI to Latin America and the Caribbean before and after NAFTA
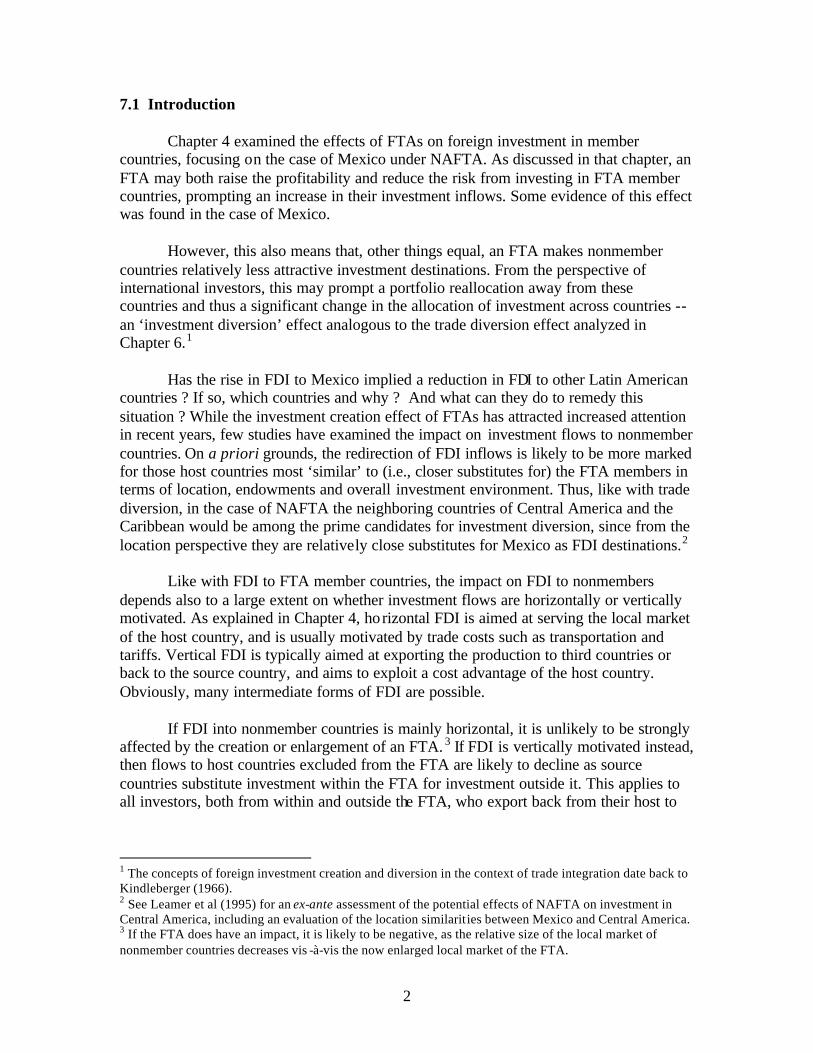
The first step to assess the impact of NAFTA on FDI to nonmember countries is to examine their FDI performance relative to Mexico’s. Figure 1 offers a comparative perspective on net FDI inflows to Mexico, Central America and the Caribbean, and South America since 1980. Here and in the rest of the chapter, we consider six major Central American and Caribbean countries -- Costa Rica, El Salvador, Guatemala, Honduras, the Dominican Republic and Jamaica9 -- and nine South American economies -- Argentina, Bolivia, Brazil, Chile, Colombia, Ecuador, Paraguay, Peru and Venezuela.
The upward trend in FDI relative to GDP since the early 1990s is clearly apparent in the figure. Closer inspection reveals three distinct stages. First, until 1993 there was little difference in FDI performance across the three host regions in the graph. Annual flows to each one of them hovered around 1-2 percent of the respective GDP. Up to that year, South America consistently received lower flows than the rest, while Central
6 Strictly speaking, FTAs could have an indirect effect on this kind of FDI as well, if they affect the growth prospects of the host country and thereby the anticipated profitability of the privatized firm and bidders’ willingness to pay for it. 7 Of course, FTA membership may have an impact on other ‘deep’ determinants of FDI flows, such as trade openness, and hence affect FDI indirectly through channels other than the ‘credibility’ effect discussed earlier. 8 Much of the material in this chapter is based on the background paper by Monge (2002). 9 We exclude Panama from the sample, because its FDI inflows are very large and extremely erratic, possibly reflecting its role as an international financial center; and Nicaragua, due to the unavailability of data for much of the period under analysis. Data on net FDI inflows were obtained from the World Bank World Development Indicators and UNCTAD’s World Investment Report.
5
America became the top FDI destination since 1987. Second, in 1994 FDI to Mexico shows a steep increase, coinciding with the inception of NAFTA. As a result, Mexico became the leading FDI host over 1994-96. Third, after 1997 FDI flows to Central and South America catch up with, and even exceed, flows to Mexico.10
Figure 1 Net FDI inflows, percent of GDP
0%
1%
2%
3%
4%
5%
6%
7%
1980
1981
1982
1983
1984
1985
1986
1987
1988
1989
1990
1991
1992
1993
1994
1995
1996
1997
1998
1999
2000
2001
Mexico Central America and Caribbean South America The individual country performances underlying Figure 1 are summarized in
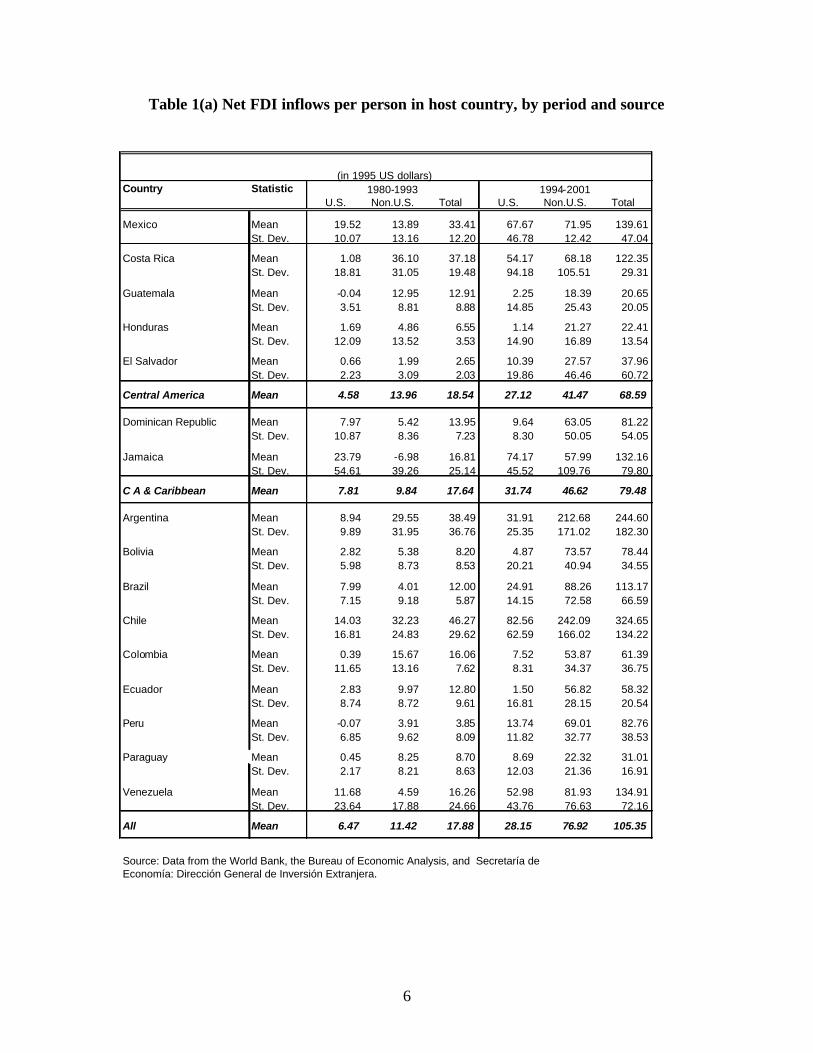
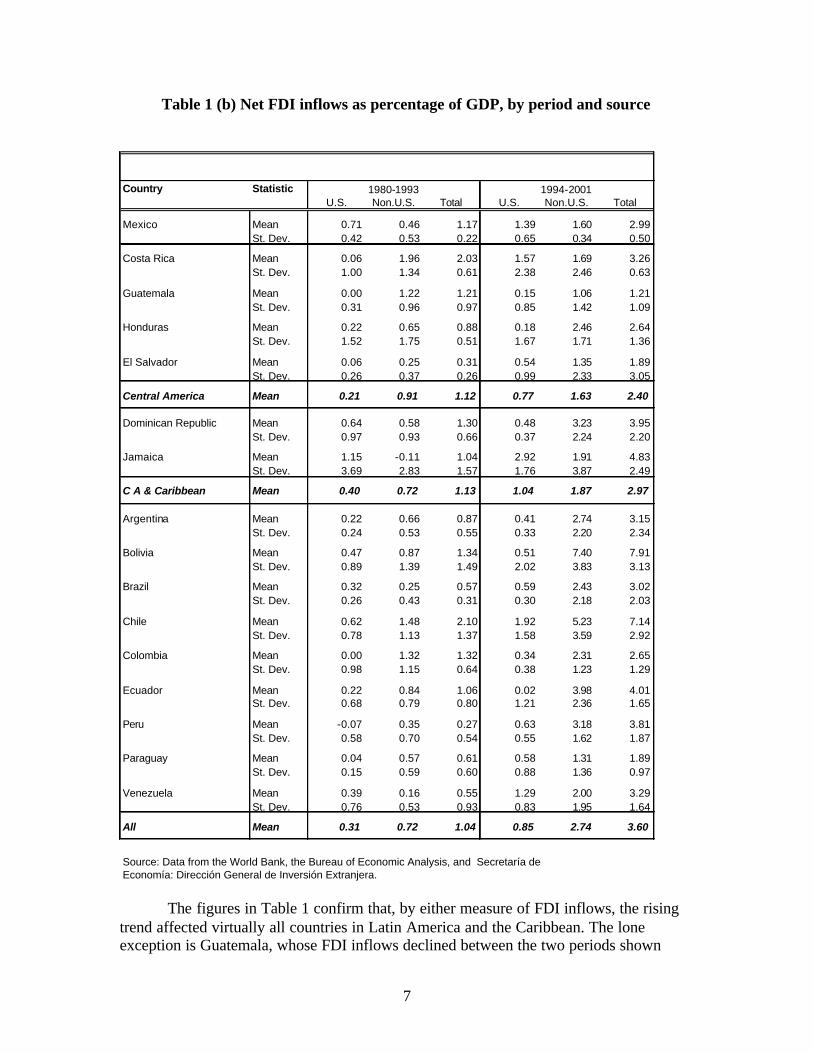
Table 1, which presents two alternative measures of FDI: per capita inflows in 1995 US dollars and the ratio of inflows to current GDP. The former measure is shown because, unlike the latter, it is unaffected by gyrations in real exchange rates (such as the devaluation of the Mexican peso during the Tequila crisis), and therefore it may offer a superior yardstick when assessing changes in FDI performance over short time periods. In contrast, the latter measure provides a more accurate picture of the economic dimension of FDI, especially over longer periods of time. The table shows the mean and standard deviation of FDI from U.S. and non-U.S. sources to the countries under analysis for the years 1980-1993 (before NAFTA) and 1994-2001 (after NAFTA).11
10 The sharp rise in FDI flows to South America in 1999 shown in the graph is largely due to a surge in flows to Argentina related to the sale of YPF. In turn, the rise in FDI flows to Central America and the Caribbean in 1998 reflects a generalized increase in inflows to all countries in the area (except for Honduras), particularly abrupt in the case of El Salvador. Finally, the jump in FDI to Mexico in 2001 reflects the sale of Banamex, which amounted to over 2 percent of GDP. 11 For Mexico, the breakdown of inflows into U.S. and non-U.S. sources is based on data from the Secretaría de Economía. For the other countries, it is based on data from the U.S. Bureau of Economic Analysis, so the comparisons have to be taken with some caution. Wile further disaggregation of inflows from non-US sources might be of interest, the necessary data are unavailable for most countries in LAC.
6
Table 1(a) Net FDI inflows per person in host country, by period and source
Country Statistic U.S. Non.U.S. Total U.S. Non.U.S. Total
Mexico Mean 19.52 13.89 33.41 67.67 71.95 139.61 St. Dev. 10.07 13.16 12.20 46.78 12.42 47.04
Costa Rica Mean 1.08 36.10 37.18 54.17 68.18 122.35 St. Dev. 18.81 31.05 19.48 94.18 105.51 29.31
Guatemala Mean -0.04 12.95 12.91 2.25 18.39 20.65 St. Dev. 3.51 8.81 8.88 14.85 25.43 20.05
Honduras Mean 1.69 4.86 6.55 1.14 21.27 22.41 St. Dev. 12.09 13.52 3.53 14.90 16.89 13.54
El Salvador Mean 0.66 1.99 2.65 10.39 27.57 37.96 St. Dev. 2.23 3.09 2.03 19.86 46.46 60.72
Central America Mean 4.58 13.96 18.54 27.12 41.47 68.59
Dominican Republic Mean 7.97 5.42 13.95 9.64 63.05 81.22 St. Dev. 10.87 8.36 7.23 8.30 50.05 54.05
Jamaica Mean 23.79 -6.98 16.81 74.17 57.99 132.16 St. Dev. 54.61 39.26 25.14 45.52 109.76 79.80
C A & Caribbean Mean 7.81 9.84 17.64 31.74 46.62 79.48
Argentina Mean 8.94 29.55 38.49 31.91 212.68 244.60 St. Dev. 9.89 31.95 36.76 25.35 171.02 182.30
Bolivia Mean 2.82 5.38 8.20 4.87 73.57 78.44 St. Dev. 5.98 8.73 8.53 20.21 40.94 34.55
Brazil Mean 7.99 4.01 12.00 24.91 88.26 113.17 St. Dev. 7.15 9.18 5.87 14.15 72.58 66.59
Chile Mean 14.03 32.23 46.27 82.56 242.09 324.65 St. Dev. 16.81 24.83 29.62 62.59 166.02 134.22
Colombia Mean 0.39 15.67 16.06 7.52 53.87 61.39 St. Dev. 11.65 13.16 7.62 8.31 34.37 36.75
Ecuador Mean 2.83 9.97 12.80 1.50 56.82 58.32 St. Dev. 8.74 8.72 9.61 16.81 28.15 20.54
Peru Mean -0.07 3.91 3.85 13.74 69.01 82.76 St. Dev. 6.85 9.62 8.09 11.82 32.77 38.53
Paraguay Mean 0.45 8.25 8.70 8.69 22.32 31.01 St. Dev. 2.17 8.21 8.63 12.03 21.36 16.91
Venezuela Mean 11.68 4.59 16.26 52.98 81.93 134.91 St. Dev. 23.64 17.88 24.66 43.76 76.63 72.16
All Mean 6.47 11.42 17.88 28.15 76.92 105.35
Source: Data from the World Bank, the Bureau of Economic Analysis, and Secretaría de Economía: Dirección General de Inversión Extranjera.
(in 1995 US dollars)
1980-1993 1994-2001
7
Table 1 (b) Net FDI inflows as percentage of GDP, by period and source
The figures in Table 1 confirm that, by either measure of FDI inflows, the rising
trend affected virtually all countries in Latin America and the Caribbean. The lone exception is Guatemala, whose FDI inflows declined between the two periods shown
Country Statistic U.S. Non.U.S. Total U.S. Non.U.S. Total
Mexico Mean 0.71 0.46 1.17 1.39 1.60 2.99 St. Dev. 0.42 0.53 0.22 0.65 0.34 0.50
Costa Rica Mean 0.06 1.96 2.03 1.57 1.69 3.26 St. Dev. 1.00 1.34 0.61 2.38 2.46 0.63
Guatemala Mean 0.00 1.22 1.21 0.15 1.06 1.21 St. Dev. 0.31 0.96 0.97 0.85 1.42 1.09
Honduras Mean 0.22 0.65 0.88 0.18 2.46 2.64 St. Dev. 1.52 1.75 0.51 1.67 1.71 1.36
El Salvador Mean 0.06 0.25 0.31 0.54 1.35 1.89 St. Dev. 0.26 0.37 0.26 0.99 2.33 3.05
Central America Mean 0.21 0.91 1.12 0.77 1.63 2.40
Dominican Republic Mean 0.64 0.58 1.30 0.48 3.23 3.95 St. Dev. 0.97 0.93 0.66 0.37 2.24 2.20
Jamaica Mean 1.15 -0.11 1.04 2.92 1.91 4.83 St. Dev. 3.69 2.83 1.57 1.76 3.87 2.49
C A & Caribbean Mean 0.40 0.72 1.13 1.04 1.87 2.97
Argentina Mean 0.22 0.66 0.87 0.41 2.74 3.15 St. Dev. 0.24 0.53 0.55 0.33 2.20 2.34
Bolivia Mean 0.47 0.87 1.34 0.51 7.40 7.91 St. Dev. 0.89 1.39 1.49 2.02 3.83 3.13
Brazil Mean 0.32 0.25 0.57 0.59 2.43 3.02 St. Dev. 0.26 0.43 0.31 0.30 2.18 2.03
Chile Mean 0.62 1.48 2.10 1.92 5.23 7.14 St. Dev. 0.78 1.13 1.37 1.58 3.59 2.92
Colombia Mean 0.00 1.32 1.32 0.34 2.31 2.65 St. Dev. 0.98 1.15 0.64 0.38 1.23 1.29
Ecuador Mean 0.22 0.84 1.06 0.02 3.98 4.01 St. Dev. 0.68 0.79 0.80 1.21 2.36 1.65
Peru Mean -0.07 0.35 0.27 0.63 3.18 3.81 St. Dev. 0.58 0.70 0.54 0.55 1.62 1.87
Paraguay Mean 0.04 0.57 0.61 0.58 1.31 1.89 St. Dev. 0.15 0.59 0.60 0.88 1.36 0.97
Venezuela Mean 0.39 0.16 0.55 1.29 2.00 3.29 St. Dev. 0.76 0.53 0.93 0.83 1.95 1.64
All Mean 0.31 0.72 1.04 0.85 2.74 3.60
Source: Data from the World Bank, the Bureau of Economic Analysis, and Secretaría de Economía: Dirección General de Inversión Extranjera.
1980-1993 1994-2001
8
when measured relative to GDP, and showed the smallest increase in the table when measured in per capita terms.
Beyond the common rising trend, some interesting facts emerge from the data.
First, by either measure shown, Mexico was not the top FDI destination in Latin America during the post-NAFTA period. Instead, countries like Chile and Argentina (as well as Bolivia, if we look at FDI ratios to GDP) were the main recipients of FDI. Nor is Mexico the top recipient of U.S. FDI: it places behind Chile and Jamaica, as well as Costa Rica in terms of ratio to GDP. Second, Mexico was not either the country experiencing the largest increases in FDI inflows between the pre-and post-NAFTA periods. Chile and Jamaica had bigger rises in FDI by both measures shown in the table, and other countries also outperformed Mexico in terms of rises in FDI per capita (e.g., Venezuela) or in terms or FDI relative to GDP (e.g., Costa Rica and Bolivia). Central America and the Caribbean combined experienced an increase in FDI relative to GDP very similar to that of Mexico -- from an average of 1.1 percent of GDP in 1980-93 to an average of 3.0 percent of GDP in 1994-2001. In Mexico, the rise was from 1.2 to 3.0 percent of GDP. Third, both U.S. and non-U.S.-based investors have increased the ir flows to the region. In a number of major countries – including Argentina, Brazil and Chile – investment from the latter sources rose faster than U.S. investment. In terms of region-wide averages, non U.S.-based investment exceeded its U.S. counterpart over both periods shown, and across periods the rise in the former exceeded the rise in the latter. Within Central America there was considerable diversity in the relative performance of FDI flows from U.S. and non U.S. sources. Costa Rica and Jamaica saw a substantial expansion of the former, while Honduras and the Dominican Republic experienced a significant increase in the latter.
Fourth, there is nevertheless considerable heterogeneity across host countries in terms of the level and growth of total FDI. Within Central America, growth was spectacular in Costa Rica, but modest in Honduras and El Salvador and, especially, in Guatemala. The two Caribbean countries shown also had large increases in FDI inflows. Fifth, heterogeneity also extends to the volatility of FDI. Measured by the coefficient of variation of per capita inflows, volatility declined in some countries (e.g., Costa Rica, Jamaica, Ecuador) and increased for others (Guatemala and El Salvador). In sum, while FDI inflows to most Latin American economies show a common upward trend, there is also a considerable degree of cross-country diversity. Even within Central America, some countries have attracted much more FDI than others. But a preliminary inspection of observed FDI trends does not provide much evidence of a generally negative change after NAFTA in FDI inflows to the neighboring countries of Central America and the Caribbean. Of course, a more rigorous analysis might find otherwise, and is developed below in two stages. First, we examine in detail the trends in FDI to Mexico and other countries looking for significant divergences between them.
9
Second, we assess the ability of standard FDI determinants to account for the observed pattern of FDI allocation across Latin American countries in the pre- and post-NAFTA periods. 7.3 Assessing FDI diversion from NAFTA 7.3.1 Background
There are no formal studies of the impact of NAFTA on FDI flows to nonmember countries, and few assessments of the effects of other RIAs on the international allocation of FDI flows. This stands in sharp contrast with the growing empirical literature assessing the effects of RIAs on FDI flows to member countries.
The case of the EEC / EU has attracted a few empirical studies focusing
specifically on investment diversion at various stages of the FTA – from its creation to the accession of Iberian countries in 1985, the Single Common Market of 1992 and the upcoming expansion of the EU to Eastern European countries (see Box 1 for a selective summary). On the whole, they do not find compelling evidence of investment diversion.
In a multi-RIA framework, a recent empirical study (Levy-Yeyati, Stein and Daude 2002) finds that RIAs divert investment originating in member countries away from non-member hosts. Importantly, the possible diversion of FDI flows from nonmember source countries is not taken into account. This is a potential issue because, as Table 1 showed, non-U.S. sources account for the majority of FDI across Latin America, as well as for the majority of the increase in investment flows in recent years.12 Another caveat is that NAFTA is the only North-South trade agreement in the study and, unlike the framework in Chapter 6 above, which allows each FTA to be different, the basic framework of the study in question forces all FTAs to have the same effects on FDI allocation. Yet there is some evidence suggesting that the investment impact of FTAs may be different depending on whether they involve only North countries, South countries or both. 13
In the analysis of the impact of FTAs on FDI in Chapter 4 we attempted to identify the diversion of investment flows from both member and nonmember source countries, but found no significant effects. Like the preceding study, however, the implicit assumption was that NAFTA is not different from other RIAs. Also, both approaches share another restrictive feature, namely the simplifying assumption that RIA-induced FDI diversion effects must be the same for all non-member countries. As already argued, analytical considerations strongly suggest that FDI diversion should be more substantial for nonmember host countries that are closer substitutes for hosts
12 In spite of neglecting this channel, the study’s estimated diversion effect is extremely large: entry by a source country into an FTA would reduce its stock of FDI to nonmember countries by about 27 percent. 13 See Blomstrom and Kokko (1997). Indeed, experiments reported in the paper by Levy-Yeyati, Stein and Daude (2002) do suggest that NAFTA may be different from the other FTAs in terms of its FDI impact.
10
belonging to the RIA under consideration. Admittedly, however, it is not easy to build an empirical framework allowing for varying degrees of substitutability among FDI hosts.
In view of these limitations, below we follow a different approach. We focus on
assessing if flows to LAC countries excluded from NAFTA, and especially Central America and the Caribbean, show a different behavior than flows to Mexico before and after implementation of the FTA. As shown in the previous section, most countries in the region experienced large increases in FDI inflows in the second part of 1990s. Thus, the empirical approach needs to control for these common trends, in order to isolate any differential behavior of nonmember countries vis-à-vis Mexico across the pre- and post-NAFTA periods. It also needs to control for unobservable factors that make some countries more appealing than others to foreign investors. In addition, we also control for the occurrence and extent of privatization, to see if they help explain the observed differences in FDI patterns across countries. 7.3.2 Methodological approach
To separate common FDI trends from host- (as well as source-) specific trends, we use a flexible statistical model that distinguishes among host country effects, source country effects, pure (common) year effects, source/host fixed effects and source/year and host/year effects. Within this framework we can determine if there is in fact a significant difference between Mexico’s FDI inflows before and after NAFTA with respect to those received by other countries in the region. While there are many ways to achieve this kind of decomposition, a particularly useful one forces the various components listed above to be mutually orthogonal, so that their respective contributions to the observed variation of the dependent variable can be uniquely determined. This is the approach followed here, and is briefly outlined below. 14
Assume we have observations on FDI flows from i=1,2,…,I source countries to a
sample of n=1,2,…,N host countries over periods t=1,…,T. Let f(i,n,t) denote FDI flows from country i to country n in year t. We can decompose f(i,n,t) into:
f(i,n,t)=h(i)+b(t)+m(i,n)+f(i,t)+g(n,t)+u(i,n,t) here h(i) is a fixed source country effect, b(t) is a year effect that affects all source and host countries, m(i,n) is a fixed source/host country effect, f(i,t) is a fixed effect specific to source country i, g(n,t) is a year effect specific to a host country n. The term u(i,n,t) is simply the residual of the series once these effects have been accounted for.
This model is still unidentified, and the conventional solution is to use a country/year as the base. The main problem with this strategy is that then the right-hand side variables are not mutually orthogonal. Moreover, the numerical results depend on the choice of base country/year. It is therefore preferable to use a different set of identification assumptions, namely expressing the various effects as deviations from their respective means. This amounts to imposing the six conditions 14 For more details, see Marimon and Zilibotti (1998).
11
TttngNntngIitif
TttifTttbIinim
N
n
T
t
T
t
I
i
T
t
N
n
,...,1,0),(;,...,1,0),(;,...,1,0),(
,...,1,0),(;,...,1,0)(;,...,1,0),(
111
111
======
======
∑∑∑
∑∑∑
===
===
These conditions make the right hand-side variables in the above equation mutually orthogonal. It is convenient to discuss their interpretation further. First, h(i) indicates the relative importance of source country i for the average host country in the sample during the sample period. In particular, these estimates can be useful to assess the relevance of the U.S. economy as a source of FDI to the region. In turn, the estimates of m(i,n) represent the permanent deviation of country n with respect to the flows of FDI from country i to the average country in the group. This controls for permanent differences across countries, and can capture the effect of geographic, historical and political proximity of each of the n countries to the particular source country i.15
The second condition redefines the year effects b(t) as deviations from the average flow of FDI to the average country in the group during the sample period. This normalization will play an important role below, as FDI shows a rising trend in most countries. By including these year effects, we are able to separate the common factors behind the generalized increase in FDI flows to all the host countries in the region from those specific factors that favored a subset of countries with respect to others, which is our main interest.
The third and fourth equations normalize the source/year effects f(i,t) in such a way that for each year they represent deviations across source countries with respect to the mean time effect (b(t)), and for each source country represent year deviations from its average h(i). Finally, the fifth and sixth equations have a very similar interpretation. Thus, g(n,t) are host country year effects that represent, for each year t, the deviation of host country n with respect to the mean year effect (b(t)). For each host country n, they would represent year deviations from its average flow.
In spite of its simplicity, this statistical model offers major advantages. Most importantly, it does not impose uniformity of year effects across periods or across countries. This flexibility is of particular importance when the purpose is to compare the behavior of the series before and after a particular date. Further, the fact that it does not impose uniformity across countries will be very useful to ascertain which countries have done best / worst under NAFTA.
Specifically, to examine if under NAFTA Mexico has outperformed the other
countries in the region, we can compare the estimated year effects for Mexico g(Mexico,t) with those of other countries g(excluded,t). These host/year effects indicate
15 Note that this represents a more general way of controlling for distance and other time -invariant characteristics of countries than the parametric measures commonly employed in gravity models. Indeed, in our context finding informative measures of closeness for Central American countries could be problematic given their geographic proximity and small size.
12
positive or nega tive deviations of the respective host country with respect to the rest of the group in the year in question, as well as deviations of the host country with respect to its average over time. For example, if NAFTA has implied a relevant advantage for Mexico one must find that the Mexico time effects are negative prior to NAFTA and positive afterwards. Furthermore, the pattern of these time effects tells us whether such advantage narrows or widens over time.
Likewise, the sum over time of the year effects of a given host provides an
indication of the cumulative post-NAFTA performance of FDI flows to that host. For example, it is quite possible that the effects of NAFTA on FDI flows to Mexico may diminish over time. Even in that case, it would be incorrect to conclude that NAFTA had no persistent effects, since a temporary change in flows might amount to a permanent change in the stock of FDI to Mexico. This can be explored by computing
∑≥1994
),(t
tMexicog .
Finally, the estimated host/year effects of the excluded countries, especially in Central America, are of direct interest, since they provide a measure of how much each respective country deviated from the average FDI performance of the overall sample in the year in question, as well as how much the year in question deviated from the average FDI performance of the country under consideration. If FDI to excluded countries was diverted by NAFTA, they should show negative host/year effects after 1993.
7.3.3 Empirical results
This framework is used to compare Mexico with two different groups of countries. The first group includes only the Central American and Caribbean countries listed earlier. The second group adds the main South American economies. As before, the exercise is performed for two different measures of FDI: annual net inflows of FDI in 1995 U.S. dollars per inhabitant of the host country (FDI pc), and net inflows of FDI relative to the GDP of the host economy (FDI/GDP).16
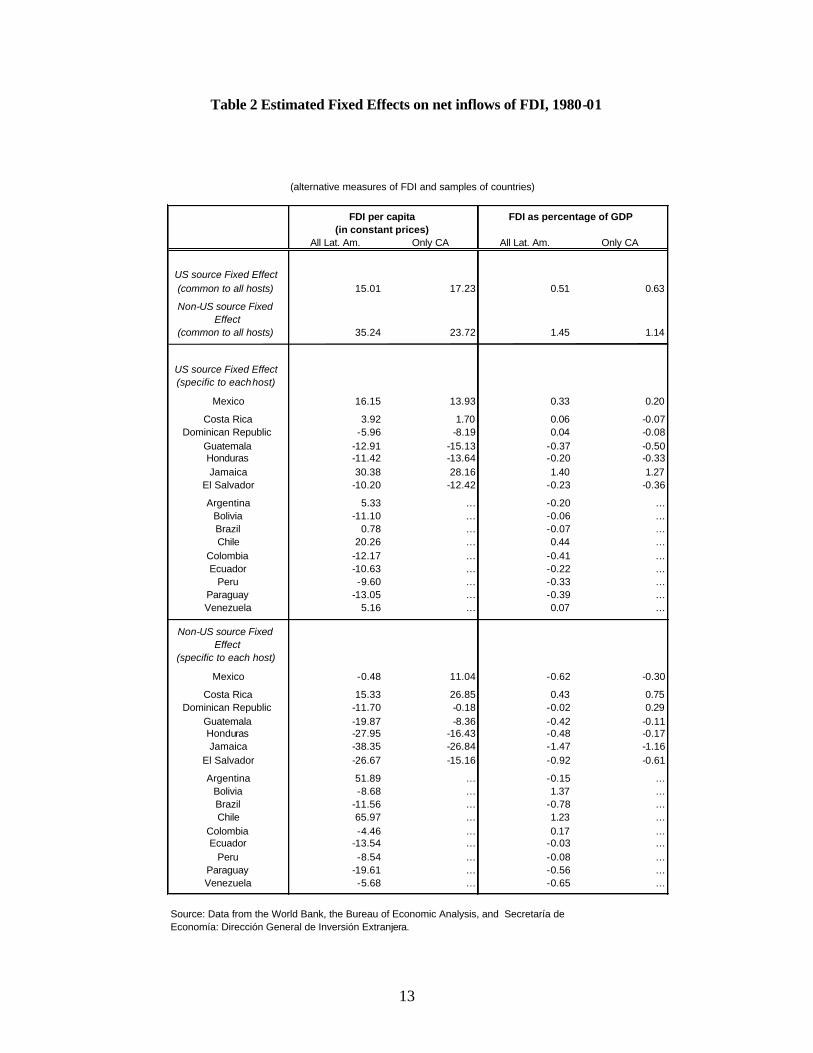
Table 2 reports the estimated fixed effects for source countries and source-host country pairs for both country groups and both measures of FDI. There are several salient results in the table. The first concerns the relative importance of U.S. and non-U.S. FDI sources. For the sample considered here, the latter are on average more important than the former. Second, U.S.-based investors play a more prominent role in Central America than in South America. Finally, there is a large degree of heterogeneity across countries, even within Central and South American groups. We next discuss each of these points in more detail.
16 The analysis was also performed measuring FDI by its ratio to fixed investment of the host country. The results were generally analogous to those obtained with FDI/GDP and thus are not reported.
13
Table 2 Estimated Fixed Effects on net inflows of FDI, 1980-01
All Lat. Am. Only CA All Lat. Am. Only CA
US source Fixed Effect (common to all hosts) 15.01 17.23 0.51 0.63 Non-US source Fixed
Effect (common to all hosts) 35.24 23.72 1.45 1.14
US source Fixed Effect (specific to each host)
Mexico 16.15 13.93 0.33 0.20 Costa Rica 3.92 1.70 0.06 -0.07
Dominican Republic -5.96 -8.19 0.04 -0.08 Guatemala -12.91 -15.13 -0.37 -0.50 Honduras -11.42 -13.64 -0.20 -0.33 Jamaica 30.38 28.16 1.40 1.27
El Salvador -10.20 -12.42 -0.23 -0.36 Argentina 5.33 … -0.20 …
Bolivia -11.10 … -0.06 … Brazil 0.78 … -0.07 … Chile 20.26 … 0.44 …
Colombia -12.17 … -0.41 … Ecuador -10.63 … -0.22 …
Peru -9.60 … -0.33 … Paraguay -13.05 … -0.39 … Venezuela 5.16 … 0.07 …
Non-US source Fixed Effect
(specific to each host) Mexico -0.48 11.04 -0.62 -0.30
Costa Rica 15.33 26.85 0.43 0.75 Dominican Republic -11.70 -0.18 -0.02 0.29
Guatemala -19.87 -8.36 -0.42 -0.11 Honduras -27.95 -16.43 -0.48 -0.17 Jamaica -38.35 -26.84 -1.47 -1.16
El Salvador -26.67 -15.16 -0.92 -0.61 Argentina 51.89 … -0.15 …
Bolivia -8.68 … 1.37 … Brazil -11.56 … -0.78 … Chile 65.97 … 1.23 …
Colombia -4.46 … 0.17 … Ecuador -13.54 … -0.03 …
Peru -8.54 … -0.08 … Paraguay -19.61 … -0.56 … Venezuela -5.68 … -0.65 …
Source: Data from the World Bank, the Bureau of Economic Analysis, and Secretaría de Economía: Dirección General de Inversión Extranjera.
(alternative measures of FDI and samples of countries)
FDI per capita (in constant prices)
FDI as percentage of GDP
14
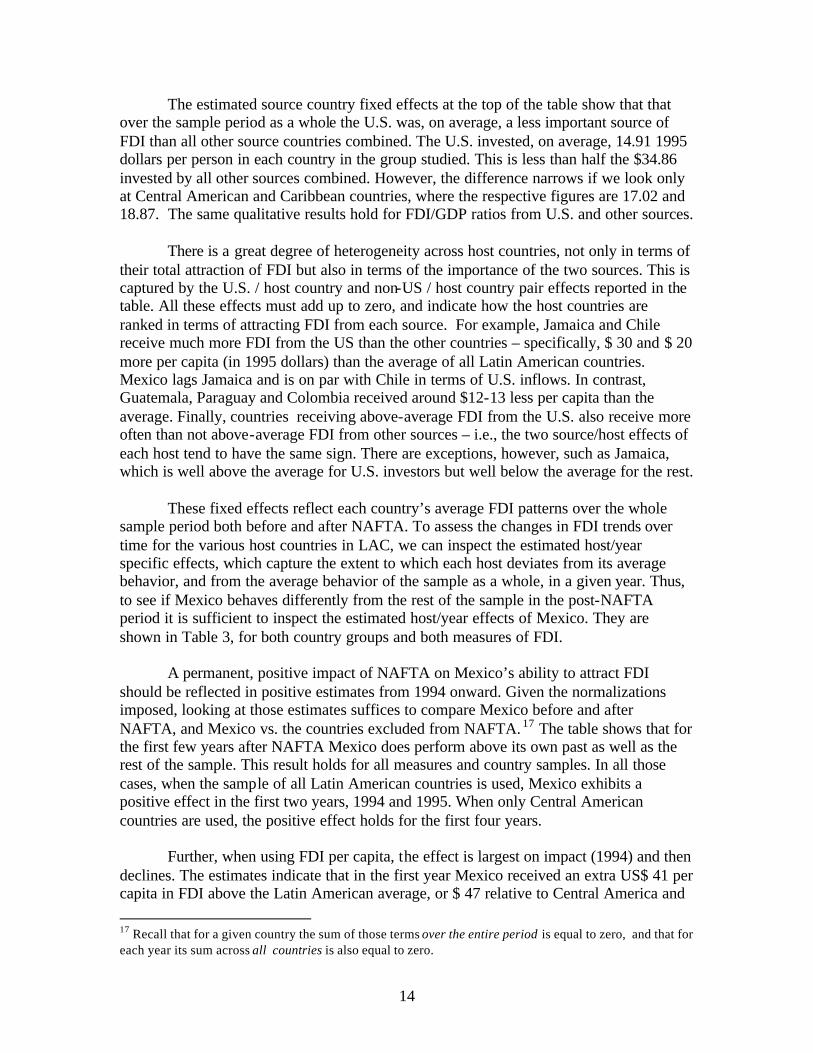
The estimated source country fixed effects at the top of the table show that that over the sample period as a whole the U.S. was, on average, a less important source of FDI than all other source countries combined. The U.S. invested, on average, 14.91 1995 dollars per person in each country in the group studied. This is less than half the $34.86 invested by all other sources combined. However, the difference narrows if we look only at Central American and Caribbean countries, where the respective figures are 17.02 and 18.87. The same qualitative results hold for FDI/GDP ratios from U.S. and other sources.
There is a great degree of heterogeneity across host countries, not only in terms of their total attraction of FDI but also in terms of the importance of the two sources. This is captured by the U.S. / host country and non-US / host country pair effects reported in the table. All these effects must add up to zero, and indicate how the host countries are ranked in terms of attracting FDI from each source. For example, Jamaica and Chile receive much more FDI from the US than the other countries – specifically, $ 30 and $ 20 more per capita (in 1995 dollars) than the average of all Latin American countries. Mexico lags Jamaica and is on par with Chile in terms of U.S. inflows. In contrast, Guatemala, Paraguay and Colombia received around $12-13 less per capita than the average. Finally, countries receiving above-average FDI from the U.S. also receive more often than not above-average FDI from other sources – i.e., the two source/host effects of each host tend to have the same sign. There are exceptions, however, such as Jamaica, which is well above the average for U.S. investors but well below the average for the rest.
These fixed effects reflect each country’s average FDI patterns over the whole
sample period both before and after NAFTA. To assess the changes in FDI trends over time for the various host countries in LAC, we can inspect the estimated host/year specific effects, which capture the extent to which each host deviates from its average behavior, and from the average behavior of the sample as a whole, in a given year. Thus, to see if Mexico behaves differently from the rest of the sample in the post-NAFTA period it is sufficient to inspect the estimated host/year effects of Mexico. They are shown in Table 3, for both country groups and both measures of FDI.
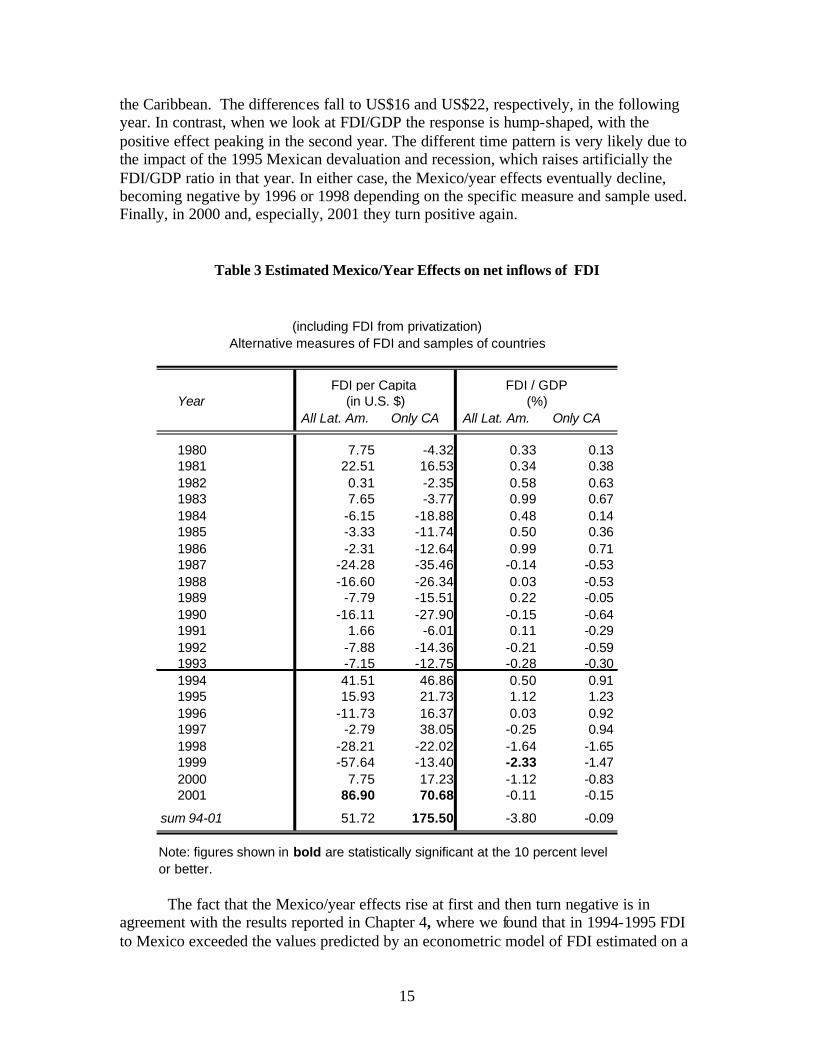
A permanent, positive impact of NAFTA on Mexico’s ability to attract FDI
should be reflected in positive estimates from 1994 onward. Given the normalizations imposed, looking at those estimates suffices to compare Mexico before and after NAFTA, and Mexico vs. the countries excluded from NAFTA. 17 The table shows that for the first few years after NAFTA Mexico does perform above its own past as well as the rest of the sample. This result holds for all measures and country samples. In all those cases, when the sample of all Latin American countries is used, Mexico exhibits a positive effect in the first two years, 1994 and 1995. When only Central American countries are used, the positive effect holds for the first four years.
Further, when using FDI per capita, the effect is largest on impact (1994) and then
declines. The estimates indicate that in the first year Mexico received an extra US$ 41 per capita in FDI above the Latin American average, or $ 47 relative to Central America and 17 Recall that for a given country the sum of those terms over the entire period is equal to zero, and that for each year its sum across all countries is also equal to zero.
15
the Caribbean. The differences fall to US$16 and US$22, respectively, in the following year. In contrast, when we look at FDI/GDP the response is hump-shaped, with the positive effect peaking in the second year. The different time pattern is very likely due to the impact of the 1995 Mexican devaluation and recession, which raises artificially the FDI/GDP ratio in that year. In either case, the Mexico/year effects eventually decline, becoming negative by 1996 or 1998 depending on the specific measure and sample used. Finally, in 2000 and, especially, 2001 they turn positive again.
Table 3 Estimated Mexico/Year Effects on net inflows of FDI
The fact that the Mexico/year effects rise at first and then turn negative is in
agreement with the results reported in Chapter 4, where we found that in 1994-1995 FDI to Mexico exceeded the values predicted by an econometric model of FDI estimated on a
YearAll Lat. Am. Only CA All Lat. Am. Only CA
1980 7.75 -4.32 0.33 0.131981 22.51 16.53 0.34 0.381982 0.31 -2.35 0.58 0.631983 7.65 -3.77 0.99 0.671984 -6.15 -18.88 0.48 0.141985 -3.33 -11.74 0.50 0.361986 -2.31 -12.64 0.99 0.711987 -24.28 -35.46 -0.14 -0.531988 -16.60 -26.34 0.03 -0.531989 -7.79 -15.51 0.22 -0.051990 -16.11 -27.90 -0.15 -0.641991 1.66 -6.01 0.11 -0.291992 -7.88 -14.36 -0.21 -0.591993 -7.15 -12.75 -0.28 -0.301994 41.51 46.86 0.50 0.911995 15.93 21.73 1.12 1.231996 -11.73 16.37 0.03 0.921997 -2.79 38.05 -0.25 0.941998 -28.21 -22.02 -1.64 -1.651999 -57.64 -13.40 -2.33 -1.472000 7.75 17.23 -1.12 -0.832001 86.90 70.68 -0.11 -0.15
sum 94-01 51.72 175.50 -3.80 -0.09
(including FDI from privatization)
FDI per Capita FDI / GDP(in U.S. $) (%)
Alternative measures of FDI and samples of countries
Note: figures shown in bold are statistically significant at the 10 percent level or better.
16
large sample of countries. After 1995, FDI inflows fell increasingly short of the model’s predictions. In turn, the jump in the estimated Mexico effect in 2001 is dominated by one single transaction (the sale of Banamex), which amounted to $ 108 per capita (or over 2 percent of GDP).
Did Mexico acquire a permanent advantage as FDI host in the post-NAFTA
years? The bottom of Table 3 shows the cumulative effects for Mexico over the entire post-NAFTA period. They are positive when performance is measured by per capita FDI inflows, although the estimate is significant only when using the Central America sample, and is largely dominated by the spike observed in 2001. Indeed, if we stopped the econometric exercise in 2000 rather than 2001, the cumulative effect vis-à-vis Latin America would turn negative, while that against Central America would remain positive but insignificant. Admittedly, it is not clear that the large one-time Banamex sale in 2001 largely responsible for this result can be viewed as a result of NAFTA. In contrast, when using FDI as a percentage of GDP as the preferred indicator, the cumulative effect is negative but insignificant, even taking into account the Banamex transaction. Are these results distorted by the differential timing and volume of privatization-related FDI in Mexico and elsewhere ? Over the 1990s the sale of public enterprise assets attracted large volumes of FDI in a number of South American economies (Argentina, Brazil, Bolivia) and, more recently, Central American economies as well (most notably El Salvador). As already noted in Chapter 4, Mexico’s privatization program was, in comparison, fairly modest. Since privatization-related transactions are included in total FDI flows, the differential effects of NAFTA on FDI to Mexico and other Latin American countries could be masked by the large volume of those transactions in other countries in the region. 18
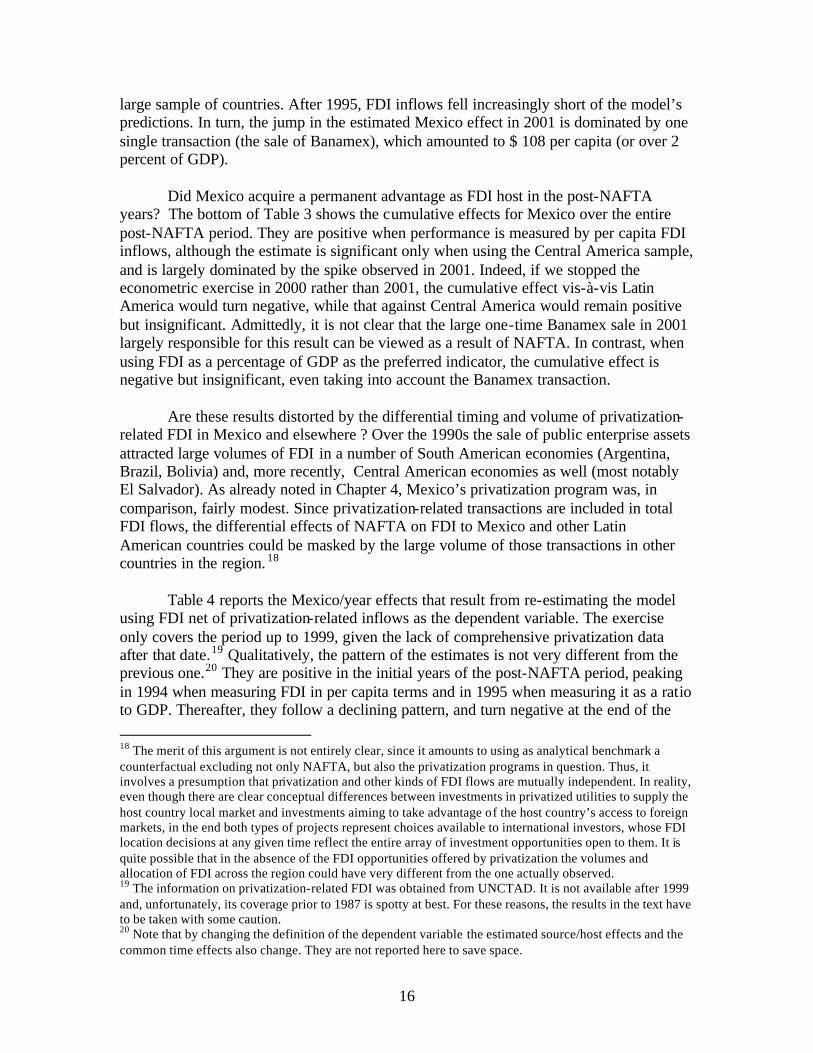
Table 4 reports the Mexico/year effects that result from re-estimating the model using FDI net of privatization-related inflows as the dependent variable. The exercise only covers the period up to 1999, given the lack of comprehensive privatization data after that date.19 Qualitatively, the pattern of the estimates is not very different from the previous one.20 They are positive in the initial years of the post-NAFTA period, peaking in 1994 when measuring FDI in per capita terms and in 1995 when measuring it as a ratio to GDP. Thereafter, they follow a declining pattern, and turn negative at the end of the 18 The merit of this argument is not entirely clear, since it amounts to using as analytical benchmark a counterfactual excluding not only NAFTA, but also the privatization programs in question. Thus, it involves a presumption that privatization and other kinds of FDI flows are mutually independent. In reality, even though there are clear conceptual differences between investments in privatized utilities to supply the host country local market and investments aiming to take advantage of the host country’s access to foreign markets, in the end both types of projects represent choices available to international investors, whose FDI location decisions at any given time reflect the entire array of investment opportunities open to them. It is quite possible that in the absence of the FDI opportunities offered by privatization the volumes and allocation of FDI across the region could have very different from the one actually observed. 19 The information on privatization-related FDI was obtained from UNCTAD. It is not available after 1999 and, unfortunately, its coverage prior to 1987 is spotty at best. For these reasons, the results in the text have to be taken with some caution. 20 Note that by changing the definition of the dependent variable the estimated source/host effects and the common time effects also change. They are not reported here to save space.
17
sample. However, these negative values are smaller in magnitude than those shown in Table 3 As a result, the cumulative effect over 1994-99 vis-à-vis the Central America sample becomes positive also when measuring FDI as a percentage of GDP. However, like in the previous table, the effect is significant only when measuring FDI in per capita terms. Thus, ignoring privatization-related FDI does not alter the main conclusions. The data continue to point towards an initial boom in FDI inflows to Mexico in 1994-95 (or 1994-97, depending on the country sample used) relative to the inflows to the other countries, followed by a slump at the end of the 1990s. So far we have focused on the estimated year effects for Mexico. However, they only capture differences between Mexico and the (average of) the entire group of countries considered. But to assess the performance of other countries of specific interest -- namely Central America and the Caribbean – we can compare their respective year effects with those of Mexico. Such comparison yields interesting information on how those countries have fared relative to Mexico (as well as their own past) after NAFTA.
Table 4 Estimated Mexico/Year Effects on net inflows of FDI
Excluding Privatization
YearAll Lat. Am. Only CA All Lat. Am. Only CA
1980 8.55 0.55 0.10 0.041981 23.31 21.41 0.10 0.291982 1.11 2.53 0.34 0.541983 8.45 1.10 0.75 0.581984 -5.36 -14.00 0.25 0.051985 -2.53 -6.87 0.27 0.271986 -1.51 -7.77 0.75 0.621987 -23.48 -30.58 -0.38 -0.621988 -15.75 -21.46 -0.21 -0.621989 -6.40 -10.64 0.00 -0.141990 -36.99 -44.64 -0.96 -1.311991 9.68 -1.14 0.11 -0.381992 -7.23 -12.72 -0.44 -0.751993 -3.53 -7.87 -0.47 -0.391994 54.64 51.73 0.78 0.821995 26.91 26.61 1.66 1.141996 -4.81 20.35 -0.01 0.811997 -6.17 24.73 0.00 0.411998 5.69 8.96 -0.83 -0.301999 -24.59 -0.27 -1.82 -1.04
sum 94-99 51.67 132.10 -0.21 1.83
Note: figures shown in bold are statistically significant at the 10 percent level or better.
FDI per Capita FDI / GDP(in U.S. $) (%)
Alternative measures of FDI and samples of countries
18
Figure 2
Real FDI per capitaEstimated Country/Year Effects, 80-01
-80
-60
-40
-20
0
20
40
60
80
1980
1982
1984
1986
1988
1990
1992
1994
1996
1998
2000
FD
I per
cap
ita
per
yea
r
CRI GTM HND MEX
Real FDI per capitaEstimated Country/Year Effects, 80-01
-80-60-40-20
020406080
100120
1980
1982
1984
1986
1988
1990
1992
1994
1996
1998
2000
FD
I per
cap
itap
er y
ear
DOM JAM MEX SLV
FDI/GDPEstimated Country/Year Effects, 80-01
-4.5
-3.0
-1.5
0.0
1.5
3.0
4.5
1980
1982
1984
1986
1988
1990
1992
1994
1996
1998
2000
FD
I/GD
P p
er y
ear
CRI GTM HND MEX
FDI/GDPEstimated Country/Year Effects, 80-01
-7
-5
-3
-1
1
3
5
7
1980
1982
1984
1986
1988
1990
1992
1994
1996
1998
2000
FDI/G
DP
per
yea
r
DOM JAM MEX SLV
19
Figure 3
Estimated Country/ Year EffectsReal FDI per capita: Net of Privatizations, 80-99
-80
-60
-40
-20
0
20
40
60
1980
1982
1984
1986
1988
1990
1992
1994
1996
1998
FD
I per
cap
ita p
er y
ear
CRI GTM HND MEX
Estimated Country/ Year Effects FDI/GDP: Net of privatizations, 80-99
-3
-2
-1
0
1
2
3
4
1980
1982
1984
1986
1988
1990
1992
1994
1996
1998
FDI/G
DP
per
yea
r
CRI GTM HND MEX
Estimated Country/ Year EffectsReal FDI per capita: Net of Privatizations, 80-99
-60
-40
-20
0
20
40
60
80
100
1980
1982
1984
1986
1988
1990
1992
1994
1996
1998
FD
I per
cap
ita p
er y
ear
DOM JAM MEX SLV
Estimated Country/ Year Effects FDI/GDP: Net of privatizations, 80-99
-3
-2
-1
0
1
2
3
4
1980
1982
1984
1986
1988
1990
1992
1994
1996
1998
FDI/G
DP
per
yea
r
DOM JAM MEX SLV
20
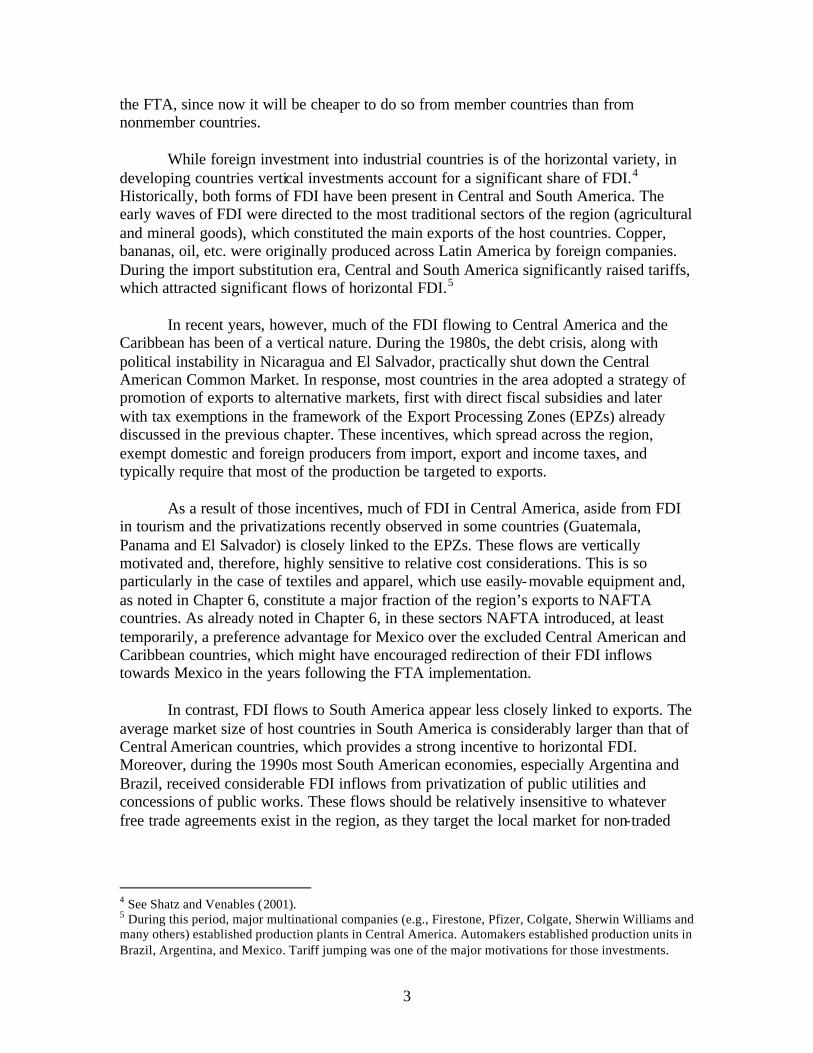
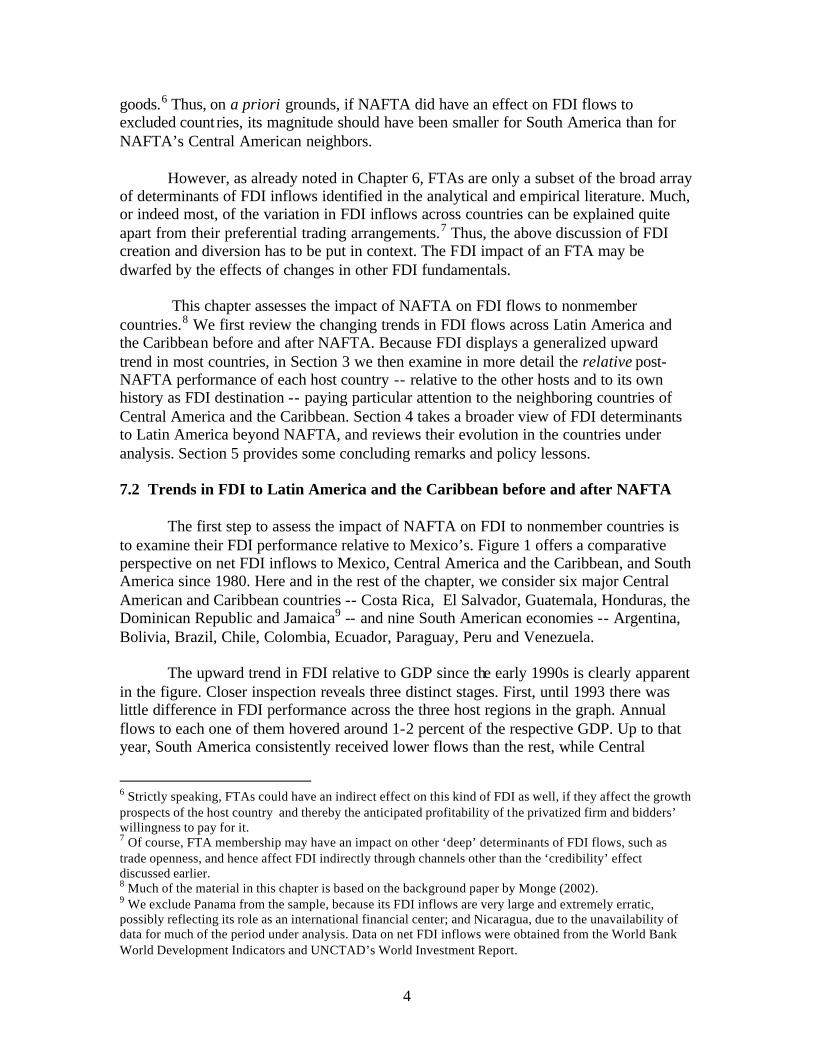
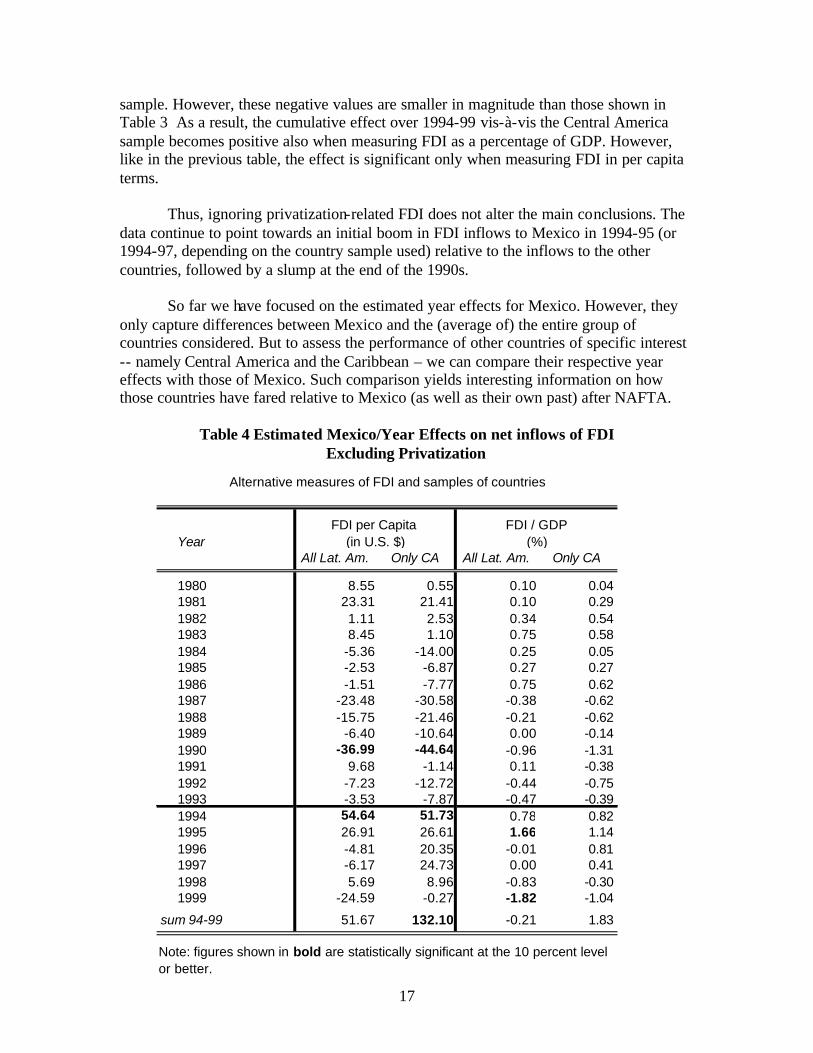
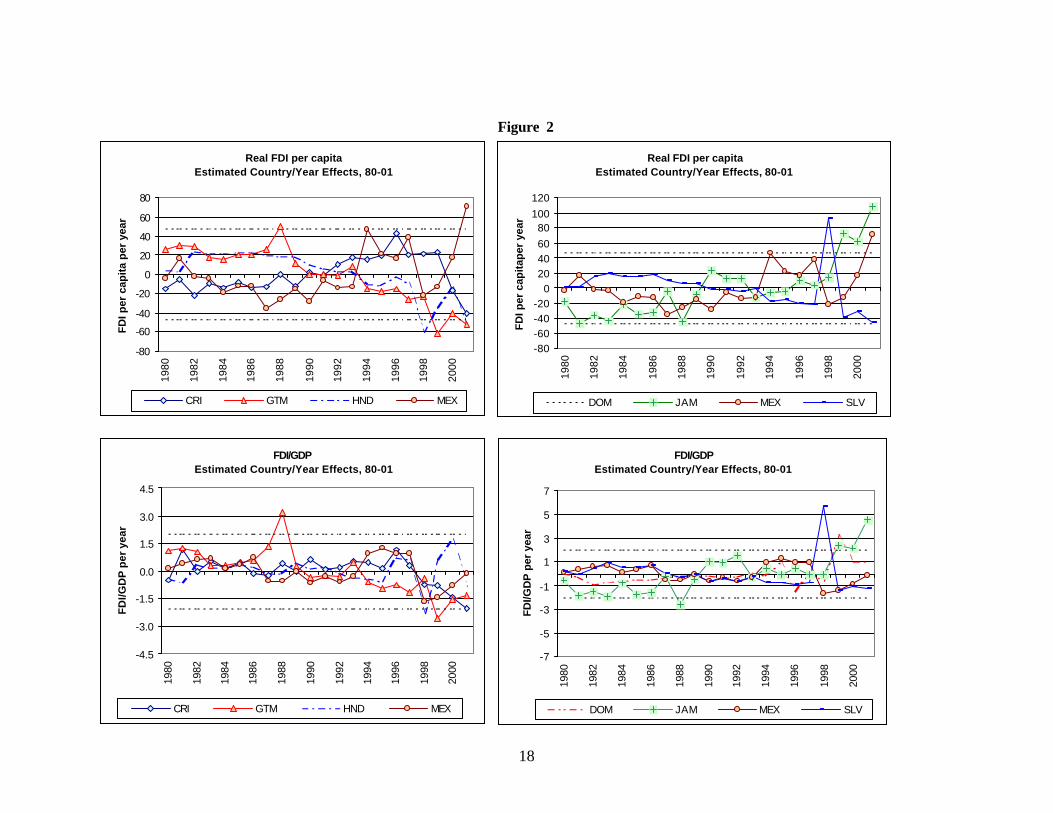
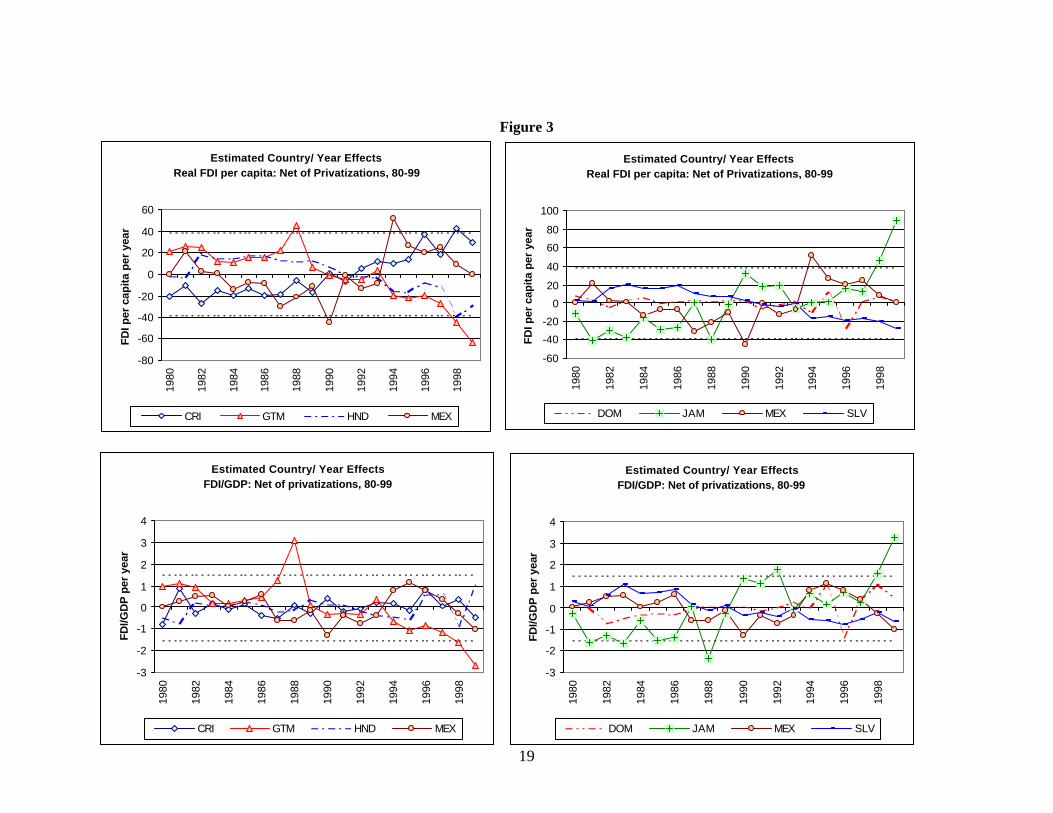
Figures 2 and 3 depict the country/year effects of Mexico and Central America and the Caribbean, along with their 10 percent significance bands, for the two measures of FDI employed. Figure 2 corresponds to the estimates based on total FDI inflows, while Figure 3 reflects those based on FDI inflows net of privatization. In both cases, the estimates correspond to the sample excluding South America.
The top half of Figure 2 presents the results using real per capita FDI. Between
1994 and 1997 Mexico’s year effects consistently exceed those of all other countries, with the only exception of Costa Rica. Over the rest of the 1990s, however, Costa Rica and Jamaica outperform Mexico in most years. These two countries exhibit positive time effects virtually throughout the 1990s. The graphs also show a clear spike in FDI to El Salvador in 1998, which reflects large privatization-related inflows in that year, and in Mexico in 2001 when using FDI per capita as the preferred measure. The bottom performers appear to be Guatemala and Honduras, with negative country-year effects during most of the 1990s when using per capita FDI. The information in terms of ratios to GDP, shown in the bottom half of the table, is qualitatively similar, although with this measure the performance of Honduras appears considerably stronger.
Figure 3 turns to the data net of privatization FDI. The sample period now ends in
1999, and the main difference is the removal of the outlying observation for El Salvador mentioned earlier. Costa Rica and Jamaica appear emerge as performers on par with Mexico in the post NAFTA period, while Guatemala remains as the main underperformer over the 1990s.
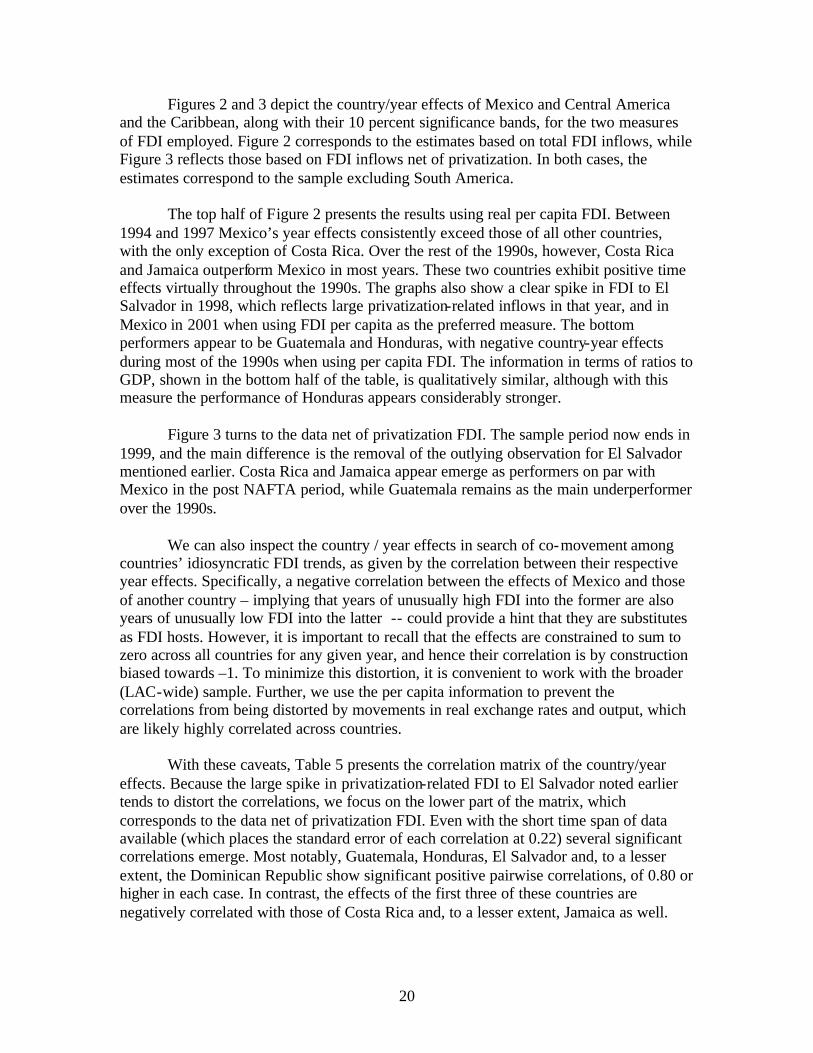
We can also inspect the country / year effects in search of co-movement among
countries’ idiosyncratic FDI trends, as given by the correlation between their respective year effects. Specifically, a negative correlation between the effects of Mexico and those of another country – implying that years of unusually high FDI into the former are also years of unusually low FDI into the latter -- could provide a hint that they are substitutes as FDI hosts. However, it is important to recall that the effects are constrained to sum to zero across all countries for any given year, and hence their correlation is by construction biased towards –1. To minimize this distortion, it is convenient to work with the broader (LAC-wide) sample. Further, we use the per capita information to prevent the correlations from being distorted by movements in real exchange rates and output, which are likely highly correlated across countries.
With these caveats, Table 5 presents the correlation matrix of the country/year
effects. Because the large spike in privatization-related FDI to El Salvador noted earlier tends to distort the correlations, we focus on the lower part of the matrix, which corresponds to the data net of privatization FDI. Even with the short time span of data available (which places the standard error of each correlation at 0.22) several significant correlations emerge. Most notably, Guatemala, Honduras, El Salvador and, to a lesser extent, the Dominican Republic show significant positive pairwise correlations, of 0.80 or higher in each case. In contrast, the effects of the first three of these countries are negatively correlated with those of Costa Rica and, to a lesser extent, Jamaica as well.
21
The latter two countries also show a positive correlation. As for Mexico, its effects are not significantly correlated with those of any other country in the table.
Table 5 Correlation of Estimated Country-Year Effects
What can we infer from these results ? They suggest the existence of a block of Central American countries sharing similar FDI trends -- Guatemala, Honduras and El Salvador. This may reflect a common pattern of specialization and/or FDI incentives across these economies. There is also some evidence of a second block, consisting of Costa Rica and Jamaica. Finally, there is very little suggestion of FDI reallocation from any of the countries shown towards Mexico, given the lack of any significant correlation between the time effects of Mexico and those of the other countries.
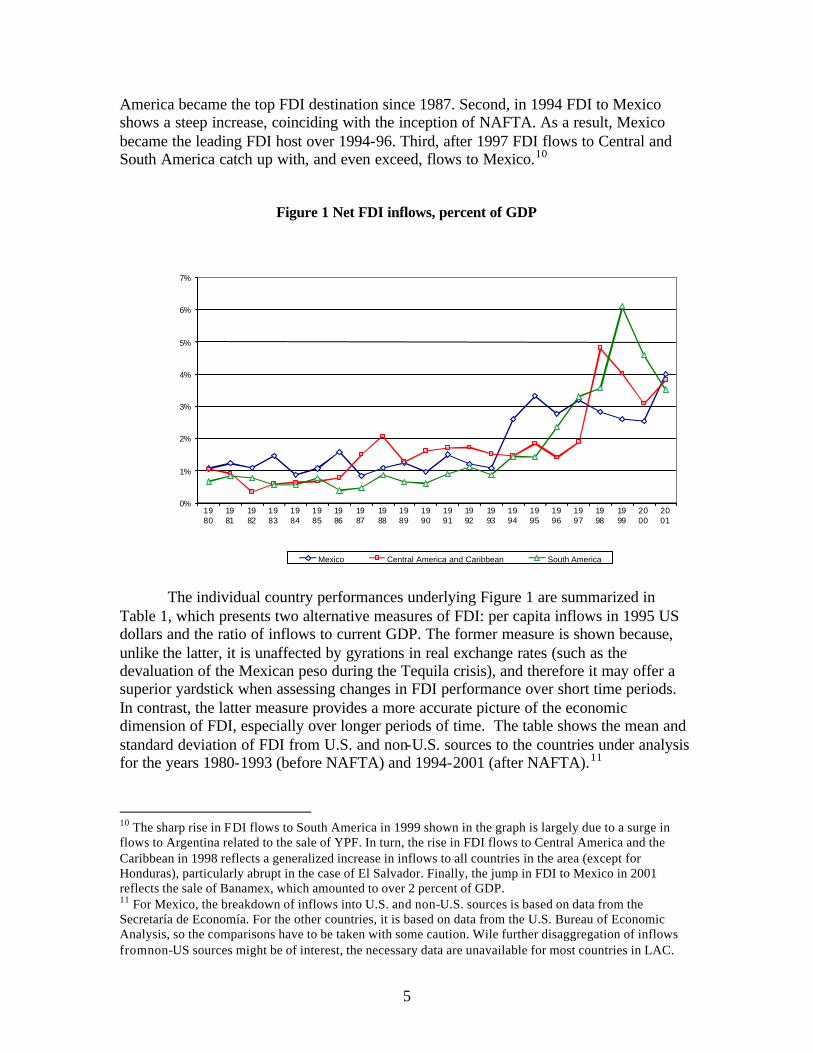
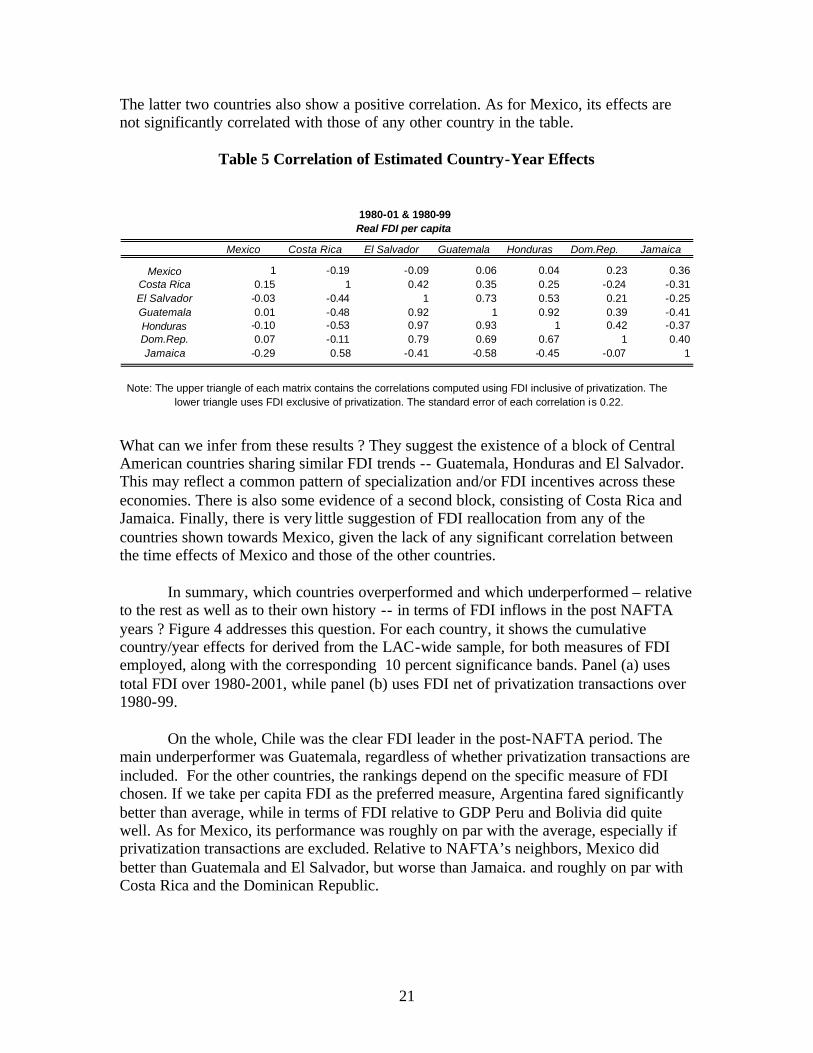
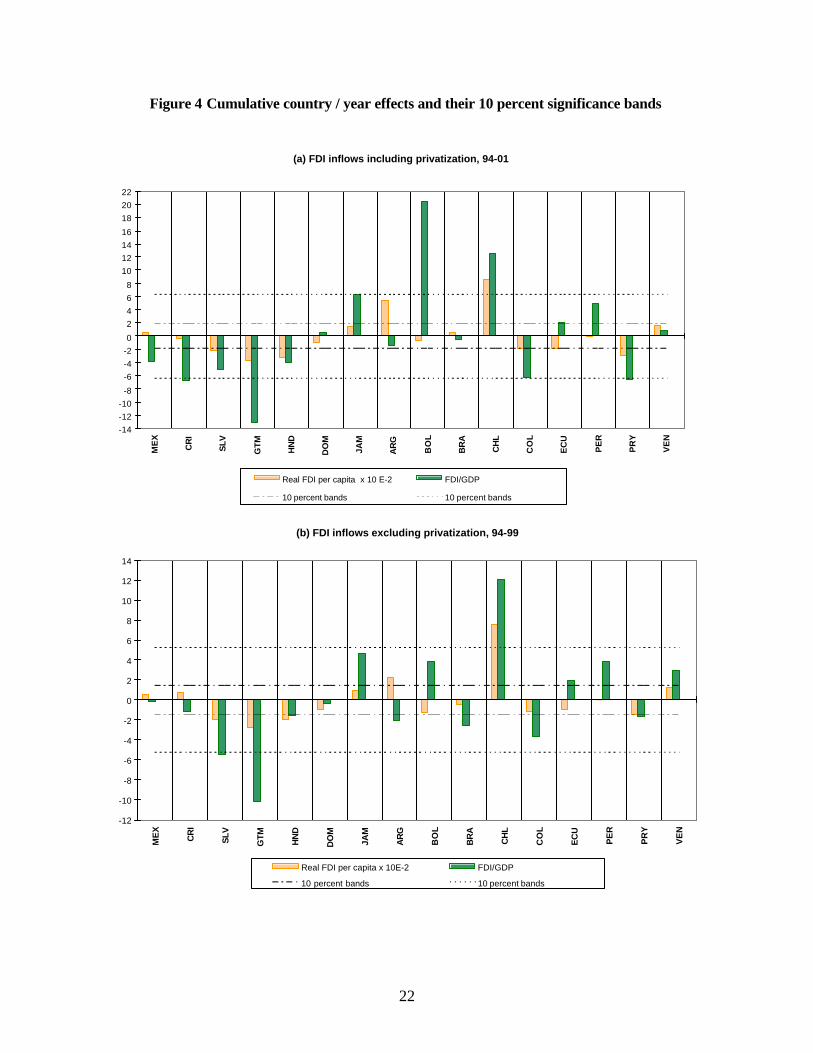
In summary, which countries overperformed and which underperformed – relative to the rest as well as to their own history -- in terms of FDI inflows in the post NAFTA years ? Figure 4 addresses this question. For each country, it shows the cumulative country/year effects for derived from the LAC-wide sample, for both measures of FDI employed, along with the corresponding 10 percent significance bands. Panel (a) uses total FDI over 1980-2001, while panel (b) uses FDI net of privatization transactions over 1980-99.
On the whole, Chile was the clear FDI leader in the post-NAFTA period. The
main underperformer was Guatemala, regardless of whether privatization transactions are included. For the other countries, the rankings depend on the specific measure of FDI chosen. If we take per capita FDI as the preferred measure, Argentina fared significantly better than average, while in terms of FDI relative to GDP Peru and Bolivia did quite well. As for Mexico, its performance was roughly on par with the average, especially if privatization transactions are excluded. Relative to NAFTA’s neighbors, Mexico did better than Guatemala and El Salvador, but worse than Jamaica. and roughly on par with Costa Rica and the Dominican Republic.
Mexico Costa Rica El Salvador Guatemala Honduras Dom.Rep. Jamaica Mexico 1 -0.19 -0.09 0.06 0.04 0.23 0.36
Costa Rica 0.15 1 0.42 0.35 0.25 -0.24 -0.31 El Salvador -0.03 -0.44 1 0.73 0.53 0.21 -0.25 Guatemala 0.01 -0.48 0.92 1 0.92 0.39 -0.41 Honduras -0.10 -0.53 0.97 0.93 1 0.42 -0.37 Dom.Rep. 0.07 -0.11 0.79 0.69 0.67 1 0.40 Jamaica -0.29 0.58 -0.41 -0.58 -0.45 -0.07 1
1980-01 & 1980-99
Real FDI per capita
Note: The upper triangle of each matrix contains the correlations computed using FDI inclusive of privatization. The lower triangle uses FDI exclusive of privatization. The standard error of each correlation is 0.22.
22
Figure 4 Cumulative country / year effects and their 10 percent significance bands
(b) FDI inflows excluding privatization, 94-99
-12
-10
-8
-6
-4
-2
0
2
4
6
8
10
12
14
ME
X
CR
I
SLV
GTM
HN
D
DO
M
JAM
AR
G
BO
L
BR
A
CH
L
CO
L
EC
U
PE
R
PR
Y
VE
N
Real FDI per capita x 10E-2 FDI/GDP
10 percent bands 10 percent bands
(a) FDI inflows including privatization, 94-01
-14
-12
-10
-8
-6
-4
-2
0
2
4
6
8
10
12
14
16
18
20
22
ME
X
CR
I
SLV
GT
M
HN
D
DO
M
JAM
AR
G
BO
L
BR
A
CH
L
CO
L
EC
U
PE
R
PR
Y
VE
N
Real FDI per capita x 10 E-2 FDI/GDP
10 percent bands 10 percent bands
23
To conclude this section, on the whole FDI trends do not give strong indication that flows were diverted from other Latin American countries towards Mexico in the post-NAFTA years. Regarding Mexico, the evidence reviewed here is in broad agreement with that shown in Chapter 4. We find an increase in FDI inflows to Mexico in the early years of NAFTA, after controlling for common trends and the country’s past FDI record. The rise tapers off at the end of the 1990s, which would be consistent with an FDI stock adjustment, a pattern similar to that encountered in Southern Europe at the time of EU enlargement. Over the post-NAFTA period as a whole, we also find that Mexico’s FDI performance was not significantly different from the Latin American norm. Other Latin American countries experienced comparable or larger FDI rises, even if privatization-related flows are ignored.
As for NAFTA’s neighboring countries, on average they did less well than
Mexico in the post-NAFTA years, although the difference is only significant when measuring FDI in real per capita terms. However, their individual FDI trends were quite diverse. If we take the privatization-exclusive FDI measures as our preferred yardstick, Guatemala and El Salvador performed significantly worse than the Latin American norm according to the measures reported, while Costa Rica did no different than the average and Jamaica and the Dominican Republic actually did better. This diversity in FDI performance among NAFTA’s neighboring countries – even though they all faced a common ‘NAFTA shock’ – suggests that, rather than (or in addition to) FDI diversion from the FTA, other country-specific factors were at work. This is explored next.
7.4 A broader view of FDI determinants in Central America and the Caribbean
We first review some non-FTA determinants of foreign investment of particular
relevance for NAFTA’s neighboring countries, and then place the impact of NAFTA in a broader context of FDI determination. 7.4.1 Trade patterns and FDI incentives in Central America
One potential factor behind the dissimilar FDI trends across Central American countries is the divergence in their respective patterns of specialization over the last decade. As already noted in the preceding chapter, Guatemala, along with Honduras and El Salvador, increasingly tilted the composition of exports towards apparel, while Costa Rica did the opposite and Jamaica experienced no significant change in this regard. Chapter 6 also noted that NAFTA granted Mexico a substantial tariff advantage in the apparel sector over the rest of the region, although the advantage was largely temporary, as the recent realignment of U.S. import preferences in the CBTPA moved Caribbean Basin countries closer to tariff parity with Mexico.
Did this preferential treatment of Mexico’s apparel sector significantly discourage
FDI inflows into the neighboring countries, as argued by some observers ? There are numerous indications, but little hard data, that the apparel industry has been a major
24
recipient of FDI in these economies (e.g., ECLAC 1999, Ch. 6).21 Thus, it is possible that the passage of NAFTA might have encouraged the redirection of further investment in the apparel sector to Mexico. However, it is very difficult to establish the order of magnitude of such an effect given the lack of adequate data.22 Furthermore, as Chapter 6 already stressed, it is also hard to disentangle the effects that NAFTA might have had in this regard from those of the Mexican devaluation of 1994, which resulted in a sharp increase in the wages of neighboring countries relative to those in Mexico. Relative wage costs have been found to play a major role in the location decisions of export-oriented multinational firms across Central America and the Caribbean (Woodward and Rolfe 1993), and they are also particularly relevant for textile firms, given the large weight of wages in total production cost. In any case, the fact that that the share of exports from these countries in NAFTA’s apparel market actually rose in the post-NAFTA years – as shown in Chapter 6 – suggests that FDI diversion effects associated with the apparel sector, if they existed, were not overly strong.
In contrast with the pattern followed by Guatemala, Honduras and El Salvador,
Costa Rica actively pursued the strategy of diversifying FDI away from traditional sectors. Significant volumes of FDI into Costa Rica went to the production of electric and electronic equipment, including computer components and software.23 In recent years, significant amounts have gone also to services, tourism and medical supplies (Robles-Cordero and Rodriguez-Clare 2003). The most celebrated case is that of INTEL, which is reviewed in detail in Box 2. Costa Rica’s ability to attract significant FDI into these nontraditional sectors has probably been a major factor in its solid aggregate FDI performance during the post-NAFTA years.
Aside from the sector destination of FDI, Central American and Caribbean countries have made extensive use of tax incentives to attract foreign investors. Such incentives are linked to the EPZs instituted by most countries.24 There is remarkable homogeneity in incentives across countries. One key difference lies in the taxation of 21 The available evidence is only indirect, and is given by the fact that most textile exports originate in EPZs, where the majority of firms -- most of which belong to the textile and apparel sector -- are foreign-owned. The exception in this regard is Costa Rica. See Esquivel, Jenkins and Larrain (1998). 22 In addition, one has to recall that policy initiatives towards “NAFTA parity” started to be discussed in the U.S. soon after passage of NAFTA (and even before), which suggests that the temporary nature of Mexico’s preferential treatment was widely recognized. This would have mitigated its impact on fixed investment decisions guided by longer-term prospects. 23 For all these goods, CBI and NAFTA provide equal benefits, so that exports from CBI countries enter the U.S. market on the same footing as competing goods from Mexico. This is not always the case in third markets, however, where some of these exports are sometimes viewed as being subsidized by EPZ benefits, and thus subject to exclusion from preferential treatment. This is reported in a recent study by PROCOMER-CINDE (the agencies promoting FDI and international trade in Costa Rica) which analyzes market access of goods produced in Costa Rica in the sectors listed in the text. The study finds that such goods (and hence those produced in any other country under the CBI/CBTPA umbrella) enter the U.S. market in the same conditions as if they were produced in Mexico, but face more obstacles in markets in Europe, South America and even Central America! 24 Details on EPZ incentives are given in a recent study by CINDE-PROCOMER (2001) and the Ph D thesis by Borbon-Guevara (2002), who compare the incentives provided by Costa Rica and other countries. See also Robles-Cordero and Rodriguez-Clare (2003).
25
profits. Mexico, like Chile, does not provide any exemption, and foreign investors are subject to the same 34% tax on profits as local firms. In contrast, the other countries fully exempt foreign firms from the profit tax for long periods of time, and in fact the main difference lies in the duration of the exemption period (Table 6).25 It is conceivable that these incentives might have contributed to offset potential FDI diversion effects from the treaty, although most of the EPZs’ legal codes were enacted before 1994, and were not altered in response to NAFTA – indeed, there was little margin for further profit tax concessions, since tax rates were already at zero.26
Table 6: Fiscal incentives to foreign investors Country Income Tax Exemption Years of Benefit México 0% (tax is 34%) n.a. Costa Rica 100% first, then 50% 8-12/4-6 Guatemala 100% 12-15 years El Salvador 100% 20 Honduras 100% Indefinite Dom. Republic 100% 15 to 20 Brazil 100% 3 to 10 Chile 0% (tax is 34%) n.a. Source: Borbon-Guevara (2000) and Robles-Cordero and Rodriguez-Clare (2003) How effective are these incentives ? The limited information available suggests
that EPZs attract much of the FDI accruing to Central American countries (Robles-Cordero and Rodriguez-Clare 2003). There is some evidence that EPZs and the associated tax concessions have an impact on export-oriented FDI location decisions. Studies by Woodward and Rolfe (1993), who examine location decisions in the Caribbean basin; Kumar (1994), who analyzes the location of U.S. multinationals across 40 countries; and Choi (1995), who examines the location of U.S.-owned textile plants across 47 countries, all conclude that the existence of EPZs tends to attract FDI. The first of these studies also finds that the length of tax holidays has a positive effect on location choices, while the second finds no conclusive evidence in this regard.
Tax and other concessions to FDI are not necessarily inefficient when foreign (as
opposed to domestic) investment involves positive externalities, through channels such as
25 In some cases (e.g., Costa Rica and Guatemala) the period of exemption depends on whether the plant locates in a low development region or not. In general, however, by reinventing/renaming themselves right before expiration of the exemption, it is quite possible that firms may be able to extend the exemption beyond the letter of the law. 26 However, some anecdotal evidence indicates that governments might have resorted to other forms of incentives, such as worker training, co-financing of some investments, more generous infrastructure provision, power subsidies etc.
26
technological spillovers. However, they have major limitations. First, tax regulations in the home country may prevent multinational firms from taking advantage of tax concessions enjoyed by the subsidiaries in other countries (Agosin and Machado 2000). Second, competition in tax and other concessions among FDI hosts can lead to a ‘race to the bottom’ whose outcome is an excessively low level of taxes in all countries without any stimulating effects on FDI. Incentives also involve potentially large costs in terms of foregone fiscal revenues, economic distortions, and enhanced scope for rent-seeking. Third, and most important, when the effectiveness of tax concessions in attracting FDI is examined in a broader empirical context including also ‘deep’ FDI determinants, such as productivity, macroeconomic stability, governance and institutional quality, available studies find that the latter factors have a larger and more robust impact than tax concessions on the cross-country distribution of FDI inflows. Incentives appear to make a difference only when the choice of location is made between competing jurisdictions for which those FDI fundamentals are roughly equivalent.27
From a practical perspective, a key issue is that income tax concessions to EPZs
in Central America and the Caribbean, with the exception of El Salvador, are linked to export performance, and as such they represent export subsidies contrary to WTO regulations –except when the concessions apply to firms producing services (such as call centers and ‘back-office’ services). Such schemes were to be dismantled by January 1st, 2003, although the deadline is likely to be extended for a few more years.
How should countries respond to this new situation ? In principle, they could
replace existing EPZ incentives with broader tax concessions to all foreign investors, regardless of export performance, or even to all investors, both domestic and foreign. But the first option would still imply an asymmetric treatment of local and foreign firms for which there is no clear justification, in view of the inconclusive evidence on the existence and significance of spillovers from foreign firms (see Chapter 5). As for the latter option, it would entail unacceptably high fiscal costs.
A more promising strategy would opt for uniform taxation to all firms, possibly
supported by a region-wide agreement to prevent tax competition, and focus on strengthening the FDI fundamentals mentioned earlier – macroeconomic stability, productivity growth and the quality of the institutional and regulatory framework. The empirical role of these fundamentals in FDI flows is discussed next.
7.4.2 The relative appeal of alternative FDI destinations
Trade preferences and tax concessions are only two among many ingredients that determine the allocation of FDI across developing countries. Other factors also matter, or matter even more.28 Conceptually, foreign investment flows can be viewed as reflecting
27 See Morisset and Pirnia (2002) for an overview of the literature on the effectiveness of tax incentives, and Stein and Daude (2001) for some recent econometric evidence. 28 This is clearly illustrated by the results of a survey of Costa Rican textile forms reported by Monge (2002). While some respondents did mention trade agreements and EPZs as important factors in their
27
the portfolio decisions of international investors regarding the location of their assets. Broadly speaking, these depend on two types of factors. First, global factors, which affect the willingness of international investors to invest in developing countries. Thus, global factors cause FDI to change across a broad range of countries. Second, local factors, which are country-specific and affect primarily the decision to invest in each host country. Global factors relate to required rates of return and risk perceptions in world financial markets, as reflected by industrial-country interest rates and term and risk premia. In turn, local factors capture the anticipated return and risk associated with FDI into specific host countries. They measure ingredients such as host country productivity, economic volatility and institutional quality. 29
This framework provides a guide to the allocation of a worldwide pool of FDI
resources across individual hosts. It is useful to recast it in terms of the relative attractiveness of each host country. In this context the latter can be summarized by two key variables: the anticipated return to FDI in each host country relative to the rest, and the perceived risk associated with FDI in each host, also relative to the rest. Other things equal, a higher relative return attracts FDI into the country offering it, while a higher relative risk redirects inflows to other host countries. This serves to underscore that, in addition to global factors impinging on worldwide FDI, what matters for the allocation of FDI inflows is not just the absolute appeal of each host, but its position vis-à-vis other hosts in terms of both level and volatility of investment returns.
It is useful to examine the predictions of this framework regarding the allocation
of FDI across Latin America.30 For this purpose, we construct a synthetic index of return as a weighted average of: (i) productivity growth, measured by per capita GDP growth31; (ii) market size and scale economies, measured by total population; (iii) openness, measured by the ratio of imports plus exports to GDP at constant prices; (iv) market distortions, measured by the premium in the black market on foreign exchange; (v) governance and institutional quality, proxied by the Kaufmann governance index and the Gastil civil liberties index; and (vii) overall tax burden, proxied by general government consumption as a ratio to GDP. In chapter 4 we already saw that many of these variables are significant determinants of FDI inflows.
Likewise, we construct a synthetic risk index summarizing four main ingredients:
(i) overall macroeconomic stability, measured by the standard deviation of the rate of growth of GDP per capita; (ii) monetary and price stability, captured by the inflation rate and its standard deviation; (iii) external sector instability, measured by the standard deviation of real exchange rate changes, terms of trade shocks, and the openness measure
decision to locate in a specific country, a number of other factors – from wage costs to infrastructure and availability of skilled labor – were mentioned by a larger number of survey participants. 29 This framework and its empirical validation are spelled out in detail in Albuquerque, Loayza and Servén (2002). They show that while both local and global factors play a significant role in determining the worldwide allocation of FDI (each accounts for roughly half of the total explained variation) global factors have become increasingly important in recent years as a result of rising world financial integration. 30 The material that follows is a brief summary of Albuquerque, Loayza and Servén (2002) and Calderón, Loayza and Servén (2003). 31 Using instead a measure of TFP growth leads to analogous results.
28
above; and (iv) [lack of] governance and overall institutional quality, measured by the inverse of the two variables in (v) above.32 Again, some of these variables were already encountered in Chapter 4.
To highlight the key role of relative return and risk, each country’s index is
expressed in terms of deviation from the (average) index of the other countries in the sample. Finally, to complete the empirical framework, we add a scale measure of FDI (namely, worldwide FDI outflows relative to world GDP) and the global financial factors mentioned above, which for added simplicity are represented by their first two principal components.33
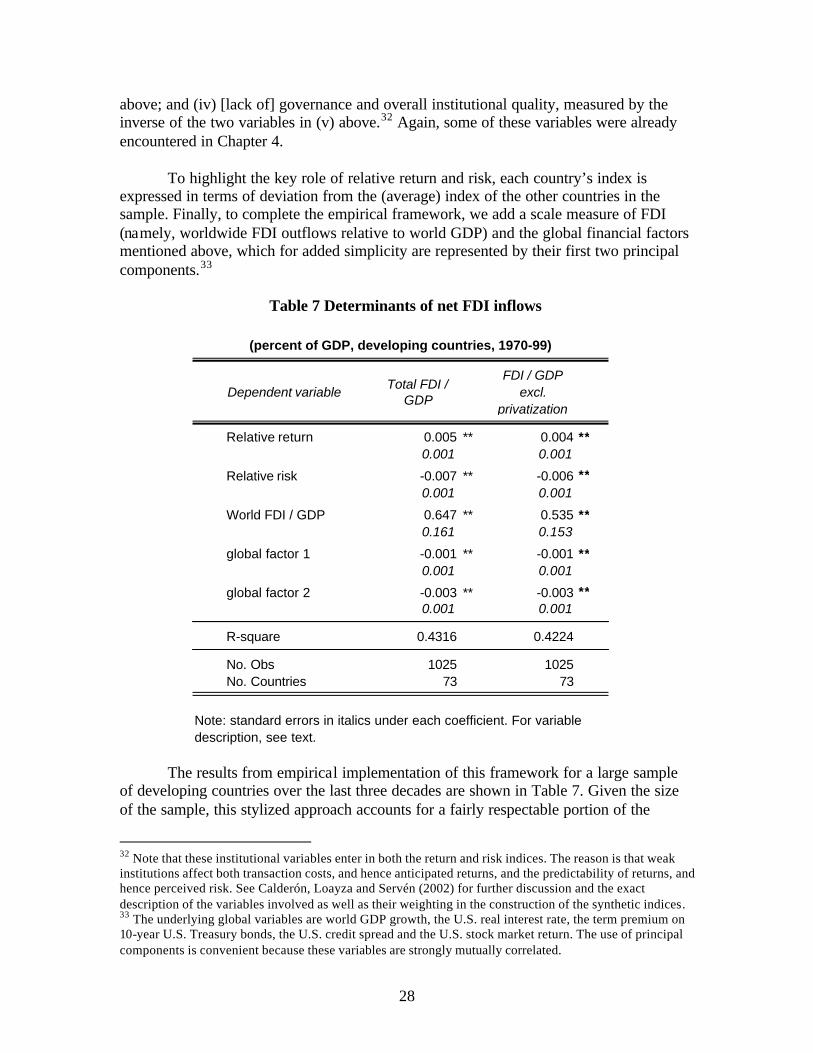
Table 7 Determinants of net FDI inflows
The results from empirical implementation of this framework for a large sample
of developing countries over the last three decades are shown in Table 7. Given the size of the sample, this stylized approach accounts for a fairly respectable portion of the
32 Note that these institutional variables enter in both the return and risk indices. The reason is that weak institutions affect both transaction costs, and hence anticipated returns, and the predictability of returns, and hence perceived risk. See Calderón, Loayza and Servén (2002) for further discussion and the exact description of the variables involved as well as their weighting in the construction of the synthetic indices. 33 The underlying global variables are world GDP growth, the U.S. real interest rate, the term premium on 10-year U.S. Treasury bonds, the U.S. credit spread and the U.S. stock market return. The use of principal components is convenient because these variables are strongly mutually correlated.
Dependent variable Total FDI / GDP
FDI / GDP excl.
privatization
Relative return 0.005 ** 0.004 **0.001 0.001
Relative risk -0.007 ** -0.006 **0.001 0.001
World FDI / GDP 0.647 ** 0.535 **0.161 0.153
global factor 1 -0.001 ** -0.001 **0.001 0.001
global factor 2 -0.003 ** -0.003 **0.001 0.001
R-square 0.4316 0.4224
No. Obs 1025 1025No. Countries 73 73
Note: standard errors in italics under each coefficient. For variabledescription, see text.
(percent of GDP, developing countries, 1970-99)
29
observed variation in FDI flows. Most importantly, the results show that higher relative returns attract FDI, while higher relative risk deters it. Higher interest rates and risk premia in world markets also deter FDI, as implied by the negative coefficients on the synthetic global factors. Lastly, the coefficient on the scale variable is highly significant and below one, reflecting the fact that not all FDI hosts are included in the sample (which in fact excludes industrial countries) and, when privatization transactions are omitted, the significant role of privatization-related flows in worldwide FDI flows.
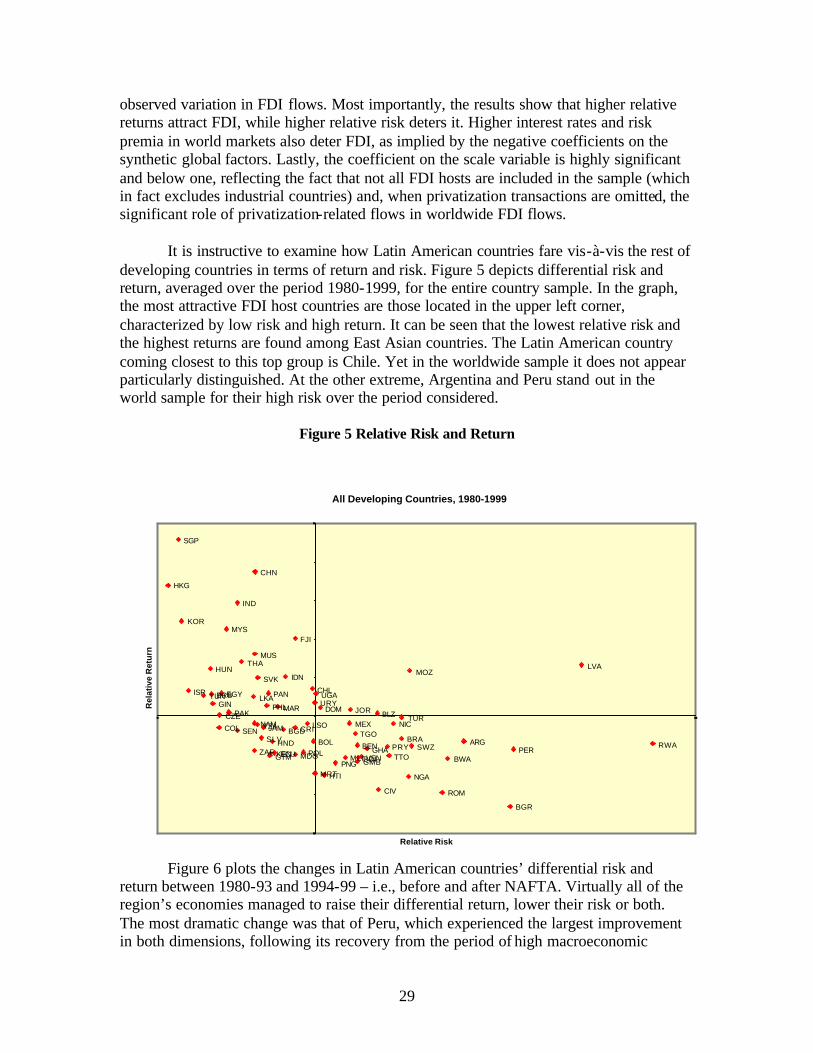
It is instructive to examine how Latin American countries fare vis-à-vis the rest of
developing countries in terms of return and risk. Figure 5 depicts differential risk and return, averaged over the period 1980-1999, for the entire country sample. In the graph, the most attractive FDI host countries are those located in the upper left corner, characterized by low risk and high return. It can be seen that the lowest relative risk and the highest returns are found among East Asian countries. The Latin American country coming closest to this top group is Chile. Yet in the worldwide sample it does not appear particularly distinguished. At the other extreme, Argentina and Peru stand out in the world sample for their high risk over the period considered.
Figure 5 Relative Risk and Return
Figure 6 plots the changes in Latin American countries’ differential risk and return between 1980-93 and 1994-99 – i.e., before and after NAFTA. Virtually all of the region’s economies managed to raise their differential return, lower their risk or both. The most dramatic change was that of Peru, which experienced the largest improvement in both dimensions, following its recovery from the period of high macroeconomic
All Developing Countries, 1980-1999
ZAF
URYUGA
TZATUR
TUN
TTO
THA
TGO
SWZ
SVK
SGP
SEN
RWA
ROM
POLPNG
PHL
PAN
PAKNIC
NGA
NAM
MYS
MUS
MRT
MOZ
MLIMDG
MAR
LVA
LSO
LKA
KOR
KEN
JOR
ISR
IND
IDNHUN
HTI
HKG
GMB
GIN
GHA
FJI
EGY
CZE
COL
CIV
CHN
BWA
BRB
BLZ
BGR
BGD
BEN
BDI
SLVJAM
HND
GTM
CRIMEX
DOM
VENPRY PERECU
CHL
BRABOL ARG
- 1 . 0
- 0 . 8
- 0 . 5
- 0 . 3
0 . 0
0 . 3
0 . 5
0 . 8
1 . 0
0.0
0.3
0.5
0.8
1.0
1.3
1.5
1.8
2.0
Relative Risk
Rel
ativ
e R
etu
rn
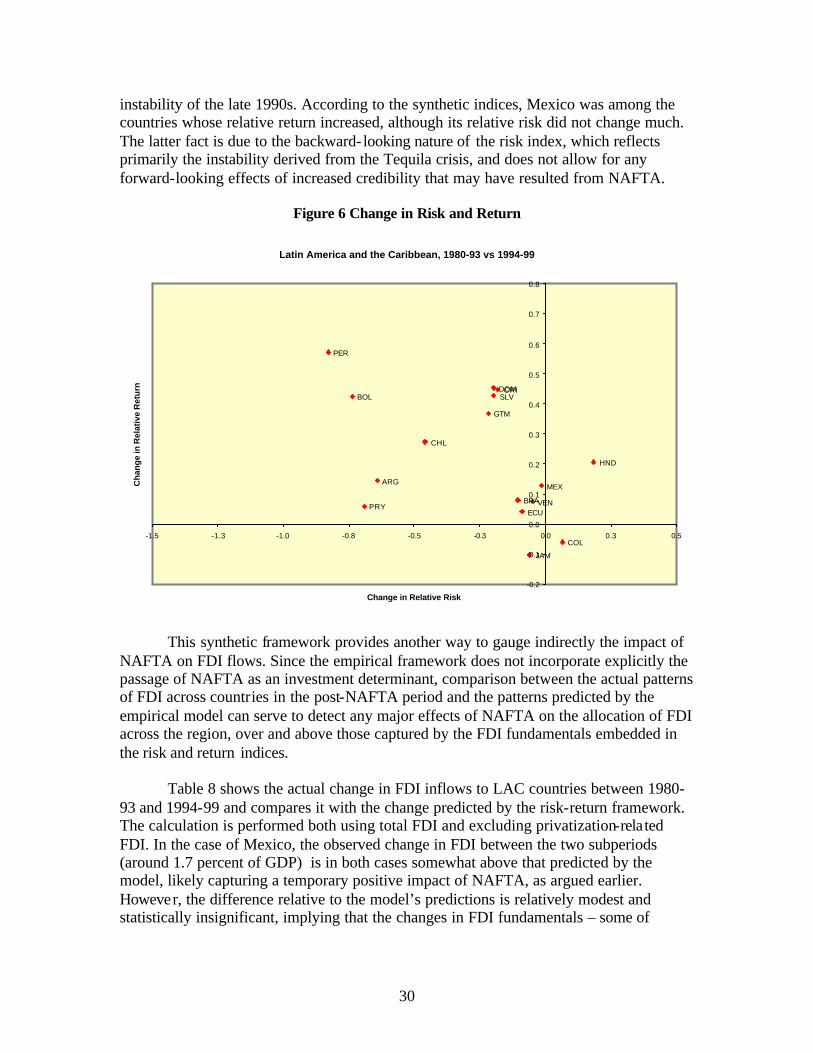
30
instability of the late 1990s. According to the synthetic indices, Mexico was among the countries whose relative return increased, although its relative risk did not change much. The latter fact is due to the backward- looking nature of the risk index, which reflects primarily the instability derived from the Tequila crisis, and does not allow for any forward-looking effects of increased credibility that may have resulted from NAFTA.
Figure 6 Change in Risk and Return
This synthetic framework provides another way to gauge indirectly the impact of
NAFTA on FDI flows. Since the empirical framework does not incorporate explicitly the passage of NAFTA as an investment determinant, comparison between the actual patterns of FDI across countries in the post-NAFTA period and the patterns predicted by the empirical model can serve to detect any major effects of NAFTA on the allocation of FDI across the region, over and above those captured by the FDI fundamentals embedded in the risk and return indices.
Table 8 shows the actual change in FDI inflows to LAC countries between 1980-
93 and 1994-99 and compares it with the change predicted by the risk-return framework. The calculation is performed both using total FDI and excluding privatization-related FDI. In the case of Mexico, the observed change in FDI between the two subperiods (around 1.7 percent of GDP) is in both cases somewhat above that predicted by the model, likely capturing a temporary positive impact of NAFTA, as argued earlier. However, the difference relative to the model’s predictions is relatively modest and statistically insignificant, implying that the changes in FDI fundamentals – some of
Latin America and the Caribbean, 1980-93 vs 1994-99
ARG
BOL
BRA
CHL
COL
ECU
PER
PRY VEN
MEX
CRIDOM
GTM
HND
JAM
SLV
-0.2
-0.1
0.0
0.1
0.2
0.3
0.4
0.5
0.6
0.7
0.8
-1.5 -1.3 -1.0 -0.8 -0.5 -0.3 0.0 0.3 0.5
Change in Relative Risk
Ch
ang
e in
Rel
ativ
e R
etu
rn
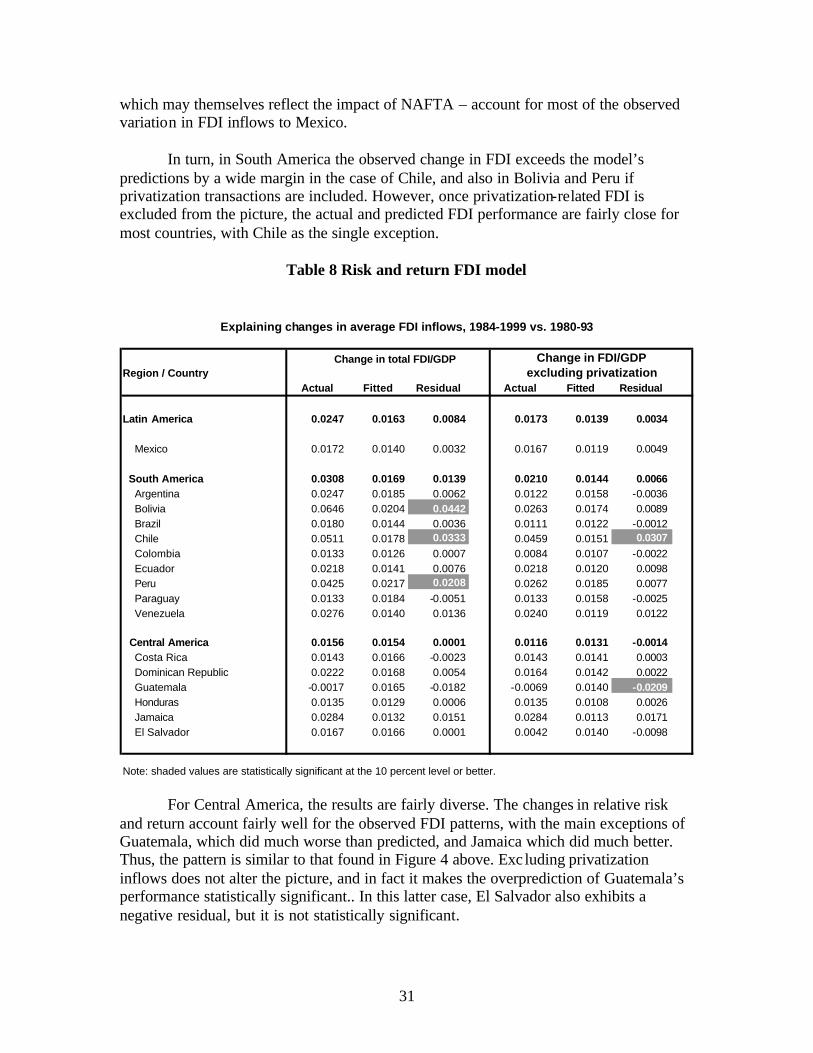
31
which may themselves reflect the impact of NAFTA – account for most of the observed variation in FDI inflows to Mexico.
In turn, in South America the observed change in FDI exceeds the model’s
predictions by a wide margin in the case of Chile, and also in Bolivia and Peru if privatization transactions are included. However, once privatization-related FDI is excluded from the picture, the actual and predicted FDI performance are fairly close for most countries, with Chile as the single exception.
Table 8 Risk and return FDI model
For Central America, the results are fairly diverse. The changes in relative risk
and return account fairly well for the observed FDI patterns, with the main exceptions of Guatemala, which did much worse than predicted, and Jamaica which did much better. Thus, the pattern is similar to that found in Figure 4 above. Exc luding privatization inflows does not alter the picture, and in fact it makes the overprediction of Guatemala’s performance statistically significant.. In this latter case, El Salvador also exhibits a negative residual, but it is not statistically significant.
Region / Country Actual Fitted Residual Actual Fitted Residual
Latin America 0.0247 0.0163 0.0084 0.0173 0.0139 0.0034
Mexico 0.0172 0.0140 0.0032 0.0167 0.0119 0.0049
South America 0.0308 0.0169 0.0139 0.0210 0.0144 0.0066 Argentina 0.0247 0.0185 0.0062 0.0122 0.0158 -0.0036 Bolivia 0.0646 0.0204 0.0442 0.0263 0.0174 0.0089 Brazil 0.0180 0.0144 0.0036 0.0111 0.0122 -0.0012 Chile 0.0511 0.0178 0.0333 0.0459 0.0151 0.0307 Colombia 0.0133 0.0126 0.0007 0.0084 0.0107 -0.0022 Ecuador 0.0218 0.0141 0.0076 0.0218 0.0120 0.0098 Peru 0.0425 0.0217 0.0208 0.0262 0.0185 0.0077 Paraguay 0.0133 0.0184 -0.0051 0.0133 0.0158 -0.0025 Venezuela 0.0276 0.0140 0.0136 0.0240 0.0119 0.0122
Central America 0.0156 0.0154 0.0001 0.0116 0.0131 -0.0014 Costa Rica 0.0143 0.0166 -0.0023 0.0143 0.0141 0.0003 Dominican Republic 0.0222 0.0168 0.0054 0.0164 0.0142 0.0022 Guatemala -0.0017 0.0165 -0.0182 -0.0069 0.0140 -0.0209 Honduras 0.0135 0.0129 0.0006 0.0135 0.0108 0.0026 Jamaica 0.0284 0.0132 0.0151 0.0284 0.0113 0.0171 El Salvador 0.0167 0.0166 0.0001 0.0042 0.0140 -0.0098
Note: shaded values are statistically significant at the 10 percent level or better.
Explaining changes in average FDI inflows, 1984-1999 vs. 1980-93
Change in total FDI/GDP Change in FDI/GDP excluding privatization
32
Thus, except for the extreme cases of Guatemala and Chile, the changes in risk and return FDI fundamentals account fairly well for the observed changes in the pattern of FDI flows to most Latin American and Caribbean countries after 1993. This of course does not mean that NAFTA had no independent effects on such patterns, but rather that the effects of the treaty are largely captured by those changing fundamentals. For example, most of the increase in Mexico’s return index between the pre- and post-NAFTA periods noted earlier can be traced to the increase in the economy’s openness over those years, when it practically doubled. Such increase in openness was very likely helped by NAFTA, as argued in Chapters 4 and 6.34 But for the rest of the countries the observed changes in FDI inflows generally reflect a number of different factors, both local and global. In particular, once we control for the risk and return determinants of FDI, no systematic pattern of FDI underperformance is visible in the data for the neighboring countries of Central America and the Caribbean. 7.5 Concluding remarks
This chapter has examined trends in FDI inflows across Latin America before and after NAFTA in search for evidence of FDI diversion. On the whole, we do not find clear evidence that the FTA led to a significant slowdown in investment flows to Latin American countries in general and the neighboring countries of Central America and the Caribbean in particular. While some of the latter countries did experience a relative slowdown in FDI inflows in the post-NAFTA years, other countries in the area performed on par or even better than Mexico. This suggests that country-specific features and policies, aside from (or in addition to) NAFTA, have played a major role in the changing pattern of FDI inflows across the region. Indeed, a simple empirical framework encompassing fundamental FDI determinants – the anticipated return and perceived risk from investing in different host countries – can account for much of the FDI variation before and after NAFTA.
The analysis in this chapter provides also a perspective on the potential effects on FDI inflows from a NAFTA expansion to other LAC countries and/or a future FTAA. Like in the cases of Mexico with NAFTA and Southern Europe with the EU, entry of other neighboring countries into an FTAA would likely cause an increase in their FDI inflows – although, like in those cases as well, the increase might be only temporary, reflecting a stock adjustment. The relatively low volume of FDI relative to trade in Latin America compared with the EU suggests that the FTAA offers the scope for a considerable increase in FDI to the region, both from within and outside the FTAA. It is also likely to encourage further concentration of investment in a few countries.35
However, the available evidence on RIAs and foreign investment also suggests
that the likelihood and magnitude of an FDI increase to RIA newcomers rises with their attractiveness.36 Unstable countries with low productivity, distorted policies and weak institutions are unlikely to draw much FDI benefit from joining a RIA. As Chapter 4
34 They key role of openness for Mexico’s FDI performance was already identified in Chapter 4 above. 35 Venables and Winters (2002). 36 Levy-Yeyati, Stein and Daude (2002).
33
discussed, countries with strong institutions protecting investors’ rights, a stable macroeconomic environment and open trade regimes are much more likely to reap large gains from FTAA membership.
Ultimately, FTAs are neither necessary nor sufficient for countries to attract
increased FDI inflows. Some leading FDI hosts, such as Chile, did not need to enter into a RIA to become top investment destinations. At the other end, Greece’s entry into the EU did not earn it the FDI dividends that Spain and Portugal collected. FTA membership does not make up for bad policies. It is a complement, rather than a substitute, for an investment- friendly policy and institutional environment. Thus, for countries hoping to benefit from RIA-induced investment creation, the prospect of an upcoming RIA requires renewed effort on reforms aimed at improving investment fundamentals: economic and policy stability, productivity, institutions and governance. Along some of these dimensions -- the latter in particular -- many Latin American and Caribbean countries still score quite poorly vis-à-vis other developing regions such as East Asia.
This strategy towards FDI stands in contrast with the alternative of engaging instead in an aggressive ‘incentive race’, in which countries compete with each other in terms of tax and other concessions to attract FDI flows. As already mentioned, tax concessions do have some effect on FDI location decisions, and many countries tend to combine both strategies to some extent. FDI incentives are predicated on the basis of positive externalities from foreign investment, which are hard to identify and quantify, and as a result incentives are likely to be excessive in many cases. However, the empirical evidence also suggests that FDI-specific incentives are less effective in attracting investment than investment-friendly policies and institutions, which should be the primary concern of the authorities. Any incentives offered on top of this should be rules-based, and available on equal terms to all investors irrespective of industry and nationality of investor.
In the end, for host countries the key concern is not the volume of FDI they may
receive, but the benefits tha t it will bring to their economies. This means that reforms in anticipation of an FTAA have to focus also on the key determinants of those benefits, even if they do not directly affect the volume of FDI inflows. If, as commonly believed, FDI has beneficial effects in terms of technological and knowledge spillovers (although evidence of their existence is far from conclusive), sufficient levels of human capital and an adequate knowledge and innovation system need to be in place for the domestic economy to absorb them. 37 This means that, as argued in Chapter 5, knowledge and innovation policies are a major item in the reform agenda.
37 This is underscored by Blomstrom and Kokko (2003).
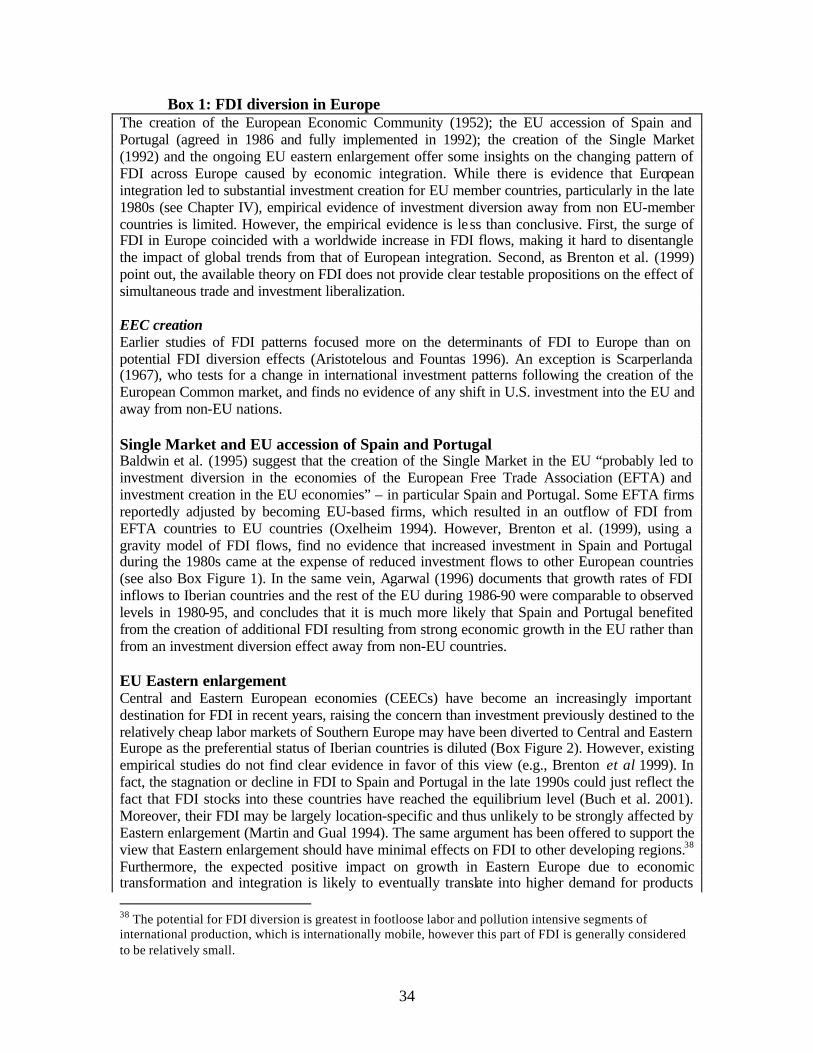
34
Box 1: FDI diversion in Europe The creation of the European Economic Community (1952); the EU accession of Spain and Portugal (agreed in 1986 and fully implemented in 1992); the creation of the Single Market (1992) and the ongoing EU eastern enlargement offer some insights on the changing pattern of FDI across Europe caused by economic integration. While there is evidence that European integration led to substantial investment creation for EU member countries, particularly in the late 1980s (see Chapter IV), empirical evidence of investment diversion away from non EU-member countries is limited. However, the empirical evidence is le ss than conclusive. First, the surge of FDI in Europe coincided with a worldwide increase in FDI flows, making it hard to disentangle the impact of global trends from that of European integration. Second, as Brenton et al. (1999) point out, the available theory on FDI does not provide clear testable propositions on the effect of simultaneous trade and investment liberalization. EEC creation Earlier studies of FDI patterns focused more on the determinants of FDI to Europe than on potential FDI diversion effects (Aristotelous and Fountas 1996). An exception is Scarperlanda (1967), who tests for a change in international investment patterns following the creation of the European Common market, and finds no evidence of any shift in U.S. investment into the EU and away from non-EU nations. Single Market and EU accession of Spain and Portugal Baldwin et al. (1995) suggest that the creation of the Single Market in the EU “probably led to investment diversion in the economies of the European Free Trade Association (EFTA) and investment creation in the EU economies” – in particular Spain and Portugal. Some EFTA firms reportedly adjusted by becoming EU-based firms, which resulted in an outflow of FDI from EFTA countries to EU countries (Oxelheim 1994). However, Brenton et al. (1999), using a gravity model of FDI flows, find no evidence that increased investment in Spain and Portugal during the 1980s came at the expense of reduced investment flows to other European countries (see also Box Figure 1). In the same vein, Agarwal (1996) documents that growth rates of FDI inflows to Iberian countries and the rest of the EU during 1986-90 were comparable to observed levels in 1980-95, and concludes that it is much more likely that Spain and Portugal benefited from the creation of additional FDI resulting from strong economic growth in the EU rather than from an investment diversion effect away from non-EU countries. EU Eastern enlargement Central and Eastern European economies (CEECs) have become an increasingly important destination for FDI in recent years, raising the concern than investment previously destined to the relatively cheap labor markets of Southern Europe may have been diverted to Central and Eastern Europe as the preferential status of Iberian countries is diluted (Box Figure 2). However, existing empirical studies do not find clear evidence in favor of this view (e.g., Brenton et al 1999). In fact, the stagnation or decline in FDI to Spain and Portugal in the late 1990s could just reflect the fact that FDI stocks into these countries have reached the equilibrium level (Buch et al. 2001). Moreover, their FDI may be largely location-specific and thus unlikely to be strongly affected by Eastern enlargement (Martin and Gual 1994). The same argument has been offered to support the view that Eastern enlargement should have minimal effects on FDI to other developing regions.38 Furthermore, the expected positive impact on growth in Eastern Europe due to economic transformation and integration is likely to eventually translate into higher demand for products 38 The potential for FDI diversion is greatest in footloose labor and pollution intensive segments of international production, which is internationally mobile, however this part of FDI is generally considered to be relatively small.
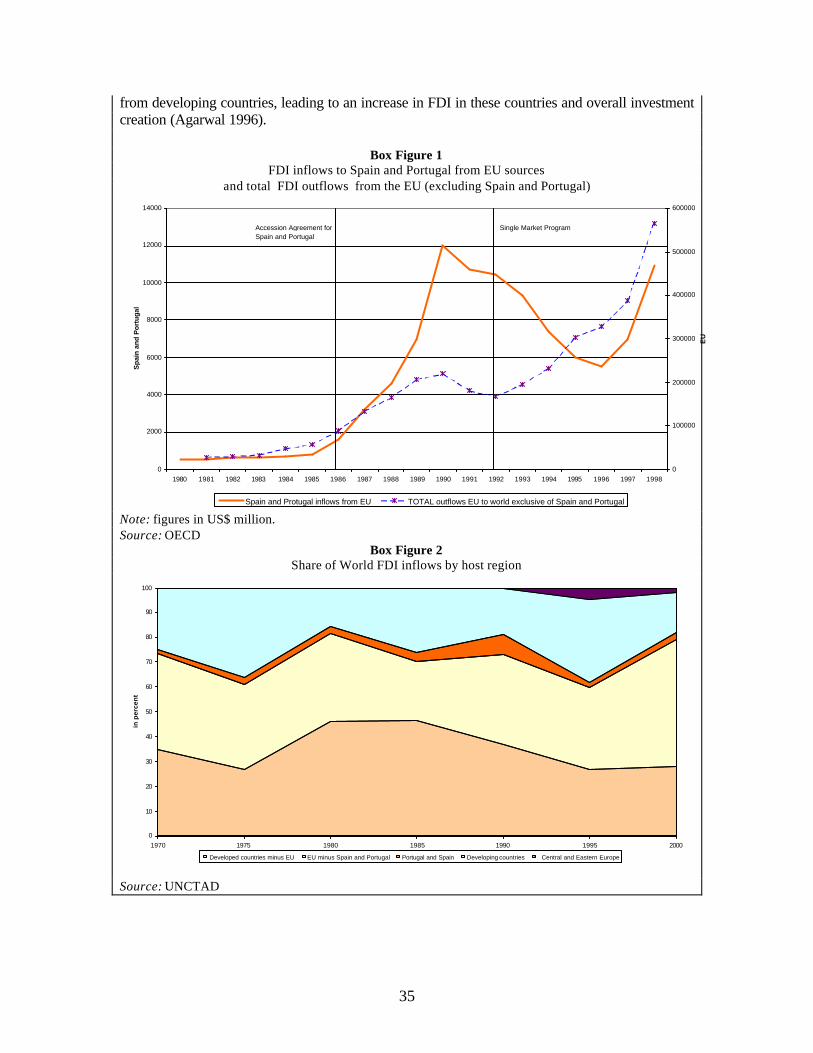
35
from developing countries, leading to an increase in FDI in these countries and overall investment creation (Agarwal 1996).
Box Figure 1 FDI inflows to Spain and Portugal from EU sources
and total FDI outflows from the EU (excluding Spain and Portugal)
0
2000
4000
6000
8000
10000
12000
14000
1980 1981 1982 1983 1984 1985 1986 1987 1988 1989 1990 1991 1992 1993 1994 1995 1996 1997 1998
Sp
ain
an
d P
ort
ug
al
0
100000
200000
300000
400000
500000
600000
EU
Spain and Protugal inflows from EU TOTAL outflows EU to world exclusive of Spain and Portugal
Accession Agreement for Spain and Portugal
Single Market Program
Note: figures in US$ million. Source: OECD
Box Figure 2 Share of World FDI inflows by host region
0
10
20
30
40
50
60
70
80
90
100
1970 1975 1980 1985 1990 1995 2000
in p
erce
nt
Developed countries minus EU EU minus Spain and Portugal Portugal and Spain Developing countries Central and Eastern Europe
Source: UNCTAD
36
Box 2: Costa Rica vs. Mexico in the INTEL race39
Intel’s decision in 1997 choosing Costa Rica to locate a large production plant -- 400,000 square feet, employing up to 2,000 people to assemble and test the latest microprocessors – illustrates the factors that affect the quantity and composition of FDI. First, it shows the region’s potential to attract foreign investment into sectors that until then had been beyond its reach. However, it also highlights barriers to foreign investment that need to be removed. Finally, it shows that membership of an RIA with the source country and target market may be a relevant factor but not a determinant one. Costa Rica was included in Intel’s preliminary list of potential investment sites largely due to the active efforts of CINDE (Coalición Costarricense de Iniciativas para el Desarrollo), which since the late 1980s had switched its FDI-attracting strategy from general promotion of the country to targeting a specific groups of potential investors. At first it (successfully) targeted textile producers, but later, as the wages and labor benefits of Costa Rica put it in no position to compete with cheap-labor economies, CINDE switched to electronics, and among other large companies it approached Intel as early as 1993 (Spar 1998). Costa Rica’s political stability, geographical advantage, and the quality of its labor force, earned the country a spot in Intel’s initial list, which included also Argentina, Brazil, Chile, China, India, Indonesia, Korea, Mexico, Puerto Rico, Singapore, Taiwan, and Thailand. Next in the selection procedure, countries were dropped from the list if they failed to offer workable conditions regarding wages, labor benefits, taxes, tariffs and regulations for capital repatriation. As all output was intended for export, tariffs and customs fees were particularly important. On the basis of these criteria, the list was first narrowed to Brazil, Chile, Costa Rica, and Mexico. By mid-1996, the list was narrowed further to only two contenders, Costa Rica and Mexico. By the end of 1996, Intel announced its decision to build the plant in Costa Rica, and construction began in April 1997. In retrospect, the studies by Spar (1998) and Larrain et. al (2001) suggest that three main factors led to the selection of Costa Rica over Mexico. First, Costa Rican authorities responded promptly to Intel’s concerns, which involved the inadequacies of the country’s physical and educational infrastructures. Regarding education, while human capital indicators in Costa Rica outdid those of Mexico, they were not sufficient to support Intel's personnel needs. On infrastructure, the main problem was in the transport sector. The capacity and frequency of flights of the main airport were deemed inadequate, as was highway access from the plant’s prospective location. Furthermore, the high cost of electricity was an additional concern. The Costa Rican authorities moved swiftly to address all these issues. On education, a joint team of government officials and Intel identified the gaps in Costa Rica's educational system and proposed specific actions for improving technical skills and language training. On transport, the authorities granted more licenses to foreign carriers, accelerated plans for a new cargo terminal, and agreed to help improving access to the highway. A two-tier industrial rate structure was established for power, giving larger users like Intel more favorable pricing. The active efforts of the authorities may have been encouraged by the large magnitude of the prospective investment relative to Costa Rica’s economy, making the country’s small size an asset rather than an obstacle for attracting FDI.
37
Second, Costa Rica’s system of fiscal incentives was aggressive and credible. It had successfully attracted other foreign firms. Political stability and the authorities’ firm strategy of inserting the country’s economy into international markets convinced investors that the incentives would remain in place for the long term. In contrast, Mexico’s incentives were less generous, and the credibility of its attempt to offer special tax breaks was undermined by their discretional nature. A third factor was the requirement in Mexico that investors be subject to a system of mandatory union rules. Intel’s plants are union-free, so allowing an exception could have triggered unionization elsewhere. According to Spar (1998), Mexican authorities offered to exempt Intel from the rules, but the discretional nature of this very offer may have made Intel wary of the business environment in Mexico. Three lessons can be extracted from the Intel episode. First, Costa Rica already had many of the conditions that Intel needed. It had enjoyed political stability for a long time, and had made efforts to liberalize international trade and labor markets.40 It also possessed a fairly well trained work force and an incipient electronics sector. Nevertheless, the second conclusion is that fiscal incentives were also important. But in a world where many countries compete for attracting FDI, one key factor in favor of Costa Rica was the credibility of its incentive regime, given by its generalized nature and automated process. The third lesson is that active involvement of the authorities can be key in attracting a big investment project. They were prompt and effective in removing obstacles identified by the prospective investor. But an important fact, highlighted by Spar (1998), is that the Costa Rican government responded to Intel’s concerns mostly by changing the general nature of the regulations and enhancing the education system, not by providing grants and subsidies specifically to Intel.
39 This section is based on Monge (2002), drawing from Spar (1998) and Larrain, Lopez-Calva and Rodriguez-Clare (2001). 40 As discussed by Larrain et. al. (2001), a study carried out in 1999 confirmed that other foreign investors’ perceptions of Costa Rica largely coincided with Intel’s assessment. The 61 foreign investors interviewed ranked “political stability” and “well-educated labor force” as the top strengths of Costa Rica’s.
38
Bibliography
Agarwal, J.P. (1996): Impact of “Europe agreements” on FDI in developing countries, International Journal of Social Economics, 23, 10/11, 150-163.
Aguilar-Ceballos, A. (2002) Foreign Direct Investment Flows to Mexico: A Cross-Sector, Cross-Country Comparison. Mimeo, Northwestern Unweversity/Banco de Mexico.
Aguilar-Ceballos, A., Burstein, A. and Monge-Naranjo, A. (2002) Capital and Entrepreneur International Mobility. Mimeo, Northwestern Unweversity
Aristotelous, K.; Fountas, S. (1996): An empirical analysis of inward foreign direct investment flows in the EU with emphasis on the market enlargement hypothesis, Journal of Common Market Studies, 34, 4, 571-583.
Baldwin, R. and E. Seghezza (1998): “Regional integration and growth in developing nations”, Journal of Economic Integration 13, 367-399.
Baldwin, R.E.; Forslid, R, Haaland, J, (1995): Investment creation and investment diversion: simulation analysis of the Single Market Programme, NBER Working Paper Series, Working Paper 5364.
Blomstrom, M. and A. Kokko (2003): “ The economics of foreign direct investment incentives”. NBER Working Paper 9489.
Borbon-Guevara, J. (1999) Estudio Comparativo de los principales incentives ofrecidos por los paises del Area Centraomericana dirigidos a la atraccion de la inversion extranjera directa. Proyecto Final de Gracuacion para el Magiester en Administracion de Negocios.. Unweversidad de Costa Rica.
Brenton, P. (1996): The impact of the Single Market on foreign direct investment in the EU, Report for DGII, European Commission.
Brenton, P.; Di Mauro, F,; Luecke, M. (1999): Economic integration and FDI: An empirical analysis of foreign direct investment in the EU and in Central and Eastern Europe, Empirica, 26, 95-121.
Buch, C.M.; Kokta, R.M.; Piazolo, D. (2001) : Does the East get what should otherwise flow to the South, FDI diversion in Europe, Kiel Working Paper 1061, Kiel Institute of World Economics.
CINDE-PROCOMER (2001) Benchmarking de Incentivos a la Inversion Extranjera Directa. Coalicion de Iniciativas de Desarrollo/Promotora del Comercio Exterior de Costa Rica.
CINDE-PROCOMER (2001) Inversion Extranjera Directa y Desarrollo. Analisis sobre las Estadisticas Actuales. Coalicion de Iniciativas de Desarrollo/Promotora del Comercio Exterior de Costa Rica.
CINDE-PROCOMER (2001) Inversion Extranjera en Alta Tecnologia y Acceso a Mercado. Coalicion de Iniciativas de Desarrollo/Promotora del Comercio Exterior de Costa Rica.
39
CINDE-PROCOMER (2001) Sector Textil Exportador en Costa Rica: Retos y Opotunidades ante la ampliacion de los beneficios de la Iniciativa para la Cuenca del Caribe. Coalicion de Iniciativas de Desarrollo/Promotora del Comercio Exterior de Costa Rica.
Cuevas, A. Messmacher, M. and Werner, A. (2002) Changes in the Patterns of External Financing in Mexico Since the Approval of NAFTA. Mimeo, Banco de Mexico.
Gitli, E. and Arce, R. (2000a) El Marco Institucional Local de la Industria Maquiladora en la Cuenca del Caribe Frente a los Cambios en el Entorno Mundial. Centro Internacional de Politica Economica, Costa Rica.
Gitli, E. and Arce, R. (2000b) Los desbalances de los paises de la Cuenca del Caribe frente al TLCAN: La industria de la confeccion. in Integracion & Comercio. Revista Cuatrimestral del INTAL. Institution para la Integracion de America Latina y el Caribe, Mayo-Agosto 2000.
Grupo Interinstitutional de Inversion Exntrajera Directa. (2002) Quinto Informe sobre los Flujos de Inversion Extranjera Directa en Costa Rica, 1997-2002. Mimeo, Costa Rica.
Jimenez, J. (1997) Reforms to the Mexican Foreign Investment Law. National Law Center for Inter-American Free Trade, 1997 (document downloaded at http://www.natlaw.com/)
Kehoe, P. and Kehoe, T. (1994) Capturing NAFTA's Impact With Applied General Equilibrium Models. Federal Reserve Bank of Minneapolis Quarterly Review, 18:2 (1994), 17-34,
Larrain, F., Lopez-Calva, L. and Rodriguez-Clare, A. (2000) Intel: A Case Study of Foreign Direct Investment in Central America CID Harvard Unweversity.
Levy Yeyati, E., Stein, E. and Daude, C. (2002) Regional Integration and the Location of FDI. Mimeo, Inter American Development Bank.
Martin, C.; Gual. J. (1994): Trade and foreign direct investment with Central and Eastern Europe: Its impact on Spain, CEPR Discussion Paper No. 1006, CEPR.
Monge-Naranjo, A. (2001)Exports and Foreign Investment in Costa Rica and El Salvador during the 1990s. Mimeo, Northwestern University / World Bank.
Monge-Naranjo, A. (2002) Human Capital, Organizations and Foreign Direct Investment . Mimeo, Northwestern University.
Morisset, J. and N. Pirnia (2002): “ How tax policy and incentives affect foreign direct investment”, unpublished manuscript.
Oxelheim, L. (1994): The global race for foreign direct investment, Springer-Verlag.
Robles-Cordero, E. And A. Rodríguez-Clare (2003): “Inversión nacional y extranjera en Centroamérica. Cómo fomentarla en el marco de la OMC ?”. Mimeo, Academia de Centroamérica.
40
RWI (2001): The impact of trade and FDI on cohesion (Preparation of the “Second Cohesion Report”), Final Report to the European Commission DG Regional Policy, RWI Essen.
Scaperlanda, A. (1967): The EEC and US foreign investment: some empirical evidence, Economic Journal, 77, 22-26.
Shatz, H. and A. Venables (2001): “ The geography of international investment”, unpublished manuscript.
Spar, D. 1998. Attracting High Technology Investment: Intel’s Costa Rican Plant. Foreign Investment Advisory Service Occasional Paper 11. Washington. D.C.: World Bank.
Stokey, N. (1996) Free Trade, Factor Returns, and Factor Accumulation," Journal of Economic Growth, 1 (December 1996), pp. 421-447.
Venables, A. and L. Winters (2002): “ Economic integration in the Americas: European perspectives”, unpublished manuscript.