Embed Size (px)
Citation preview
Chapter 7
The Asset Market, Money, and Prices
Copyright © 2005 Pearson Addison-Wesley. All rights reserved. 7-2
Goals of Chapter 7
What money is and why people hold it
The decision about money demand is part of a broader portfolio decision
Equilibrium in the asset market occurs when money supply equals money demand
The price level is related to the level of the money supply

Copyright © 2005 Pearson Addison-Wesley. All rights reserved. 7-3
7.1 What Is Money?
The functions of moneyMedium of exchange
Barter is inefficient—it requires a double coincidence of wants
Money allows people to trade their labor for money, then use the money to buy goods and services in separate transactions
Money thus permits people to trade with less cost in time and effort
Money also allows specialization, since trading is much easier, so people don't have to produce their own food, clothing, and shelter
Copyright © 2005 Pearson Addison-Wesley. All rights reserved. 7-4
7.1 What Is Money?Unit of account
Money is the basic unit for measuring economic value
This simplifies comparisons of prices, wages, and incomes
The unit-of-account function is closely linked with the medium-of-exchange function
But countries with very high inflation may use a different unit of account, so they don't have to constantly change prices
Store of valueMoney can be used to hold wealthMost people use money only as a store of value for a
short period and for small amounts, because it earns less interest than money in the bank

Copyright © 2005 Pearson Addison-Wesley. All rights reserved. 7-5
7.1 What Is Money?
Box 7.1: money in a prisoner-of-war campRadford article on the use of cigarettes as moneyCigarette use as money developed because barter
was inefficientEven nonsmokers used cigarettes as moneyCharacteristics of cigarettes as money:
standardized (so value was easy to ascertain), low in value (so "change" could be made), portable, fairly sturdy
Problem with having a commodity money like cigarettes: can't smoke them and use them as money at the same time
Copyright © 2005 Pearson Addison-Wesley. All rights reserved. 7-6
7.1 What Is Money?
Measuring money—the monetary aggregatesDistinguishing what is money from what isn't
money is sometimes difficultFor example, MMMFs (Money Market Mutual Funds) allow
checkwriting, but give a higher return than bank checking accounts: Are they money?
There's no single best measure of the money stock
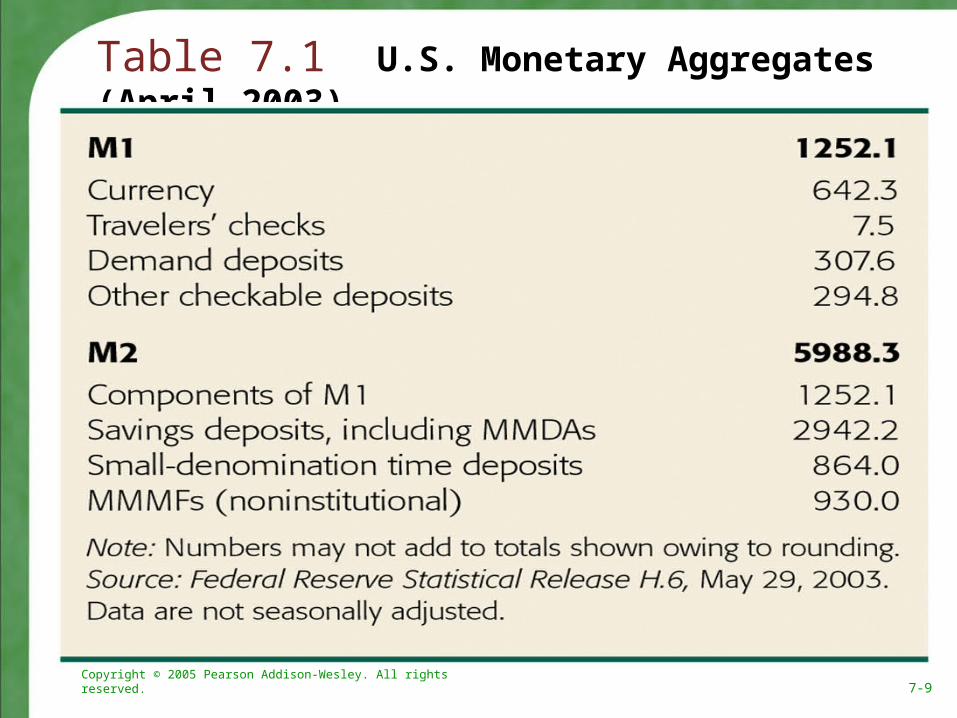
The M1 monetary aggregateConsists of currency and traveler's checks held by the
public, demand deposits (which pay no interest), and other checkable deposits (which may pay interest)
All components of M1 are used in making payments, so M1 is the closest money measure to our theoretical description of money
Copyright © 2005 Pearson Addison-Wesley. All rights reserved. 7-7
7.1 What Is Money?
The M2 monetary aggregateM2 = M1 + less moneylike assetsAdditional assets in M2 include savings deposits,
small (< $100,000) time deposits, noninstitutional MMMF balances, money-market deposit accounts (MMDAs)
Savings deposits include passbook savings accountsTime deposits bear interest and have a fixed term
(substantial penalty for early withdrawal)MMMFs invest in very short-term securities and allow
checkwritingMMDAs are offered by banks as a competitor to
MMMFs
Copyright © 2005 Pearson Addison-Wesley. All rights reserved. 7-8
7.1 What Is Money?
M3 = M2 + less moneylike assetsLarge denomination (> $100,000) time deposits MMMFs held by institutionsRepurchase agreements (repos) are overnight loans made by
selling a security and agreeing to repurchase it the next dayEurodollars are short-term deposits held in foreign branches of
U.S. banks
Weighted monetary aggregatesThe Fed's money measures add up all the amounts in each
category directlyBut some assets are more moneylike than othersAn alternative approach is to weight each asset by how
moneylike it is: Currency has a high weight, Treasury securities have a low weight
This approach seems useful, but is controversialThe Fed has no official weighted monetary aggregate, just the
simple-sum aggregates described above
Copyright © 2005 Pearson Addison-Wesley. All rights reserved. 7-9
Table 7.1 U.S. Monetary Aggregates (April 2003)
Copyright © 2005 Pearson Addison-Wesley. All rights reserved. 7-10
7.1 What Is Money?
Box 7.2: where have all the dollars gone?In 2002, U.S. currency averaged almost $2100 per
person, but surveys show people only hold about $100Some is held by businesses and the underground
economy, but most is held abroadForeigners hold dollars because of inflation in their
local currency and political instabilitySince currency is 1/2 of M1 and over half of currency is
held abroad, foreigners hold over 1/4 of M1The data show large fluctuations in M1 when major events
occur abroad, like military conflictsThe United States benefits from foreign holdings of our
currency, since we essentially get an interest-free loan
Copyright © 2005 Pearson Addison-Wesley. All rights reserved. 7-11
7.1 What Is Money?
The money supplyMoney supply = money stock = amount of money available in the
economyHow does the central bank of a country increase the money
supply?Use newly printed money to buy financial assets from the public—an
open-market purchaseTo reduce the money supply, sell financial assets to the public to
remove money from circulation—an open-market saleOpen-market purchases and sales are called open-market operationsCould also buy newly issued government bonds directly from the
government (i.e., the Treasury) This is the same as the government financing its expenditures directly by
printing money This happens frequently in some countries (though is forbidden by law in
the United States)
Throughout text, use the variable M to represent money supply; this might be M1, M2, or some other aggregate
Copyright © 2005 Pearson Addison-Wesley. All rights reserved. 7-12
7.2 Portfolio Allocation and the Demand for Assets
How do people allocate their wealth amongvarious assets? The portfolio allocation decision: Expected return
Rate of return = an asset's increase in value per unit of timeBank account: Rate of return = interest rateCorporate stock: Rate of return = dividend yield + percent
increase in stock price
Investors want assets with the highest expected return (other things equal)
Returns aren't always known in advance (for example, stock prices fluctuate unexpectedly), so people must estimate their expected return
Copyright © 2005 Pearson Addison-Wesley. All rights reserved. 7-13
RiskRisk is the degree of uncertainty in an asset's return People don't like risk, so prefer assets with low risk
(other things equal) Liquidity
Liquidity is the ease and quickness with which an asset can be traded
Money is very liquidAssets like automobiles and houses are very illiquid—it
may take a long time and large transaction costs to trade them
Stocks and bonds are fairly liquid, some more so than others
Investors prefer liquid assets (other things equal)
7.2 Portfolio Allocation and the Demand for Assets
Copyright © 2005 Pearson Addison-Wesley. All rights reserved. 7-14
Asset demandsTrade-off among expected return, risk, and
liquidityAssets with low risk and high liquidity, like
checking accounts, have low expected returnsThe amount a wealth holder wants of an asset
is his or her demand for that assetThe sum of asset demands equals total wealth
7.2 Portfolio Allocation and the Demand for Assets
Copyright © 2005 Pearson Addison-Wesley. All rights reserved. 7-15
7.3 The Demand for Money
The demand for money is the quantity of monetary assets people want to hold in their portfoliosMoney demand depends on expected return,
risk, and liquidityMoney is the most liquid assetMoney pays a low returnPeople's money-holding decisions depend on
how much they value liquidity against the low return on money
Copyright © 2005 Pearson Addison-Wesley. All rights reserved. 7-16
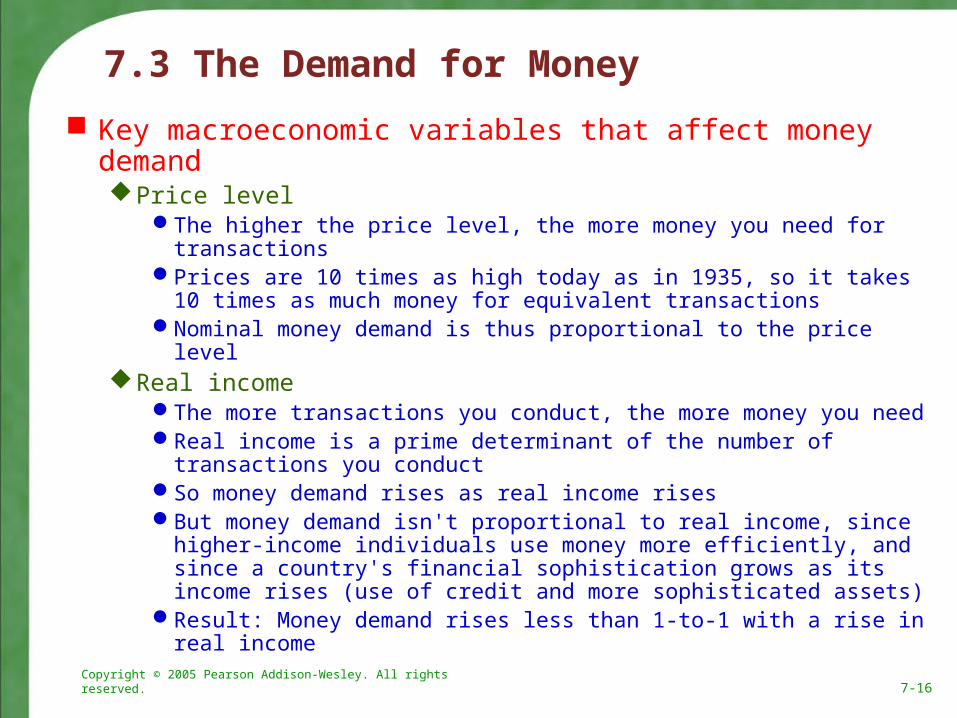
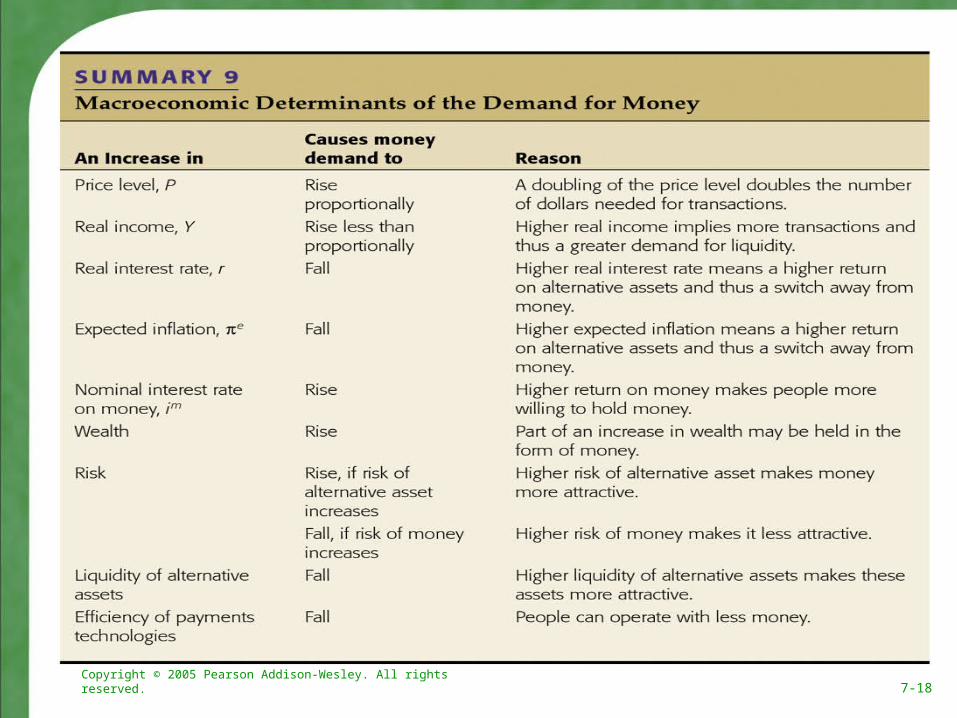
Key macroeconomic variables that affect money demandPrice level
The higher the price level, the more money you need for transactionsPrices are 10 times as high today as in 1935, so it takes 10 times as
much money for equivalent transactionsNominal money demand is thus proportional to the price level
Real incomeThe more transactions you conduct, the more money you needReal income is a prime determinant of the number of transactions you
conductSo money demand rises as real income risesBut money demand isn't proportional to real income, since higher-
income individuals use money more efficiently, and since a country's financial sophistication grows as its income rises (use of credit and more sophisticated assets)
Result: Money demand rises less than 1-to-1 with a rise in real income
7.3 The Demand for Money
Copyright © 2005 Pearson Addison-Wesley. All rights reserved. 7-17
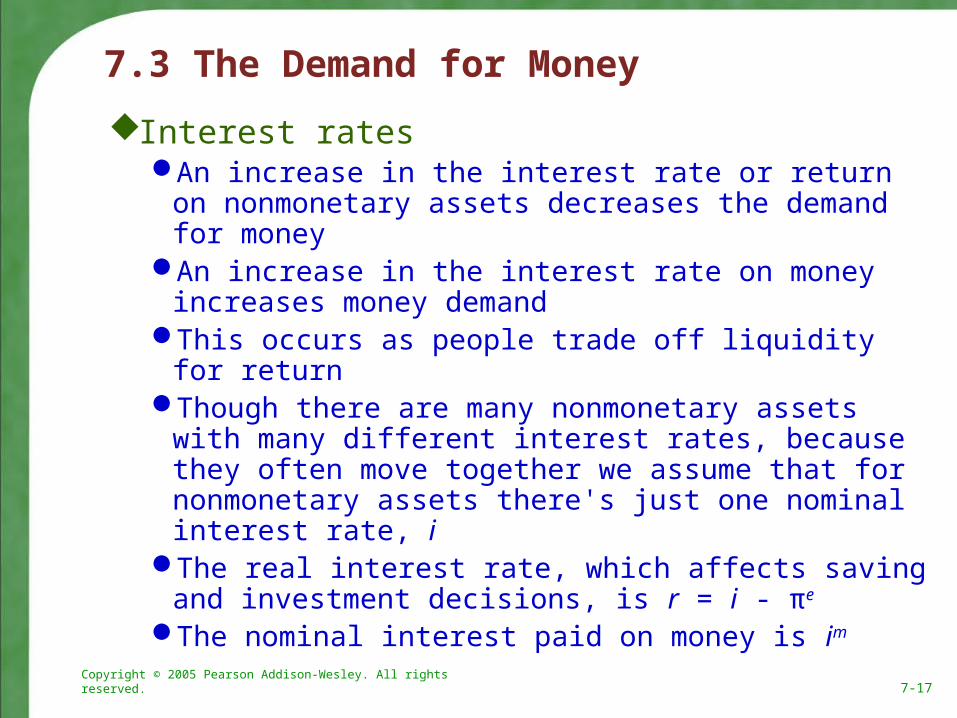
Interest ratesAn increase in the interest rate or return on
nonmonetary assets decreases the demand for money
An increase in the interest rate on money increases money demand
This occurs as people trade off liquidity for returnThough there are many nonmonetary assets with
many different interest rates, because they often move together we assume that for nonmonetary assets there's just one nominal interest rate, i
The real interest rate, which affects saving and investment decisions, is r = i - πe
The nominal interest paid on money is im
7.3 The Demand for Money
Copyright © 2005 Pearson Addison-Wesley. All rights reserved. 7-18
Copyright © 2005 Pearson Addison-Wesley. All rights reserved. 7-19
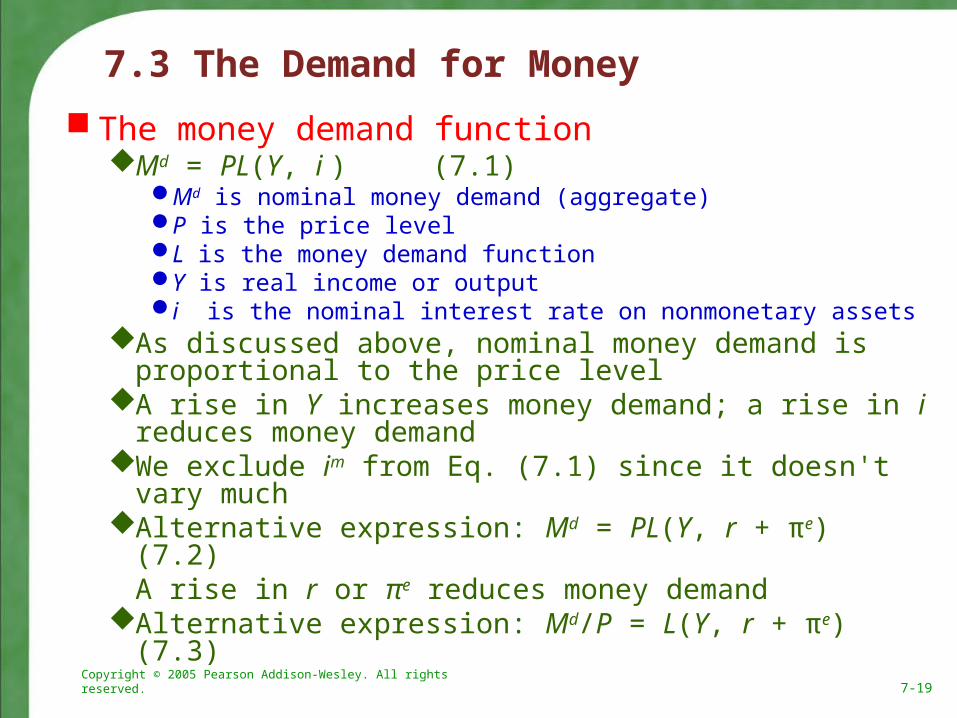
The money demand functionMd = PL(Y, i ) (7.1)
Md is nominal money demand (aggregate)P is the price levelL is the money demand functionY is real income or outputi is the nominal interest rate on nonmonetary assets
As discussed above, nominal money demand is proportional to the price level
A rise in Y increases money demand; a rise in i reduces money demand
We exclude im from Eq. (7.1) since it doesn't vary muchAlternative expression: Md = PL(Y, r + πe) (7.2)
A rise in r or πe reduces money demandAlternative expression: Md/P = L(Y, r + πe) (7.3)
7.3 The Demand for Money
Copyright © 2005 Pearson Addison-Wesley. All rights reserved. 7-20
Other factors affecting money demandWealth: A rise in wealth may increase money demand,
but not by muchRisk
Increased riskiness in the economy may increase money demand
Times of erratic inflation bring increased risk to money, so money demand declines
Liquidity of alternative assets: Deregulation, competition, and innovation have given other assets more liquidity, reducing the demand for money
Payment technologies: Credit cards, ATMs, and other financial innovations reduce money demand
7.3 The Demand for Money
Copyright © 2005 Pearson Addison-Wesley. All rights reserved. 7-21
Elasticities of money demandHow strong are the various effects on money demand?Statistical studies on the money demand function show results in
elasticitiesElasticity: The percent change in money demand caused by a one
percent change in some factor Income elasticity of money demand
Positive: Higher income increases money demandLess than one: Higher income increases money demand less than
proportionatelyGoldfeld's results: income elasticity = 2/3
Interest elasticity of money demand Small and negative: Higher interest rate on nonmonetary assets reduces money demand slightly
Price elasticity of money demand is unitary, so money demand is proportional to the price level
7.3 The Demand for Money
Copyright © 2005 Pearson Addison-Wesley. All rights reserved. 7-22
Velocity and the quantity theory of moneyVelocity (V) measures how much money "turns
over" each period V = nominal GDP / nominal money stock
= PY / M (7.4)Numerical Problem 1 is an empirical exercise calculating velocity from a money-demand equation.
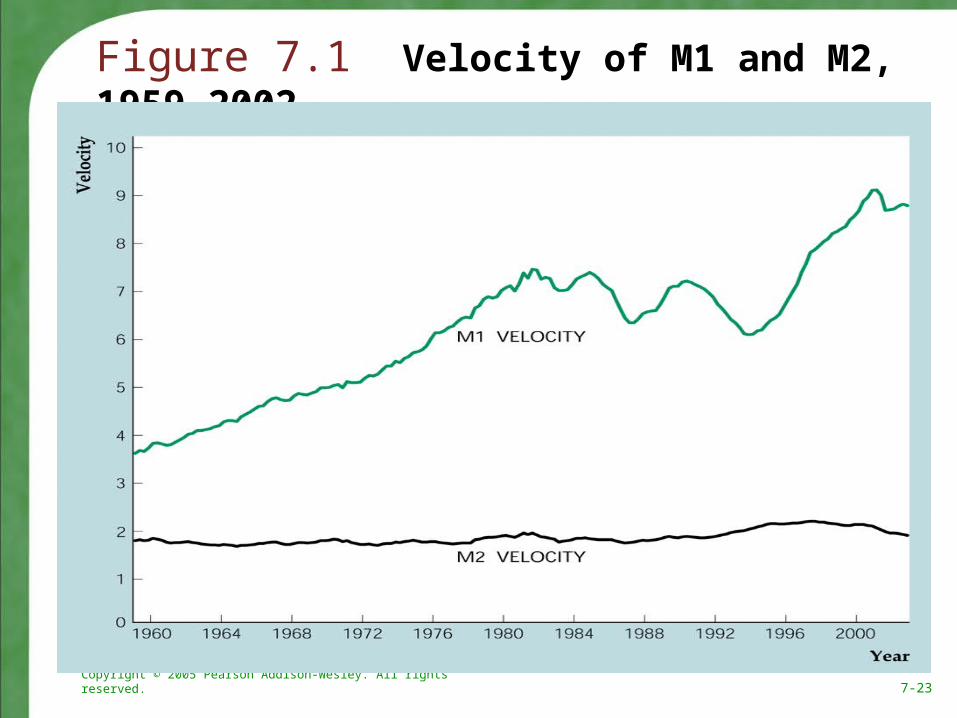
Plot of velocities for M1 and M2 (Fig. 7.1) shows fairly stable velocity for M2, erratic velocity for M1 beginning in early 1980s
7.3 The Demand for Money
Copyright © 2005 Pearson Addison-Wesley. All rights reserved. 7-23
Figure 7.1 Velocity of M1 and M2, 1959–2002
Copyright © 2005 Pearson Addison-Wesley. All rights reserved. 7-24
Quantity theory of money: Real money demand is proportional to real incomeIf so,
Md/P = kY (7.5)Assumes constant velocity, where velocity isn’t
affected by income or interest ratesBut velocity of M1 is not constant; it rose steadily
from 1960 to 1980 and has been erratic since thenPart of the change in velocity is due to changes in interest
rates in the 1980sFinancial innovations also played a role in velocity’s
decline in the early 1980sM2 velocity is closer to being a constant, but not
over short periods
7.3 The Demand for Money
Copyright © 2005 Pearson Addison-Wesley. All rights reserved. 7-25
Application: financial regulation, innovation, and the instability of money demandGoldfeld (1973) found a stable money (M1) demand function But late 1974 to early 1976, M1 demand fell relative to that
predicted by the modelAnd in the early 1980s, M1 demand rose relative to that predicted
by the modelWhy did money demand shift erratically?
Increased innovation and changes in the financial systemNew assets were invented in the 1970s, liquid assets that paid
interest;People switched wealth from M1 to these assets, reducing M1 demand
MMMFs Overnight repurchase agreements
New assets in the 1980s, interest-bearing checking accounts; their use brought wealth into M1, raising money demand
Developments in the 1990sSweep programs reduce demand for reserves and M1M2 erratic because of increased use of mutual fund
7.3 The Demand for Money
Copyright © 2005 Pearson Addison-Wesley. All rights reserved. 7-26
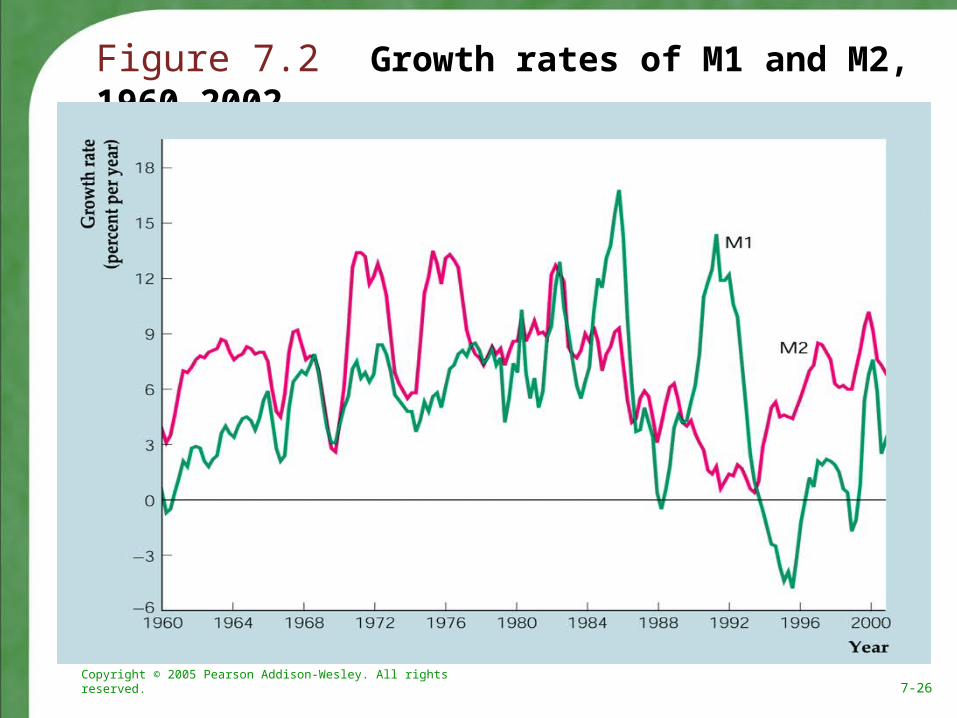
Figure 7.2 Growth rates of M1 and M2, 1960–2002
Copyright © 2005 Pearson Addison-Wesley. All rights reserved. 7-27
7.4 Asset Market Equilibrium
Asset market equilibrium—an aggregation assumptionAssume that all assets can be grouped into
two categories, money and nonmonetary assetsMoney includes currency and checking accounts
Pays interest rate im
Supply is fixed at M
Nonmonetary assets include stocks, bonds, land, etc.
Pays interest rate i = r + πe
Supply is fixed at NM
Copyright © 2005 Pearson Addison-Wesley. All rights reserved. 7-28
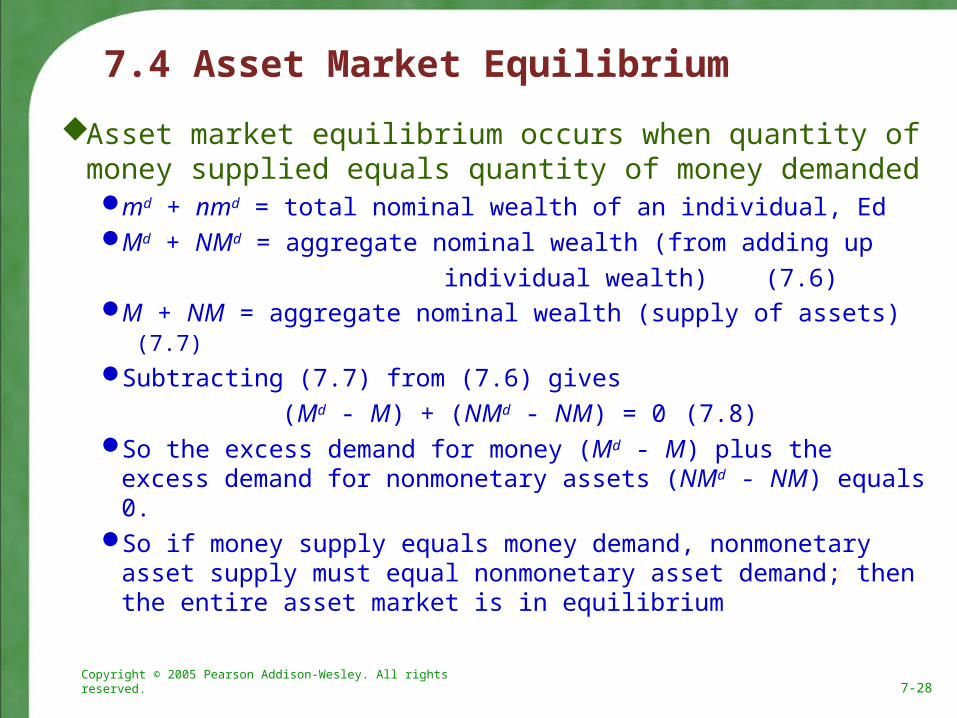
Asset market equilibrium occurs when quantity of money supplied equals quantity of money demandedmd + nmd = total nominal wealth of an individual, EdMd + NMd = aggregate nominal wealth (from adding up
individual wealth) (7.6)M + NM = aggregate nominal wealth (supply of assets) (7.7)
Subtracting (7.7) from (7.6) gives
(Md - M) + (NMd - NM) = 0 (7.8)So the excess demand for money (Md - M) plus the excess
demand for nonmonetary assets (NMd - NM) equals 0.So if money supply equals money demand, nonmonetary
asset supply must equal nonmonetary asset demand; then the entire asset market is in equilibrium
7.4 Asset Market Equilibrium
Copyright © 2005 Pearson Addison-Wesley. All rights reserved. 7-29
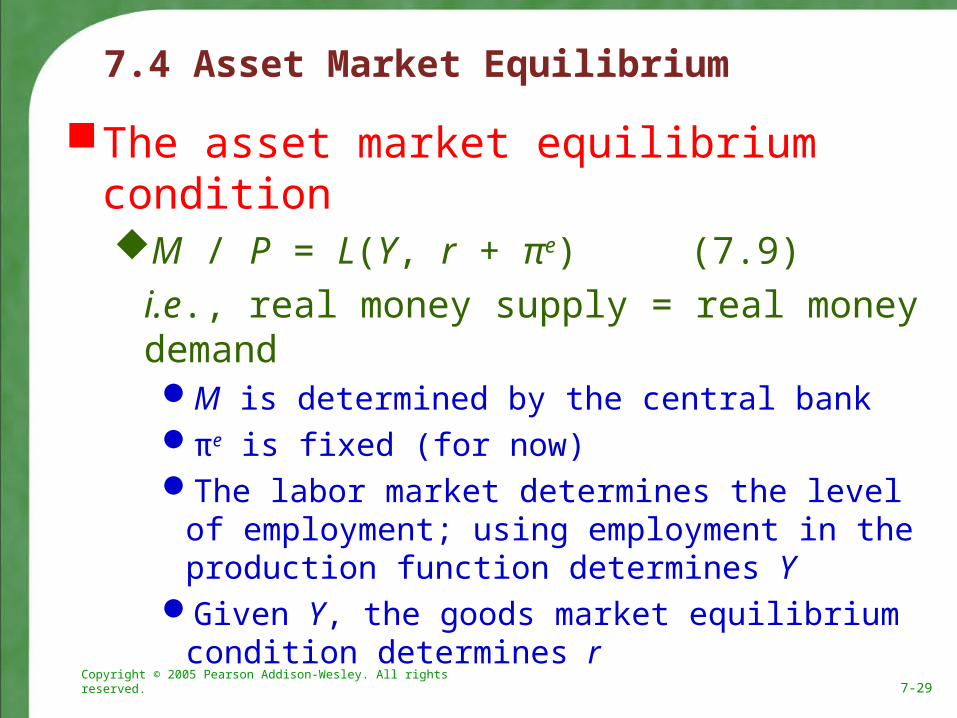
The asset market equilibrium conditionM / P = L(Y, r + πe) (7.9)
i.e., real money supply = real money demandM is determined by the central bankπe is fixed (for now)The labor market determines the level of
employment; using employment in the production function determines Y
Given Y, the goods market equilibrium condition determines r
7.4 Asset Market Equilibrium
Copyright © 2005 Pearson Addison-Wesley. All rights reserved. 7-30
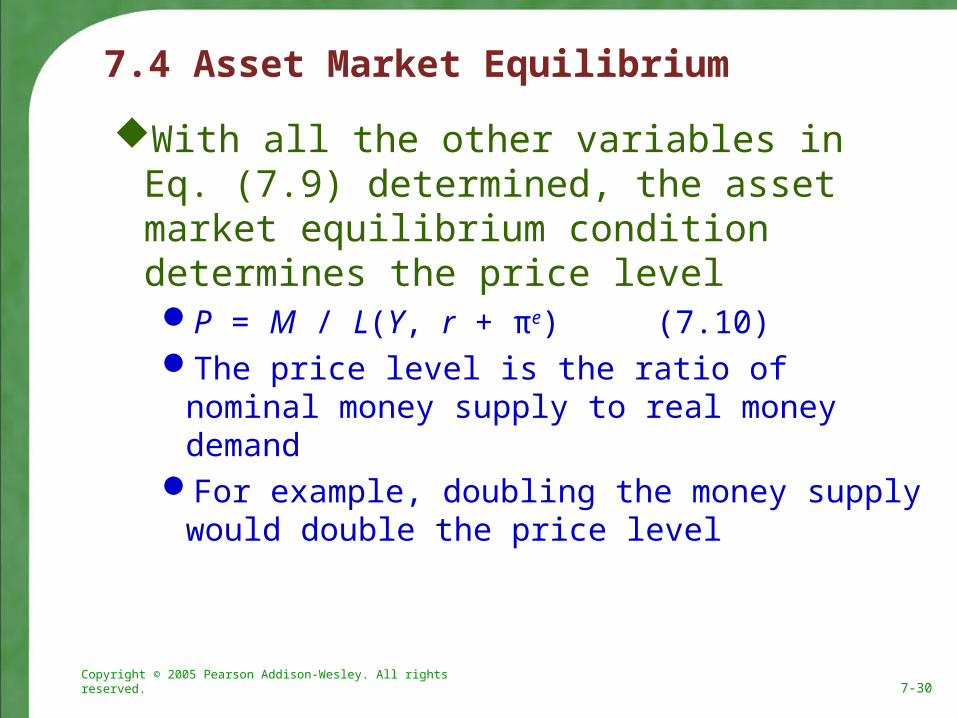
With all the other variables in Eq. (7.9) determined, the asset market equilibrium condition determines the price levelP = M / L(Y, r + πe) (7.10)The price level is the ratio of nominal money supply
to real money demandFor example, doubling the money supply would
double the price level
7.4 Asset Market Equilibrium
Copyright © 2005 Pearson Addison-Wesley. All rights reserved. 7-31
7.5 Money Growth and Inflation
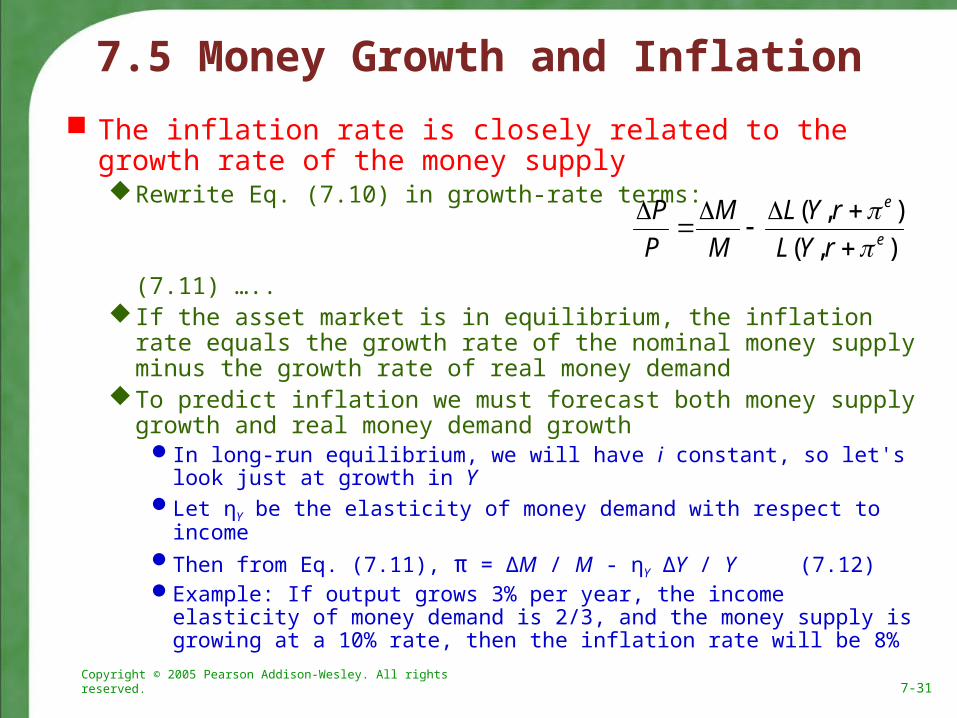
The inflation rate is closely related to the growth rate of the money supplyRewrite Eq. (7.10) in growth-rate terms:
(7.11) ….. If the asset market is in equilibrium, the inflation rate equals the
growth rate of the nominal money supply minus the growth rate of real money demand
To predict inflation we must forecast both money supply growth and real money demand growth
In long-run equilibrium, we will have i constant, so let's look just at growth in Y
Let ηY be the elasticity of money demand with respect to incomeThen from Eq. (7.11), π = ΔM / M - ηY ΔY / Y (7.12)Example: If output grows 3% per year, the income elasticity of money
demand is 2/3, and the money supply is growing at a 10% rate, then the inflation rate will be 8%
P
P
M
M
L Y r
L Y r
e
e
( , )
( , )
Copyright © 2005 Pearson Addison-Wesley. All rights reserved. 7-32
Application: money growth and inflation in the European countries in transitionThough the countries of Eastern Europe are becoming more
market-oriented, Russia and some others have high inflation because of rapid money growth
Both the growth rates of money demand and money supply affect inflation, but (in cases of high inflation) usually growth of nominal money supply is the most important factorFor example, if the income elasticity of money demand were
2/3 and real output grew 15%, real money demand would grow 10% (= 2/3 × 15%); or if income fell 15%, real money demand would fall 10%
So money demand doesn't vary much, no matter how well or poorly an economy is doing, but nominal money supply growth differs across countries by hundreds of percentage points, so large inflation differences must be due to money supply, not money demand
7.5 Money Growth and Inflation
Copyright © 2005 Pearson Addison-Wesley. All rights reserved. 7-33
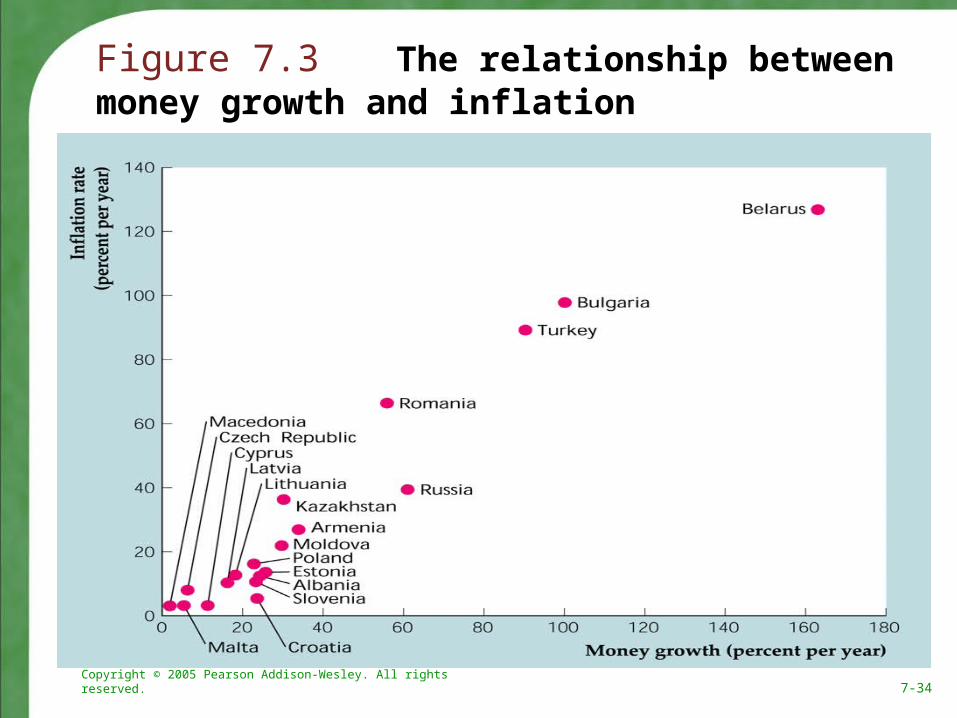
Figure 7.3 shows the link between money growth and inflation in these countries; inflation is clearly positively associated with money growth
So why do countries allow money supplies to grow quickly, if they know it will cause inflation?They sometimes find that printing money is the only
way to finance government expendituresThis is especially true for very poor countries, or
countries in political crisis
7.5 Money Growth and Inflation
Copyright © 2005 Pearson Addison-Wesley. All rights reserved. 7-34
Figure 7.3 The relationship between money growth and inflation
Copyright © 2005 Pearson Addison-Wesley. All rights reserved. 7-35
The expected inflation rate and the nominal interest rateFor a given real interest rate (r), expected inflation (πe)
determines the nominal interest rate (i = r + πe)What factors determine expected inflation?
People could use Eq. (7.12), relating inflation to the growth rates of the nominal money supply and real income
If people expect an increase in money growth, they would then expect a commensurate increase in the inflation rate
The expected inflation rate would equal the current inflation rate if money growth and income growth were stable
Expectations can't be observed directly They can be measured roughly by surveys If real interest rates are stable, expected inflation can be inferred
from nominal interest rates Policy actions that cause expected inflation to rise should cause
nominal interest rates to rise
7.5 Money Growth and Inflation
Copyright © 2005 Pearson Addison-Wesley. All rights reserved. 7-36
7.5 Money Growth and Inflation
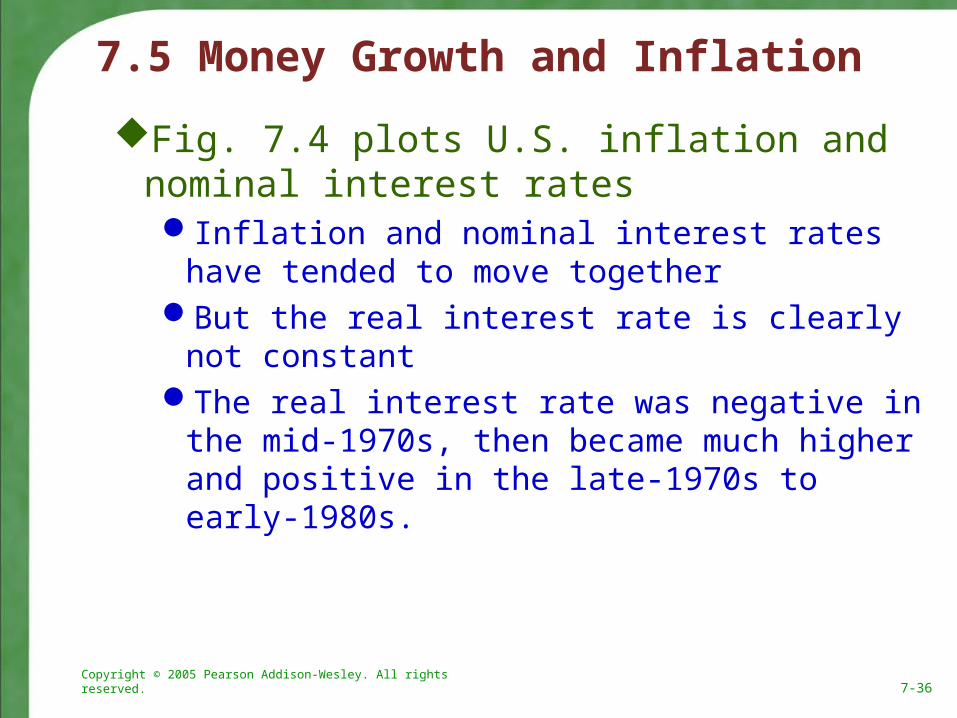
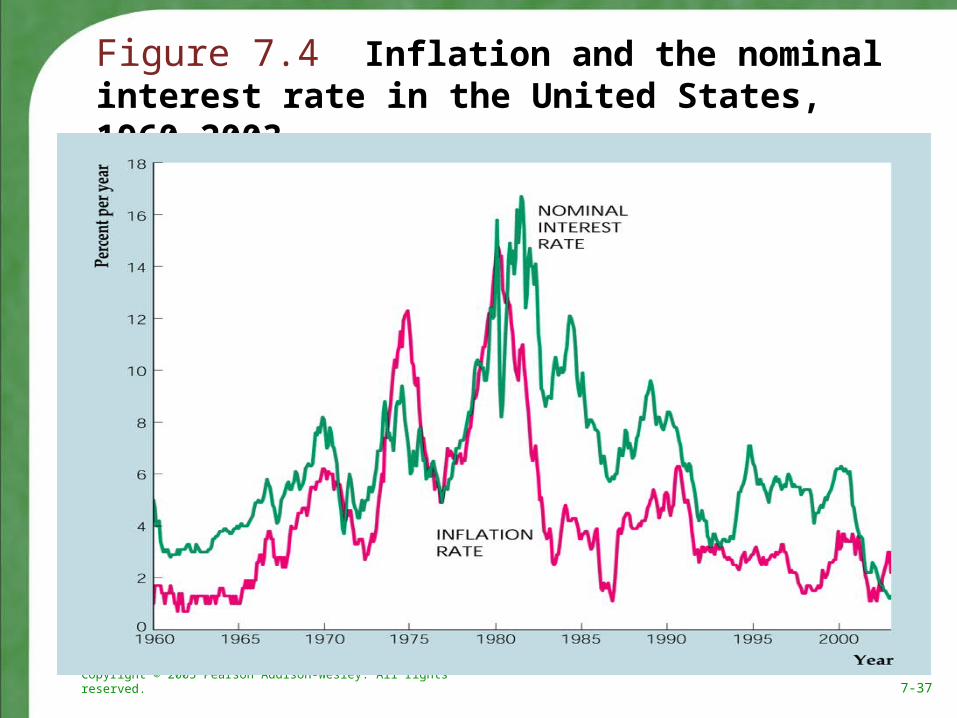
Fig. 7.4 plots U.S. inflation and nominal interest rates Inflation and nominal interest rates have tended to
move togetherBut the real interest rate is clearly not constantThe real interest rate was negative in the mid-
1970s, then became much higher and positive in the late-1970s to early-1980s.
Copyright © 2005 Pearson Addison-Wesley. All rights reserved. 7-37
Figure 7.4 Inflation and the nominal interest rate in the United States, 1960–2003