Embed Size (px)
Citation preview


48
Chapter 7. Summary of Higher Education Data
GAES integrates various higher education data, releases comprehensive information to the
public in a timely manner and establishes higher education indicators to assist the community,
scholars and those in need to carry out relevant thematic studies and serve as a reference for pushing
forward Macao higher education development and policy-making.
I. The figures on higher education provided in this chapter include:
(1) Data of Staff in the Higher Education Institutions of Macao for the Academic Year
2012/2013
(2) Data of Registered Students in the Higher Education Institutions of Macao for the
Academic Year 2012/2013
(3) Data of Graduated Students from the Higher Education Institutions of Macao for the
Academic Year 2011/2012
(4) Data of the Non-local Higher Education Programmes in 2012
(5) Data of Macao Students Studying Higher Education in Places Outside Macao for the
Academic Year 2012/2013
(Note: These figures were obtained from the information on the eligible candidates for the Learning Material Subsidy Scheme for Students of higher education in the 2011/ 2012 academic year)
(6) Higher Education Indicators of Macao for the Academic Year 2012/2013
II. For the purposes of layout, the abbreviations of the higher education institutions provided
in the following table will be used:
Name of the Higher education institutions Abbreviation
University of Macao UM
Macao Polytecnic Institute IPM
Institute for Tourism Studies IFT
Academy of Public Security Forces ESFSM
City University of Macao CITYU
University of Saint Joseph USJ
Kiang Wu Nursing College of Macao KWNC
Macao University of Science and Technology MUST
Macao Institute of Management IGM
Macao Millenium College MMC
Note: 1. Under the terms of Executive Order no. 6/2011, the name “Universidade Aberta Internacional da Ásia (Macao)” was changed to “City University of Macao” in English.
2. Under the terms of Executive Order no. 64/2009, the name of the “Instituto Inter-Universitário de Macao” was changed to “University of Saint Joseph” in English.

49
III. Table of contents of the data on higher education
1. Data of Staff in the Higher Education Institutions of Macao for the Academic Year 2012/2013
Explanatory Notes ......................................................................................................................................... 52
1.1 Number of staff, 2012/2013
(categorized by institution, gender, mode of employment, local and non-local staff) ....................... 53
1.2 Number of staff, 2012/2013 (categorized by institution, gender, type of personnel) ........................ 54
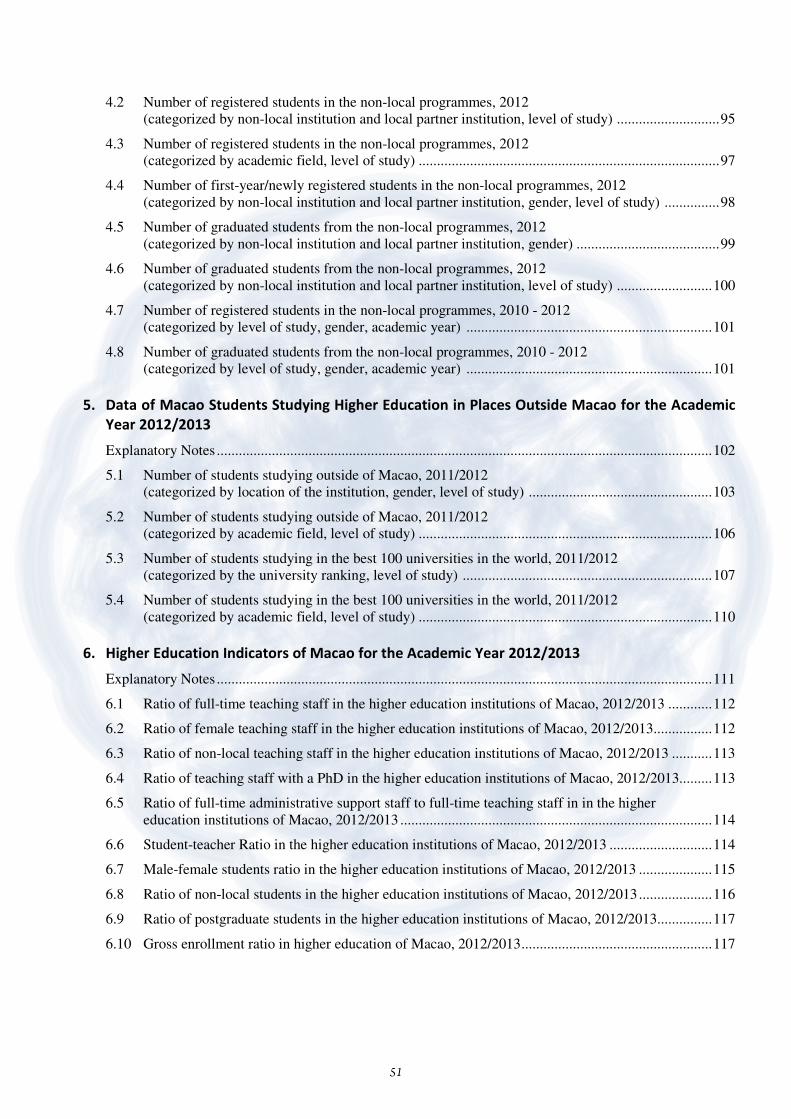
1.3 Number of teaching staff, 2012/2013
(categorized by institution, gender, mode of employment, local and non-local staff) ....................... 55
1.4 Number of non-local teaching staff, 2012/2013
(categorized by institution, gender , place of region) ......................................................................... 56
1.5 Number of teaching staff (full time equivalents), 2012/2013
(categorized by institution, gender, mode of employment, local and non-local staff) ....................... 57
1.6 Number of non-teaching staff, 2012/2013
(categorized by institution, gender, mode of employment, local and non-local staff) ....................... 58
1.7 Number of research staff, 2012/2013
(categorized by institution, gender, mode of employment, local and non-local staff) ....................... 59
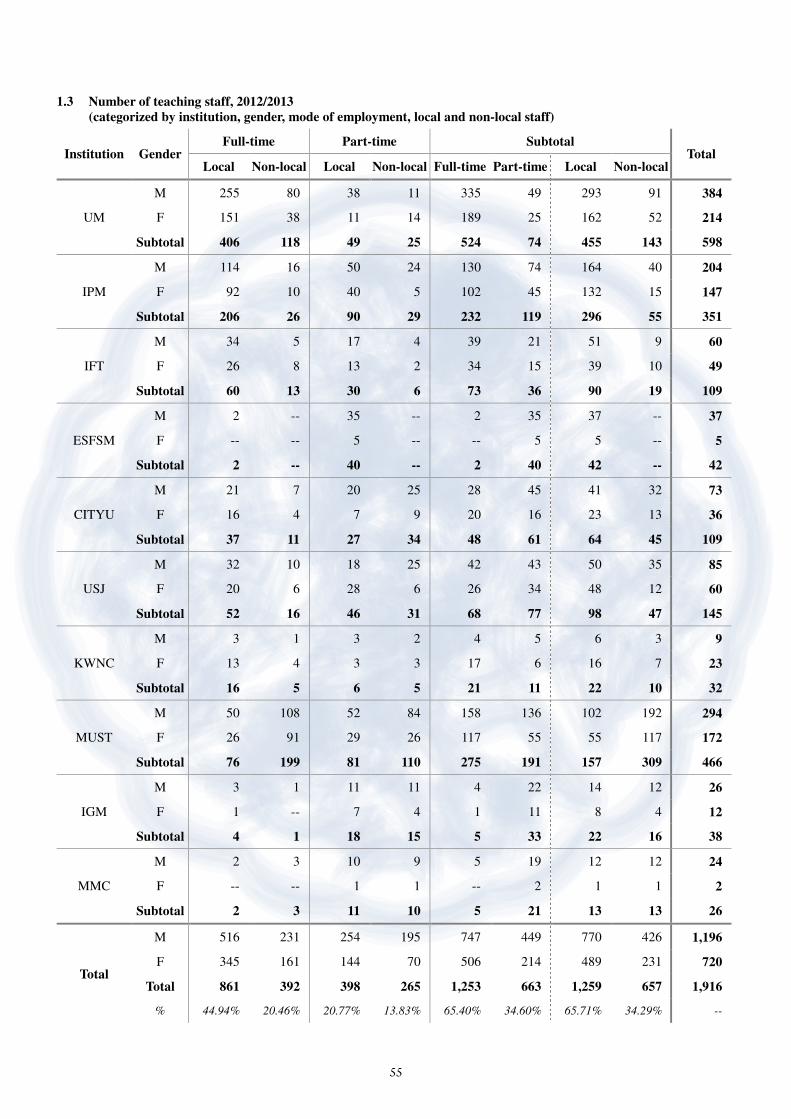
1.8 Number of teaching staff, 2003/2004 - 2012/2013
(categorized by institution, gender, academic year) ........................................................................... 60
1.9 Number of non-teaching staff, 2003/2004 - 2012/2013
(categorized by institution, gender, academic year) ........................................................................... 61
1.10 Number of research staff, 2003/2004 - 2012/2013
(categorized by institution, gender, academic year) ........................................................................... 62
2. Data of Registered Students in the Higher Education Institutions of Macao for the Academic
Year 2012/2013
Explanatory Notes ......................................................................................................................................... 63
2.1 Number of registered students, 2012/2013
(categorized by institution, gender, programme nature, local and non-local student) ....................... 64
2.2 Number of registered students, 2012/2013
(categorized by institution, gender, level of study) ............................................................................ 65
2.3 Number of local registered students, 2012/2013
(categorized by institution, gender, level of study) ............................................................................ 66
2.4 Number of non-local registered students, 2012/2013
(categorized by institution, gender, level of study) ............................................................................ 67
2.5 Number of non-local registered students, 2012/2013
(categorized by institution, gender, place of origin) .......................................................................... 68
2.6 Number of students registered in the different levels of programmes, 2012/2013
(categorized by academic field, level of study) .................................................................................. 69
2.7 Number of local students registered in the different levels of programmes, 2012/2013
(categorized by academic field, level of study) .................................................................................. 70
2.8 Number of non-local students registered in the different levels of programmes, 2012/2013
(categorized by academic field, level of study) .................................................................................. 71
2.9 Number of first-year/newly registered students, 2012/2013
(categorized by institution, gender, programme nature, local and non-local student) ....................... 72

50
2.10 Number of first-year/newly registered students, 2012/2013
(categorized by institution, gender, level of study) ............................................................................ 73
2.11 Number of first-year/newly registered local students, 2012/2013
(categorized by institution, gender, level of study) ............................................................................ 74
2.12 Number of first-year/newly registered non-local students, 2012/2013
(categorized by institution, gender, level of study) ............................................................................ 75
2.13 Number of first-year/newly registered students in the different levels of programmes, 2012/2013
(categorized by academic field, level of study) .................................................................................. 76
2.14 Number of first-year/newly registered local students in the different levels of programmes,
2012/2013 (categorized by academic field, level of study) ............................................................... 77
2.15 Number of first-year/newly registered non-local students in the different levels of programmes,
2012/2013 (categorized by academic field, level of study) ............................................................... 78
2.16 Number of registered students, 2003/2004 - 2012/2013
(categorized by institution, gender, academic year) ........................................................................... 79
2.17 Number of registered students, 2003/2004 - 2012/2013
(categorized by institution, programme nature, academic year) ........................................................ 80
2.18 Number of registered students, 2003/2004 - 2012/2013
(categorized by institution, local and non-local student, academic year) .......................................... 81
3. Data of Graduated Students from the Higher Education Institutions of Macao for the Academic
Year 2011/2012
Explanatory Notes ......................................................................................................................................... 82
3.1 Number of graduated students, 2011/2012
(categorized by institution, gender, programme nature, local and non-local student) ....................... 83
3.2 Number of graduated students, 2011/2012
(categorized by institution, gender, level of study) ............................................................................ 84
3.3 Number of local graduated students, 2011/2012
(categorized by institution, gender and level of study) ....................................................................... 85
3.4 Number of non-local graduated students, 2011/2012
(categorized by institution, gender, level of study) ............................................................................ 86
3.5 Number of students graduated from the different levels of programmes, 2011/2012
(categorized by academic field, level of study) .................................................................................. 87
3.6 Number of local students from the different levels of programmes, 2011/2012
(categorized by academic field, level of study) .................................................................................. 88
3.7 Number of non-local students from the different levels of programmes, 2011/2012
(categorized by academic field, level of study) .................................................................................. 89
3.8 Number of graduated students, 2002/2003 - 2011/2012
(categorized by institution, gender, academic year) ........................................................................... 90
3.9 Number of graduated students, 2002/2003 - 2011/2012
(categorized by institution, programme nature, academic year) ........................................................ 91
3.10 Number of graduated students, 2002/2003 - 2011/2012
(categorized by institution, local and non-local student, academic year) .......................................... 92
4. Data of the Non-local Higher Education Programmes in 2012
Explanatory Notes ......................................................................................................................................... 93
4.1 Overall situation of the non-local programmes, 2012 (categorized by non-local institution) ............ 94
51
4.2 Number of registered students in the non-local programmes, 2012
(categorized by non-local institution and local partner institution, level of study) ............................ 95
4.3 Number of registered students in the non-local programmes, 2012
(categorized by academic field, level of study) .................................................................................. 97
4.4 Number of first-year/newly registered students in the non-local programmes, 2012
(categorized by non-local institution and local partner institution, gender, level of study) ............... 98
4.5 Number of graduated students from the non-local programmes, 2012
(categorized by non-local institution and local partner institution, gender) ....................................... 99
4.6 Number of graduated students from the non-local programmes, 2012
(categorized by non-local institution and local partner institution, level of study) .......................... 100
4.7 Number of registered students in the non-local programmes, 2010 - 2012
(categorized by level of study, gender, academic year) ................................................................... 101
4.8 Number of graduated students from the non-local programmes, 2010 - 2012
(categorized by level of study, gender, academic year) ................................................................... 101
5. Data of Macao Students Studying Higher Education in Places Outside Macao for the Academic
Year 2012/2013
Explanatory Notes ....................................................................................................................................... 102
5.1 Number of students studying outside of Macao, 2011/2012
(categorized by location of the institution, gender, level of study) .................................................. 103
5.2 Number of students studying outside of Macao, 2011/2012
(categorized by academic field, level of study) ................................................................................ 106
5.3 Number of students studying in the best 100 universities in the world, 2011/2012
(categorized by the university ranking, level of study) .................................................................... 107
5.4 Number of students studying in the best 100 universities in the world, 2011/2012
(categorized by academic field, level of study) ................................................................................ 110
6. Higher Education Indicators of Macao for the Academic Year 2012/2013
Explanatory Notes ....................................................................................................................................... 111
6.1 Ratio of full-time teaching staff in the higher education institutions of Macao, 2012/2013 ............ 112
6.2 Ratio of female teaching staff in the higher education institutions of Macao, 2012/2013 ................ 112
6.3 Ratio of non-local teaching staff in the higher education institutions of Macao, 2012/2013 ........... 113
6.4 Ratio of teaching staff with a PhD in the higher education institutions of Macao, 2012/2013......... 113
6.5 Ratio of full-time administrative support staff to full-time teaching staff in in the higher
education institutions of Macao, 2012/2013 ..................................................................................... 114
6.6 Student-teacher Ratio in the higher education institutions of Macao, 2012/2013 ............................ 114
6.7 Male-female students ratio in the higher education institutions of Macao, 2012/2013 .................... 115
6.8 Ratio of non-local students in the higher education institutions of Macao, 2012/2013 .................... 116
6.9 Ratio of postgraduate students in the higher education institutions of Macao, 2012/2013 ............... 117
6.10 Gross enrollment ratio in higher education of Macao, 2012/2013 .................................................... 117

52
Data of the Teaching Staff working in Higher education institutions in Macao
for the Academic Year 2012/2013
Explanatory Notes:
I. The following data on the teaching staff for the 2012/2013 academic year are accurate as of October
31st, 2012.
II. The ‘academic year’ used in this document refers to the school year, which generally starts on
September 1st every year and ends on August 31st of the following year.
III. Information on the previous academic years has been included in the last section of this document
for reference purposes.
IV. According to the relevant requirements of Decree Law No. 5/95/M “General Rules of the Academy of
Public Security Forces (ESFSM)”, the ESFSM teaching staff will be composed of military teaching staff
and civilian teachers. The teaching positions at the ESFSM shall be held by personnel from the
Public Security Force with the relevant experience and qualifications, while the other posts shall be
held by teaching staff from the University of Macao or other members of the Academy of Public
Security Forces on a part-time basis, as agreed upon.
V. The ‘local’ staff mentioned in this document refers to teachers who hold valid Macao Resident
Identity Cards. Non-holders are called ‘non-local teachers.
VI. Certain figures are missing (indicated by ‘--’) in some of the columns in the tables of this document
for one of the following reasons:
(1) Lack of information.
(2) The category is not applicable to that institution.
(3) The institution failed to provide the information.
VII. Some of the percentages in the tables below have been rounded off to two decimal places, so the
aggregate of some of the percentages may not add up to 100%.
VIII. The numbers in the tables containing the number of full-time staff have been rounded off so the
aggregate of the figures in these tables may not correspond exactly to the corresponding subtotal or
total values.
IX. In the tables containing the number of full-time professors, a zero represents a value less than 0.5
while ‘--’ indicates a value of zero.
X. The teaching staff involved in the programmes jointly offered by higher education institutions from
Macao and institutions from the Mainland which were given by ad-hoc/exchange teaching staff
have not been included in the figures on the teaching personnel from the 2010/2011 previous
academic years.
XI. The abbreviations and expressions used in this document are only applicable here.

53
1.1 Number of staff, 2012/2013
(categorized by institution, gender, mode of employment, local and non-local staff)
Institution Gender Full-time Part-time Subtotal
Total Local Non-local Local Non-local Full-time Part-time Local Non-local
UM
M 542 89 52 63 631 115 594 152 746
F 551 42 18 31 593 49 569 73 642
Subtotal 1,093 131 70 94 1,224 164 1,163 225 1,388
IPM
M 260 24 50 24 284 74 310 48 358
F 288 11 40 5 299 45 328 16 344
Subtotal 548 35 90 29 583 119 638 64 702
IFT
M 126 6 17 4 132 21 143 10 153
F 166 8 13 2 174 15 179 10 189
Subtotal 292 14 30 6 306 36 322 20 342
ESFSM
M 78 -- 35 -- 78 35 113 -- 113
F 54 -- 5 -- 54 5 59 -- 59
Subtotal 132 -- 40 -- 132 40 172 -- 172
CITYU
M 45 17 21 36 62 57 66 53 119
F 48 13 8 11 61 19 56 24 80
Subtotal 93 30 29 47 123 76 122 77 199
USJ
M 44 11 19 25 55 44 63 36 99
F 44 7 28 6 51 34 72 13 85
Subtotal 88 18 47 31 106 78 135 49 184
KWNC
M 11 2 3 2 13 5 14 4 18
F 28 4 3 3 32 6 31 7 38
Subtotal 39 6 6 5 45 11 45 11 56
MUST
M 121 193 61 86 314 147 182 279 461
F 164 134 39 26 298 65 203 160 363
Subtotal 285 327 100 112 612 212 385 439 824
IGM
M 4 3 11 11 7 22 15 14 29
F 3 2 7 4 5 11 10 6 16
Subtotal 7 5 18 15 12 33 25 20 45
MMC
M 2 3 10 9 5 19 12 12 24
F -- -- 1 1 -- 2 1 1 2
Subtotal 2 3 11 10 5 21 13 13 26
Total
M 1,233 348 279 260 1,581 539 1,512 608 2,120
F 1,346 221 162 89 1,567 251 1,508 310 1,818
Total 2,579 569 441 349 3,148 790 3,020 918 3,938
% 65.49% 14.45% 11.20% 8.86% 79.94% 20.06% 76.69% 23.31% --

54
1.2 Number of staff, 2012/2013 (categorized by institution, gender, type of personnel)
Institution Gender Teaching Staff Non-teaching
Staff Researchers Total %
UM
M 384 298 67 746 18.94%
F 214 411 23 642 16.30%
Subtotal 598 709 90 1,388 35.25%
IPM
M 204 150 30 358 9.09%
F 147 201 9 344 8.74%
Subtotal 351 351 39 702 17.83%
IFT
M 60 93 -- 153 3.89%
F 49 138 2 189 4.80%
Subtotal 109 231 2 342 8.68%
ESFSM
M 37 76 -- 113 2.87%
F 5 54 -- 59 1.50%
Subtotal 42 130 -- 172 4.37%
CITYU
M 85 20 27 119 3.02%
F 60 37 9 80 2.03%
Subtotal 145 57 36 199 5.05%
USJ
M 73 16 1 99 2.51%
F 36 24 3 85 2.16%
Subtotal 109 40 4 184 4.67%
KWNC
M 9 10 -- 18 0.46%
F 23 16 1 38 0.96%
Subtotal 32 26 1 56 1.42%
MUST
M 294 141 27 461 11.71%
F 172 185 7 363 9.22%
Subtotal 466 326 34 824 20.92%
IGM
M 26 3 1 29 0.74%
F 12 4 -- 16 0.41%
Subtotal 38 7 1 45 1.14%
MMC
M 24 7 -- 24 0.61%
F 2 9 -- 2 0.05%
Subtotal 26 16 -- 26 0.66%
Total
M 1,196 814 153 2,120 53.83%
F 720 1,079 54 1,818 46.17%
Total 1,916 1,893 207 3,938 --
Note: Some of the teaching staff also carries out non-teaching or research work. Therefore, the sum of the teaching staff,
non-teaching staff and researchers excludes the number of repeated staff members.
55
1.3 Number of teaching staff, 2012/2013
(categorized by institution, gender, mode of employment, local and non-local staff)
Institution Gender Full-time Part-time Subtotal
Total Local Non-local Local Non-local Full-time Part-time Local Non-local
UM
M 255 80 38 11 335 49 293 91 384
F 151 38 11 14 189 25 162 52 214
Subtotal 406 118 49 25 524 74 455 143 598
IPM
M 114 16 50 24 130 74 164 40 204
F 92 10 40 5 102 45 132 15 147
Subtotal 206 26 90 29 232 119 296 55 351
IFT
M 34 5 17 4 39 21 51 9 60
F 26 8 13 2 34 15 39 10 49
Subtotal 60 13 30 6 73 36 90 19 109
ESFSM
M 2 -- 35 -- 2 35 37 -- 37
F -- -- 5 -- -- 5 5 -- 5
Subtotal 2 -- 40 -- 2 40 42 -- 42
CITYU
M 21 7 20 25 28 45 41 32 73
F 16 4 7 9 20 16 23 13 36
Subtotal 37 11 27 34 48 61 64 45 109
USJ
M 32 10 18 25 42 43 50 35 85
F 20 6 28 6 26 34 48 12 60
Subtotal 52 16 46 31 68 77 98 47 145
KWNC
M 3 1 3 2 4 5 6 3 9
F 13 4 3 3 17 6 16 7 23
Subtotal 16 5 6 5 21 11 22 10 32
MUST
M 50 108 52 84 158 136 102 192 294
F 26 91 29 26 117 55 55 117 172
Subtotal 76 199 81 110 275 191 157 309 466
IGM
M 3 1 11 11 4 22 14 12 26
F 1 -- 7 4 1 11 8 4 12
Subtotal 4 1 18 15 5 33 22 16 38
MMC
M 2 3 10 9 5 19 12 12 24
F -- -- 1 1 -- 2 1 1 2
Subtotal 2 3 11 10 5 21 13 13 26
Total
M 516 231 254 195 747 449 770 426 1,196
F 345 161 144 70 506 214 489 231 720
Total 861 392 398 265 1,253 663 1,259 657 1,916
% 44.94% 20.46% 20.77% 13.83% 65.40% 34.60% 65.71% 34.29% --

56
1.4 Number of non-local teaching staff, 2012/2013 (categorized by institution, gender , place of region)
Institution Gender Asia
Europe Africa North
America
South
America Oceania Total
Mainland
China
Hong
Kong Taiwan Other
UM
M 18 35 -- 5 10 -- 19 2 2 91
F 8 14 4 3 10 -- 12 1 -- 52
Subtotal 26 49 4 8 20 -- 31 3 2 143
IPM
M 5 30 1 -- 1 -- 3 -- -- 40
F 3 6 2 -- 3 -- 1 -- -- 15
Subtotal 8 36 3 -- 4 -- 4 -- -- 55
IFT
M -- 5 -- 1 2 -- 1 -- -- 9
F 3 3 -- 1 1 -- 1 -- 1 10
Subtotal 3 8 -- 2 3 -- 2 -- 1 19
ESFSM
M -- -- -- -- -- -- -- -- -- --
F -- -- -- -- -- -- -- -- -- --
Subtotal -- -- -- -- -- -- -- -- -- --
CITYU
M 17 13 -- -- -- -- 2 -- -- 32
F 10 3 -- -- -- -- -- -- -- 13
Subtotal 27 16 -- -- -- -- 2 -- -- 45
USJ
M 1 6 -- 6 10 -- 8 1 3 35
F 2 2 -- 2 3 -- 3 -- -- 12
Subtotal 3 8 -- 8 13 -- 11 1 3 47
KWNC
M 3 -- -- -- -- -- -- -- 3
F 4 3 -- -- -- -- -- -- -- 7
Subtotal 7 3 -- -- -- -- -- -- -- 10
MUST
M 126 34 17 3 1 1 10 -- -- 192
F 90 14 9 3 -- -- 1 -- -- 117
Subtotal 216 48 26 6 1 1 11 -- -- 309
IGM
M 1 11 -- -- -- -- -- -- -- 12
F -- 4 -- -- -- -- -- -- -- 4
Subtotal 1 15 -- -- -- -- -- -- -- 16
MMC
M 4 6 1 -- -- -- 1 -- -- 12
F 1 -- -- -- -- -- -- -- -- 1
Subtotal 5 6 1 -- -- -- 1 -- -- 13
Total
M 175 140 19 15 24 1 44 3 5 426
F 121 49 15 9 17 -- 18 1 1 231
Total 296 189 34 24 41 1 62 4 6 657
% 45.05% 28.77% 5.18% 3.65% 6.24% 0.15% 9.44% 0.61% 0.91% --

57
1.5 Number of teaching staff (full time equivalents), 2012/2013
(categorized by institution, gender, mode of employment, local and non-local staff)
Institution Gender Full-time Part-time Subtotal
Total Local Non-local Local Non-local Full-time Part-time Local Non-local
UM
M 244 73 14 4 317 18 258 77 335
F 140 33 5 11 172 16 145 43 188
Subtotal 384 105 19 15 489 34 403 121 523
IPM
M 97 12 10 5 109 15 107 17 124
F 79 9 9 1 88 10 88 10 98
Subtotal 176 21 19 6 197 25 195 28 222
IFT
M 34 5 8 1 39 9 42 6 48
F 26 8 6 0 34 6 32 8 40
Subtotal 60 13 14 1 73 16 74 14 89
ESFSM
M 2 -- 14 -- 2 14 16 -- 16
F -- -- 3 -- -- 3 3 -- 3
Subtotal 2 -- 16 -- 2 16 18 -- 18
CITYU
M 13 5 10 12 18 22 23 17 40
F 8 2 4 5 10 8 11 7 18
Subtotal 21 7 14 17 28 30 34 24 58
USJ
M 27 10 11 8 36 19 38 18 55
F 17 5 18 2 22 20 35 7 42
Subtotal 44 15 28 11 59 39 73 25 98
KWNC
M 2 1 0 0 3 0 3 1 4
F 11 4 1 0 15 1 11 4 15
Subtotal 13 5 1 0 18 1 14 5 19
MUST
M 43 90 28 38 133 66 71 128 199
F 25 85 15 11 110 25 40 96 136
Subtotal 69 175 42 49 244 91 111 224 334
IGM
M 2 1 3 3 2 7 5 4 9
F 1 -- 2 1 1 3 3 1 4
Subtotal 2 1 5 5 3 10 7 5 12
MMC
M 1 1 3 2 2 5 4 3 7
F -- -- 0 0 -- 0 0 0 0
Subtotal 1 1 3 3 2 6 4 4 7
Total
M 465 198 101 73 661 175 567 271 837
F 307 146 63 31 452 92 368 176 544
Total 772 344 164 104 1,113 267 935 447 1,381
% 55.90% 24.91% 11.88% 7.53% 80.59% 19.33% 67.70% 32.37% --
Note: 1. The figures indicated in the table have been rounded off. As such, they may differ slightly from the actual total or
subtotal values.
2. Values of zero in the table indicate an actual number of less than 0.5. Actual values of zeroes are indicated by "--".

58
1.6 Number of non-teaching staff, 2012/2013
(categorized by institution, gender, mode of employment, local and non-local staff)
Institution Gender Full-time Part-time Subtotal
Total Local Non-local Local Non-local Full-time Part-time Local Non-local
UM
M 287 9 2 -- 296 2 289 298 9
F 402 5 3 1 407 4 405 411 6
Subtotal 689 14 5 1 703 6 694 709 15
IPM
M 141 9 -- -- 150 -- 141 150 9
F 199 2 -- -- 201 -- 199 201 2
Subtotal 340 11 -- -- 351 -- 340 351 11
IFT
M 92 1 -- -- 93 -- 92 93 1
F 138 -- -- -- 138 -- 138 138 --
Subtotal 230 1 -- -- 231 -- 230 231 1
ESFSM
M 76 -- -- -- 76 -- 76 76 --
F 54 -- -- -- 54 -- 54 54 --
Subtotal 130 -- -- -- 130 -- 130 130 --
CITYU
M 14 6 -- -- 20 -- 14 20 6
F 29 8 -- -- 37 -- 29 37 8
Subtotal 43 14 -- -- 57 -- 43 57 14
USJ
M 14 1 1 -- 15 1 15 16 1
F 23 1 -- -- 24 -- 23 24 1
Subtotal 37 2 1 -- 39 1 38 40 2
KWNC
M 9 1 -- -- 10 -- 9 10 1
F 16 -- -- -- 16 -- 16 16 --
Subtotal 25 1 -- -- 26 -- 25 26 1
MUST
M 64 67 9 1 131 10 73 141 68
F 134 41 10 -- 175 10 144 185 41
Subtotal 198 108 19 1 306 20 217 326 109
IGM
M 1 2 -- -- 3 -- 1 3 2
F 2 2 -- -- 4 -- 2 4 2
Subtotal 3 4 -- -- 7 -- 3 7 4
MMC
M 4 2 1 -- 6 1 5 7 2
F 5 -- 4 -- 5 4 9 9 --
Subtotal 9 2 5 -- 11 5 14 16 2
Total
M 702 98 13 1 800 14 715 814 99
F 1,002 59 17 1 1,061 18 1,019 1,079 60
Total 1,704 157 30 2 1,861 32 1,734 1,893 159
% 90.02% 8.29% 1.58% 0.11% 98.31% 1.69% 91.60% -- 8.40%

59
1.7 Number of research staff, 2012/2013
(categorized by institution, gender, mode of employment, local and non-local staff)
Institution Gender Full-time Part-time Subtotal
Total Local Non-local Local Non-local Full-time Part-time Local Non-local
UM
M -- 1 53 13 1 66 14 67 53
F -- -- 18 5 -- 23 5 23 18
Subtotal -- 1 71 18 1 89 19 90 71
IPM
M 3 27 -- -- 30 -- 27 30 3
F -- 9 -- -- 9 -- 9 9 --
Subtotal 3 36 -- -- 39 -- 36 39 3
IFT
M -- -- -- -- -- -- -- -- --
F -- 2 -- -- 2 -- 2 2 --
Subtotal -- 2 -- -- 2 -- 2 2 --
ESFSM
M -- -- -- -- -- -- -- -- --
F -- -- -- -- -- -- -- -- --
Subtotal -- -- -- -- -- -- -- -- --
CITYU
M 4 10 11 2 14 13 12 27 15
F 1 5 2 1 6 3 6 9 3
Subtotal 5 15 13 3 20 16 18 36 18
USJ
M -- 1 -- -- 1 -- 1 1 --
F -- 3 -- -- 3 -- 3 3 --
Subtotal -- 4 -- -- 4 -- 4 4 --
KWNC
M -- -- -- -- -- -- -- -- --
F -- 1 -- -- 1 -- 1 1 --
Subtotal -- 1 -- -- 1 -- 1 1 --
MUST
M 18 8 1 -- 26 1 8 27 19
F 2 5 -- -- 7 -- 5 7 2
Subtotal 20 13 1 -- 33 1 13 34 21
IGM
M -- -- 1 -- -- 1 -- 1 1
F -- -- -- -- -- -- -- -- --
Subtotal -- -- 1 -- -- 1 -- 1 1
MMC
M -- -- -- -- -- -- -- -- --
F -- -- -- -- -- -- -- -- --
Subtotal -- -- -- -- -- -- -- -- --
Total
M 25 47 66 15 72 81 62 153 91
F 3 25 20 6 28 26 31 54 23
Total 28 72 86 21 100 107 93 207 114
% 13.53% 34.78% 41.55% 10.14% 48.31% 51.69% 44.93% -- 55.07%
60
1.8 Number of teaching staff, 2003/2004 - 2012/2013 (categorized by institution, gender, academic year)
Institution Gender 2003/04 2004/05 2005/06 2006/07 2007/08 2008/09 2009/10 2010/11 2011/12 2012/13
UM
M 238 260 266 268 280 293 298 282 380 384
F 120 124 130 121 130 137 145 144 206 214
Subtotal 358 384 396 389 410 430 443 426 586 598
IPM
M 229 233 199 208 218 218 234 212 187 204
F 139 145 128 141 138 146 140 145 140 147
Subtotal 368 378 327 349 356 364 374 357 327 351
IFT
M 43 39 49 52 54 61 58 63 56 60
F 28 33 39 39 42 40 37 44 41 49
Subtotal 71 72 88 91 96 101 95 107 97 109
ESFSM
M 16 25 22 19 28 26 37 29 36 37
F -- 4 5 4 4 5 8 6 7 5
Subtotal 16 29 27 23 32 31 45 35 43 42
CITYU
M 144 152 155 154 149 174 174 176 50 73
F 32 32 30 31 33 61 63 65 27 36
Subtotal 176 184 185 185 182 235 237 241 77 109
USJ
M 24 26 27 48 60 65 85 101 110 85
F 6 10 19 20 23 27 42 62 66 60
Subtotal 30 36 46 68 83 92 127 163 176 145
KWNC
M 6 10 12 11 12 11 10 9 10 9
F 25 29 28 27 26 25 28 30 27 23
Subtotal 31 39 40 38 38 36 38 39 37 32
MUST
M 89 246 282 369 403 412 431 257 277 294
F 32 96 101 143 170 154 170 127 133 172
Subtotal 121 342 383 512 573 566 601 384 410 466
IGM
M 26 24 27 28 27 30 29 29 28 26
F 9 7 7 5 6 7 8 8 8 12
Subtotal 35 31 34 33 33 37 37 37 36 38
MMC
M 18 22 31 29 20 47 47 44 44 24
F 5 4 14 8 3 12 8 7 7 2
Subtotal 23 26 45 37 23 59 55 51 51 26
Total
M 833 1,037 1,070 1,186 1,251 1,337 1,403 1,202 1,178 1,196
F 396 484 501 539 575 614 649 638 662 720
Total 1,229 1,521 1,571 1,725 1,826 1,951 2,052 1,840 1,840 1,916

61
1.9 Number of non-teaching staff, 2003/2004 - 2012/2013 (categorized by institution, gender, academic year)
Institution Gender 2003/04 2004/05 2005/06 2006/07 2007/08 2008/09 2009/10 2010/11 2011/12 2012/13
UM
M 184 185 192 205 203 223 247 257 286 298
F 136 145 170 197 219 239 283 322 377 411
Subtotal 320 330 362 402 422 462 530 579 663 709
IPM
M 102 105 98 107 107 114 120 120 150 150
F 113 122 125 129 183 142 153 166 207 201
Subtotal 215 227 223 236 290 256 273 286 357 351
IFT
M 42 45 54 54 64 65 75 83 96 93
F 41 41 50 52 74 87 100 119 139 138
Subtotal 83 86 104 106 138 152 175 202 235 231
ESFSM
M 73 74 75 75 72 71 77 77 72 76
F 41 43 42 44 47 43 48 52 49 54
Subtotal 114 117 117 119 119 114 125 129 121 130
CITYU
M 11 12 14 13 8 8 8 6 15 20
F 25 25 23 24 23 25 25 26 33 37
Subtotal 36 37 37 37 31 33 33 32 48 57
USJ
M 3 6 5 6 10 14 12 11 15 16
F 7 7 8 10 14 19 20 22 23 24
Subtotal 10 13 13 16 24 33 32 33 38 40
KWNC
M 2 4 6 6 8 7 6 6 7 10
F 10 10 12 12 12 12 11 13 14 16
Subtotal 12 14 18 18 20 19 17 19 21 26
MUST
M 54 97 115 83 81 72 92 85 135 141
F 76 158 176 124 118 124 154 142 175 185
Subtotal 130 255 291 207 199 196 246 227 310 326
IGM
M 3 5 6 7 7 6 6 7 3 3
F 9 7 8 10 12 11 11 15 6 4
Subtotal 12 12 14 17 19 17 17 22 9 7
MMC
M 4 8 9 10 11 10 9 9 9 7
F 8 10 9 15 15 17 17 17 7 9
Subtotal 12 18 18 25 26 27 26 26 16 16
Total
M 478 541 574 566 571 590 652 661 788 814
F 466 568 623 617 717 719 822 894 1,030 1,079
Total 944 1,109 1,197 1,183 1,288 1,309 1,474 1,555 1,818 1,893

62
1.10 Number of research staff, 2003/2004 - 2012/2013 (categorized by institution, gender, academic year)
Institution Gender 2003/04 2004/05 2005/06 2006/07 2007/08 2008/09 2009/10 2010/11 2011/12 2012/13
UM
M 11 10 11 12 11 5 1 1 53 67
F 5 5 5 5 3 4 1 -- 11 23
Subtotal 16 15 16 17 14 9 2 1 64 90
IPM
M -- 5 6 8 9 8 14 27 31 30
F -- 1 -- -- -- 1 3 11 11 9
Subtotal -- 6 6 8 9 9 17 38 42 39
IFT
M -- -- -- -- -- -- -- -- -- --
F -- -- -- -- -- 1 1 1 1 2
Subtotal -- -- -- -- -- 1 1 1 1 2
ESFSM
M -- -- -- -- -- -- -- -- -- --
F -- -- -- -- -- -- -- -- -- --
Subtotal -- -- -- -- -- -- -- -- -- --
CITYU
M -- -- -- -- -- -- -- -- 10 27
F -- -- -- -- -- -- -- -- 3 9
Subtotal -- -- -- -- -- -- -- -- 13 36
USJ
M -- -- -- -- -- -- -- -- 1 1
F -- -- -- -- -- -- -- -- 1 3
Subtotal -- -- -- -- -- -- -- -- 2 4
KWNC
M -- -- -- -- -- -- -- -- -- --
F -- -- 2 -- -- 1 1 1 2 1
Subtotal -- -- 2 -- -- 1 1 1 2 1
MUST
M -- -- 10 3 1 2 2 2 19 27
F -- -- 4 1 1 1 1 1 15 7
Subtotal -- -- 14 4 2 3 3 3 34 34
IGM
M -- -- -- -- -- -- -- 2 2 1
F -- -- 1 1 1 1 1 -- -- --
Subtotal -- -- 1 1 1 1 1 2 2 1
MMC
M -- -- -- -- -- -- -- -- -- --
F -- -- -- -- -- 1 1 1 -- --
Subtotal -- -- -- -- -- 1 1 1 -- --
Total
M 11 15 27 23 21 15 17 32 116 153
F 5 6 12 7 5 10 9 15 44 54
Total 16 21 39 30 26 25 26 47 160 207
63
Data of Registered Students in the Higher Education Institutions of Macao
for the Academic Year 2012/2013
Explanatory Notes:
I. The following data of registered students for the 2012/2013 academic year are accurate as of
October 31st, 2012.
II. The ‘academic year’ used in this document refers to the school year, which generally starts on
September 1st every year and ends on August 31st of the following year.
III. Information on the previous academic years has been included in the last part of this document for
reference purposes.
IV. This document uses certain terms which have been briefly defined below:
(1) ‘Registered students’ refers to students who have completed the registration procedures and
met all admission requirements.
(2) ‘Local students’ refers to students holding Macao resident identity cards. Non-holders are
referred as ‘non-local students’.
(3) Full-time programmes include day and evening programmes which are divided by academic
years / semesters. The main lectures are given during the daytime or evening on weekdays, on a
continuous, face-to-face basis.
V. Certain figures are missing (indicated by ‘--’) in some of the columns in the tables of this document
for one of the following reasons:
(1) Lack of information.
(2) The category is not applicable to that institution.
(3) The relevant institution failed to provide the information.
VI. Some of the percentages in the tables below have been rounded off to two decimal places, so the
aggregate of some of the percentages may not add up to 100%.
VII. The registered students referenced in this document have been categorized based on academic
disciplines and majors. Using the ‘International Standard Classification of Education’ (ISCED) of
UNESCO and taking the local higher education curriculum into consideration, the students have
been categorized into 7 academic areas, with a number of majors under each area, which add up to
30 majors altogether.
VIII. The data for the number of registered non-local students excludes students in programmes
operated jointly by local higher education institutions and higher education institutions in Mainland
China since the 2011/2012 academic year.
IX. The abbreviations and expressions used in this document are only applicable here.

64
2.1 Number of registered students, 2012/2013
(categorized by institution, gender, programme nature, local and non-local student)
Institution Gender Full-time Part-time Subtotal
Total Local Non-local Local Non-local Full-time Part-time Local Non-local
UM
M 2,459 1,057 -- -- 3,516 -- 2,459 1,057 3,516
F 3,415 1,550 -- -- 4,965 -- 3,415 1,550 4,965
Subtotal 5,874 2,607 -- -- 8,481 -- 5,874 2,607 8,481
IPM
M 1,086 180 -- -- 1,266 -- 1,086 180 1,266
F 1,406 289 -- -- 1,695 -- 1,406 289 1,695
Subtotal 2,492 469 -- -- 2,961 -- 2,492 469 2,961
IFT
M 393 49 -- -- 442 -- 393 49 442
F 984 147 -- -- 1,131 -- 984 147 1,131
Subtotal 1,377 196 -- -- 1,573 -- 1,377 196 1,573
ESFSM
M 57 1 -- -- 58 -- 57 1 58
F 15 -- -- -- 15 -- 15 -- 15
Subtotal 72 1 -- -- 73 -- 72 1 73
CITYU
M 388 278 233 8 666 241 621 286 907
F 374 256 239 2 630 241 613 258 871
Subtotal 762 534 472 10 1,296 482 1,234 544 1,778
USJ
M 635 98 -- -- 733 -- 635 98 733
F 879 72 -- -- 951 -- 879 72 951
Subtotal 1,514 170 -- -- 1,684 -- 1,514 170 1,684
KWNC
M 28 -- 2 -- 28 2 30 -- 30
F 205 13 43 14 218 57 248 27 275
Subtotal 233 13 45 14 246 59 278 27 305
MUST
M 2,543 2,371 -- -- 4,914 -- 2,543 2,371 4,914
F 2,513 2,938 -- -- 5,451 -- 2,513 2,938 5,451
Subtotal 5,056 5,309 -- -- 10,365 -- 5,056 5,309 10,365
IGM
M -- -- 125 2 -- 127 125 2 127
F -- -- 233 2 -- 235 233 2 235
Subtotal -- -- 358 4 -- 362 358 4 362
MMC
M 113 -- -- -- 113 -- 113 -- 113
F 81 -- -- -- 81 -- 81 -- 81
Subtotal 194 -- -- -- 194 -- 194 -- 194
Total
M 7,702 4,034 360 10 11,736 370 8,062 4,044 12,106
F 9,872 5,265 515 18 15,137 533 10,387 5,283 15,670
Total 17,574 9,299 875 28 26,873 903 18,449 9,327 27,776
% 63.27% 33.48% 3.15% 0.10% 96.75% 3.25% 66.42% 33.58% --
65
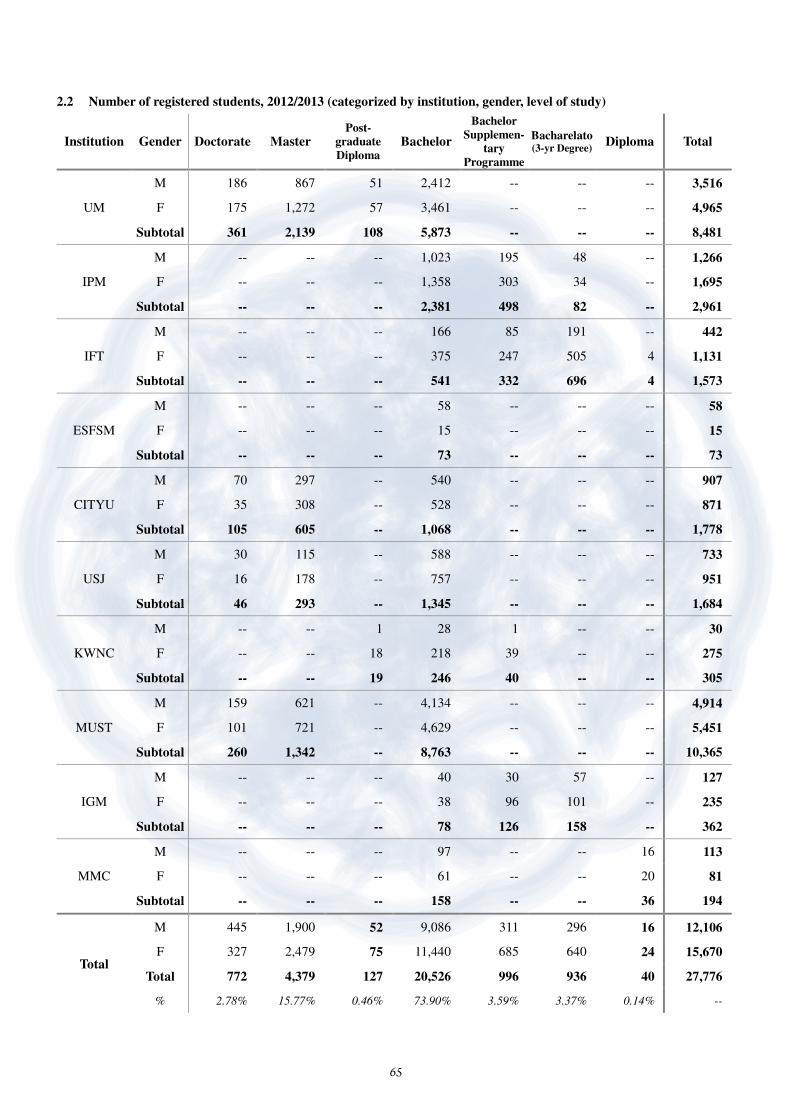
2.2 Number of registered students, 2012/2013 (categorized by institution, gender, level of study)
Institution Gender Doctorate Master Post-
graduate
Diploma Bachelor
Bachelor
Supplemen-
tary
Programme
Bacharelato (3-yr Degree)
Diploma Total
UM
M 186 867 51 2,412 -- -- -- 3,516
F 175 1,272 57 3,461 -- -- -- 4,965
Subtotal 361 2,139 108 5,873 -- -- -- 8,481
IPM
M -- -- -- 1,023 195 48 -- 1,266
F -- -- -- 1,358 303 34 -- 1,695
Subtotal -- -- -- 2,381 498 82 -- 2,961
IFT
M -- -- -- 166 85 191 -- 442
F -- -- -- 375 247 505 4 1,131
Subtotal -- -- -- 541 332 696 4 1,573
ESFSM
M -- -- -- 58 -- -- -- 58
F -- -- -- 15 -- -- -- 15
Subtotal -- -- -- 73 -- -- -- 73
CITYU
M 70 297 -- 540 -- -- -- 907
F 35 308 -- 528 -- -- -- 871
Subtotal 105 605 -- 1,068 -- -- -- 1,778
USJ
M 30 115 -- 588 -- -- -- 733
F 16 178 -- 757 -- -- -- 951
Subtotal 46 293 -- 1,345 -- -- -- 1,684
KWNC
M -- -- 1 28 1 -- -- 30
F -- -- 18 218 39 -- -- 275
Subtotal -- -- 19 246 40 -- -- 305
MUST
M 159 621 -- 4,134 -- -- -- 4,914
F 101 721 -- 4,629 -- -- -- 5,451
Subtotal 260 1,342 -- 8,763 -- -- -- 10,365
IGM
M -- -- -- 40 30 57 -- 127
F -- -- -- 38 96 101 -- 235
Subtotal -- -- -- 78 126 158 -- 362
MMC
M -- -- -- 97 -- -- 16 113
F -- -- -- 61 -- -- 20 81
Subtotal -- -- -- 158 -- -- 36 194
Total
M 445 1,900 52 9,086 311 296 16 12,106
F 327 2,479 75 11,440 685 640 24 15,670
Total 772 4,379 127 20,526 996 936 40 27,776
% 2.78% 15.77% 0.46% 73.90% 3.59% 3.37% 0.14% --

66
2.3 Number of local registered students, 2012/2013 (categorized by institution, gender, level of study)
Institution Gender Doctorate Master Post-
graduate
Diploma Bachelor
Bachelor
Supplemen-
tary
Programme
Bacharelato (3-yr Degree)
Diploma Total
UM
M 30 445 51 1,933 -- -- -- 2,459
F 30 533 56 2,796 -- -- -- 3,415
Subtotal 60 978 107 4,729 -- -- -- 5,874
IPM
M -- -- -- 875 166 45 -- 1,086
F -- -- -- 1,116 258 32 -- 1,406
Subtotal -- -- -- 1,991 424 77 -- 2,492
IFT
M -- -- -- 152 75 166 -- 393
F -- -- -- 340 207 433 4 984
Subtotal -- -- -- 492 282 599 4 1,377
ESFSM
M -- -- -- 57 -- -- -- 57
F -- -- -- 15 -- -- -- 15
Subtotal -- -- -- 72 -- -- -- 72
CITYU
M 8 118 -- 495 -- -- -- 621
F 5 144 -- 464 -- -- -- 613
Subtotal 13 262 -- 959 -- -- -- 1,234
USJ
M 20 92 -- 523 -- -- -- 635
F 14 162 -- 703 -- -- -- 879
Subtotal 34 254 -- 1,226 -- -- -- 1,514
KWNC
M -- -- 1 28 1 -- -- 30
F -- -- 18 205 25 -- -- 248
Subtotal -- -- 19 233 26 -- -- 278
MUST
M 31 180 -- 2,332 -- -- -- 2,543
F 16 214 -- 2,283 -- -- -- 2,513
Subtotal 47 394 -- 4,615 -- -- -- 5,056
IGM
M -- -- -- 40 28 57 -- 125
F -- -- -- 38 94 101 -- 233
Subtotal -- -- -- 78 122 158 -- 358
MMC
M -- -- -- 97 -- -- 16 113
F -- -- -- 61 -- -- 20 81
Subtotal -- -- -- 158 -- -- 36 194
Total
M 89 835 52 6,532 270 268 16 8,062
F 65 1,053 74 8,021 584 566 24 10,387
Total 154 1,888 126 14,553 854 834 40 18,449
% 0.83% 10.23% 0.68% 78.88% 4.63% 4.52% 0.22% --

67
2.4 Number of non-local registered students, 2012/2013 (categorized by institution, gender, level of study)
Institution Gender Doctorate Master Post-
graduate
Diploma Bachelor
Bachelor
Supplemen-
tary
Programme
Bacharelato (3-yr Degree)
Diploma Total
UM
M 156 422 -- 479 -- -- -- 1,057
F 145 739 1 665 -- -- -- 1,550
Subtotal 301 1,161 1 1,144 -- -- -- 2,607
IPM
M -- -- -- 148 29 3 -- 180
F -- -- -- 242 45 2 -- 289
Subtotal -- -- -- 390 74 5 -- 469
IFT
M -- -- -- 14 10 25 -- 49
F -- -- -- 35 40 72 -- 147
Subtotal -- -- -- 49 50 97 -- 196
ESFSM
M -- -- -- 1 -- -- -- 1
F -- -- -- -- -- -- -- --
Subtotal -- -- -- 1 -- -- -- 1
CITYU
M 62 179 -- 45 -- -- -- 286
F 30 164 -- 64 -- -- -- 258
Subtotal 92 343 -- 109 -- -- -- 544
USJ
M 10 23 -- 65 -- -- -- 98
F 2 16 -- 54 -- -- -- 72
Subtotal 12 39 -- 119 -- -- -- 170
KWNC
M -- -- -- -- -- -- -- --
F -- -- -- 13 14 -- -- 27
Subtotal -- -- -- 13 14 -- -- 27
MUST
M 128 441 -- 1,802 -- -- -- 2,371
F 85 507 -- 2,346 -- -- -- 2,938
Subtotal 213 948 -- 4,148 -- -- -- 5,309
IGM
M -- -- -- -- 2 -- -- 2
F -- -- -- -- 2 -- -- 2
Subtotal -- -- -- -- 4 -- -- 4
MMC
M -- -- -- -- -- -- -- --
F -- -- -- -- -- -- -- --
Subtotal -- -- -- -- -- -- -- --
Total
M 356 1,065 -- 2,554 41 28 -- 4,044
F 262 1,426 1 3,419 101 74 -- 5,283
Total 618 2,491 1 5,973 142 102 -- 9,327
% 6.63% 26.71% 0.01% 64.04% 1.52% 1.09% -- --

68
2.5 Number of non-local registered students, 2012/2013 (categorized by institution, gender, place of origin)
Institution Gender Asia
Europe Africa North
America
South
America Oceania Total
Mainland
China
Hong
Kong Taiwan Other
UM
M 933 17 2 12 52 24 12 5 -- 1,057
F 1443 23 5 26 31 14 3 4 1 1,550
Subtotal 2,376 40 7 38 83 38 15 9 1 2,607
IPM
M 160 4 3 -- 13 -- -- -- -- 180
F 269 1 2 -- 16 1 -- -- -- 289
Subtotal 429 5 5 -- 29 1 -- -- -- 469
IFT
M 39 5 -- 3 2 -- -- -- -- 49
F 122 6 1 7 8 -- 1 2 -- 147
Subtotal 161 11 1 10 10 -- 1 2 -- 196
ESFSM
M 1 -- -- -- -- -- -- -- -- 1
F -- -- -- -- -- -- -- -- -- --
Subtotal 1 -- -- -- -- -- -- -- -- 1
CITYU
M 267 15 -- 1 -- 3 -- -- -- 286
F 247 8 -- -- -- 1 -- 1 1 258
Subtotal 514 23 -- 1 -- 4 -- 1 1 544
USJ
M 8 15 -- 40 16 9 3 7 -- 98
F 5 14 1 30 12 5 2 3 -- 72
Subtotal 13 29 1 70 28 14 5 10 -- 170
KWNC
M -- -- -- -- -- -- -- -- -- --
F 25 2 -- -- -- -- -- -- -- 27
Subtotal 25 2 -- -- -- -- -- -- -- 27
MUST
M 2,329 18 18 2 3 -- -- -- 1 2,371
F 2,923 7 3 2 2 -- -- -- 1 2,938
Subtotal 5,252 25 21 4 5 -- -- -- 2 5,309
IGM
M 2 -- -- -- -- -- -- -- -- 2
F 1 1 -- -- -- -- -- -- -- 2
Subtotal 3 1 -- -- -- -- -- -- -- 4
MMC
M -- -- -- -- -- -- -- -- -- --
F -- -- -- -- -- -- -- -- -- --
Subtotal -- -- -- -- -- -- -- -- -- --
Total
M 3,739 74 23 58 86 36 15 12 1 4,044
F 5,035 62 12 65 69 21 6 10 3 5,283
Total 8,774 136 35 123 155 57 21 22 4 9,327
% 94.07% 1.46% 0.38% 1.32% 1.66% 0.61% 0.23% 0.24% 0.04% --

69
2.6 Number of students registered in the different levels of programmes, 2012/2013
(categorized by academic field, level of study)
Broad
Groups Area of Study Doctorate Master
Post-
graduate
Diploma Bachelor
Bachelor
Supplemen-
tary
Programme
Bacharelato
(3-yr
Degree) Diploma Total
Education
Teacher Training -- -- 29 502 -- -- -- 531
Education Science 30 171 -- 7 -- -- -- 208
Physical Education -- 47 -- 223 21 -- -- 291
Sub-total 30 218 29 732 21 -- -- 1,030
Humanities
and Arts
Humanities 15 108 -- 125 -- -- -- 248 Languages and
Literature 56 222 -- 948 -- -- -- 1,226
Translation -- 99 -- 406 113 7 -- 625
Design and Arts -- 11 -- 739 71 27 -- 848 Religion and
Theology 5 1 -- 35 -- -- -- 41
Sub-total 76 441 -- 2,253 184 34 -- 2,988
Social
Science,
Business
and Law
Social and
Behavioural Science 60 295 -- 857 -- -- -- 1,212
Cultural Heritage -- 11 -- 27 26 58 -- 122
Journalism and
Communication 32 146 -- 1,264 -- -- -- 1,442
Business and
Management 232 1,557 -- 6,857 241 178 -- 9,065
Gaming Management -- -- -- 389 -- -- -- 389
Public Administration 8 298 -- 517 40 13 -- 876
Law 79 389 78 855 -- -- -- 1,401
Sub-total 411 2,696 78 10,766 307 249 -- 14,507
Science
Life Sciences 57 -- -- 23 -- -- -- 80
Physical Sciences -- -- -- -- -- -- -- --
Mathematics 11 41 -- 73 -- -- -- 125
Computing and
Information
Technology 48 225 -- 703 13 3 -- 992
Sub-total 116 266 -- 799 13 3 -- 1,197
Architecture
and
Engineering
Engineering 48 181 -- 299 -- -- -- 528
Manufacturing and
Processing -- -- -- -- -- -- -- --
Architecture, Building
and Town Planning 12 81 -- 201 -- -- -- 294
Sub-total 60 262 -- 500 -- -- -- 822
Health and
Social
Welfare
Medicine 6 31 -- 274 -- -- -- 311
Nursing and Health 14 90 19 530 67 -- -- 720
Pharmacy 24 121 -- 76 -- 2 -- 223
Social Services -- 1 -- 385 98 10 -- 494
Sub-total 44 243 19 1,265 165 12 -- 1,748
Services
Tourism and
Entertainment 30 253 1 4,121 306 638 40 5,389
Logistic and
Transportation -- -- -- -- -- -- -- --
Environmental
Protection 5 -- -- 5 -- -- -- 10
Security -- -- -- 73 -- -- -- 73
Sub-total 35 253 1 4,199 306 638 40 5,472
Unknown or Unspecified -- -- -- 12 -- -- -- 12
Total 772 4,379 127 20,526 996 936 40 27,776

70
2.7 Number of local students registered in the different levels of programmes, 2012/2013
(categorized by academic field, level of study)
Broad
Groups Area of Study Doctorate Master
Post-
graduate
Diploma Bachelor
Bachelor
Supplemen-
tary
Programme
Bacharelato
(3-yr
Degree) Diploma Total
Education
Teacher Training -- -- 29 468 -- -- -- 497
Education Science 17 126 -- 5 -- -- -- 148
Physical Education -- 29 -- 220 21 -- -- 270
Sub-total 17 155 29 693 21 -- -- 915
Humanities
and Arts
Humanities 2 48 -- 106 -- -- -- 156
Languages and
Literature 7 87 -- 741 -- -- -- 835
Translation -- 60 -- 273 83 6 -- 422
Design and Arts -- 5 -- 391 56 26 -- 478
Religion and
Theology 3 -- -- -- -- -- -- 3
Sub-total 12 200 -- 1,511 139 32 -- 1,894
Social
Science,
Business
and Law
Social and
Behavioural Science 8 149 -- 708 -- -- -- 865
Cultural Heritage -- 11 -- 23 23 50 -- 107
Journalism and
Communication 7 31 -- 816 -- -- -- 854
Business and
Management 44 611 -- 4,202 209 177 -- 5,243
Gaming Management -- -- -- 358 -- -- -- 358
Public Administration 5 177 -- 469 40 12 -- 703
Law 13 104 77 522 -- -- -- 716
Sub-total 77 1,083 77 7,098 272 239 -- 8,846
Science
Life Sciences 3 -- -- 17 -- -- -- 20
Physical Sciences -- -- -- -- -- -- -- --
Mathematics -- 15 -- 54 -- -- -- 69
Computing and
Information
Technology 4 77 -- 352 12 2 -- 447
Sub-total 7 92 -- 423 12 2 -- 536
Architecture
and
Engineering
Engineering 15 81 -- 213 -- -- -- 309
Manufacturing and
Processing -- -- -- -- -- -- -- --
Architecture, Building
and Town Planning 2 45 -- 150 -- -- -- 197
Sub-total 17 126 -- 363 -- -- -- 506
Health and
Social
Welfare
Medicine -- 13 -- 194 -- -- -- 207
Nursing and Health 9 79 19 515 53 -- -- 675
Pharmacy -- 29 -- 65 -- 2 -- 96
Social Services -- 1 -- 382 98 10 -- 491
Sub-total 9 122 19 1,156 151 12 -- 1,469
Services
Tourism and
Entertainment 13 110 1 3,234 259 549 40 4,206
Logistic and
Transportation -- -- -- -- -- -- -- --
Environmental
Protection 2 -- -- 3 -- -- -- 5
Security -- -- -- 72 -- -- -- 72
Sub-total 15 110 1 3,309 259 549 40 4,283
Unknown or Unspecified -- -- -- -- -- -- -- --
Total 154 1,888 126 14,553 854 834 40 18,449

71
2.8 Number of non-local students registered in the different levels of programmes, 2012/2013
(categorized by academic field, level of study)
Broad
Groups Area of Study Doctorate Master
Post-
graduate
Diploma Bachelor
Bachelor
Supplemen-
tary
Programme
Bacharelato
(3-yr
Degree) Diploma Total
Education
Teacher Training -- -- -- 34 -- -- -- 34
Education Science 13 45 -- 2 -- -- -- 60
Physical Education -- 18 -- 3 -- -- -- 21
Sub-total 13 63 -- 39 -- -- -- 115
Humanities
and Arts
Humanities 13 60 -- 19 -- -- -- 92
Languages and
Literature 49 135 -- 207 -- -- -- 391
Translation -- 39 -- 133 30 1 -- 203
Design and Arts -- 6 -- 348 15 1 -- 370
Religion and
Theology 2 1 -- 35 -- -- -- 38
Sub-total 64 241 -- 742 45 2 -- 1,094
Social
Science,
Business
and Law
Social and
Behavioural Science 52 146 -- 149 -- -- -- 347
Cultural Heritage -- -- -- 4 3 8 -- 15
Journalism and
Communication 25 115 -- 448 -- -- -- 588
Business and
Management 188 946 -- 2,655 32 1 -- 3,822
Gaming Management -- -- -- 31 -- -- -- 31
Public Administration 3 121 -- 48 -- 1 -- 173
Law 66 285 1 333 -- -- -- 685
Sub-total 334 1,613 1 3,668 35 10 -- 5,661
Science
Life Sciences 54 -- -- 6 -- -- -- 60
Physical Sciences -- -- -- -- -- -- -- --
Mathematics 11 26 -- 19 -- -- -- 56
Computing and
Information
Technology 44 148 -- 351 1 1 -- 545
Sub-total 109 174 -- 376 1 1 -- 661
Architecture
and
Engineering
Engineering 33 100 -- 86 -- -- -- 219
Manufacturing and
Processing -- -- -- -- -- -- -- --
Architecture, Building
and Town Planning 10 36 -- 51 -- -- -- 97
Sub-total 43 136 -- 137 -- -- -- 316
Health and
Social
Welfare
Medicine 6 18 -- 80 -- -- -- 104
Nursing and Health 5 11 15 14 -- -- 45
Pharmacy 24 92 -- 11 -- -- -- 127
Social Services -- -- -- 3 -- -- -- 3
Sub-total 35 121 -- 109 14 -- -- 279
Services
Tourism and
Entertainment 17 143 -- 887 47 89 -- 1,183
Logistic and
Transportation -- -- -- -- -- -- -- --
Environmental
Protection 3 -- -- 2 -- -- -- 5
Security -- -- -- 1 -- -- -- 1
Sub-total 20 143 -- 890 47 89 -- 1,189
Unknown or Unspecified -- -- -- 12 -- -- -- 12
Total 618 2,491 1 5,973 142 102 -- 9,327

72
2.9 Number of first-year/newly registered students, 2012/2013
(categorized by institution, gender, programme nature, local and non-local student)
Institution Gender Full-time Part-time Subtotal
Total Local Non-local Local Non-local Full-time Part-time Local Non-local
UM
M 621 321 -- -- 942 -- 621 321 942
F 906 475 -- -- 1,381 -- 906 475 1,381
Subtotal 1,527 796 -- -- 2,323 -- 1,527 796 2,323
IPM
M 468 65 -- -- 533 -- 468 65 533
F 599 110 -- -- 709 -- 599 110 709
Subtotal 1,067 175 -- -- 1,242 -- 1,067 175 1,242
IFT
M 115 13 -- -- 128 -- 115 13 128
F 246 34 -- -- 280 -- 246 34 280
Subtotal 361 47 -- -- 408 -- 361 47 408
ESFSM
M -- -- -- -- -- -- -- -- --
F -- -- -- -- -- -- -- -- --
Subtotal -- -- -- -- -- -- -- -- --
CITYU
M 325 160 118 4 485 122 443 164 607
F 306 155 106 1 461 107 412 156 568
Subtotal 631 315 224 5 946 229 855 320 1,175
USJ
M 105 18 -- -- 123 -- 105 18 123
F 148 18 -- -- 166 -- 148 18 166
Subtotal 253 36 -- -- 289 -- 253 36 289
KWNC
M 8 -- 2 -- 8 2 10 -- 10
F 62 5 42 14 67 56 104 19 123
Subtotal 70 5 44 14 75 58 114 19 133
MUST
M 556 802 -- -- 1,358 -- 556 802 1,358
F 547 1,050 -- -- 1,597 -- 547 1,050 1,597
Subtotal 1,103 1,852 -- -- 2,955 -- 1,103 1,852 2,955
IGM
M -- -- 55 2 -- 57 55 2 57
F -- -- 90 2 -- 92 90 2 92
Subtotal -- -- 145 4 -- 149 145 4 149
MMC
M 33 -- -- -- 33 -- 33 -- 33
F 27 -- -- -- 27 -- 27 -- 27
Subtotal 60 -- -- -- 60 -- 60 -- 60
Total
M 2,231 1,379 175 6 3,610 181 2,406 1,385 3,791
F 2,841 1,847 238 17 4,688 255 3,079 1,864 4,943
Total 5,072 3,226 413 23 8,298 436 5,485 3,249 8,734
% 58.07% 36.94% 4.73% 0.26% 95.01% 4.99% 62.80% 37.20% --

73
2.10 Number of first-year/newly registered students, 2012/2013 (categorized by institution, gender, level of study)
Institution Gender Doctorate Master Post-
graduate
Diploma Bachelor
Bachelor
Supplemen-
tary
Programme
Bacharelato (3-yr Degree)
Diploma Total
UM
M 59 281 29 573 -- -- -- 942
F 60 436 28 857 -- -- -- 1,381
Subtotal 119 717 57 1,430 -- -- -- 2,323
IPM
M -- -- -- 366 167 -- -- 533
F -- -- -- 451 258 -- -- 709
Subtotal -- -- -- 817 425 -- -- 1,242
IFT
M -- -- -- 128 -- -- -- 128
F -- -- -- 276 -- -- 4 280
Subtotal -- -- -- 404 -- -- 4 408
ESFSM
M -- -- -- -- -- -- -- --
F -- -- -- -- -- -- -- --
Subtotal -- -- -- -- -- -- -- --
CITYU
M 31 170 -- 406 -- -- -- 607
F 19 163 -- 386 -- -- -- 568
Subtotal 50 333 -- 792 -- -- -- 1,175
USJ
M 2 10 -- 111 -- -- -- 123
F 1 22 -- 143 -- -- -- 166
Subtotal 3 32 -- 254 -- -- -- 289
KWNC
M -- -- 1 8 1 -- -- 10
F -- -- 17 67 39 -- -- 123
Subtotal -- -- 18 75 40 -- -- 133
MUST
M 46 275 -- 1,037 -- -- -- 1,358
F 41 337 -- 1,219 -- -- -- 1,597
Subtotal 87 612 -- 2,256 -- -- -- 2,955
IGM
M -- -- -- 40 17 -- -- 57
F -- -- -- 37 55 -- -- 92
Subtotal -- -- -- 77 72 -- -- 149
MMC
M -- -- -- 26 -- -- 7 33
F -- -- -- 14 -- -- 13 27
Subtotal -- -- -- 40 -- -- 20 60
Total
M 138 736 30 2,695 185 -- 7 3,791
F 121 958 45 3,450 352 -- 17 4,943
Total 259 1,694 75 6,145 537 -- 24 8,734
% 2.97% 19.40% 0.86% 70.36% 6.15% -- 0.27% --

74
2.11 Number of first-year/newly registered local students, 2012/2013 (categorized by institution, gender, level of study)
Institution Gender Doctorate Master Post-
graduate
Diploma Bachelor
Bachelor
Supplemen-
tary
Programme
Bacharelato (3-yr Degree)
Diploma Total
UM
M 10 116 29 466 -- -- -- 621
F 8 163 27 708 -- -- -- 906
Subtotal 18 279 56 1,174 -- -- -- 1,527
IPM
M -- -- -- 327 141 -- -- 468
F -- -- -- 384 215 -- -- 599
Subtotal -- -- -- 711 356 -- -- 1,067
IFT
M -- -- -- 115 -- -- -- 115
F -- -- -- 242 -- -- 4 246
Subtotal -- -- -- 357 -- -- 4 361
ESFSM
M -- -- -- -- -- -- -- --
F -- -- -- -- -- -- -- --
Subtotal -- -- -- -- -- -- -- --
CITYU
M 8 74 -- 361 -- -- -- 443
F 4 85 -- 323 -- -- -- 412
Subtotal 12 159 -- 684 -- -- -- 855
USJ
M 1 6 -- 98 -- -- -- 105
F 1 21 -- 126 -- -- -- 148
Subtotal 2 27 -- 224 -- -- -- 253
KWNC
M -- -- 1 8 1 -- -- 10
F -- -- 17 62 25 -- -- 104
Subtotal -- -- 18 70 26 -- -- 114
MUST
M 7 59 -- 490 -- -- -- 556
F 8 88 -- 451 -- -- -- 547
Subtotal 15 147 -- 941 -- -- -- 1,103
IGM
M -- -- -- 40 15 -- -- 55
F -- -- -- 37 53 -- -- 90
Subtotal -- -- -- 77 68 -- -- 145
MMC
M -- -- -- 26 -- -- 7 33
F -- -- -- 14 -- -- 13 27
Subtotal -- -- -- 40 -- -- 20 60
Total
M 26 255 30 1,931 157 -- 7 2,406
F 21 357 44 2,347 293 -- 17 3,079
Total 47 612 74 4,278 450 -- 24 5,485
% 0.86% 11.16% 1.35% 77.99% 8.20% -- 0.44% --

75
2.12 Number of first-year/newly registered non-local students, 2012/2013
(categorized by institution, gender, level of study)
Institution Gender Doctorate Master Post-
graduate
Diploma Bachelor
Bachelor
Supplemen-
tary
Programme
Bacharelato (3-yr Degree)
Diploma Total
UM
M 49 165 -- 107 -- -- -- 321
F 52 273 1 149 -- -- -- 475
Subtotal 101 438 1 256 -- -- -- 796
IPM
M -- -- -- 39 26 -- -- 65
F -- -- -- 67 43 -- -- 110
Subtotal -- -- -- 106 69 -- -- 175
IFT
M -- -- -- 13 -- -- -- 13
F -- -- -- 34 -- -- -- 34
Subtotal -- -- -- 47 -- -- -- 47
ESFSM
M -- -- -- -- -- -- -- --
F -- -- -- -- -- -- -- --
Subtotal -- -- -- -- -- -- -- --
CITYU
M 23 96 -- 45 -- -- -- 164
F 15 78 -- 63 -- -- -- 156
Subtotal 38 174 -- 108 -- -- -- 320
USJ
M 1 4 -- 13 -- -- -- 18
F -- 1 -- 17 -- -- -- 18
Subtotal 1 5 -- 30 -- -- -- 36
KWNC
M -- -- -- -- -- -- -- --
F -- -- -- 5 14 -- -- 19
Subtotal -- -- -- 5 14 -- -- 19
MUST
M 39 216 -- 547 -- -- -- 802
F 33 249 -- 768 -- -- -- 1,050
Subtotal 72 465 -- 1,315 -- -- -- 1,852
IGM
M -- -- -- -- 2 -- -- 2
F -- -- -- -- 2 -- -- 2
Subtotal -- -- -- -- 4 -- -- 4
MMC
M -- -- -- -- -- -- -- --
F -- -- -- -- -- -- -- --
Subtotal -- -- -- -- -- -- -- --
Total
M 112 481 -- 764 28 -- -- 1,385
F 100 601 1 1,103 59 -- -- 1,864
Total 212 1,082 1 1,867 87 -- -- 3,249
% 6.53% 33.30% 0.03% 57.46% 2.68% -- -- --

76
2.13 Number of first-year/newly registered students in the different levels of programmes, 2012/2013
(categorized by academic field, level of study)
Broad
Groups Area of Study Doctorate Master
Post-
graduate
Diploma Bachelor
Bachelor
Supplemen-
tary
Programme
Bacharelato
(3-yr
Degree) Diploma Total
Education
Teacher Training -- -- 9 117 -- -- -- 126
Education Science 6 46 -- 3 -- -- -- 55
Physical Education -- 9 -- 66 16 -- -- 91
Sub-total 6 55 9 186 16 -- -- 272
Humanities
and Arts
Humanities 1 48 -- 34 -- -- -- 83
Languages and
Literature 11 78 -- 272 -- -- -- 361
Translation -- 30 -- 137 110 -- -- 277
Design and Arts -- -- -- 226 60 -- -- 286
Religion and
Theology 2 1 -- 8 -- -- -- 11
Sub-total 14 157 -- 677 170 -- -- 1,018
Social
Science,
Business
and Law
Social and
Behavioural Science 23 116 -- 233 -- -- -- 372
Cultural Heritage -- -- -- 27 -- -- -- 27
Journalism and
Communication 15 72 -- 309 -- -- -- 396
Business and
Management 67 683 -- 1,865 180 -- -- 2,795
Gaming Management -- -- -- 126 -- -- -- 126
Public Administration -- 110 -- 168 38 -- -- 316
Law 29 151 48 210 -- -- -- 438
Sub-total 134 1,132 48 2,938 218 -- -- 4,470
Science
Life Sciences 28 -- -- 14 -- -- -- 42
Physical Sciences -- -- -- -- -- -- -- --
Mathematics 6 17 -- 31 -- -- -- 54
Computing and
Information
Technology 11 68 -- 200 10 -- -- 289
Sub-total 45 85 -- 245 10 -- -- 385
Architecture
and
Engineering
Engineering 15 55 -- 64 -- -- -- 134
Manufacturing and
Processing -- -- -- -- -- -- --
Architecture, Building
and Town Planning 3 21 -- 49 -- -- -- 73
Sub-total 18 76 -- 113 -- -- -- 207
Health and
Social
Welfare
Medicine 3 6 -- 56 -- -- -- 65
Nursing and Health 6 31 18 152 67 -- -- 274
Pharmacy 11 48 -- 49 -- -- -- 108
Social Services -- -- -- 82 56 -- -- 138
Sub-total 20 85 18 339 123 -- -- 585
Services
Tourism and
Entertainment 22 104 -- 1,647 -- -- 24 1,797
Logistic and
Transportation -- -- -- -- -- -- -- --
Environmental
Protection -- -- -- -- -- -- -- --
Security -- -- -- -- -- -- -- --
Sub-total 22 104 -- 1,647 -- -- 24 1,797
Total 259 1,694 75 6,145 537 -- 24 8,734

77
2.14 Number of first-year/newly registered local students in the different levels of programmes, 2012/2013
(categorized by academic field, level of study)
Broad
Groups Area of Study Doctorate Master
Post-
graduate
Diploma Bachelor
Bachelor
Supplemen-
tary
Programme
Bacharelato
(3-yr
Degree) Diploma Total
Education
Teacher Training -- -- 9 109 -- -- -- 118
Education Science 4 28 -- 1 -- -- -- 33
Physical Education -- 7 -- 64 16 -- -- 87
Sub-total 4 35 9 174 16 -- -- 238
Humanities
and Arts
Humanities -- 24 -- 24 -- -- -- 48
Languages and
Literature 1 19 -- 181 -- -- -- 201
Translation -- 16 -- 108 82 -- -- 206
Design and Arts -- -- -- 126 45 -- -- 171
Religion and
Theology -- -- -- -- -- -- -- --
Sub-total 1 59 -- 439 127 -- -- 626
Social
Science,
Business
and Law
Social and
Behavioural Science 1 45 -- 193 -- -- -- 239
Cultural Heritage -- -- -- 23 -- -- -- 23
Journalism and
Communication 2 12 -- 161 -- -- -- 175
Business and
Management 14 219 -- 1,030 151 -- -- 1,414
Gaming Management -- -- -- 119 -- -- -- 119
Public Administration -- 57 -- 149 38 -- -- 244
Law 3 38 47 134 -- -- -- 222
Sub-total 20 371 47 1,809 189 -- -- 2,436
Science
Life Sciences 1 -- -- 11 -- -- -- 12
Physical Sciences -- -- -- -- -- -- -- --
Mathematics -- 7 -- 25 -- -- -- 32
Computing and
Information
Technology 2 19 -- 91 9 -- -- 121
Sub-total 3 26 -- 127 9 -- -- 165
Architecture
and
Engineering
Engineering 4 17 -- 50 -- -- -- 71
Manufacturing and
Processing -- -- -- -- -- -- -- --
Architecture, Building
and Town Planning -- 10 -- 39 -- -- -- 49
Sub-total 4 27 -- 89 -- -- -- 120
Health and
Social
Welfare
Medicine -- 1 -- 44 -- -- -- 45
Nursing and Health 4 30 18 145 53 -- -- 250
Pharmacy -- 5 -- 38 -- -- -- 43
Social Services -- -- -- 81 56 -- -- 137
Sub-total 4 36 18 308 109 -- -- 475
Services
Tourism and
Entertainment 11 58 -- 1,332 -- -- 24 1,425
Logistic and
Transportation -- -- -- -- -- -- -- --
Environmental
Protection -- -- -- -- -- -- -- --
Security -- -- -- -- -- -- -- --
Sub-total 11 58 -- 1,332 -- -- 24 1,425
Total 47 612 74 4,278 450 -- -- 5,485
78
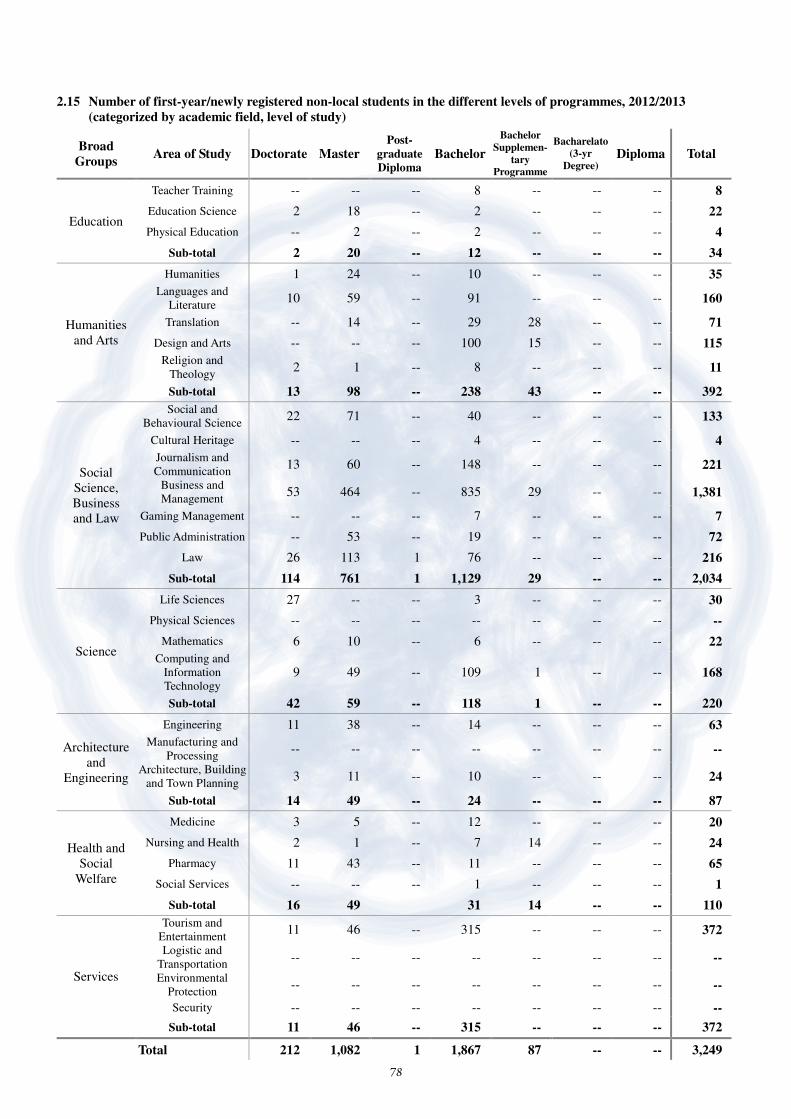
2.15 Number of first-year/newly registered non-local students in the different levels of programmes, 2012/2013
(categorized by academic field, level of study)
Broad
Groups Area of Study Doctorate Master
Post-
graduate
Diploma Bachelor
Bachelor
Supplemen-
tary
Programme
Bacharelato
(3-yr
Degree) Diploma Total
Education
Teacher Training -- -- -- 8 -- -- -- 8
Education Science 2 18 -- 2 -- -- -- 22
Physical Education -- 2 -- 2 -- -- -- 4
Sub-total 2 20 -- 12 -- -- -- 34
Humanities
and Arts
Humanities 1 24 -- 10 -- -- -- 35
Languages and
Literature 10 59 -- 91 -- -- -- 160
Translation -- 14 -- 29 28 -- -- 71
Design and Arts -- -- -- 100 15 -- -- 115
Religion and
Theology 2 1 -- 8 -- -- -- 11
Sub-total 13 98 -- 238 43 -- -- 392
Social
Science,
Business
and Law
Social and
Behavioural Science 22 71 -- 40 -- -- -- 133
Cultural Heritage -- -- -- 4 -- -- -- 4
Journalism and
Communication 13 60 -- 148 -- -- -- 221
Business and
Management 53 464 -- 835 29 -- -- 1,381
Gaming Management -- -- -- 7 -- -- -- 7
Public Administration -- 53 -- 19 -- -- -- 72
Law 26 113 1 76 -- -- -- 216
Sub-total 114 761 1 1,129 29 -- -- 2,034
Science
Life Sciences 27 -- -- 3 -- -- -- 30
Physical Sciences -- -- -- -- -- -- -- --
Mathematics 6 10 -- 6 -- -- -- 22
Computing and
Information
Technology 9 49 -- 109 1 -- -- 168
Sub-total 42 59 -- 118 1 -- -- 220
Architecture
and
Engineering
Engineering 11 38 -- 14 -- -- -- 63
Manufacturing and
Processing -- -- -- -- -- -- -- --
Architecture, Building
and Town Planning 3 11 -- 10 -- -- -- 24
Sub-total 14 49 -- 24 -- -- -- 87
Health and
Social
Welfare
Medicine 3 5 -- 12 -- -- -- 20
Nursing and Health 2 1 -- 7 14 -- -- 24
Pharmacy 11 43 -- 11 -- -- -- 65
Social Services -- -- -- 1 -- -- -- 1
Sub-total 16 49 31 14 -- -- 110
Services
Tourism and
Entertainment 11 46 -- 315 -- -- -- 372
Logistic and
Transportation -- -- -- -- -- -- -- --
Environmental
Protection -- -- -- -- -- -- -- --
Security -- -- -- -- -- -- -- --
Sub-total 11 46 -- 315 -- -- -- 372
Total 212 1,082 1 1,867 87 -- -- 3,249

79
2.16 Number of registered students, 2003/2004 - 2012/2013
(categorized by institution, gender, academic year)
Institution Gender 2003/04 2004/05 2005/06 2006/07 2007/08 2008/09 2009/10 2010/11 2011/12 2012/13
UM
M 2,088 2,300 2,380 2,398 2,496 2,603 2,766 3,104 3,235 3,516
F 3,071 3,262 3,390 3,440 3,573 3,713 4,000 4,307 4,519 4,965
Subtotal 5,159 5,562 5,770 5,838 6,069 6,316 6,766 7,411 7,754 8,481
IPM
M 1,115 1,134 1,190 1,131 1,115 1,157 1,202 1,161 1,189 1,266
F 1,659 1,604 1,635 1,587 1,563 1,538 1,511 1,490 1,557 1,695
Subtotal 2,774 2,738 2,825 2,718 2,678 2,695 2,713 2,651 2,746 2,961
IFT
M 111 129 175 217 242 321 366 377 412 442
F 337 378 520 623 684 806 887 966 1,051 1,131
Subtotal 448 507 695 840 926 1,127 1,253 1,343 1,463 1,573
ESFSM
M 25 25 25 38 32 48 61 61 69 58
F 2 2 2 3 2 4 13 13 17 15
Subtotal 27 27 27 41 34 52 74 74 86 73
CITYU
M 6,712 6,623 4,423 4,770 5,481 6,745 6,383 5,569 497 907
F 2,820 2,692 2,055 2,238 2,522 3,438 3,340 2,876 460 871
Subtotal 9,532 9,315 6,478 7,008 8,003 10,183 9,723 8,445 957 1,778
USJ
M 58 62 67 105 247 416 536 715 756 733
F 107 73 85 151 363 633 783 1,007 1,047 951
Subtotal 165 135 152 256 610 1,049 1,319 1,722 1,803 1,684
KWNC
M 11 20 18 16 19 20 22 28 34 30
F 123 194 245 255 251 239 217 209 227 275
Subtotal 134 214 263 271 270 259 239 237 261 305
MUST
M 7,095 4,904 5,537 4,707 4,198 4,306 4,537 4,725 4,942 4,914
F 4,368 2,406 3,103 3,627 3,836 4,462 4,827 5,138 5,451 5,451
Subtotal 11,463 7,310 8,640 8,334 8,034 8,768 9,364 9,863 10,393 10,365
IGM
M 67 84 87 117 148 164 162 139 128 127
F 198 211 200 232 298 310 334 232 268 235
Subtotal 265 295 287 349 446 474 496 371 396 362
MMC
M 146 126 152 132 152 160 193 221 200 113
F 144 95 159 120 152 166 172 205 158 81
Subtotal 290 221 311 252 304 326 365 426 358 194
Total
M 17,428 15,407 14,054 13,631 14,130 15,940 16,228 16,100 11,462 12,106
F 12,829 10,917 11,394 12,276 13,244 15,309 16,084 16,443 14,755 15,670
Total 30,257 26,324 25,448 25,907 27,374 31,249 32,312 32,543 26,217 27,776

80
2.17 Number of registered students, 2003/2004 - 2012/2013
(categorized by institution, programme nature, academic year)
Institution Programme
Nature 2003/04 2004/05 2005/06 2006/07 2007/08 2008/09 2009/10 2010/11 2011/12 2012/13
UM
Full-time 5,133 5,528 5,716 5,773 6,004 6,219 6,646 7,202 7,507 8,481
Part-time 26 34 54 65 65 97 120 209 247 --
Sub-total 5,159 5,562 5,770 5,838 6,069 6,316 6,766 7,411 7,754 8,481
IPM
Full-time 2,596 2,738 2,825 2,718 2,678 2,695 2,713 2,651 2,746 2,961
Part-time 178 -- -- -- -- -- -- -- -- --
Sub-total 2,774 2,738 2,825 2,718 2,678 2,695 2,713 2,651 2,746 2,961
IFT
Full-time 448 507 695 840 926 1,127 1,253 1,343 1,463 1,573
Part-time -- -- -- -- -- -- -- -- -- --
Sub-total 448 507 695 840 926 1,127 1,253 1,343 1,463 1,573
ESFSM
Full-time 27 27 27 41 34 52 74 74 86 73
Part-time -- -- -- -- -- -- -- -- -- --
Sub-total 27 27 27 41 34 52 74 74 86 73
CITYU
Full-time 673 18 37 58 126 344 350 243 358 1,296
Part-time 8,859 9,297 6,441 6,950 7,877 9,839 9,373 8,202 599 482
Sub-total 9,532 9,315 6,478 7,008 8,003 10,183 9,723 8,445 957 1,778
USJ
Full-time 165 135 152 256 610 1,006 1,319 1,722 1,803 1,684
Part-time -- -- -- -- -- 43 -- -- -- --
Sub-total 165 135 152 256 610 1,049 1,319 1,722 1,803 1,684
KWNC
Full-time 134 214 263 271 270 196 199 237 239 246
Part-time -- -- -- -- -- 63 40 -- 22 59
Sub-total 134 214 263 271 270 259 239 237 261 305
MUST
Full-time 2,382 3,058 4,108 5,378 6,306 7,816 8,723 9,470 10,100 10,365
Part-time 9,081 4,252 4,532 2,956 1,728 952 641 393 293 --
Sub-total 11,463 7,310 8,640 8,334 8,034 8,768 9,364 9,863 10,393 10,365
IGM
Full-time -- -- -- -- -- -- -- -- -- --
Part-time 265 295 287 349 446 474 496 371 396 362
Sub-total 265 295 287 349 446 474 496 371 396 362
MMC
Full-time 290 221 311 252 304 326 365 426 358 194
Part-time -- -- -- -- -- -- -- -- -- --
Sub-total 290 221 311 252 304 326 365 426 358 194
Total
Full-time 11,848 12,446 14,134 15,587 17,258 19,781 21,642 23,368 24,660 26,873
Part-time 18,409 13,878 11,314 10,320 10,116 11,468 10,670 9,175 1,557 903
Total 30,257 26,324 25,448 25,907 27,374 31,249 32,312 32,543 26,217 27,776

81
2.18 Number of registered students, 2003/2004 - 2012/2013
(categorized by institution, local and non-local student, academic year)
Institution Type of
Student 2003/04 2004/05 2005/06 2006/07 2007/08 2008/09 2009/10 2010/11 2011/12 2012/13
UM
Local 4,327 4,486 4,503 4,462 4,486 4,625 4,936 5,232 5,534 5,874
Non-local 832 1,076 1,267 1,376 1,583 1,691 1,830 2,179 2,220 2,607
Sub-total 5,159 5,562 5,770 5,838 6,069 6,316 6,766 7,411 7,754 8,481
IPM
Local 2,452 2,416 2,504 2,438 2,373 2,326 2,307 2,257 2,298 2,492
Non-local 322 322 321 280 305 369 406 394 448 469
Sub-total 2,774 2,738 2,825 2,718 2,678 2,695 2,713 2,651 2,746 2,961
IFT
Local 368 412 585 734 801 987 1,097 1,165 1,274 1,377
Non-local 80 95 110 106 125 140 156 178 189 196
Sub-total 448 507 695 840 926 1,127 1,253 1,343 1,463 1,573
ESFSM
Local 21 25 25 39 34 50 72 72 82 72
Non-local 6 2 2 2 -- 2 2 2 4 1
Sub-total 27 27 27 41 34 52 74 74 86 73
CITYU
Local 1,206 1,035 608 675 639 875 957 573 643 1,234
Non-local 8,326 8,280 5,870 6,333 7,364 9,308 8,766 7,872 314 544
Sub-total 9,532 9,315 6,478 7,008 8,003 10,183 9,723 8,445 957 1,778
USJ
Local 154 126 138 239 575 954 1,199 1,586 1,648 1,514
Non-local 11 9 14 17 35 95 120 136 155 170
Sub-total 165 135 152 256 610 1,049 1,319 1,722 1,803 1,684
KWNC
Local 134 211 255 258 252 240 224 223 247 278
Non-local -- 3 8 13 18 19 15 14 14 27
Sub-total 134 214 263 271 270 259 239 237 261 305
MUST
Local 3,913 1,977 2,374 2,788 3,170 4,218 4,961 5,401 5,589 5,056
Non-local 7,550 5,333 6,266 5,546 4,864 4,550 4,403 4,462 4,804 5,309
Sub-total 11,463 7,310 8,640 8,334 8,034 8,768 9,364 9,863 10,393 10,365
IGM
Local 265 281 258 299 375 412 488 368 391 358
Non-local -- 14 29 50 71 62 8 3 5 4
Sub-total 265 295 287 349 446 474 496 371 396 362
MMC
Local 289 220 309 250 299 320 357 418 350 194
Non-local 1 1 2 2 5 6 8 8 8 --
Sub-total 290 221 311 252 304 326 365 426 358 194
Total
Local 13,129 11,189 11,559 12,182 13,004 15,007 16,598 17,295 18,056 18,449
Non-local 17,128 15,135 13,889 13,725 14,370 16,242 15,714 15,248 8,161 9,327
Total 30,257 26,324 25,448 25,907 27,374 31,249 32,312 32,543 26,217 27,776

82
Data of Graduated Students from the Higher Education Institutions of Macao
for the Academic Year 2011/2012
Explanatory Notes:
I. The following data of graduating students for the 2012/2013 academic year are accurate as of
October 31st, 2012.
II. The ‘academic year’ used in this document refers to the school year, which generally starts on
September 1st every year and ends on August 31st of the following year.
III. Information on the previous academic years has been included in the last section of this document
for reference purposes.
IV. This document uses certain terms which have been briefly defined below:
(1) ‘Registered students’ refers to students who have completed the registration procedures and
met all admission requirements.
(2) ‘Local students’ refers to students holding Macao resident identity cards. Non-holders are
referred as ‘non-local students’.
(3) Full-time programmes include day and evening programmes which are divided by academic
years / semesters. The main lectures are given during the daytime or evening on weekdays, on a
continuous, face-to-face basis.
V. Certain figures are missing (indicated by ‘--’) in some of the columns in the tables of this document
for one of the following reasons:
(1) Lack of information.
(2) The category is not applicable to that institution.
(3) The relevant institution failed to provide the information.
VI. Some of the percentages in the tables below have been rounded off to two decimal places, so the
aggregate of some of the percentages may not add up to 100%.
VII. The registered students referenced in this document have been categorized based on academic
areas and majors. Using the ‘International Standard Classification of Education’ (ISCED) of UNESCO
and taking the local higher education curriculum into consideration, the students have been
categorized into 7 academic areas, with a certain number of majors under each area, which add up
to 30 majors altogether.
VIII. The data for the number of registered non-local students excludes students in programmes
operated jointly by higher education institutions from Macao and higher education institutions in
Mainland China since the 2011/2012 academic year.
IX. The abbreviations and expressions used in this document are only applicable here.

83
3.1 Number of graduated students, 2011/2012
(categorized by institution, gender, programme nature, local and non-local student)
Institution Gender Full-time Part-time Subtotal
Total Local Non-local Local Non-local Full-time Part-time Local Non-local
UM
M 418 155 -- -- 573 -- 418 155 573
F 670 260 -- -- 930 -- 670 260 930
Subtotal 1,088 415 -- -- 1,503 -- 1,088 415 1,503
IPM
M 297 71 -- -- 368 -- 297 71 368
F 439 90 -- -- 529 -- 439 90 529
Subtotal 736 161 -- -- 897 -- 736 161 897
IFT
M 147 13 -- -- 160 -- 147 13 160
F 359 43 -- -- 402 -- 359 43 402
Subtotal 506 56 -- -- 562 -- 506 56 562
ESFSM
M 9 2 -- -- 11 -- 9 2 11
F 1 -- -- -- 1 -- 1 -- 1
Subtotal 10 2 -- -- 12 -- 10 2 12
CITYU
M 15 35 44 7 50 51 59 42 101
F 9 30 58 1 39 59 67 31 98
Subtotal 24 65 102 8 89 110 126 73 199
USJ
M 99 12 -- -- 111 -- 99 12 111
F 200 10 -- -- 210 -- 200 10 210
Subtotal 299 22 -- -- 321 -- 299 22 321
KWNC
M 6 -- 1 -- 6 1 7 -- 7
F 37 2 20 -- 39 20 57 2 59
Subtotal 43 2 21 -- 45 21 64 2 66
MUST
M 525 531 -- -- 1,056 -- 525 531 1,056
F 721 638 -- -- 1,359 -- 721 638 1,359
Subtotal 1,246 1,169 -- -- 2,415 -- 1,246 1,169 2,415
IGM
M -- -- 37 1 -- 38 37 1 38
F -- -- 99 2 -- 101 99 2 101
Subtotal -- -- 136 3 -- 139 136 3 139
MMC
M 34 -- -- -- 34 -- 34 -- 34
F 34 -- -- -- 34 -- 34 -- 34
Subtotal 68 -- -- -- 68 -- 68 -- 68
Total
M 1,550 819 82 8 2,369 90 1,632 827 2,459
F 2,470 1,073 177 3 3,543 180 2,647 1,076 3,723
Total 4,020 1,892 259 11 5,912 270 4,279 1,903 6,182
% 65.03% 30.60% 4.19% 0.18% 95.63% 4.37% 69.22% 30.78% --

84
3.2 Number of graduated students, 2011/2012 (categorized by institution, gender, level of study)
Institution Gender Doctorate Master Post-
graduate
Diploma Bachelor
Bachelor
Supplemen-
tary
Programme
Bacharelato (3-yr Degree)
Diploma Total
UM
M 13 118 48 394 -- -- -- 573
F 10 195 43 682 -- -- -- 930
Subtotal 23 313 91 1,076 -- -- -- 1,503
IPM
M -- -- -- 13 197 158 -- 368
F -- -- -- 38 242 249 -- 529
Subtotal -- -- -- 51 439 407 -- 897
IFT
M -- -- -- -- 77 81 2 160
F -- -- -- -- 168 231 3 402
Subtotal -- -- -- -- 245 312 5 562
ESFSM
M -- -- -- 11 -- -- -- 11
F -- -- -- 1 -- -- -- 1
Subtotal -- -- -- 12 -- -- -- 12
CITYU
M 5 50 -- 46 -- -- -- 101
F 2 38 -- 58 -- -- -- 98
Subtotal 7 88 -- 104 -- -- -- 199
USJ
M -- 43 -- 68 -- -- -- 111
F 1 74 -- 135 -- -- -- 210
Subtotal 1 117 -- 203 -- -- -- 321
KWNC
M -- -- 1 6 -- -- -- 7
F -- -- 20 39 -- -- -- 59
Subtotal -- -- 21 45 -- -- -- 66
MUST
M 41 115 -- 900 -- -- -- 1,056
F 10 170 -- 1,179 -- -- -- 1,359
Subtotal 51 285 -- 2,079 -- -- -- 2,415
IGM
M -- -- -- -- 21 17 -- 38
F -- -- -- -- 47 54 -- 101
Subtotal -- -- -- -- 68 71 -- 139
MMC
M -- -- -- 24 -- -- 10 34
F -- -- -- 26 -- -- 8 34
Subtotal -- -- -- 50 -- -- 18 68
Total
M 59 326 49 1,462 295 256 12 2,459
F 23 477 63 2,158 457 534 11 3,723
Total 82 803 112 3,620 752 790 23 6,182
% 1.33% 12.99% 1.81% 58.56% 12.16% 12.78% 0.37% --

85
3.3 Number of local graduated students, 2011/2012 (categorized by institution, gender and level of study)
Institution Gender Doctorate Master Post-
graduate
Diploma Bachelor
Bachelor
Supplemen-
tary
Programme
Bacharelato (3-yr Degree)
Diploma Total
UM
M 5 61 48 304 -- -- -- 418
F -- 70 43 557 -- -- -- 670
Subtotal 5 131 91 861 -- -- -- 1,088
IPM
M -- -- -- 11 154 132 -- 297
F -- -- -- 30 202 207 -- 439
Subtotal -- -- -- 41 356 339 -- 736
IFT
M -- -- -- -- 71 75 1 147
F -- -- -- -- 149 207 3 359
Subtotal -- -- -- -- 220 282 4 506
ESFSM
M -- -- -- 9 -- -- -- 9
F -- -- -- 1 -- -- -- 1
Subtotal -- -- -- 10 -- -- -- 10
CITYU
M -- 16 -- 43 -- -- -- 59
F -- 10 -- 57 -- -- -- 67
Subtotal -- 26 -- 100 -- -- -- 126
USJ
M -- 37 -- 62 -- -- -- 99
F 1 67 -- 132 -- -- -- 200
Subtotal 1 104 -- 194 -- -- -- 299
KWNC
M -- -- 1 6 -- -- -- 7
F -- -- 20 37 -- -- -- 57
Subtotal -- -- 21 43 -- -- -- 64
MUST
M 4 30 -- 491 -- -- -- 525
F 1 43 -- 677 -- -- -- 721
Subtotal 5 73 -- 1,168 -- -- -- 1,246
IGM
M -- -- -- -- 21 16 -- 37
F -- -- -- -- 47 52 -- 99
Subtotal -- -- -- -- 68 68 -- 136
MMC
M -- -- -- 24 -- -- 10 34
F -- -- -- 26 -- -- 8 34
Subtotal -- -- -- 50 -- -- 18 68
Total
M 9 144 49 950 246 223 11 1,632
F 2 190 63 1,517 398 466 11 2,647
Total 11 334 112 2,467 644 689 22 4,279
% 0.26% 7.81% 2.62% 57.65% 15.05% 16.10% 0.51% --

86
3.4 Number of non-local graduated students, 2011/2012 (categorized by institution, gender, level of study)
Institution Gender Doctorate Master Post-
graduate
Diploma Bachelor
Bachelor
Supplemen-
tary
Programme
Bacharelato (3-yr Degree)
Diploma Total
UM
M 8 57 -- 90 -- -- -- 155
F 10 125 -- 125 -- -- -- 260
Subtotal 18 182 -- 215 -- -- -- 415
IPM
M -- -- -- 2 43 26 -- 71
F -- -- -- 8 40 42 -- 90
Subtotal -- -- -- 10 83 68 -- 161
IFT
M -- -- -- -- 6 6 1 13
F -- -- -- -- 19 24 -- 43
Subtotal -- -- -- -- 25 30 1 56
ESFSM
M -- -- -- 2 -- -- -- 2
F -- -- -- -- -- -- -- --
Subtotal -- -- -- 2 -- -- -- 2
CITYU
M 5 34 -- 3 -- -- -- 42
F 2 28 -- 1 -- -- -- 31
Subtotal 7 62 -- 4 -- -- -- 73
USJ
M -- 6 -- 6 -- -- -- 12
F -- 7 -- 3 -- -- -- 10
Subtotal -- 13 -- 9 -- -- -- 22
KWNC
M -- -- -- -- -- -- -- --
F -- -- -- 2 -- -- -- 2
Subtotal -- -- -- 2 -- -- -- 2
MUST
M 37 85 -- 409 -- -- -- 531
F 9 127 -- 502 -- -- -- 638
Subtotal 46 212 -- 911 -- -- -- 1,169
IGM
M -- -- -- -- -- 1 -- 1
F -- -- -- -- -- 2 -- 2
Subtotal -- -- -- -- -- 3 -- 3
MMC
M -- -- -- -- -- -- -- --
F -- -- -- -- -- -- -- --
Subtotal -- -- -- -- -- -- -- --
Total
M 50 182 -- 512 49 33 1 827
F 21 287 -- 641 59 68 -- 1,076
Total 71 469 -- 1,153 108 101 1 1,903
% 3.73% 24.65% -- 60.59% 5.68% 5.31% 0.05% --

87
3.5 Number of students graduated from the different levels of programmes, 2011/2012
(categorized by academic field, level of study)
Broad
Groups Area of Study Doctorate Master
Post-
graduate
Diploma Bachelor
Bachelor
Supplemen-
tary
Programme
Bacharelato
(3-yr
Degree) Diploma Total
Education
Teacher Training -- -- 29 128 -- -- -- 157
Education Science 1 25 -- -- -- -- -- 26
Physical Education -- 13 -- -- 43 11 -- 67
Sub-total 1 38 29 128 43 11 -- 250
Humanities
and Arts
Humanities -- 9 -- 23 -- -- -- 32
Languages and
Literature 3 32 -- 160 -- -- -- 195
Translation -- 11 -- -- 95 106 -- 212
Design and Arts -- 5 -- 70 61 71 -- 207
Religion and
Theology -- 8 -- 4 -- -- -- 12
Sub-total 3 65 -- 257 156 177 -- 658
Social
Science,
Business
and Law
Social and
Behavioural Science 1 59 -- 131 -- -- -- 191
Cultural Heritage -- 7 -- -- 41 26 -- 74
Journalism and
Communication -- 13 -- 221 -- -- -- 234
Business and
Management 40 342 -- 1,374 181 181 -- 2,118
Gaming Management -- -- -- 17 -- -- -- 17
Public Administration 2 75 -- 77 38 39 -- 231
Law 12 48 30 176 -- -- -- 266
Sub-total 55 544 30 1,996 260 246 -- 3,131
Science
Life Sciences 5 -- -- -- -- -- -- 5
Physical Sciences -- -- -- -- -- -- -- --
Mathematics 1 9 -- -- -- -- -- 10
Computing and
Information
Technology 3 26 -- 130 31 5 -- 195
Sub-total 9 35 -- 130 31 5 -- 210
Architecture
and
Engineering
Engineering 5 13 -- 59 -- -- -- 77
Manufacturing and
Processing -- -- -- -- -- -- -- --
Architecture, Building
and Town Planning 1 8 -- 32 -- -- -- 41
Sub-total 6 21 -- 91 -- -- -- 118
Health and
Social
Welfare
Medicine 2 8 -- 29 -- -- -- 39
Nursing and Health 1 10 21 80 22 -- -- 134
Pharmacy 5 34 -- -- -- 27 -- 66
Social Services -- 2 -- 37 36 38 -- 113
Sub-total 8 54 21 146 58 65 -- 352
Services
Tourism and
Entertainment -- 46 32 860 204 286 23 1,451
Logistic and
Transportation -- -- -- -- -- -- -- --
Environmental
Protection -- -- -- -- -- -- -- --
Security -- -- -- 12 -- -- -- 12
Sub-total -- 46 32 872 204 286 23 1,463
Total 82 803 112 3,620 752 790 23 6,182

88
3.6 Number of local students from the different levels of programmes, 2011/2012
(categorized by academic field, level of study)
Broad
Groups Area of Study Doctorate Master
Post-
graduate
Diploma Bachelor
Bachelor
Supplemen-
tary
Programme
Bacharelato
(3-yr
Degree) Diploma Total
Education
Teacher Training -- -- 29 121 -- -- -- 150
Education Science 1 17 -- -- -- -- -- 18
Physical Education -- 11 -- -- 43 11 -- 65
Sub-total 1 28 29 121 43 11 -- 233
Humanities
and Arts
Humanities -- 5 -- 19 -- -- -- 24
Languages and
Literature -- 9 -- 142 -- -- -- 151
Translation -- 8 -- -- 62 78 -- 148
Design and Arts -- 4 -- 23 44 56 -- 127
Religion and
Theology -- 6 -- 1 -- -- -- 7
Sub-total -- 32 -- 185 106 134 -- 457
Social
Science,
Business
and Law
Social and
Behavioural Science -- 36 -- 104 -- -- -- 140
Cultural Heritage -- 7 -- -- 37 23 -- 67
Journalism and
Communication -- 4 -- 131 -- -- -- 135
Business and
Management 1 115 -- 793 162 154 -- 1,225
Gaming Management -- -- -- 14 -- -- -- 14
Public Administration 1 50 -- 75 37 39 -- 202
Law -- 15 30 93 -- -- -- 138
Sub-total 2 227 30 1,210 236 216 -- 1,921
Science
Life Sciences -- -- -- -- -- -- -- --
Physical Sciences -- -- -- -- -- -- -- --
Mathematics -- 4 -- -- -- -- -- 4
Computing and
Information
Technology 3 7 -- 61 18 4 -- 93
Sub-total 3 11 -- 61 18 4 -- 97
Architecture
and
Engineering
Engineering 3 7 -- 40 -- -- -- 50
Manufacturing and
Processing -- -- -- -- -- -- -- --
Architecture, Building
and Town Planning -- 2 -- 23 -- -- -- 25
Sub-total 3 9 -- 63 -- -- -- 75
Health and
Social
Welfare
Medicine 2 1 -- 11 -- -- -- 14
Nursing and Health -- 9 21 78 22 -- -- 130
Pharmacy -- 6 -- -- -- 27 -- 33
Social Services -- 1 -- 37 36 38 -- 112
Sub-total 2 17 21 126 58 65 -- 289
Services
Tourism and
Entertainment -- 10 32 691 183 259 22 1,197
Logistic and
Transportation -- -- -- -- -- -- -- --
Environmental
Protection -- -- -- -- -- -- -- --
Security -- -- -- 10 -- -- -- 10
Sub-total -- 10 32 701 183 259 22 1,207
Total 11 334 112 2,467 644 689 22 4,279
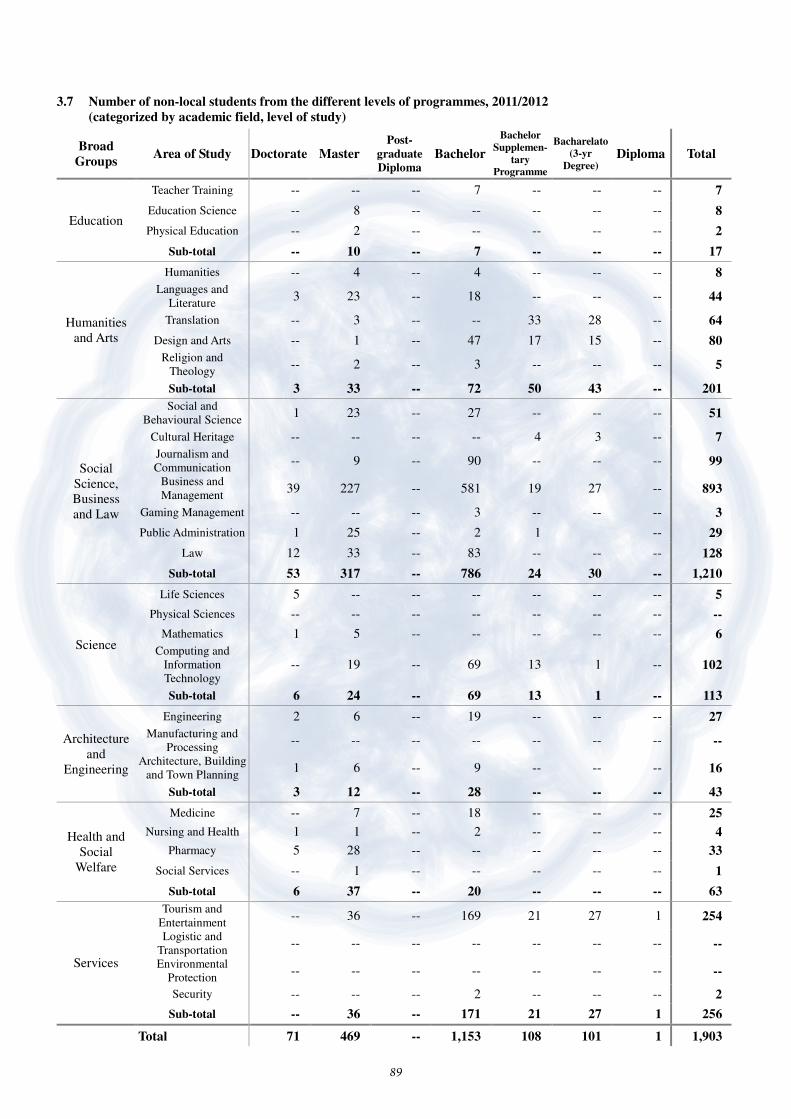
89
3.7 Number of non-local students from the different levels of programmes, 2011/2012
(categorized by academic field, level of study)
Broad
Groups Area of Study Doctorate Master
Post-
graduate
Diploma Bachelor
Bachelor
Supplemen-
tary
Programme
Bacharelato
(3-yr
Degree) Diploma Total
Education
Teacher Training -- -- -- 7 -- -- -- 7
Education Science -- 8 -- -- -- -- -- 8
Physical Education -- 2 -- -- -- -- -- 2
Sub-total -- 10 -- 7 -- -- -- 17
Humanities
and Arts
Humanities -- 4 -- 4 -- -- -- 8
Languages and
Literature 3 23 -- 18 -- -- -- 44
Translation -- 3 -- -- 33 28 -- 64
Design and Arts -- 1 -- 47 17 15 -- 80
Religion and
Theology -- 2 -- 3 -- -- -- 5
Sub-total 3 33 -- 72 50 43 -- 201
Social
Science,
Business
and Law
Social and
Behavioural Science 1 23 -- 27 -- -- -- 51
Cultural Heritage -- -- -- -- 4 3 -- 7
Journalism and
Communication -- 9 -- 90 -- -- -- 99
Business and
Management 39 227 -- 581 19 27 -- 893
Gaming Management -- -- -- 3 -- -- -- 3
Public Administration 1 25 -- 2 1 -- 29
Law 12 33 -- 83 -- -- -- 128
Sub-total 53 317 -- 786 24 30 -- 1,210
Science
Life Sciences 5 -- -- -- -- -- -- 5
Physical Sciences -- -- -- -- -- -- -- --
Mathematics 1 5 -- -- -- -- -- 6
Computing and
Information
Technology -- 19 -- 69 13 1 -- 102
Sub-total 6 24 -- 69 13 1 -- 113
Architecture
and
Engineering
Engineering 2 6 -- 19 -- -- -- 27
Manufacturing and
Processing -- -- -- -- -- -- -- --
Architecture, Building
and Town Planning 1 6 -- 9 -- -- -- 16
Sub-total 3 12 -- 28 -- -- -- 43
Health and
Social
Welfare
Medicine -- 7 -- 18 -- -- -- 25
Nursing and Health 1 1 -- 2 -- -- -- 4
Pharmacy 5 28 -- -- -- -- -- 33
Social Services -- 1 -- -- -- -- -- 1
Sub-total 6 37 -- 20 -- -- -- 63
Services
Tourism and
Entertainment -- 36 -- 169 21 27 1 254
Logistic and
Transportation -- -- -- -- -- -- -- --
Environmental
Protection -- -- -- -- -- -- -- --
Security -- -- -- 2 -- -- -- 2
Sub-total -- 36 -- 171 21 27 1 256
Total 71 469 -- 1,153 108 101 1 1,903
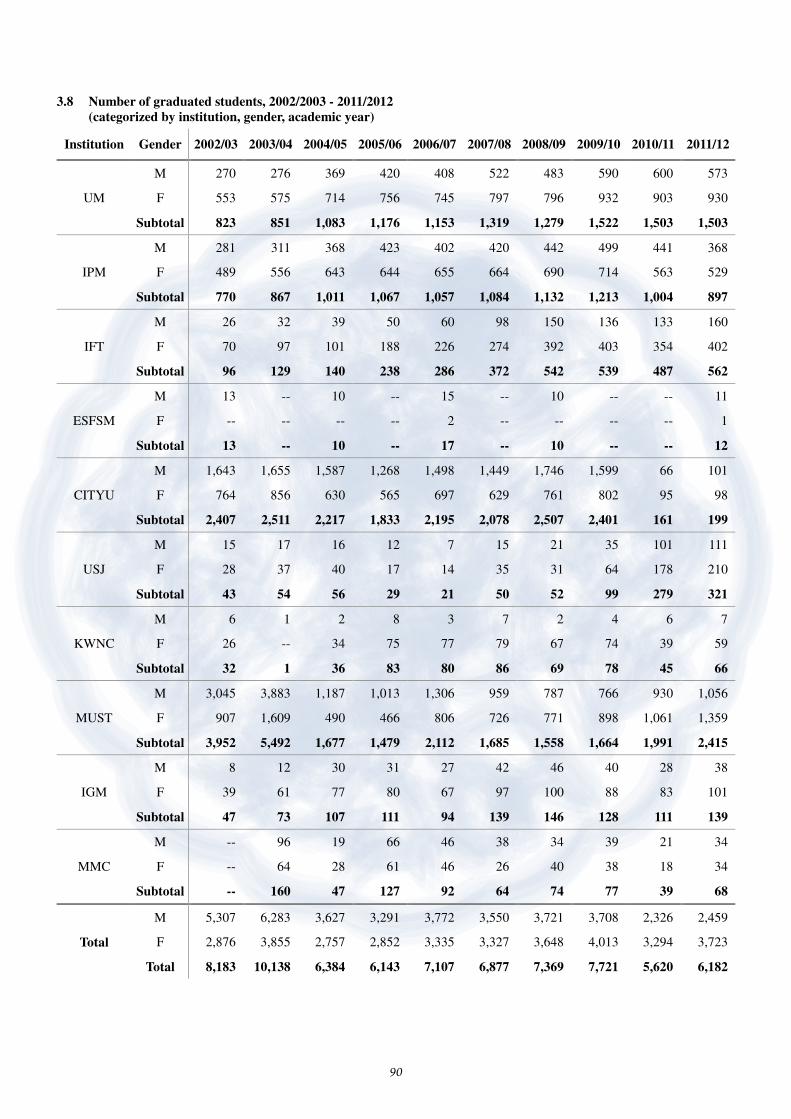
90
3.8 Number of graduated students, 2002/2003 - 2011/2012
(categorized by institution, gender, academic year)
Institution Gender 2002/03 2003/04 2004/05 2005/06 2006/07 2007/08 2008/09 2009/10 2010/11 2011/12
UM
M 270 276 369 420 408 522 483 590 600 573
F 553 575 714 756 745 797 796 932 903 930
Subtotal 823 851 1,083 1,176 1,153 1,319 1,279 1,522 1,503 1,503
IPM
M 281 311 368 423 402 420 442 499 441 368
F 489 556 643 644 655 664 690 714 563 529
Subtotal 770 867 1,011 1,067 1,057 1,084 1,132 1,213 1,004 897
IFT
M 26 32 39 50 60 98 150 136 133 160
F 70 97 101 188 226 274 392 403 354 402
Subtotal 96 129 140 238 286 372 542 539 487 562
ESFSM
M 13 -- 10 -- 15 -- 10 -- -- 11
F -- -- -- -- 2 -- -- -- -- 1
Subtotal 13 -- 10 -- 17 -- 10 -- -- 12
CITYU
M 1,643 1,655 1,587 1,268 1,498 1,449 1,746 1,599 66 101
F 764 856 630 565 697 629 761 802 95 98
Subtotal 2,407 2,511 2,217 1,833 2,195 2,078 2,507 2,401 161 199
USJ
M 15 17 16 12 7 15 21 35 101 111
F 28 37 40 17 14 35 31 64 178 210
Subtotal 43 54 56 29 21 50 52 99 279 321
KWNC
M 6 1 2 8 3 7 2 4 6 7
F 26 -- 34 75 77 79 67 74 39 59
Subtotal 32 1 36 83 80 86 69 78 45 66
MUST
M 3,045 3,883 1,187 1,013 1,306 959 787 766 930 1,056
F 907 1,609 490 466 806 726 771 898 1,061 1,359
Subtotal 3,952 5,492 1,677 1,479 2,112 1,685 1,558 1,664 1,991 2,415
IGM
M 8 12 30 31 27 42 46 40 28 38
F 39 61 77 80 67 97 100 88 83 101
Subtotal 47 73 107 111 94 139 146 128 111 139
MMC
M -- 96 19 66 46 38 34 39 21 34
F -- 64 28 61 46 26 40 38 18 34
Subtotal -- 160 47 127 92 64 74 77 39 68
Total
M 5,307 6,283 3,627 3,291 3,772 3,550 3,721 3,708 2,326 2,459
F 2,876 3,855 2,757 2,852 3,335 3,327 3,648 4,013 3,294 3,723
Total 8,183 10,138 6,384 6,143 7,107 6,877 7,369 7,721 5,620 6,182

91
3.9 Number of graduated students, 2002/2003 - 2011/2012
(categorized by institution, programme nature, academic year)
Institution Programme
Nature 2002/03 2003/04 2004/05 2005/06 2006/07 2007/08 2008/09 2009/10 2010/11 2011/12
UM
Full-time 823 851 1,082 1,172 1,146 1,304 1,273 1,516 1,486 1,503
Part-time -- -- 1 4 7 15 6 6 17 --
Sub-total 823 851 1,083 1,176 1,153 1,319 1,279 1,522 1,503 1,503
IPM
Full-time 689 757 1,011 1,067 1,057 1,084 1,132 1,213 1,004 897
Part-time 81 110 -- -- -- -- -- -- -- --
Sub-total 770 867 1,011 1,067 1,057 1,084 1,132 1,213 1,004 897
IFT
Full-time 96 129 140 238 286 372 542 539 487 562
Part-time -- -- -- -- -- -- -- -- -- --
Sub-total 96 129 140 238 286 372 542 539 487 562
ESFSM
Full-time 13 -- 10 -- 17 -- 10 -- -- 12
Part-time -- -- -- -- -- -- -- -- -- --
Sub-total 13 -- 10 -- 17 -- 10 -- -- 12
CITYU
Full-time 115 171 -- 242 18 34 47 453 -- 89
Part-time 2,292 2,340 2,217 1,591 2,177 2,044 2,460 1,948 161 110
Sub-total 2,407 2,511 2,217 1,833 2,195 2,078 2,507 2,401 161 199
USJ
Full-time 43 54 56 29 21 47 52 99 279 321
Part-time -- -- -- -- -- 3 -- -- -- --
Sub-total 43 54 56 29 21 50 52 99 279 321
KWNC
Full-time 32 1 36 83 80 86 45 47 40 45
Part-time -- -- -- -- -- -- 24 31 5 21
Sub-total 32 1 36 83 80 86 69 78 45 66
MUST
Full-time 62 262 393 472 668 978 1,264 1,523 1,874 2,415
Part-time 3,890 5,230 1,284 1,007 1,444 707 294 141 117 --
Sub-total 3,952 5,492 1,677 1,479 2,112 1,685 1,558 1,664 1,991 2,415
IGM
Full-time -- -- -- -- -- -- -- -- -- --
Part-time 47 73 107 111 94 139 146 128 111 139
Sub-total 47 73 107 111 94 139 146 128 111 139
MMC
Full-time -- 160 47 127 92 64 74 77 39 68
Part-time -- -- -- -- -- -- -- -- -- --
Sub-total -- 160 47 127 92 64 74 77 39 68
Total
Full-time 1,873 2,385 2,775 3,430 3,385 3,969 4,439 5,467 5,209 5,912
Part-time 6,310 7,753 3,609 2,713 3,722 2,908 2,930 2,254 411 270
Total 8,183 10,138 6,384 6,143 7,107 6,877 7,369 7,721 5,620 6,182

92
3.10 Number of graduated students, 2002/2003 - 2011/2012
(categorized by institution, local and non-local student, academic year)
Institution Type of
Student 2002/03 2003/04 2004/05 2005/06 2006/07 2007/08 2008/09 2009/10 2010/11 2011/12
UM
Local 754 757 934 935 912 1,029 989 1,143 999 1,088
Non-local 69 94 149 241 241 290 290 379 504 415
Sub-total 823 851 1,083 1,176 1,153 1,319 1,279 1,522 1,503 1,503
IPM
Local 764 849 850 880 962 980 979 1,043 830 736
Non-local 6 18 161 187 95 104 153 170 174 161
Sub-total 770 867 1,011 1,067 1,057 1,084 1,132 1,213 1,004 897
IFT
Local 78 105 116 203 252 333 491 480 431 506
Non-local 18 24 24 35 34 39 51 59 56 56
Sub-total 96 129 140 238 286 372 542 539 487 562
ESFSM
Local 12 -- 6 -- 15 -- 10 -- -- 10
Non-local 1 -- 4 -- 2 -- -- -- -- 2
Sub-total 13 -- 10 -- 17 -- 10 -- -- 12
CITYU
Local 239 255 133 94 114 59 131 114 98 126
Non-local 2,168 2,256 2,084 1,739 2,081 2,019 2,376 2,287 63 73
Sub-total 2,407 2,511 2,217 1,833 2,195 2,078 2,507 2,401 161 199
USJ
Local 41 49 52 27 21 20 49 92 260 299
Non-local 2 5 4 2 -- 30 3 7 19 22
Sub-total 43 54 56 29 21 50 52 99 279 321
KWNC
Local 32 1 36 83 80 85 65 72 42 64
Non-local -- -- -- -- -- 1 4 6 3 2
Sub-total 32 1 36 83 80 86 69 78 45 66
MUST
Local 61 767 323 296 512 531 611 669 874 1,246
Non-local 3,891 4,725 1,354 1,183 1,600 1,154 947 995 1,117 1,169
Sub-total 3,952 5,492 1,677 1,479 2,112 1,685 1,558 1,664 1,991 2,415
IGM
Local 47 73 94 85 71 71 100 104 110 136
Non-local -- -- 13 26 23 68 46 24 1 3
Sub-total 47 73 107 111 94 139 146 128 111 139
MMC
Local -- 160 45 125 91 63 74 77 37 68
Non-local -- -- 2 2 1 1 -- -- 2 --
Sub-total -- 160 47 127 92 64 74 77 39 68
Total
Local 2,028 3,016 2,589 2,728 3,030 3,171 3,499 3,794 3,681 4,279
Non-local 6,155 7,122 3,795 3,415 4,077 3,706 3,870 3,927 1,939 1,903
Total 8,183 10,138 6,384 6,143 7,107 6,877 7,369 7,721 5,620 6,182

93
Data of the Non-local Higher Education Programmes in 2012
Explanatory Notes:
I. This category includes the registered students and the graduated students of the non-local higher
education programmes, offered by 16 non-local higher education institutions, operated in Macao in
2012. The number of registered students and graduated students from non-local higher education
programmes held in Macao in 2010 and 2011 has also been included for reference purposes.
II. The figures provided in this section were provided by the corresponding non-local universities
through the local co-organizers. These figures are accurate as of December 31st, 2012 and the
relevant data will be calculated on a ‘yearly’ basis. The calculation period for the data on the
non-local higher education programmes that are carried out in Macao ran from January 1st, 2012 to
December 31st, 2012.
III. The following table contains the names of the programmes of higher education offered in Macao
and their corresponding abbreviations:
Name of Programme Abbreviation
Doctorate’s Degree Programme PhD
Master’s Degree Programme M
Postgraduate Diploma Programme PG-Dip
Bachelor’s Degree Programme B
Bachelor’s Supplementary Programme B Sup.
(Three-year) Diploma Programme Dip.
IV. The non-local higher education programmes operating in Macao in 2012 are part-time programmes.
Unless otherwise specified, students who took these programmes were local students who hold
Macao resident identity cards.
V. Certain figures are missing (indicated by ‘--’) in some of the columns in the tables of this document
for one of the following reasons:
(1) Lack of information.
(2) The category is not applicable to that institution.
(3) The relevant institution failed to provide the information.
VI. According to the provisions of the ‘Regulation of the People's Republic of China on Academic
Degrees’, those who have finished a ‘master degree programme’ or a ‘bachelor degree programme’
can be awarded a ‘Graduation Certificate’ and a ‘Degree Certificate’. According to the provisions of
the ‘Provisional Regulation on the Management of Academic Certificates of Regular Higher
Education’, those who have finished a ‘diploma programme’ can only be awarded a ‘Graduation
Certificate’.
VII. The registered students referenced in this document have been categorized based on academic
areas and majors. Using the ‘International Standard Classification of Education’ (ISCED) of UNESCO
and taking the local higher education curriculum into consideration, the students have been
categorized into 7 academic areas, with a certain number of majors under each area, which add up
to 30 majors altogether.
VIII. The abbreviations and expressions used in this document are only applicable here.

94
4.1 Overall situation of the non-local programmes, 2012 (categorized by non-local institution)
Country /
Region
Non-local Higher Education
Institution Number of
Programmes Number of
Classes
Students Registered
M F Total
Mainland
China
Sun Yat-sen University 1 1 3 14 17
China Youth University for Political
Sciences 1 1 10 15 25
China Institute of Industrial Relations 1 1 9 11 20
Peking University, China National
School of Administration 1 1 40 28 68
Beijing Language and Culture University 1 3 2 16 18
Beijing Sport University 3 5 10 1 11
Wuhan University 2 2 11 16 27
China National School of Administration 1 1 35 25 60
South China Normal University 13 18 93 276 369
Huaqiao University 9 12 177 158 335
Jinan University 14 22 281 387 668
Hong Kong The Hong Kong Polytechnic University 3 3 10 86 96
Taiwan China Institute of Technology 1 1 -- -- --
United States
of America Chaminade University of Honolulu 1 1 -- -- --
Portugal Instituto Politécnico de Leiria 1 3 11 5 16
Universidade de Lisboa 2 2 7 2 9
Total 55 77 699 1,040 1,739

95
4.2 Number of registered students in the non-local programmes, 2012
(categorized by non-local institution and local partner institution, level of study)
Non-local Higher
Education Institution
Local
Co-organizer Gender PhD M PG-Dip B B Sup. Dip. Total
Sun Yat-sen University Kiang Wu Nursing
College of Macao
M -- 3 -- -- -- -- 3
F -- 14 -- -- -- -- 14
Sub- total -- 17 -- -- -- -- 17
China Youth University
for Political Sciences
Macao Federation
of Trade Unions
M -- -- -- 10 -- -- 10
F -- -- -- 15 -- -- 15
Sub- total -- -- -- 25 -- -- 25
China Institute of
Industrial Relations
Macao Federation
of Trade Unions
M -- -- -- 9 -- -- 9
F -- -- -- 11 -- -- 11
Sub- total -- -- -- 20 -- -- 20
Peking University,
China National School
of Administration
Public
Administration and
Civil Service
Bureau and Macao
Polytechnic
Institute
M -- 40 -- -- -- -- 40
F -- 28 -- -- -- -- 28
Sub- total -- 68 -- -- -- -- 68
Beijing Language and
Culture University
Macao Polytechnic
Institute
M -- 2 -- -- -- -- 2
F -- 16 -- -- -- -- 16
Sub- total -- 18 -- -- -- -- 18
Beijing Sport
University
Macao Polytechnic
Institute
M -- 10 -- -- -- -- 10
F -- 1 -- -- -- -- 1
Sub- total -- 11 -- -- -- -- 11
Wuhan University Amateur Centre for
Permanent Studies
M -- 11 -- -- -- -- 11
F -- 16 -- -- -- -- 16
Sub- total -- 27 -- -- -- -- 27
China National School
of Administration
Macao Polytechnic
Institute
M -- 35 -- -- -- -- 35
F -- 25 -- -- -- -- 25
Sub- total -- 60 -- -- -- -- 60
South China Normal
University
Macao Federation
of Trade Unions
M -- 5 -- -- -- -- 5
F -- 15 -- -- -- -- 15
Sub- total -- 20 -- -- -- -- 20
South China Normal
University
Amateur Centre for
Permanent Studies
M -- 58 -- -- 13 17 88
F -- 140 -- -- 85 36 261
Sub- total -- 198 -- -- 98 53 349
Huaqiao University Amateur Centre for
Permanent Studies
M -- -- -- 7 30 31 68
F -- -- -- 21 70 37 128
Sub- total -- -- -- 28 100 68 196
(Con’t on next page)

96
Non-local Higher
Education Institution
Local
Co-organizer Gender PhD M PG-Dip B B Sup. Dip. Total
Huaqiao University Jinghai Lyceum
M -- -- -- -- 47 62 109
F -- -- -- -- 20 10 30
Sub-
total -- -- -- -- 67 72 139
Jinan University Jiyu Service Center
M -- -- -- 52 117 112 281
F -- -- -- 59 148 180 387
Sub-
total -- -- -- 111 265 292 668
The Hong Kong
Polytechnic University
Macao Polytechnic
Institute
M -- 7 3 -- -- -- 10
F -- 53 33 -- -- -- 86
Sub-
total -- 60 36 -- -- -- 96
Instituto Politécnico
de Leiria
Macao Polytechnic
Institute
M -- 11 -- -- -- -- 11
F -- 5 -- -- -- -- 5
Sub-
total -- 16 -- -- -- -- 16
Universidade de Lisboa Macao Polytechnic
Institute
M 7 -- -- -- -- -- 7
F 2 -- -- -- -- -- 2
Sub-
total 9 -- -- -- -- -- 9
Total
M 7 182 3 78 207 222 699
F 2 313 33 106 323 263 1,040
Total 9 495 36 184 530 485 1,739

97
4.3 Number of registered students in the non-local programmes, 2012
(categorized by academic field, level of study)
Broad Groups Area of Study PhD M PG-Dip B B Sup. Dip. Total
Education
Teacher Training -- -- -- -- -- -- --
Education Science -- 51 -- -- 52 -- 103
Physical Education -- 11 -- -- -- -- 11
Sub-total -- 62 -- -- 52 -- 114
Humanities
and Arts
Humanities -- -- -- -- -- -- --
Languages and Literature 5 24 -- -- 79 109 217
Translation -- -- -- 45 -- 31 76
Design and Arts -- -- -- -- -- 12 12
Religion and Theology -- -- -- -- -- -- --
Sub-total 5 24 -- 45 79 152 305
Social Science,
Business
and Law
Social and Behavioural
Science -- 141 -- 42 114 119 416
Cultural Heritage -- -- -- -- -- -- --
Journalism and
Communication -- 27 -- -- -- -- 27
Business and Management -- 20 -- 72 196 130 418
Gaming Management -- -- -- -- -- -- --
Public Administration 4 144 -- -- -- -- 148
Law -- -- -- -- 67 72 139
Sub-total 4 332 -- 114 377 321 1,148
Science
Life Sciences -- -- -- -- -- -- --
Physical Sciences -- -- -- -- -- -- --
Mathematics -- -- -- -- -- -- --
Computing and
Information Technology -- -- -- -- -- 12 12
Sub-total -- -- -- -- -- 12 12
Architecture and
Engineering
Engineering -- -- -- -- -- -- --
Manufacturing and
Processing -- -- -- -- -- -- --
Architecture, Building and
Town Planning -- -- -- -- -- -- --
Sub-total -- -- -- -- -- -- --
Health and
Social Welfare
Medicine -- -- -- -- -- -- --
Nursing and Health -- 51 36 -- -- -- 87
Pharmacy -- -- -- -- -- -- --
Social Services -- 26 -- 25 -- -- 51
Sub-total -- 77 36 25 -- -- 138
Services
Tourism and Entertainment -- -- -- -- -- -- --
Logistic and
Transportation -- -- -- -- -- -- --
Environmental Protection -- -- -- -- 22 -- 22
Security -- -- -- -- -- -- --
Sub-total -- -- -- -- 22 -- 22
Total 9 495 36 184 530 485 1,739

98
4.4 Number of first-year/newly registered students in the non-local programmes, 2012
(categorized by non-local institution and local partner institution, gender, level of study)
Non-local Higher
Education Institution
Local
Co-organizer Gender PhD M PG-Dip B B Sup. Dip. Total
China Youth University
for Political Sciences
Macao Federation
of Trade Unions
M -- -- -- 10 -- -- 10
F -- -- -- 15 -- -- 15
Sub- total -- -- -- 25 -- -- 25
China Institute of
Industrial Relations
Macao Federation
of Trade Unions
M -- -- -- 9 -- -- 9
F -- -- -- 11 -- -- 11
Sub- total -- -- -- 20 -- -- 20
Beijing Language and
Culture University
Macao Polytechnic
Institute
M -- 1 -- -- -- -- 1
F -- 6 -- -- -- -- 6
Sub- total -- 7 -- -- -- -- 7
China National School
of Administration
Macao Polytechnic
Institute
M -- 35 -- -- -- -- 35
F -- 25 -- -- -- -- 25
Sub- total -- 60 -- -- -- -- 60
South China Normal
University
Macao Federation
of Trade Unions
M -- 5 -- -- -- -- 5
F -- 15 -- -- -- -- 15
Sub- total -- 20 -- -- -- -- 20
South China Normal
University
Amateur Centre for
Permanent Studies
M -- 20 -- -- 10 -- 30
F -- 47 -- -- 36 -- 83
Sub- total -- 67 -- -- 46 -- 113
Huaqiao University Amateur Centre for
Permanent Studies
M -- -- -- 7 13 -- 20
F -- -- -- 21 40 -- 61
Sub- total -- -- -- 28 53 -- 81
Huaqiao University Jinghai Lyceum
M -- -- -- -- 14 -- 14
F -- -- -- -- 7 -- 7
Sub- total -- -- -- -- 21 -- 21
Jinan University Jiyu Service Center
M -- -- -- 52 67 -- 119
F -- -- -- 59 71 -- 130
Sub- total -- -- -- 111 138 -- 249
Total
M -- 61 -- 78 104 -- 243
F -- 93 -- 106 154 -- 353
Total -- 154 -- 184 258 -- 596

99
4.5 Number of graduated students from the non-local programmes, 2012
(categorized by non-local institution and local partner institution, gender)
Non-local Higher Education
Institution
Local
Co-organizer
Number
of
Classes
Graduation Certificate Degree Certificate
M F Total M F Total
Peking University, China National
School of Administration
Public
Administration and
Civil Service
Bureau and Macao
Polytechnic
Institute
2 -- -- -- 33 27 60
Peking University Amateur Centre for
Permanent Studies 1 5 15 20 5 8 13
Beijing Language and Culture
University
Macao Polytechnic
Institute 2 -- 5 5 -- 5 5
Beijing Sport University Macao Polytechnic
Institute 4 3 1 4 3 1 4
South China Normal University Amateur Centre for
Permanent Studies 10 18 67 85 6 28 34
Huaqiao University Amateur Centre for
Permanent Studies 2 18 47 65 -- -- --
Huaqiao University Jinghai Lyceum 2 65 23 88 34 15 49
Jinan University Jiyu Service Center 18 145 146 291 61 60 121
The Hong Kong Polytechnic
University
Macao Polytechnic
Institute 2 -- -- -- 4 20 24
Monash University Macao Polytechnic
Institute 1 -- -- -- -- 3 3
Queen Mary,
University of London
Macao Polytechnic
Institute 2 -- -- -- 3 -- 3
University of Nevada Las Vegas
– Singapore Campus
Institute for
Tourism Studies 1 -- -- -- 5 5
(1) 10
Total 47 254 304 558 154 172 326
Note: 1. There was one non-local graduating student.
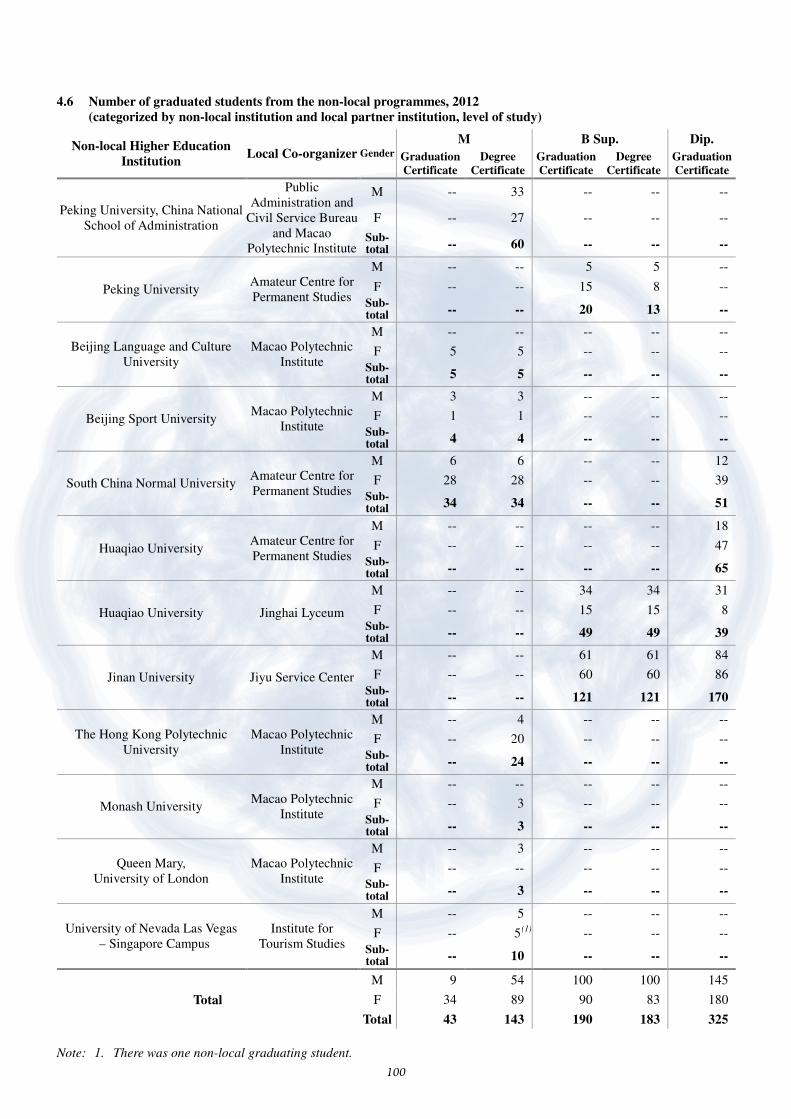
100
4.6 Number of graduated students from the non-local programmes, 2012
(categorized by non-local institution and local partner institution, level of study)
Non-local Higher Education
Institution Local Co-organizer Gender
M B Sup. Dip.
Graduation
Certificate
Degree
Certificate
Graduation
Certificate
Degree
Certificate
Graduation
Certificate
Peking University, China National
School of Administration
Public
Administration and
Civil Service Bureau
and Macao
Polytechnic Institute
M -- 33 -- -- --
F -- 27 -- -- --
Sub- total -- 60 -- -- --
Peking University Amateur Centre for
Permanent Studies
M -- -- 5 5 --
F -- -- 15 8 --
Sub- total -- -- 20 13 --
Beijing Language and Culture
University
Macao Polytechnic
Institute
M -- -- -- -- --
F 5 5 -- -- --
Sub- total 5 5 -- -- --
Beijing Sport University Macao Polytechnic
Institute
M 3 3 -- -- --
F 1 1 -- -- --
Sub- total 4 4 -- -- --
South China Normal University Amateur Centre for
Permanent Studies
M 6 6 -- -- 12
F 28 28 -- -- 39
Sub- total 34 34 -- -- 51
Huaqiao University Amateur Centre for
Permanent Studies
M -- -- -- -- 18
F -- -- -- -- 47
Sub- total -- -- -- -- 65
Huaqiao University Jinghai Lyceum
M -- -- 34 34 31
F -- -- 15 15 8
Sub- total -- -- 49 49 39
Jinan University Jiyu Service Center
M -- -- 61 61 84
F -- -- 60 60 86
Sub- total -- -- 121 121 170
The Hong Kong Polytechnic
University
Macao Polytechnic
Institute
M -- 4 -- -- --
F -- 20 -- -- --
Sub- total -- 24 -- -- --
Monash University Macao Polytechnic
Institute
M -- -- -- -- --
F -- 3 -- -- --
Sub- total -- 3 -- -- --
Queen Mary,
University of London
Macao Polytechnic
Institute
M -- 3 -- -- --
F -- -- -- -- --
Sub- total -- 3 -- -- --
University of Nevada Las Vegas
– Singapore Campus
Institute for
Tourism Studies
M -- 5 -- -- --
F -- 5
(1) -- -- --
Sub- total -- 10 -- -- --
Total
M 9 54 100 100 145
F 34 89 90 83 180
Total 43 143 190 183 325
Note: 1. There was one non-local graduating student.

101
4.7 Number of registered students in the non-local programmes, 2010 - 2012
(categorized by level of study, gender, academic year)
Academic Level of Programme 2010 2011 2012
M F Total M F Total M F Total
Doctorate’s Degree Programme -- -- -- 7 2 9 7 2 9
Master’s Degree Programme 157 271 428 193 357 550 182 313 495
Postgraduate Diploma Programme 4 37 41 3 36 39 3 33 36
Bachelor’s Degree Programme -- -- -- -- -- -- 78 106 184
Bachelor’s Supplementary
Programme 231 182 413 225 284 509 207 323 530
(Three-year) Diploma Programme 526 580 1106 431 512 943 222 263 485
Total 918 1,070 1,988 859 1,191 2,050 699 1,040 1,739
4.8 Number of graduated students from the non-local programmes, 2010 - 2012
(categorized by level of study, gender, academic year)
Academic Level of
Programme Gender
2010 2011 2012
Graduation
Certificate
Degree
Certificate
Graduation
Certificate
Degree
Certificate
Graduation
Certificate
Degree
Certificate
Master Degree Programme
M 23 24 35 35 9 54
F 48 44 44 57 34 89
(1)
Sub- total 71 68 79 92 43 143
Postgraduate Diploma
Programme
M 12 -- 4 -- -- --
F 45 -- 37 -- -- --
Sub- total 57 -- 41 -- -- --
Bachelor Supplementary
Programme
M 142 111 98 154 100 100
F 107 75 75 103 90 83
Sub- total 249 186 173 257 190 183
(Three-year) Diploma
Programme
M 113 -- 148 -- 145 --
F 78 -- 142 -- 180 --
Sub- total 191 -- 290 -- 325 --
Total
M 290 135 285 189 254 154
F 278 119 298 160 304 172
Total 568 254 583 349 558 326
Note: 1. There was one non-local graduating student.

102
Data of Macao Students Studying Higher Education in Places Outside Macao
for the Academic Year 2012/2013
Explanatory Notes:
I. The data of the number of local students pursuing higher education outside Macao for the
2011/2012 academic year is sorted based on the information on students who are eligible to apply
for the ‘Learning Material Subsidy for Tertiary Students for the 2011/2012 Academic Year’. Applicants
for this subsidy must hold a Macao SAR resident identity card and must be taking a higher education
programme lasting no fewer than two years. The number of students who were eligible to apply
were:
Type of Student Doctorate Master
Post-
graduate
Diploma
Bachelor
Bachelor
Supplemen-
tary
Programme
Bacharelato
(3-yr
Degree)
Diploma /
Others Total
Studying in local higher
education institutions 91 1,405 131 12,255 804 1,491 68 16,245
Taking non-local higher
education programmes 2 629 37 2 454 -- 819 1,943
Studying in places
outside Macao 290 1,441 5 11,146 12 166 1,873 14,933
Total 383 3,475 173 23,403 1,270 1,657 2,760 33,121
II. The ‘academic year’ used here refers to the school year. According to Administrative Regulation No.
4/2012, the 2011/2012 academic year is comprised of the following two periods:
(1) From 1st September 2011 to 31st August 2012
(2) From 1st February 2012 to 31st December 2012
III. Unless otherwise specified, the figures listed here do not include the number of students taking the
non-local higher education programmes offered by non-local higher education institutions.
IV. The ‘World Top 100 Universities’ refers to the top 100 higher education institutions as ranked by
Quacquarelli Symonds (QS) in 2011.
V. Certain figures are missing (indicated by ‘--’) in some of the columns in the tables of this document
for one of the following reasons:
(1) Lack of information.
(2) The information is not applicable to the circumstances described.
VI. Some of the percentages in the tables below have been rounded off to two decimal places, so the
aggregate of some of the percentages may not add up to 100%.
VII. The registered students referenced in this document have been categorized based on academic
areas and majors. Using the ‘International Standard Classification of Education’ (ISCED) of UNESCO
and taking the local higher education curriculum into consideration, the students have been
categorized into 7 academic areas, with a certain number of majors under each area, which add up
to 30 majors altogether.
VIII. The abbreviations and expressions used in this document are only applicable here.
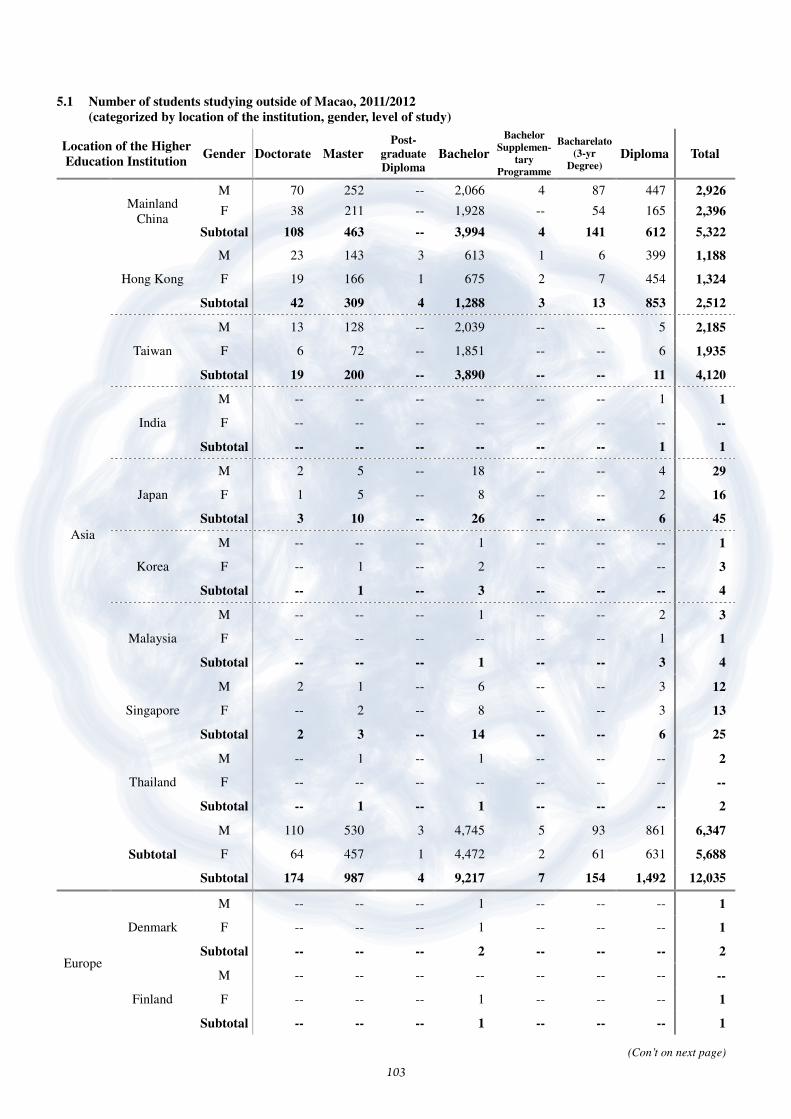
103
5.1 Number of students studying outside of Macao, 2011/2012
(categorized by location of the institution, gender, level of study)
Location of the Higher
Education Institution Gender Doctorate Master
Post-
graduate
Diploma Bachelor
Bachelor
Supplemen-
tary
Programme
Bacharelato
(3-yr
Degree) Diploma Total
Asia
Mainland
China
M 70 252 -- 2,066 4 87 447 2,926
F 38 211 -- 1,928 -- 54 165 2,396
Subtotal 108 463 -- 3,994 4 141 612 5,322
Hong Kong
M 23 143 3 613 1 6 399 1,188
F 19 166 1 675 2 7 454 1,324
Subtotal 42 309 4 1,288 3 13 853 2,512
Taiwan
M 13 128 -- 2,039 -- -- 5 2,185
F 6 72 -- 1,851 -- -- 6 1,935
Subtotal 19 200 -- 3,890 -- -- 11 4,120
India
M -- -- -- -- -- -- 1 1
F -- -- -- -- -- -- -- --
Subtotal -- -- -- -- -- -- 1 1
Japan
M 2 5 -- 18 -- -- 4 29
F 1 5 -- 8 -- -- 2 16
Subtotal 3 10 -- 26 -- -- 6 45
Korea
M -- -- -- 1 -- -- -- 1
F -- 1 -- 2 -- -- -- 3
Subtotal -- 1 -- 3 -- -- -- 4
Malaysia
M -- -- -- 1 -- -- 2 3
F -- -- -- -- -- -- 1 1
Subtotal -- -- -- 1 -- -- 3 4
Singapore
M 2 1 -- 6 -- -- 3 12
F -- 2 -- 8 -- -- 3 13
Subtotal 2 3 -- 14 -- -- 6 25
Thailand
M -- 1 -- 1 -- -- -- 2
F -- -- -- -- -- -- -- --
Subtotal -- 1 -- 1 -- -- -- 2
Subtotal
M 110 530 3 4,745 5 93 861 6,347
F 64 457 1 4,472 2 61 631 5,688
Subtotal 174 987 4 9,217 7 154 1,492 12,035
Europe
Denmark
M -- -- -- 1 -- -- -- 1
F -- -- -- 1 -- -- -- 1
Subtotal -- -- -- 2 -- -- -- 2
Finland
M -- -- -- -- -- -- -- --
F -- -- -- 1 -- -- -- 1
Subtotal -- -- -- 1 -- -- -- 1
(Con’t on next page)

104
Location of the Higher
Education Institution Gender Doctorate Master
Post-
graduate
Diploma Bachelor
Bachelor
Supplemen-
tary
Programme
Bacharelato
(3-yr
Degree) Diploma Total
Europe
France
M -- 1 -- 1 -- -- 1 3
F 1 4 -- 6 -- -- 1 12
Subtotal 1 5 -- 7 -- -- 2 15
Germany
M -- 2 -- -- -- -- 2
F -- 2 -- 2 -- -- 2 6
Subtotal -- 4 -- 2 -- -- 2 8
Ireland
M -- -- -- 7 -- -- -- 7
F -- -- -- 8 -- -- -- 8
Subtotal -- -- -- 15 -- -- -- 15
Italy
M -- -- -- -- -- -- -- --
F -- 1 -- 1 -- -- -- 2
Subtotal -- 1 -- 1 -- -- -- 2
Netherlands
M 2 -- -- 1 -- -- -- 3
F 2 -- -- 2 -- -- -- 4
Subtotal 4 -- -- 3 -- -- -- 7
Portugal
M 1 15 -- 40 -- 1 3 60
F 2 23 -- 44 -- -- 5 74
Subtotal 3 38 -- 84 -- 1 8 134
Sweden
M 2 -- -- -- -- -- -- 2
F -- -- -- -- -- -- -- --
Subtotal 2 -- -- -- -- -- -- 2
Switzerland
M -- 1 -- 22 -- -- 6 29
F -- 1 -- 40 -- 1 4 46
Subtotal -- 2 -- 62 -- 1 10 75
United
Kingdom
M 26 86 -- 218 -- 3 17 350
F 11 118 -- 245 -- 2 17 393
Subtotal 37 204 -- 463 -- 5 34 743
Subtotal
M 31 105 -- 290 -- 4 27 457
F 16 149 -- 350 -- 3 29 547
Subtotal 47 254 -- 640 -- 7 56 1,004
North
America
Canada
M 2 11 -- 121 -- 1 25 160
F 4 6 -- 108 -- 1 21 140
Subtotal 6 17 -- 229 -- 2 46 300
United States
of America
M 24 30 -- 233 4 1 127 419
F 20 43 -- 246 1 1 105 416
Subtotal 44 73 -- 479 5 2 232 835
Subtotal
M 26 41 -- 354 4 2 152 579
F 24 49 -- 354 1 2 126 556
Subtotal 50 90 -- 708 5 4 278 1,135
(Con’t on next page)

105
Location of the Higher
Education Institution Gender Doctorate Master
Post-
graduate
Diploma Bachelor
Bachelor
Supplemen-
tary
Programme
Bacharelato
(3-yr
Degree) Diploma Total
Oceania
Australia
M 5 49 -- 247 -- 1 18 320
F 7 56 1 280 -- -- 25 369
Subtotal 12 105 1 527 -- 1 43 689
New Zealand
M -- -- -- 11 -- -- -- 11
F 1 -- -- 24 -- -- 2 27
Subtotal 1 -- -- 35 -- -- 2 38
Subtotal
M 5 49 -- 258 -- 1 18 331
F 8 56 1 304 -- -- 27 396
Subtotal 13 105 1 562 -- 1 45 727
Unknown or Unspecified
M 3 2 -- 9 -- -- 2 16
F 3 3 -- 10 -- -- -- 16
Subtotal 6 5 -- 19 -- -- 2 32
Total
M 175 727 3 5,656 9 100 1,060 7,730
F 115 714 2 5,490 3 66 813 7,203
Total 290 1,441 5 11,146 12 166 1,873 14,933
% 1.94% 9.65% 0.03% 74.64% 0.08% 1.11% 12.54% --

106
5.2 Number of students studying outside of Macao, 2011/2012 (categorized by academic field, level of study)
Academic Field Doctorate Master Post-
graduate
Diploma Bachelor
Bachelor
Supplemen-
tary
Programme
Bacharelato
(3-yr
Degree) Diploma Total
Education
Teacher Training and
Education Science 17 54 -- 355 -- 11 37 474
Sub-total 17 54 -- 355 -- 11 37 474
Humanities
and Arts
Humanities 30 92 -- 1,084 -- 4 73 1,283
Arts 3 52 -- 484 -- 4 100 643
Sub-total 33 144 -- 1,568 -- 8 173 1,926
Social
Sciences,
Business
and Law
Social and Behavioural
Science 31 103 1 909 -- 17 87 1,148
Journalism and
Information 5 25 -- 506 -- 1 23 560
Business and
Administration 23 330 3 2,976 6 61 481 3,880
Gaming Management -- -- -- 3 -- -- 1 4
Cultural Heritage -- 1 -- 2 -- -- -- 3
Law 13 40 -- 324 2 14 367 760
Sub-total 72 499 4 4,720 8 93 959 6,355
Science
Life Sciences 19 37 -- 255 -- 1 26 338
Physical Sciences 22 34 -- 307 -- 3 22 388
Mathematics and
Statistics 5 22 -- 215 -- -- 7 249
Computing 8 70 1 469 1 5 81 635
Sub-total 54 163 1 1,246 1 9 136 1,610
Engineering,
Manufacturing
and
Construction
Engineering and
Engineering Trades 21 63 -- 445 1 9 74 613
Manufacturing and
Processing 3 10 -- 105 -- -- 19 137
Architecture and
Building 5 67 -- 454 -- 8 48 582
Sub-total 29 140 -- 1,004 1 17 141 1,332
Agriculture
Agriculture, Forestry
and Fishery 1 3 -- 64 -- -- -- 68
Veterinary 2 4 -- 11 -- -- 1 18
Sub-total 3 7 -- 75 -- -- 1 86
Health and
Welfare
Health 77 363 -- 1,260 1 7 88 1,796
Social Services 1 15 -- 167 -- -- 18 201
Sub-total 78 378 -- 1,427 1 7 106 1,997
Services
Personal Services 4 26 -- 507 -- 10 124 671
Transport Services -- 10 -- 153 1 11 46 221
Environmental
Protection -- 20 -- 91 -- -- 7 118
Sub-total 4 56 -- 751 1 21 177 1,010
Unknown or Unspecified -- -- -- -- -- -- 143 143
Total 290 1,441 5 11,146 12 166 1,873 14,933

107
5.3 Number of students studying in the best 100 universities in the world, 2011/2012
(categorized by the university ranking, level of study)
Rank Institution Doctorate Master Post-
graduate
Diploma Bachelor
Bachelor
Supplemen-
tary
Programme
Bacharelato
(3-yr
Degree) Diploma Total
1 University of Cambridge 1 2 -- 4 -- -- -- 7
2 Harvard University 2 -- -- -- -- -- -- 2
3 Massachusetts Institute
of Technology -- -- -- 1 -- -- -- 1
5 University of Oxford 2 2 -- 1 -- -- -- 5
6 University of London -
Imperial College London 5 8 -- 5 -- 1 -- 19
7 University of London -
University College London 3 8 -- 9 -- -- 1 21
8 University of Chicago -- -- -- -- -- -- 1 1
9 University of Pennsylvania -- -- -- 2 -- -- -- 2
10 Columbia University in
the City of New York -- 3 -- -- -- -- -- 3
12 California Institute of
Technology 1 -- -- -- -- -- -- 1
14 University of Michigan -- -- -- 3 -- -- -- 3
15 Cornell University -- 2 -- 1 -- -- -- 3
17 McGill University 1 -- -- 4 -- -- -- 5
20 The University of Edinburgh 1 5 -- 5 -- -- -- 11
21 University of California
Berkeley 1 2 -- 30 -- -- 1 34
22 University of Hong Kong 15 63 2 131 2 1 44 258
23 University of Toronto 2 4 -- 35 -- -- 5 46
24 Northwestern University 2 -- -- -- -- -- 1 3
25 Tokyo Daigaku -- 3 -- 2 -- -- -- 5
26 The Australian National
University 1 1 -- 18 -- -- 1 21
27 King’s College London 1 3 -- 6 -- -- -- 10
28 National University of
Singapore -- -- -- 4 -- -- -- 4
29 The University of
Manchester 2 5 -- 22 -- -- -- 29
30 University of Bristol -- 3 -- 5 -- -- 2 10
31 University of Melbourne 2 9 -- 44 -- -- 4 59
32 Kyoto Daigaku -- -- -- 2 -- -- -- 2
34 University of California
Los Angeles 3 2 -- 22 -- -- -- 27
(Con’t on next page)

108
Rank Institution Doctorate Master Post-
graduate
Diploma Bachelor
Bachelor
Supplemen-
tary
Programme
Bacharelato
(3-yr
Degree) Diploma Total
37 Chinese University of
Hong Kong 10 96 -- 276 -- -- 46 428
38 University of Sydney 3 11 -- 36 -- -- 1 51
39 Brown University 1 -- -- -- -- -- -- 1
40 Hong Kong University of
Science and Technology 2 22 -- 73 -- 1 -- 98
41 University of
Wisconsin-Madison -- -- -- 1 -- -- 1 2
43 Carnegie Mellon University -- 2 -- -- -- -- -- 2
44 New York University -- 1 -- 2 -- -- 1 4
46 Peking University 7 150 -- 38 22 -- 1 218
47 Tsinghua University 3 10 -- 25 -- -- 1 39
48 The University of
Queensland 1 22 -- 61 -- -- -- 84
49 University of
New South Wales -- 6 -- 49 -- -- -- 55
50 University of Warwick 1 9 -- 8 -- -- -- 18
51 The University of British
Columbia 1 1 -- 29 -- -- 1 32
54 Technische Universität
München -- 1 -- -- -- -- 1 2
55 University of North Carolina
at Chapel Hill -- -- -- 1 -- -- -- 1
56 University of Washington 1 1 -- 12 -- -- 3 17
58 Nanyang Technological
University 2 -- -- 1 -- -- -- 3
59 The University of Glasgow 1 3 -- -- -- -- -- 4
60 Monash University 1 15 -- 49 -- -- 3 68
61 University of Illinois at
Urbana - Champaign -- -- -- 3 -- -- -- 3
67 The University of
Birmingham -- 3 -- 2 -- -- -- 5
70 Boston University -- 1 -- -- -- -- -- 1
70 Tohoku Daigaku -- 1 -- -- -- -- -- 1
72 The University of Sheffield 2 3 -- 5 -- -- 1 11
73 The University of
Western Australia -- -- -- 5 -- -- -- 5
74 The University of
Nottingham 2 8 -- 11 -- -- -- 21
75 University of Southampton 2 2 -- 5 -- -- -- 9
76 The University of Texas
at Austin 1 -- -- 1 -- -- -- 2
(Con’t on next page)

109
Rank Institution Doctorate Master Post-
graduate
Diploma Bachelor
Bachelor
Supplemen-
tary
Programme
Bacharelato
(3-yr
Degree) Diploma Total
77 University of California
San Diego 1 -- -- 29 -- -- -- 30
78 Washington University in
St. Louis -- 1 -- -- -- -- -- 1
80 Universiteit Utrecht 1 -- -- -- -- -- -- 1
82 The University of Auckland
/ Te Whare Wananga o Ta 1 -- -- 15 -- -- -- 16
83 Uppsala universitet 1 -- -- -- -- -- -- 1
85 Purdue University -- -- -- 3 -- -- -- 3
87 National Taiwan University 10 41 -- 225 -- -- 1 277
91 Fudan University 5 8 -- 27 -- -- -- 40
92 The University of Adelaide -- 2 -- 8 -- -- 1 11
93 University of Leeds -- 2 -- 2 -- -- -- 4
94 The Pennsylvania State
University -- -- -- 1 -- -- -- 1
95 University of Durham 1 1 -- 5 -- -- 1 8
96 The University of York -- 1 -- 2 -- -- -- 3
97 University of St. Andrews 2 -- -- 2 -- -- -- 4
100 University of Alberta 1 1 -- 7 -- -- -- 9
Total 109 550 2 1,375 24 3 123 2,186
Percentage 4.99% 25.16% 0.09% 62.90% 1.10% 0.14% 5.63% --
Note: These figures also include the number of students taking the non-local higher education programmes offered by
non-local higher education institutions.

110
5.4 Number of students studying in the best 100 universities in the world, 2011/2012
(categorized by academic field, level of study)
Academic Field Doctorate Master Post-
graduate
Diploma Bachelor
Bachelor
Supplemen-
tary
Programme
Bacharelato
(3-yr
Degree) Diploma Total
Education
Teacher Training and
Education Science 3 10 -- 5 -- -- 9 27
Sub-total 3 10 -- 5 -- -- 9 27
Humanities
and Arts
Humanities 20 31 -- 92 -- -- 9 152
Arts -- 4 -- 11 -- -- 5 20
Sub-total 20 35 -- 103 -- -- 14 172
Social
Sciences,
Business
and Law
Social and Behavioural
Science 10 26 -- 137 -- -- 4 177
Journalism and
Information 2 10 -- 29 22 -- 4 67
Business and
Administration 5 221 2 336 -- -- 25 589
Law 2 20 -- 30 2 -- 1 55
Sub-total 19 277 2 532 24 -- 34 888
Science
Life Sciences 12 20 -- 76 -- -- 8 116
Physical Sciences 9 16 -- 98 -- 1 1 125
Mathematics and
Statistics 3 13 -- 52 -- -- -- 68
Computing 2 32 -- 70 -- 1 2 107
Sub-total 26 81 -- 296 -- 2 11 416
Engineering,
Manufacturing
and
Construction
Engineering and
Engineering Trades 14 23 -- 118 -- -- 1 156
Manufacturing and
Processing 1 3 -- 7 -- -- 1 12
Architecture and
Building 4 31 -- 76 -- -- 1 112
Sub-total 19 57 -- 201 -- -- 3 280
Agriculture
Agriculture, Forestry
and Fishery 1 2 -- 18 -- -- -- 21
Veterinary 2 -- -- 4 -- -- -- 6
Sub-total 3 2 -- 22 -- -- -- 27
Health and
Welfare
Health 19 64 -- 156 -- 1 13 253
Social Services -- 6 -- 11 -- -- 1 18
Sub-total 19 70 -- 167 -- 1 14 271
Services
Personal Services -- 3 -- 15 -- -- 4 22
Transport Services -- 4 -- 10 -- -- 1 15
Environmental
Protection -- 11 -- 24 -- -- -- 35
Sub-total -- 18 -- 49 -- -- 5 72
Unknown or Unspecified -- -- -- -- -- -- 33 33
Total 109 550 2 1,375 24 3 123 2,186
Note: These figures also include the number of students taking the non-local higher education programmes offered by
non-local higher education institutions.

111
Higher Education Indicators of Macao for the Academic Year 2012/2013
Explanatory Notes:
I. The main sources of the information included here are:
(1) The ‘Macao Higher Education Data for the Academic Year 2012/2013’ submitted to GAES by the
ten local higher education institutions. This information is accurate as of 31st October 2012.
(2) The Statistics and Census Service of the Government of Macao Special Administrative Region.
II. The ‘academic year’ used here refers to the school year, which generally starts on 1st September
every year and ends on 31st of August in the next year.
III. According to the relevant requirements of Decree Law No. 5/95/M “General Rules of the Academy
of Public Security Forces (ESFSM)”, the ESFSM teaching staff will be composed of military teaching
staff and civilian teachers. The teaching positions at the ESFSM shall be held by personnel from the
Public Security Force with the relevant experience and qualifications, while the other posts shall be
held by teaching staff from the University of Macao or other members of the Academy of Public
Security Forces on a part-time basis, as agreed upon.
IV. This document uses certain terms which have been briefly defined below:
(1) ‘Registered students’ refers to students who have completed the registration procedures and
met all admission requirements.
(2) ‘Local students’ refers to students holding Macao resident identity cards. Non-holders are
referred as ‘non-local students’.
(3) Full-time programmes include day and evening programmes which are divided by academic
years/semesters. The main lectures are given during the daytime or evening on weekdays, on a
continuous, face-to-face basis.
V. Certain figures are missing (indicated by ‘--’) in some of the columns in the tables of this document
for one of the following reasons:
(1) Lack of information.
(2) The category is not applicable to that institution.
(3) The institution failed to provide the information.
VI. Some of the percentages in the tables below have been rounded off to two decimal places, so the
aggregate of some of the percentages may not add up to 100%.
VII. The figures in tables the number of full-time teachers and programmes were rounded off and the
sum of the numbers in these tables may be slightly different from the actual subtotal or total value.
The number zero in these tables represents a value of less than 0.5 while ‘--’ indicates a value of
zero.
VIII. The abbreviations and expressions used in this document are only applicable here.
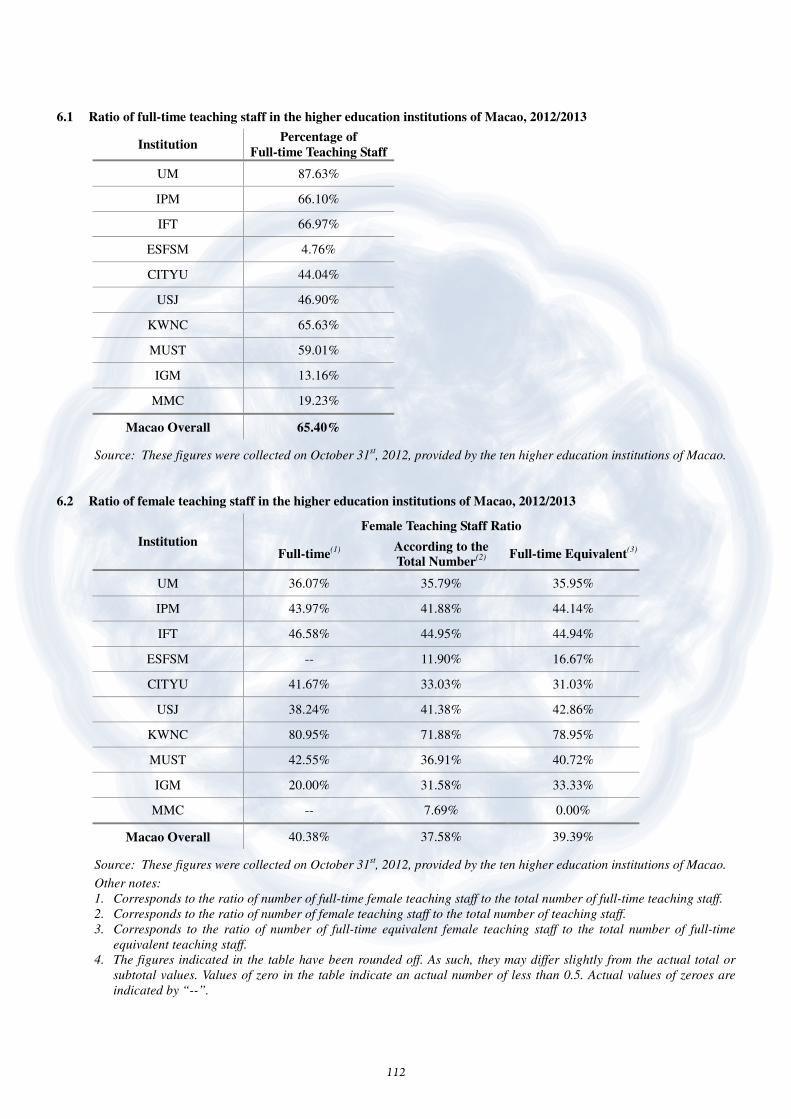
112
6.1 Ratio of full-time teaching staff in the higher education institutions of Macao, 2012/2013
Institution Percentage of
Full-time Teaching Staff
UM 87.63%
IPM 66.10%
IFT 66.97%
ESFSM 4.76%
CITYU 44.04%
USJ 46.90%
KWNC 65.63%
MUST 59.01%
IGM 13.16%
MMC 19.23%
Macao Overall 65.40%
Source: These figures were collected on October 31st, 2012, provided by the ten higher education institutions of Macao.
6.2 Ratio of female teaching staff in the higher education institutions of Macao, 2012/2013
Institution
Female Teaching Staff Ratio
Full-time(1)
According to the
Total Number(2)
Full-time Equivalent
(3)
UM 36.07% 35.79% 35.95%
IPM 43.97% 41.88% 44.14%
IFT 46.58% 44.95% 44.94%
ESFSM -- 11.90% 16.67%
CITYU 41.67% 33.03% 31.03%
USJ 38.24% 41.38% 42.86%
KWNC 80.95% 71.88% 78.95%
MUST 42.55% 36.91% 40.72%
IGM 20.00% 31.58% 33.33%
MMC -- 7.69% 0.00%
Macao Overall 40.38% 37.58% 39.39%
Source: These figures were collected on October 31st, 2012, provided by the ten higher education institutions of Macao.
Other notes:
1. Corresponds to the ratio of number of full-time female teaching staff to the total number of full-time teaching staff.
2. Corresponds to the ratio of number of female teaching staff to the total number of teaching staff.
3. Corresponds to the ratio of number of full-time equivalent female teaching staff to the total number of full-time
equivalent teaching staff.
4. The figures indicated in the table have been rounded off. As such, they may differ slightly from the actual total or
subtotal values. Values of zero in the table indicate an actual number of less than 0.5. Actual values of zeroes are
indicated by “--”.

113
6.3 Ratio of non-local teaching staff in the higher education institutions of Macao, 2012/2013
Institution
Ratio of Foreign Teachers
Full-time(1)
According to the
Total Number(2)
Full-time Equivalent
(3)
UM 22.52% 23.91% 23.14%
IPM 11.21% 15.67% 12.61%
IFT 17.81% 17.43% 15.73%
ESFSM -- -- --
CITYU 22.92% 41.28% 41.38%
USJ 23.53% 32.41% 25.51%
KWNC 23.81% 31.25% 26.32%
MUST 72.36% 66.31% 67.07%
IGM 20.00% 42.11% 41.67%
MMC 60.00% 50.00% 57.14%
Macao Overall 31.28% 34.29% 32.37%
Source: These figures were collected on October 31st, 2012, provided by the ten higher education institutions of Macao.
Other notes:
1. Corresponds to the ratio of number of full-time female teaching staff to the total number of full-time teaching staff.
2. Corresponds to the ratio of number of female teaching staff to the total number of teaching staff.
3. Corresponds to the ratio of number of full-time equivalent female teaching staff to the total number of full-time
equivalent teaching staff.
4. The figures indicated in the table have been rounded off. As such, they may differ slightly from the actual total or
subtotal values. Values of zero in the table indicate an actual number of less than 0.5. Actual values of zeroes are
indicated by “--”.
6.4 Ratio of teaching staff with a PhD in the higher education institutions of Macao, 2012/2013
Institution
Ratio of Teaching Staff with PhDs
Full-time(1)
According to the
Total Number(2)
Full-time Equivalent
(3)
UM 74.43% 70.40% 74.76%
IPM 53.45% 40.17% 51.35%
IFT 34.25% 29.36% 31.46%
ESFSM -- 30.95% 33.33%
CITYU 58.33% 59.63% 63.79%
USJ 44.12% 31.03% 31.63%
KWNC 33.33% 34.38% 36.84%
MUST 51.64% 48.71% 49.10%
IGM 60.00% 15.79% 16.67%
MMC 80.00% 65.38% 85.71%
Macao Overall 60.10% 51.04% 56.92%
Source: These figures were collected on October 31st, 2012, provided by the ten higher education institutions of Macao.
Other notes:
1. Corresponds to the ratio of number of full-time female teaching staff to the total number of full-time teaching staff.
2. Corresponds to the ratio of number of female teaching staff to the total number of teaching staff.
3. Corresponds to the ratio of number of full-time equivalent female teaching staff to the total number of full-time
equivalent teaching staff.
4. The figures indicated in the table have been rounded off. As such, they may differ slightly from the actual total or
subtotal values. Values of zero in the table indicate an actual number of less than 0.5. Actual values of zeroes are
indicated by “--”.

114
6.5 Ratio of full-time administrative support staff to full-time teaching staff in in the higher
education institutions of Macao, 2012/2013
Institution
Ratio of Full-time Administrative Support
Staff to Full-time Teaching Staff in Higher
education institutions
UM 1.34 : 1
IPM 1.51 : 1
IFT 3.16 : 1
ESFSM 65.00 : 1
CITYU 1.19 : 1
USJ 0.57 : 1
KWNC 1.24 : 1
MUST 1.11 : 1
IGM 1.40 : 1
MMC 2.20 : 1
Macao Overall 1.49 : 1
Source: These figures were collected on October 31st, 2012, provided by the ten higher education institutions of Macao.
Other notes: The administrative support staff includes the civil personnel, the technical staff, the workers, the security
guards, the drivers and other support staff.
6.6 Student-teacher Ratio in the higher education institutions of Macao, 2012/2013
Institution
Teacher-Student Ratio
Full-time(1)
According to the
Total Number(2)
Full-time Equivalent
(3)
UM 1 : 16.19 1 : 14.18 1 : 16.22
IPM 1 : 12.76 1 : 8.44 1 : 13.34
IFT 1 : 21.55 1 : 14.43 1 : 17.67
ESFSM 1 : 36.50 1 : 1.74 1 : 4.06
CITYU 1 : 27.00 1 : 16.31 1 : 30.66
USJ 1 : 24.76 1 : 11.61 1 : 17.18
KWNC 1 : 11.71 1 : 9.53 1 : 16.05
MUST 1 : 37.69 1 : 22.24 1 : 31.03
IGM -- 1 : 9.53 1 : 30.17
MMC 1 : 38.80 1 : 7.46 1 : 27.71
Macao Overall 1 : 21.45 1 : 14.50 1 : 20.11
Source: These figures were collected on October 31st, 2012, provided by the ten higher education institutions of Macao.
Other notes:
1. Corresponds to the ratio of full time teaching staff to full-time student body.
2. Corresponds to the ratio of the total number of teaching staff to the total number of registered students.
3. Corresponds to the ratio of the total full-time equivalent teaching staff to the total number of full-time equivalent
student.
4. “--” indicates that there is no data or that the criteria is not applicable.

115
6.7 Male-female students ratio in the higher education institutions of Macao, 2012/2013
Institution Gender Number of Registered Students Male-Female Student Ratio
Full-time Part-time Total Full-time(1)
Part-time(2)
Total(3)
UM
M 3,516 -- 3,516 41.46% -- 41.46%
F 4,965 -- 4,965 58.54% -- 58.54%
Subtotal 8,481 -- 8,481 -- -- --
IPM
M 1,266 -- 1,266 42.76% -- 42.76%
F 1,695 -- 1,695 57.24% -- 57.24%
Subtotal 2,961 -- 2,961 -- -- --
IFT
M 442 -- 442 28.10% -- 28.10%
F 1,131 -- 1,131 71.90% -- 71.90%
Subtotal 1,573 -- 1,573 -- -- --
ESFSM
M 58 -- 58 79.45% -- 79.45%
F 15 -- 15 20.55% -- 20.55%
Subtotal 73 -- 73 -- -- --
CITYU
M 666 241 907 51.39% 50.00% 51.01%
F 630 241 871 48.61% 50.00% 48.99%
Subtotal 1,296 482 1,778 -- -- --
USJ
M 733 -- 733 43.53% -- 43.53%
F 951 -- 951 56.47% -- 56.47%
Subtotal 1,684 -- 1,684 -- -- --
KWNC
M 28 2 30 11.38% 3.39% 9.84%
F 218 57 275 88.62% 96.61% 90.16%
Subtotal 246 59 305 -- -- --
MUST
M 4,914 -- 4,914 47.41% -- 47.41%
F 5,451 -- 5,451 52.59% -- 52.59%
Subtotal 10,365 -- 10,365 -- -- --
IGM
M -- 127 127 -- 35.08% 35.08%
F -- 235 235 -- 64.92% 64.92%
Subtotal -- 362 362 -- -- --
MMC
M 113 -- 113 58.25% -- 58.25%
F 81 -- 81 41.75% -- 41.75%
Subtotal 194 -- 194 -- -- --
Macao
overall
M 11,736 370 12,106 43.67% 40.97% 43.58%
F 15,137 533 15,670 56.33% 59.03% 56.42%
Total 26,873 903 27,776 -- -- --
Source: These figures were collected on October 31st, 2012, provided by the ten higher education institutions of Macao.
Other notes:
1. Ratio of full-time female students taking programmes and the total of full-time students.
2. Ratio of female students taking part-time programmes and the total number of students taking part-time
programmes.
3. Ratio of the total number of female students and the total number of registered students.
4. “--” indicates that there is no data or that the criteria is not applicable.

116
6.8 Ratio of non-local students in the higher education institutions of Macao, 2012/2013
Institution Gender
Number of Local
Students
Number of Non-local
Students Total Ratio of Non-Local Students
Full-time Part-time Full-time Part-time Full-time(1)
Part-time(2)
Total(3)
UM
M 2,459 -- 1,057 -- 3,516 30.06% -- 30.06%
F 3,415 -- 1,550 -- 4,965 31.22% -- 31.22%
Subtotal 5,874 -- 2,607 -- 8,481 30.74% -- 30.74%
IPM
M 1,086 -- 180 -- 1,266 14.22% -- 14.22%
F 1,406 -- 289 -- 1,695 17.05% -- 17.05%
Subtotal 2,492 -- 469 -- 2,961 15.84% -- 15.84%
IFT
M 393 -- 49 -- 442 11.09% -- 11.09%
F 984 -- 147 -- 1,131 13.00% -- 13.00%
Subtotal 1,377 -- 196 -- 1,573 12.46% -- 12.46%
ESFSM
M 57 -- 1 -- 58 1.72% -- 1.72%
F 15 -- -- -- 15 -- -- 0.00%
Subtotal 72 -- 1 -- 73 1.37% -- 1.37%
CITYU
M 388 233 278 8 907 41.74% 3.32% 31.53%
F 374 239 256 2 871 40.63% 0.83% 29.62%
Subtotal 762 472 534 10 1,778 41.20% 2.07% 30.60%
USJ
M 635 -- 98 -- 733 13.37% -- 13.37%
F 879 -- 72 -- 951 7.57% -- 7.57%
Subtotal 1,514 -- 170 -- 1,684 10.10% -- 10.10%
KWNC
M 28 2 -- -- 30 -- -- 0.00%
F 205 43 13 14 275 5.96% 24.56% 9.82%
Subtotal 233 45 13 14 305 5.28% 23.73% 8.85%
MUST
M 2,543 -- 2,371 -- 4,914 48.25% -- 48.25%
F 2,513 -- 2,938 -- 5,451 53.90% -- 53.90%
Subtotal 5,056 -- 5,309 -- 10,365 51.22% -- 51.22%
IGM
M -- 125 -- 2 127 -- 1.57% 1.57%
F -- 233 -- 2 235 -- 0.85% 0.85%
Subtotal -- 358 -- 4 362 -- 1.10% 1.10%
MMC
M 113 -- -- -- 113 -- -- 0.00%
F 81 -- -- -- 81 -- -- 0.00%
Subtotal 194 -- -- -- 194 -- -- 0.00%
Macao
overall
M 7,702 360 4,034 10 12,106 34.37% 2.70% 33.40%
F 9,872 515 5,265 18 15,670 34.78% 3.38% 33.71%
Total 17,574 875 9,299 28 27,776 34.60% 3.10% 33.58%
Source: These figures were collected on October 31st, 2012, provided by the ten higher education institutions of Macao.
Other notes:
1. Ratio of full-time non-local students taking programmes and the total of full-time students.
2. Ratio of non-local students taking part-time programmes and the total number of students taking part-time programmes.
3. Ratio of the total number of non-local students and the total number of registered students.
4. “--” indicates that there is no data or that the criteria is not applicable.
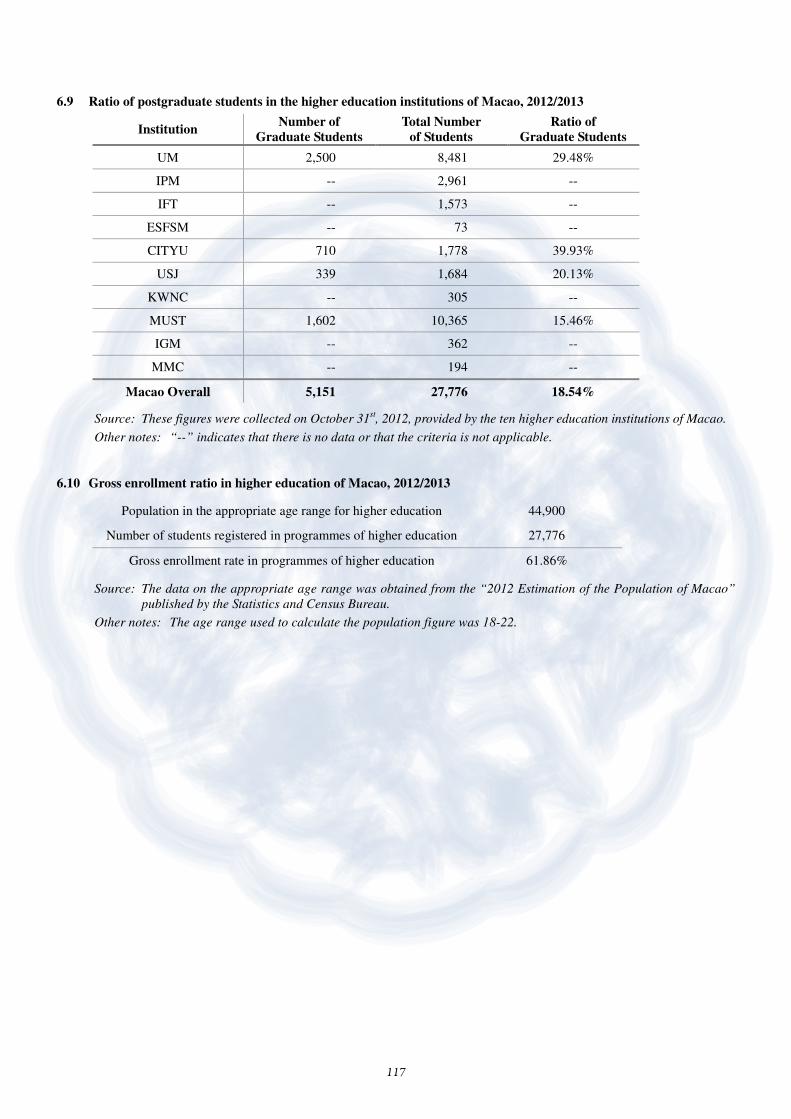
117
6.9 Ratio of postgraduate students in the higher education institutions of Macao, 2012/2013
Institution Number of
Graduate Students Total Number
of Students Ratio of
Graduate Students
UM 2,500 8,481 29.48%
IPM -- 2,961 --
IFT -- 1,573 --
ESFSM -- 73 --
CITYU 710 1,778 39.93%
USJ 339 1,684 20.13%
KWNC -- 305 --
MUST 1,602 10,365 15.46%
IGM -- 362 --
MMC -- 194 --
Macao Overall 5,151 27,776 18.54%
Source: These figures were collected on October 31st, 2012, provided by the ten higher education institutions of Macao.
Other notes: “--” indicates that there is no data or that the criteria is not applicable.
6.10 Gross enrollment ratio in higher education of Macao, 2012/2013
Population in the appropriate age range for higher education 44,900
Number of students registered in programmes of higher education 27,776
Gross enrollment rate in programmes of higher education 61.86%
Source: The data on the appropriate age range was obtained from the “2012 Estimation of the Population of Macao”
published by the Statistics and Census Bureau.
Other notes: The age range used to calculate the population figure was 18-22.