Embed Size (px)
Citation preview
Chapter 7Section 2
The StandardNormal Distribution
Chapter 7 – Section 2
● Learning objectives Find the area under the standard normal curve Find Z-scores for a given area Interpret the area under the standard normal curve
as a probability
1
2
3
Chapter 7 – Section 2
● Learning objectives Find the area under the standard normal curve Find Z-scores for a given area Interpret the area under the standard normal curve
as a probability
1
2
3
Chapter 7 – Section 2
● The standard normal curve is the one with mean μ = 0 and standard deviation σ = 1
● We have related the general normal random variable to the standard normal random variable through the Z-score
● In this section, we discuss how to compute with the standard normal random variable
X
Z
Chapter 7 – Section 2
● There are several ways to calculate the area under the standard normal curve What does not work – some kind of a simple formula We can use a table (such as Table IV on the inside
back cover) We can use technology (a calculator or software)
● Using technology is preferred
Chapter 7 – Section 2
● Three different area calculations Find the area to the left of Find the area to the right of Find the area between
● Three different area calculations Find the area to the left of Find the area to the right of Find the area between
● Three different methods shown here From a table Using Excel Using Statistical software
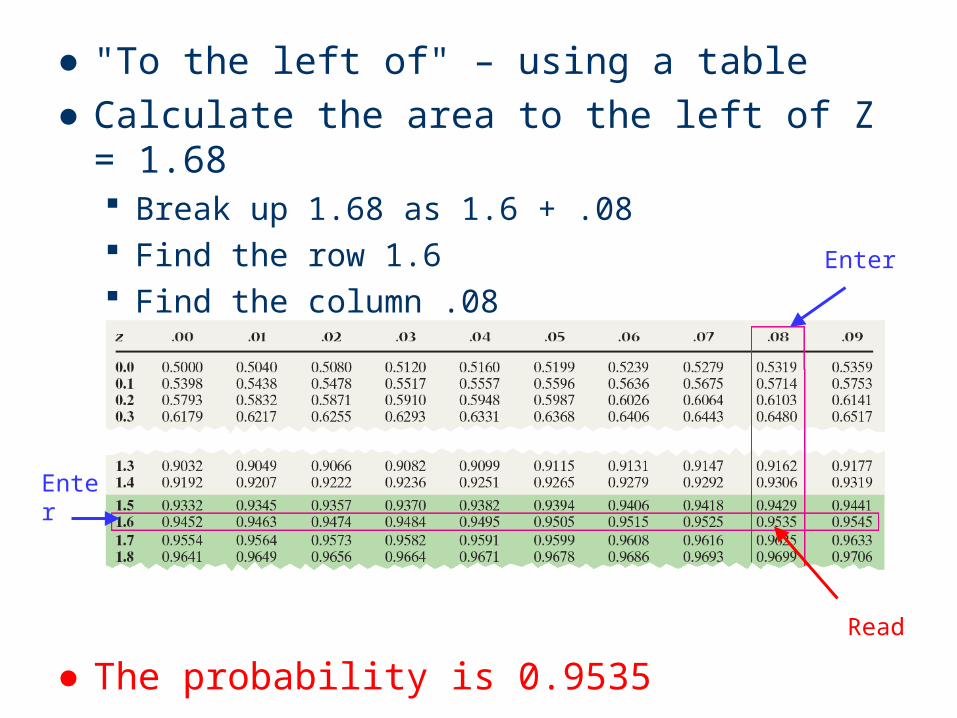
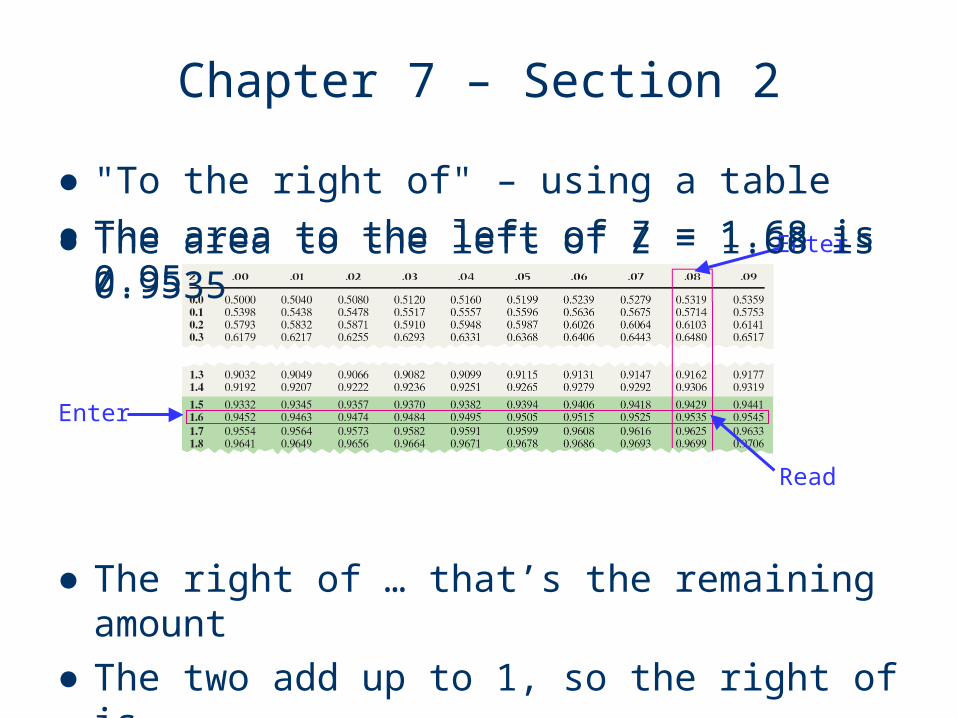
● "To the left of" – using a table● Calculate the area to the left of Z = 1.68
Break up 1.68 as 1.6 + .08 Find the row 1.6 Find the column .08 Read answer at intersection of the two.
● The probability is 0.9535
Enter
Read
Enter
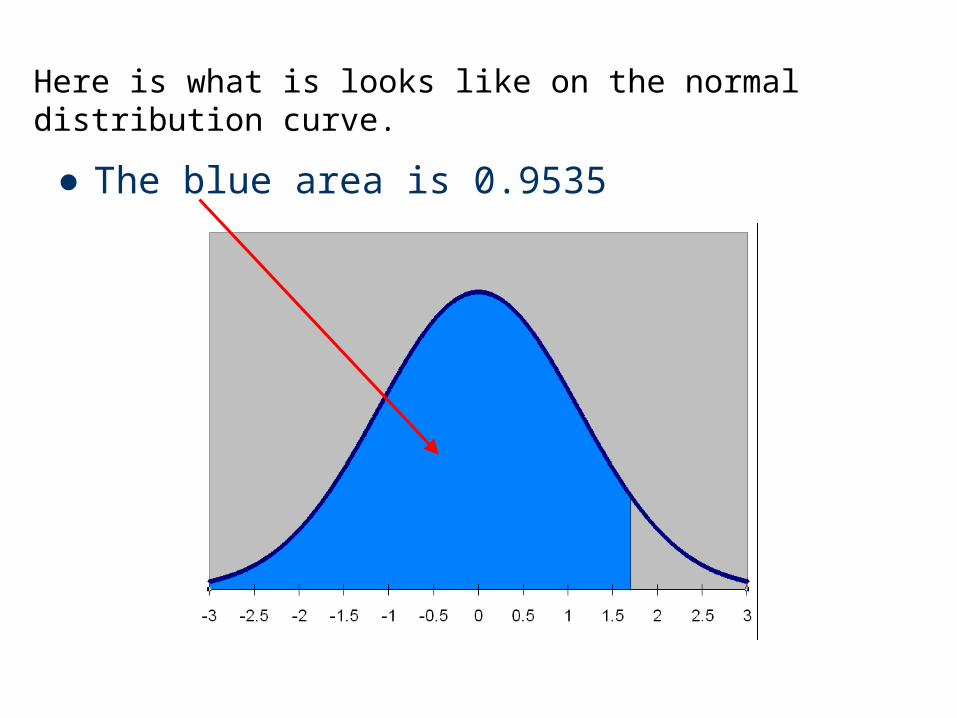
● The blue area is 0.9535
Here is what is looks like on the normal distribution curve.
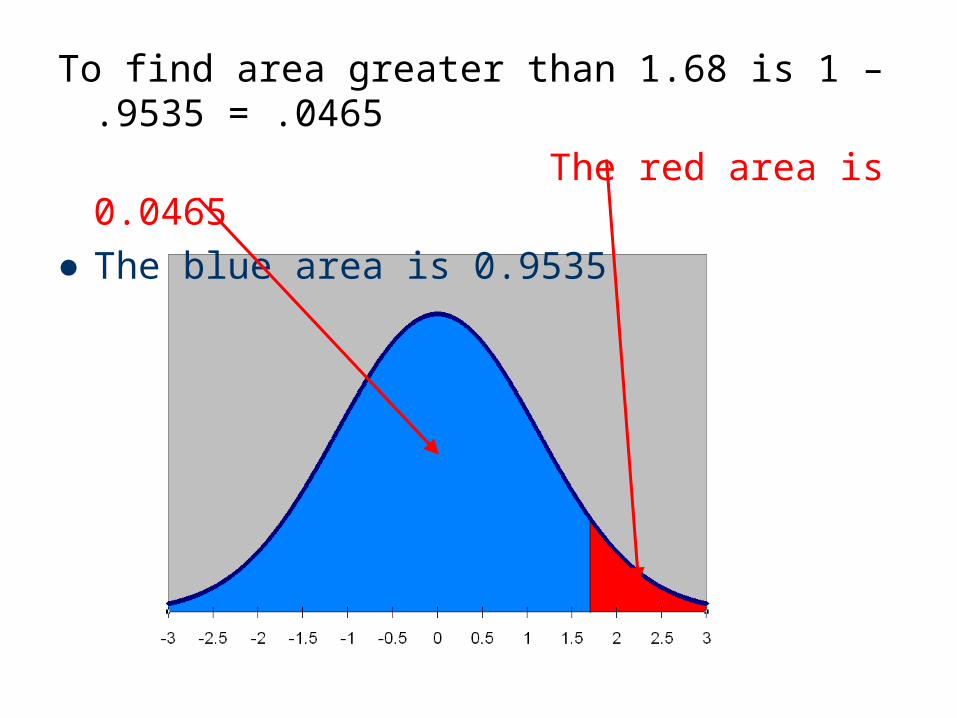
To find area greater than 1.68 is 1 – .9535 = .0465
The red area is 0.0465● The blue area is 0.9535
Chapter 7 – Section 2
● "To the right of" – using a table● The area to the left of Z = 1.68 is 0.9535
Read
Enter
Enter● The area to the left of Z = 1.68 is 0.9535
● The right of … that’s the remaining amount● The two add up to 1, so the right of is
1 – 0.9535 = 0.0465
Chapter 7 – Section 2
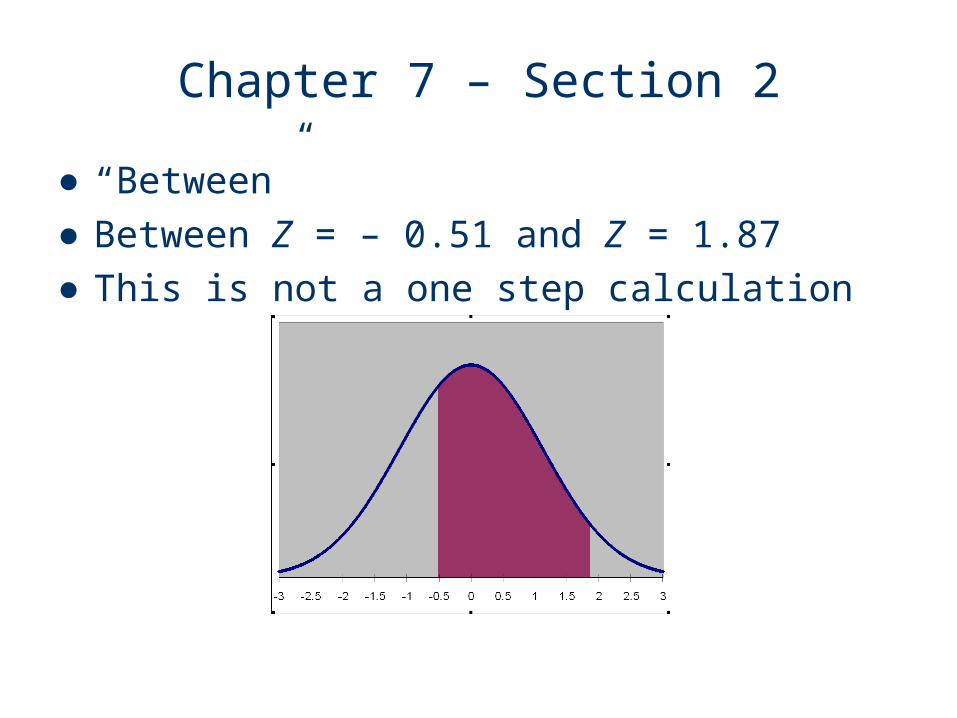
● “Between”● Between Z = – 0.51 and Z = 1.87● This is not a one step calculation
Chapter 7 – Section 2
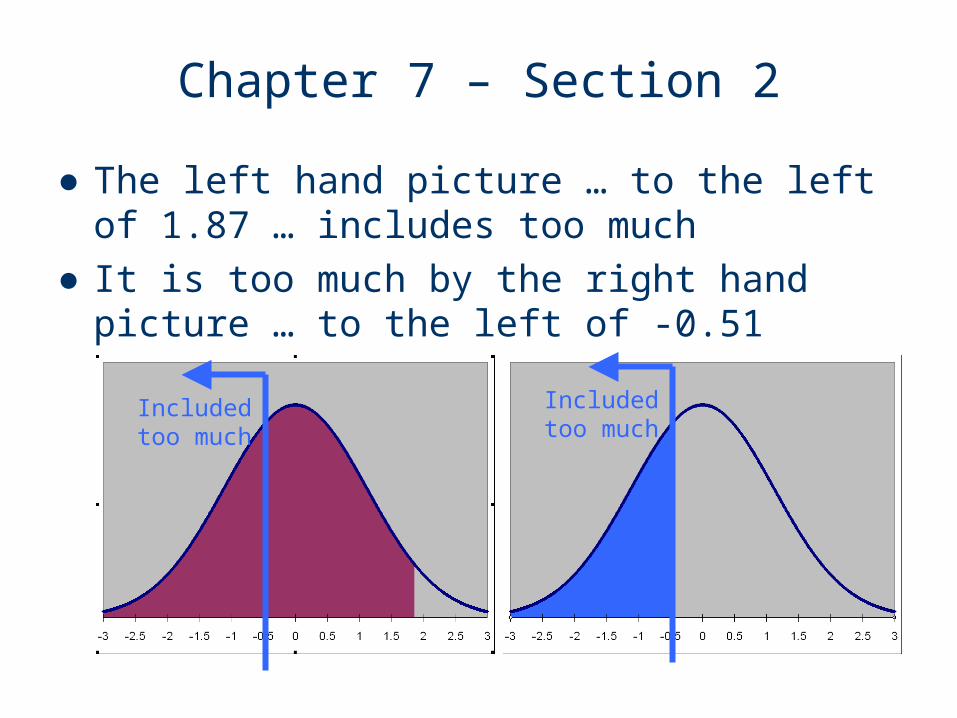
● The left hand picture … to the left of 1.87 … includes too much
● It is too much by the right hand picture … to the left of -0.51
Includedtoo much
Includedtoo much
Chapter 7 – Section 2
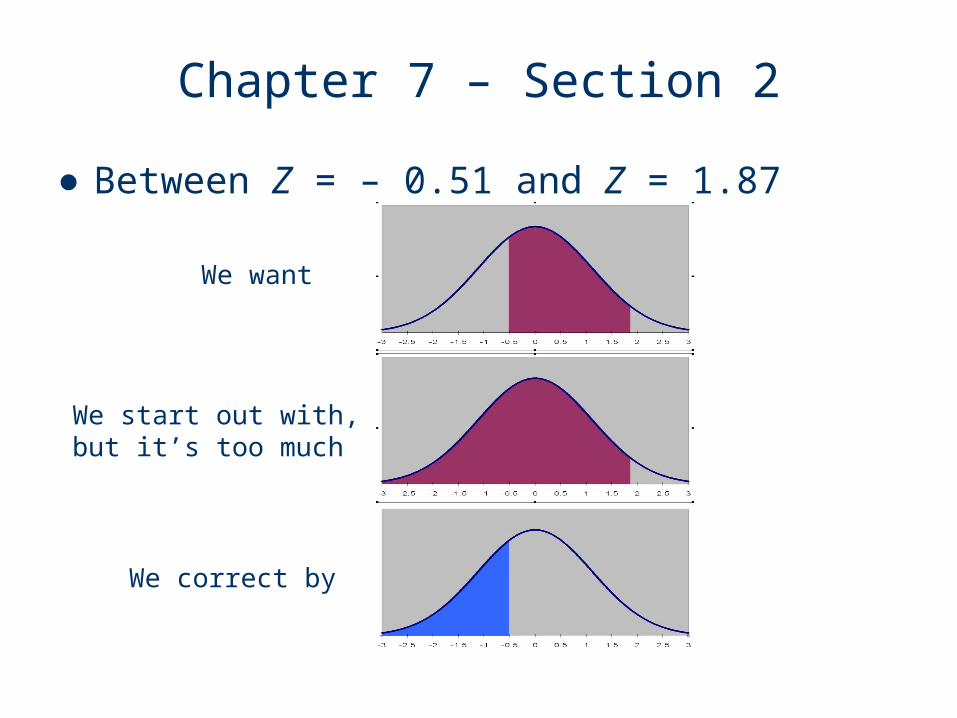
● Between Z = – 0.51 and Z = 1.87
We want
We start out with,but it’s too much
We correct by
Chapter 7 – Section 2
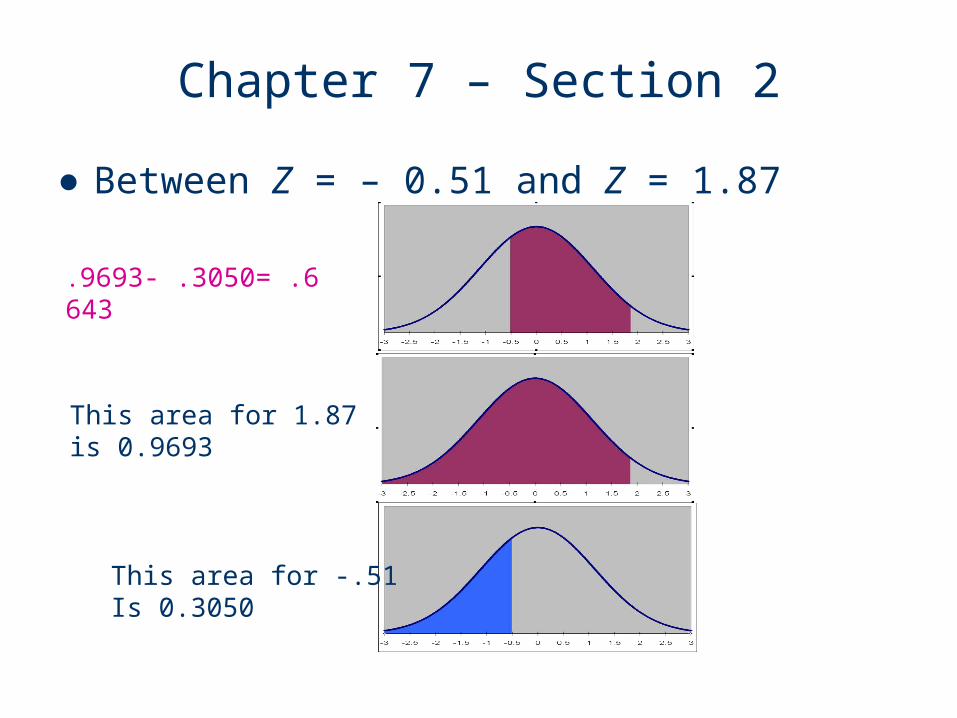
● Between Z = – 0.51 and Z = 1.87
This area for 1.87 is 0.9693
This area for -.51Is 0.3050
.9693- .3050= .6643
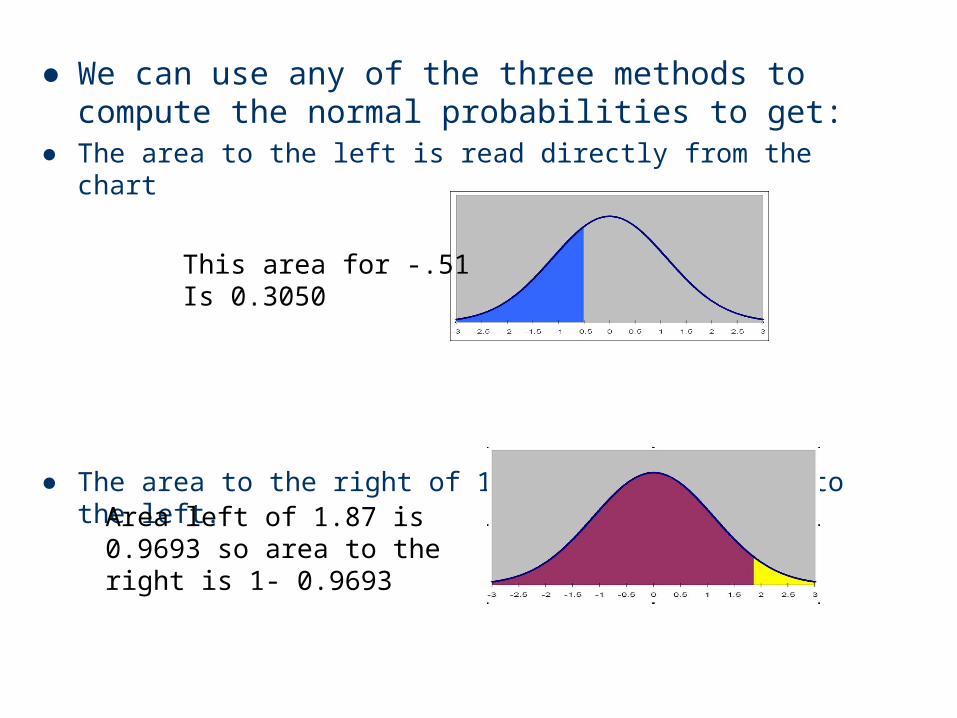
● We can use any of the three methods to compute the normal probabilities to get:
● The area to the left is read directly from the chart
● The area to the right of 1.87 is 1 minus area to the left.
This area for -.51Is 0.3050
Area left of 1.87 is 0.9693 so area to the right is 1- 0.9693
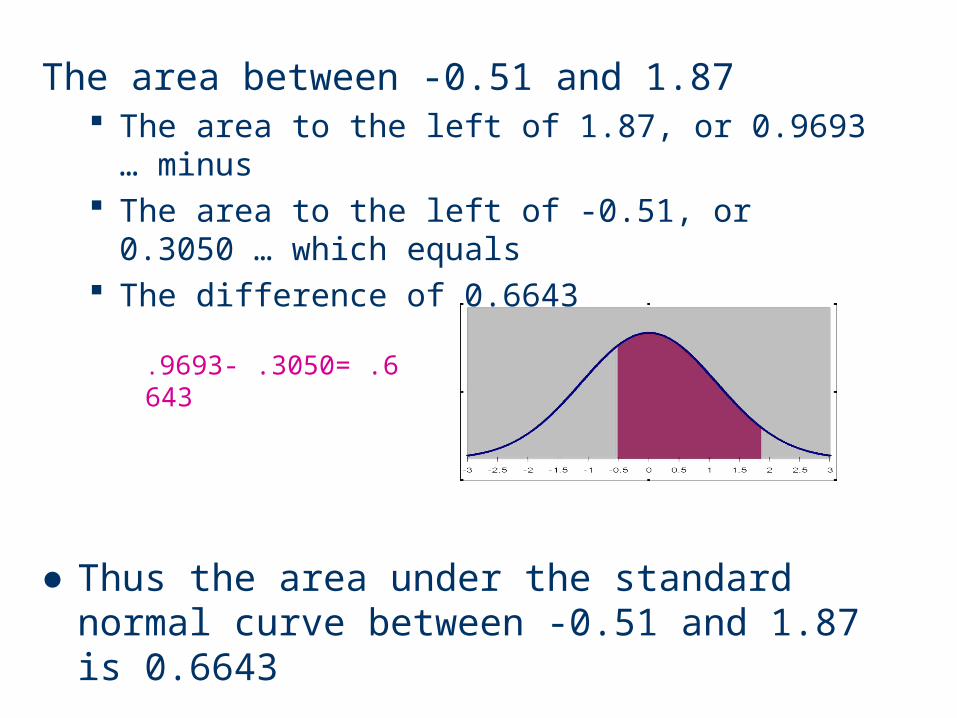
The area between -0.51 and 1.87 The area to the left of 1.87, or 0.9693 … minus The area to the left of -0.51, or 0.3050 … which
equals The difference of 0.6643
● Thus the area under the standard normal curve between -0.51 and 1.87 is 0.6643
.9693- .3050= .6643
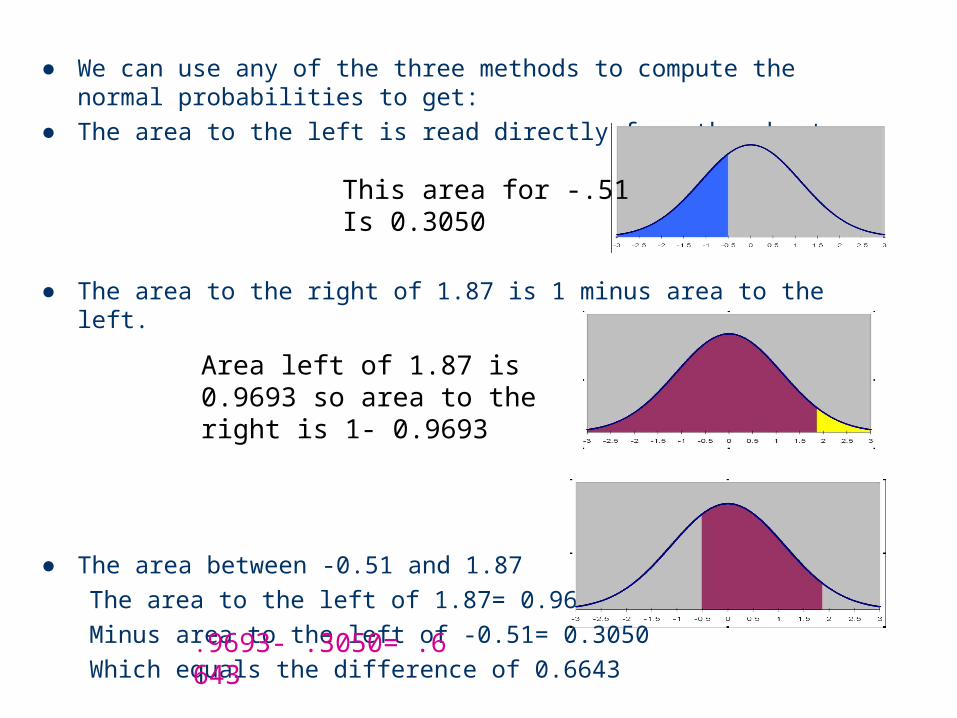
● We can use any of the three methods to compute the normal probabilities to get:
● The area to the left is read directly from the chart
● The area to the right of 1.87 is 1 minus area to the left.
● The area between -0.51 and 1.87
The area to the left of 1.87= 0.9693
Minus area to the left of -0.51= 0.3050
Which equals the difference of 0.6643
This area for -.51Is 0.3050
Area left of 1.87 is 0.9693 so area to the right is 1- 0.9693
.9693- .3050= .6643
Chapter 7 – Section 2
● Learning objectives Find the area under the standard normal curve Find Z-scores for a given area Interpret the area under the standard normal curve
as a probability
1
2
3
Chapter 7 – Section 2
● We did the problem:
Z-Score Area● Now we will do the reverse of that
Area Z-Score
● We did the problem:
Z-Score Area● Now we will do the reverse of that
Area Z-Score● This is finding the Z-score (value) that
corresponds to a specified area (percentile)● And … no surprise … we can do this with a
table, with Excel, with StatCrunch, with …
Chapter 7 – Section 2
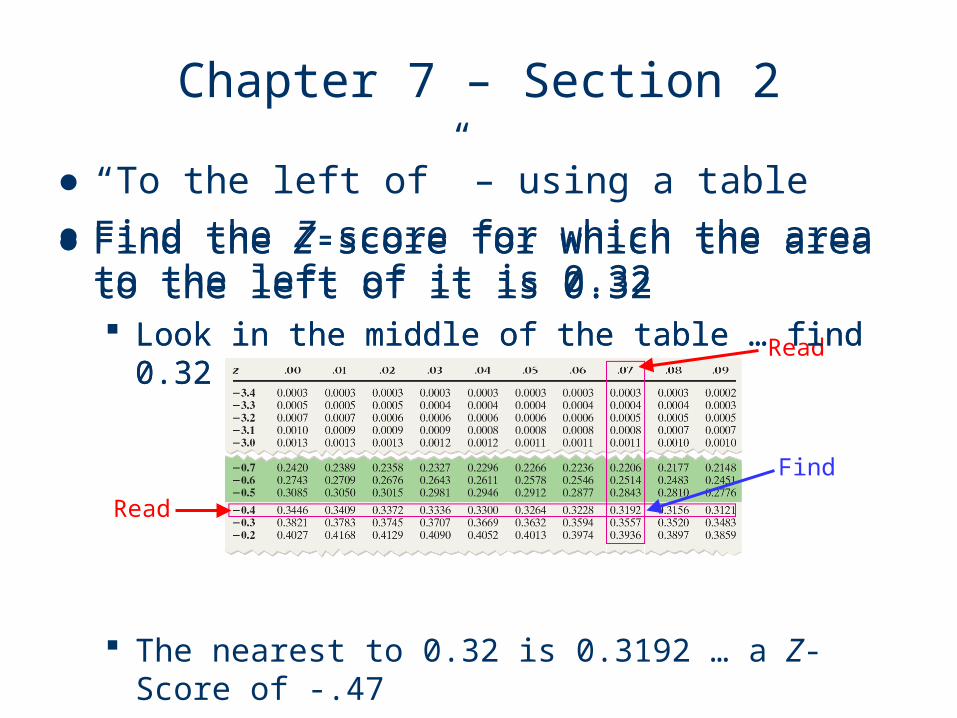
● “To the left of” – using a table● Find the Z-score for which the area to the left of
it is 0.32● Find the Z-score for which the area to the left of
it is 0.32 Look in the middle of the table … find 0.32
Find
Read
Read
● Find the Z-score for which the area to the left of it is 0.32 Look in the middle of the table … find 0.32
The nearest to 0.32 is 0.3192 … a Z-Score of -.47
Chapter 7 – Section 2
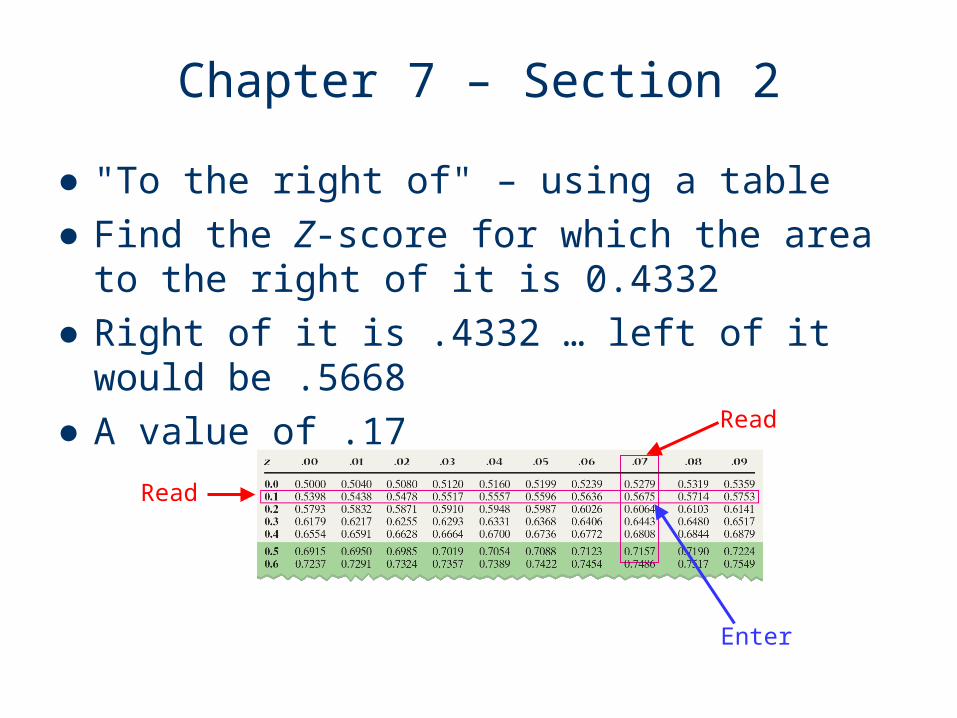
● "To the right of" – using a table● Find the Z-score for which the area to the right of
it is 0.4332● Right of it is .4332 … left of it would be .5668● A value of .17
Enter
Read
Read
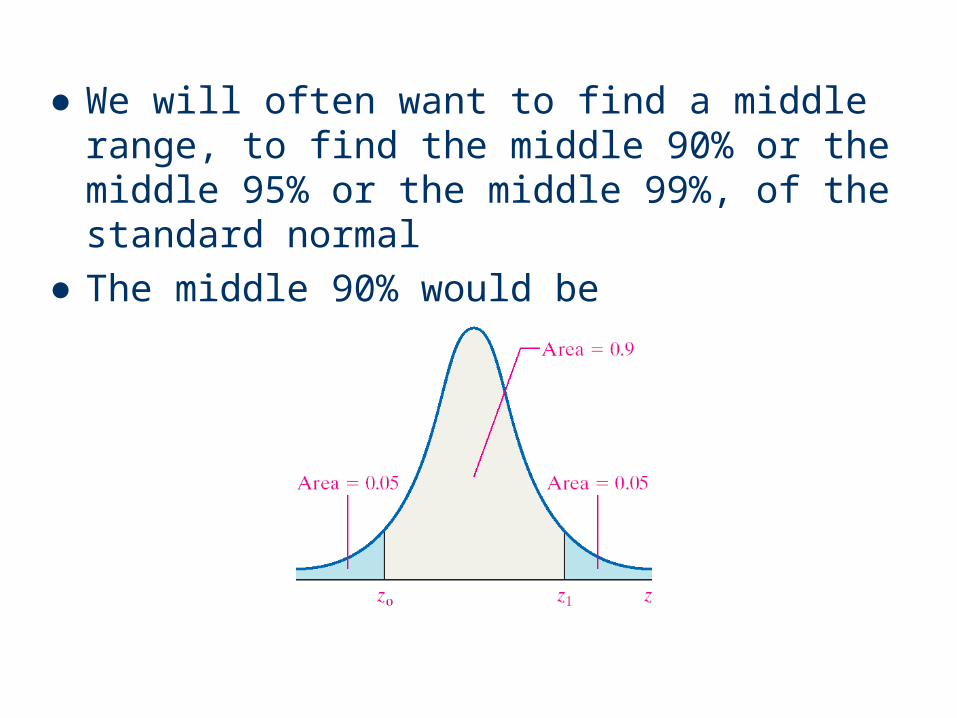
● We will often want to find a middle range, to find the middle 90% or the middle 95% or the middle 99%, of the standard normal
● The middle 90% would be
Chapter 7 – Section 2
● 90% in the middle is 10% outside the middle, i.e. 5% off each end
● These problems can be solved in either of two equivalent ways
● We could find The number for which 5% is to the left, or The number for which 5% is to the right
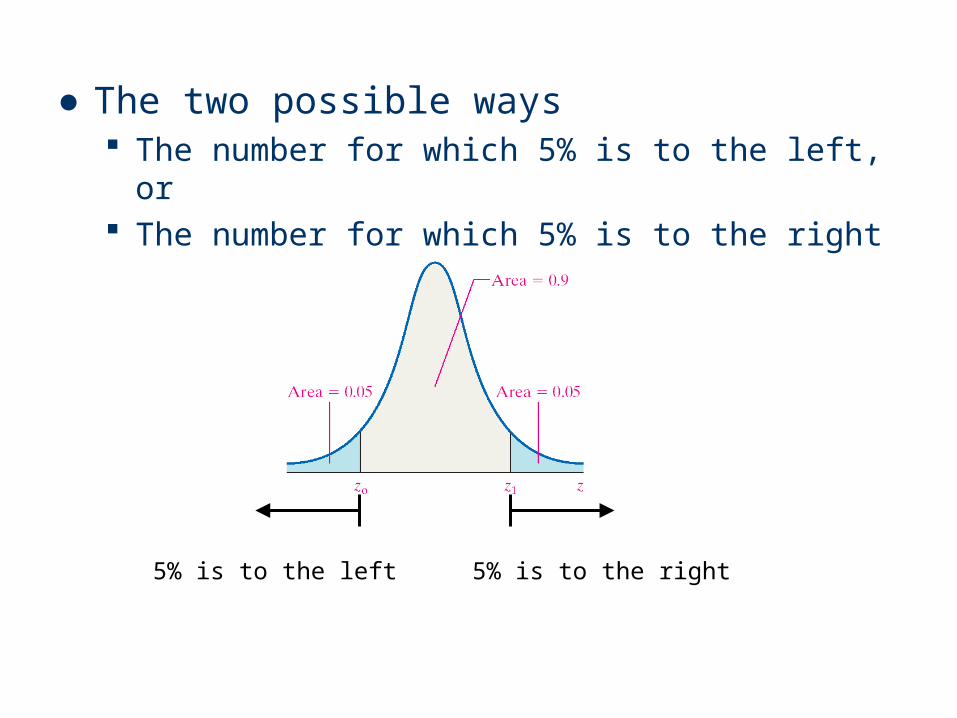
● The two possible ways The number for which 5% is to the left, or The number for which 5% is to the right
5% is to the left 5% is to the right
Chapter 7 – Section 2
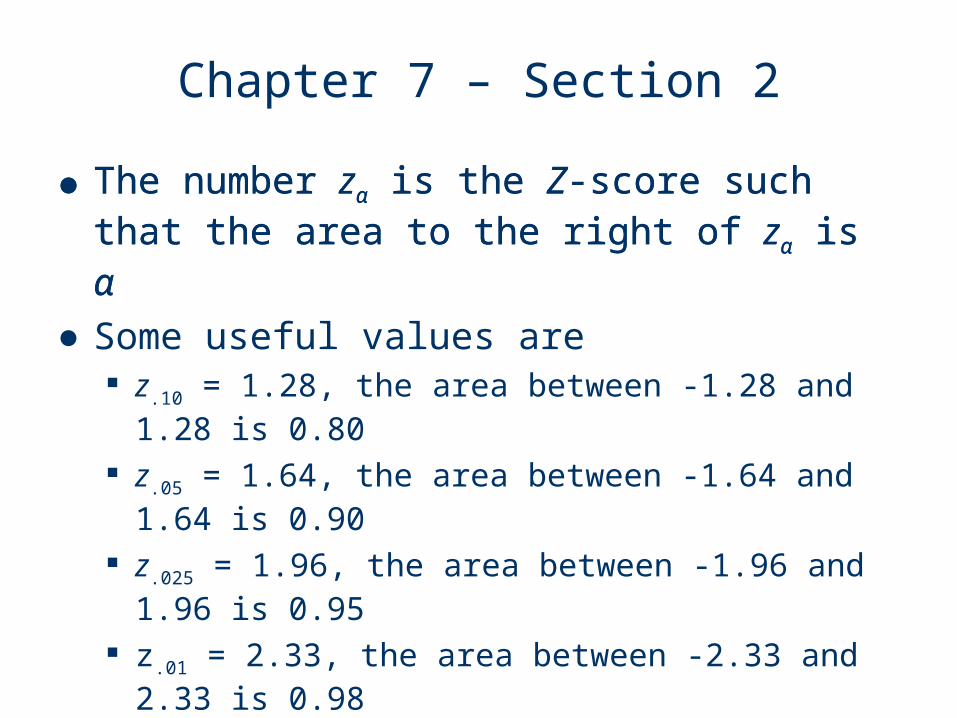
● The number zα is the Z-score such that the area to the right of zα is α
● The number zα is the Z-score such that the area to the right of zα is α
● Some useful values are z.10 = 1.28, the area between -1.28 and 1.28 is 0.80
z.05 = 1.64, the area between -1.64 and 1.64 is 0.90
z.025 = 1.96, the area between -1.96 and 1.96 is 0.95
z.01 = 2.33, the area between -2.33 and 2.33 is 0.98
z.005 = 2.58, the area between -2.58 and 2.58 is 0.99
Chapter 7 – Section 2
● Learning objectives Find the area under the standard normal curve Find Z-scores for a given area Interpret the area under the standard normal curve
as a probability
1
2
3
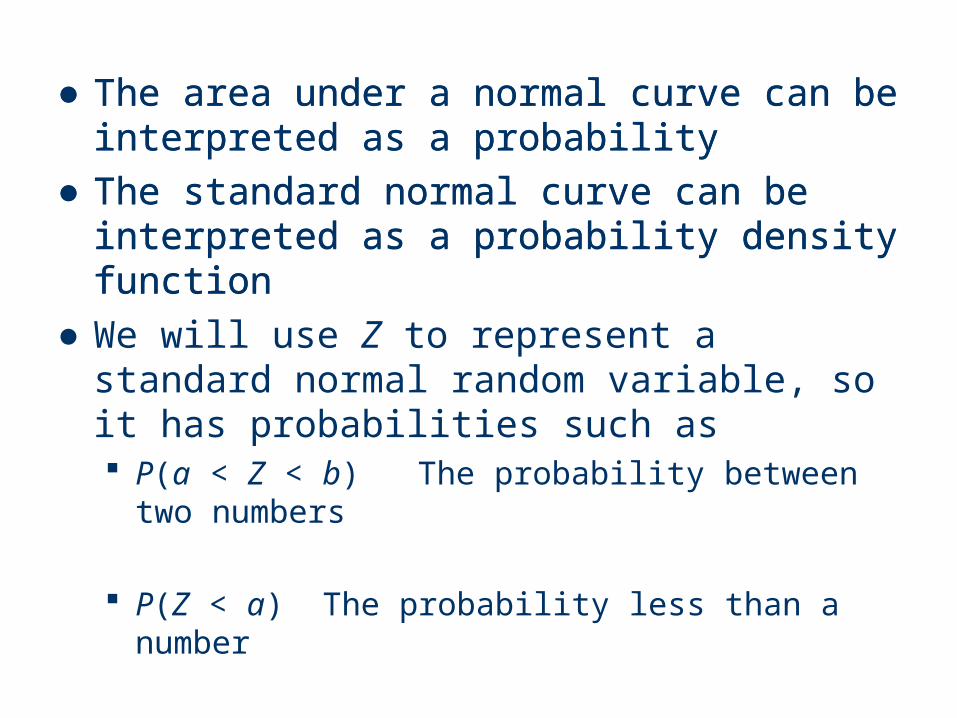
● The area under a normal curve can be interpreted as a probability
● The standard normal curve can be interpreted as a probability density function
● The area under a normal curve can be interpreted as a probability
● The standard normal curve can be interpreted as a probability density function
● We will use Z to represent a standard normal random variable, so it has probabilities such as P(a < Z < b) The probability between two numbers
P(Z < a) The probability less than a number
P(Z > a) The probability greater than a number
Summary: Chapter 7 – Section 2
● Calculations for the standard normal curve can be done using tables or using technology
● One can calculate the area under the standard normal curve, to the left of or to the right of each Z-score
● One can calculate the Z-score so that the area to the left of it or to the right of it is a certain value
● Areas and probabilities are two different representations of the same concept

Were are done.