Embed Size (px)
Citation preview
Chapter 7Sampling DistributionsTarget Goal:DISTINGUISH between a parameter and a statistic.
DEFINE sampling distribution.
DETERMINE whether a statistic is an unbiased estimator of a population parameter.7.1a
h.w: pg 429: 1 – 7 odd
The Reasoning of Statistical Inference in the following problem rests on asking:
“How often would this method give a correct answer if I used it very many times?”
What Is a
Sam
plin
g D
istributio
n?
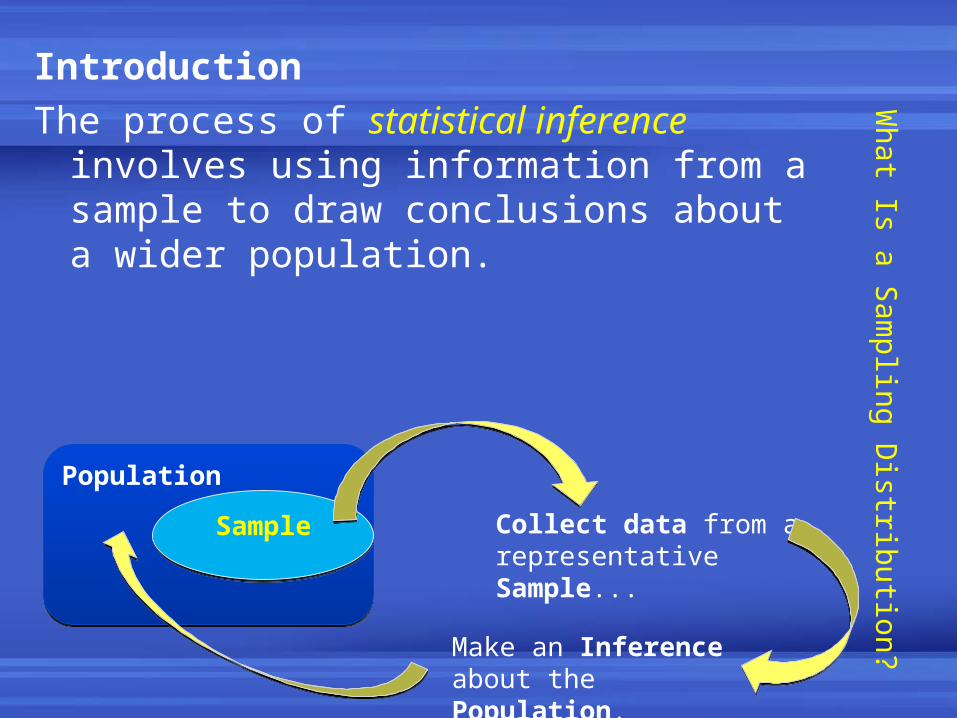
Introduction
The process of statistical inference involves using information from a sample to draw conclusions about a wider population.
PopulationPopulation
SampleSample Collect data from a representative Sample...
Make an Inference about the Population.
• Suppose I randomly select 100 seniors in Anne Arundel County and record each one’s GPA.
• These 100 seniors make up one possible sample.
• All seniors in Anne Arundel County make up the population.
• The sample mean ( ) is 2.5470 and the sample standard deviation (sx) is 0.7150.
x
• The population mean (μ) and the population standard deviation (σ) are unknown.
• We can use to estimate μ and we can use sx to estimate σ. These estimates may or may not be reliable.
x
Parameter• A parameter is a number that
describes the population. Hence, μ and σ are both parameters.
• The population proportion parameter is usually represented by p.
• We don’t know it’s value because we can’t examine the entire population.
Statistic• A statistic is number that is computed from
a sample.• Therefore, and sx are both statistics.• A sample population proportion is
represented by . • The value is known when we take a sample
but can change from sample to sample. This is known as sampling variability.
• We use a statistic to estimate an unknown parameter.
p̂
x
Ex. Making Money
• The current population survey of sample households found that the mean income = $57,045.
• We want to draw a conclusion about the entire 106 million households.
Statistic:
Parameter:
x
$57,045
All households
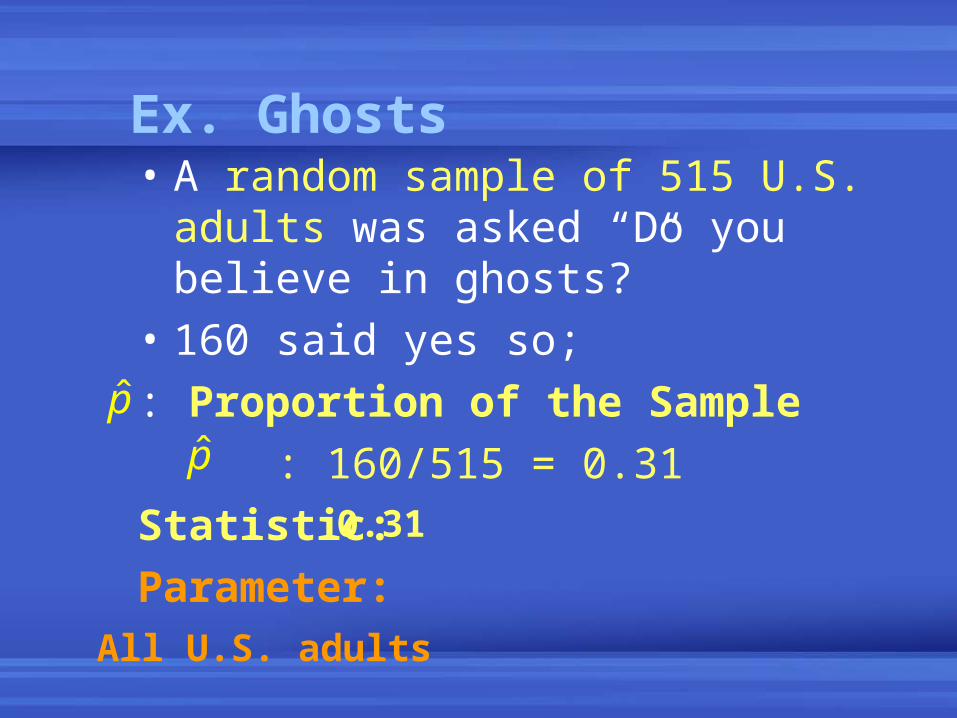
Ex. Ghosts • A random sample of 515 U.S. adults
was asked “Do you believe in ghosts?”
• 160 said yes so;
: Proportion of the Sample
: 160/515 = 0.31
Statistic:
Parameter:
p̂p̂
0.31
All U.S. adults
If I had chosen a different 100 seniors, then I would have a different sample, but it would still represent the same population.
A different sample almost always produces different statistics.
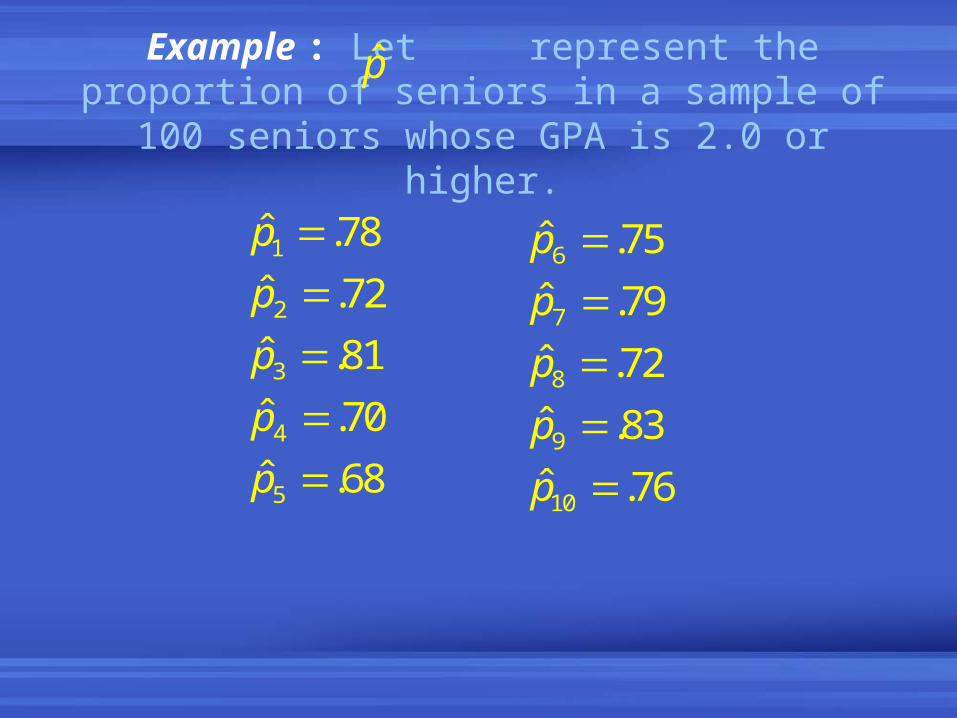
Example : Let represent the proportion of seniors in a sample of 100 seniors whose
GPA is 2.0 or higher.
1
2
3
4
5
ˆ .78
ˆ .72
ˆ .81
ˆ .70
ˆ .68
p
p
p
p
p
6
7
8
9
10
ˆ .75
ˆ .79
ˆ .72
ˆ .83
ˆ .76
p
p
p
p
p
p̂
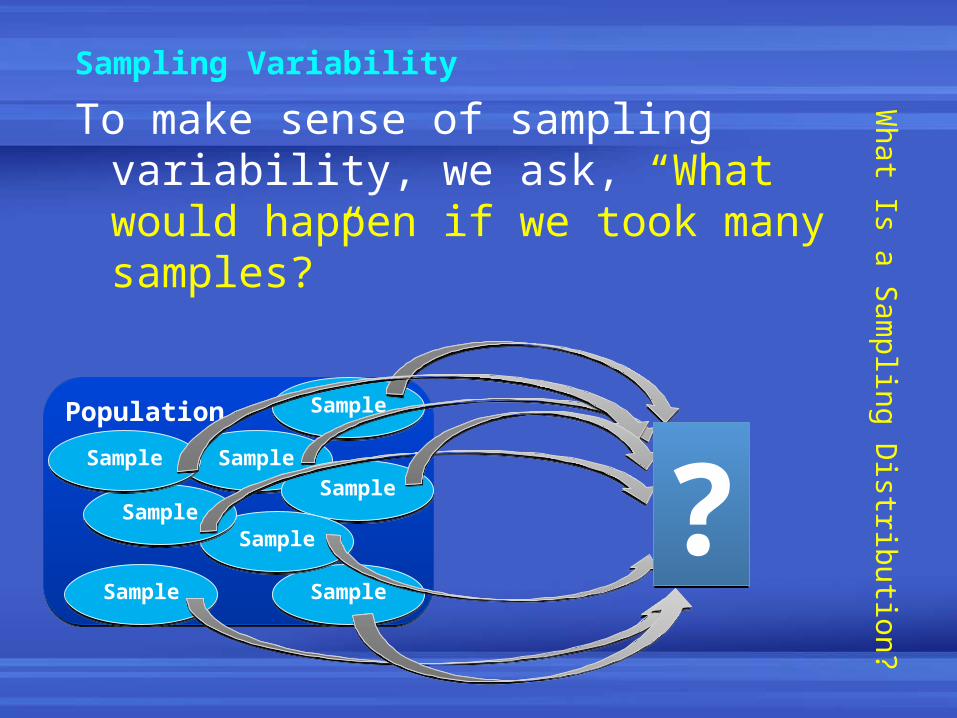
Sampling Variability
To make sense of sampling variability, we ask, “What would happen if we took many samples?”
What Is a
Sam
plin
g D
istributio
n?
PopulationPopulation
SampleSample
SampleSample
SampleSample
SampleSample
SampleSampleSampleSample
SampleSample
SampleSample
??
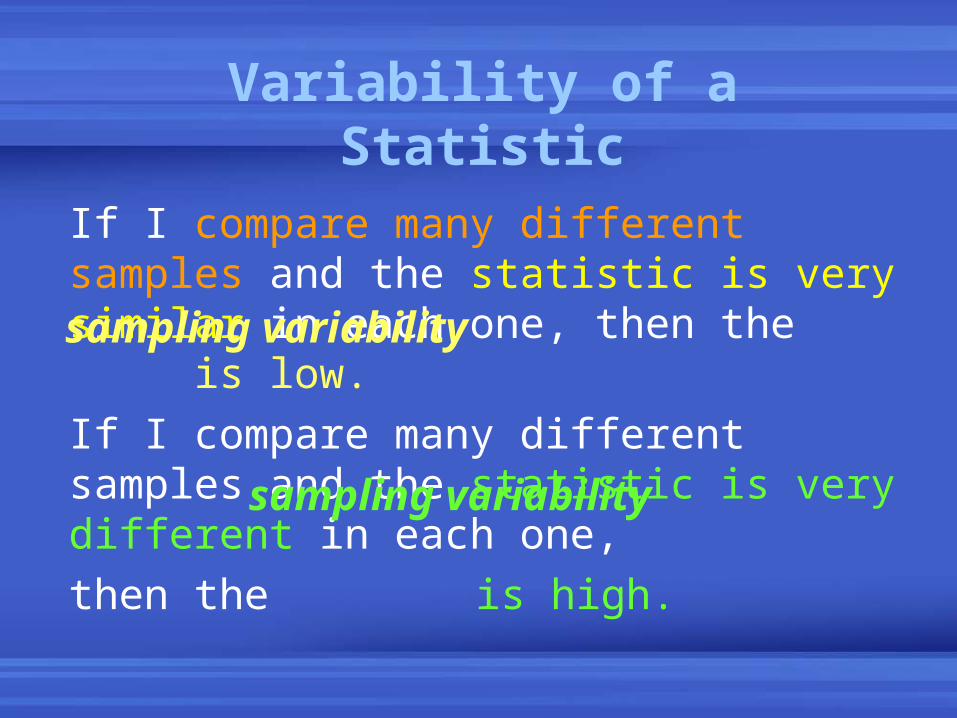
Variability of a Statistic
If I compare many different samples and the statistic is very similar in each one, then the
is low.
If I compare many different samples and the statistic is very different in each one,
then the is high.
sampling variability
sampling variability
The sampling distribution of a statistic is a model of the values of the statistic from all possible samples of the same size from the same population.
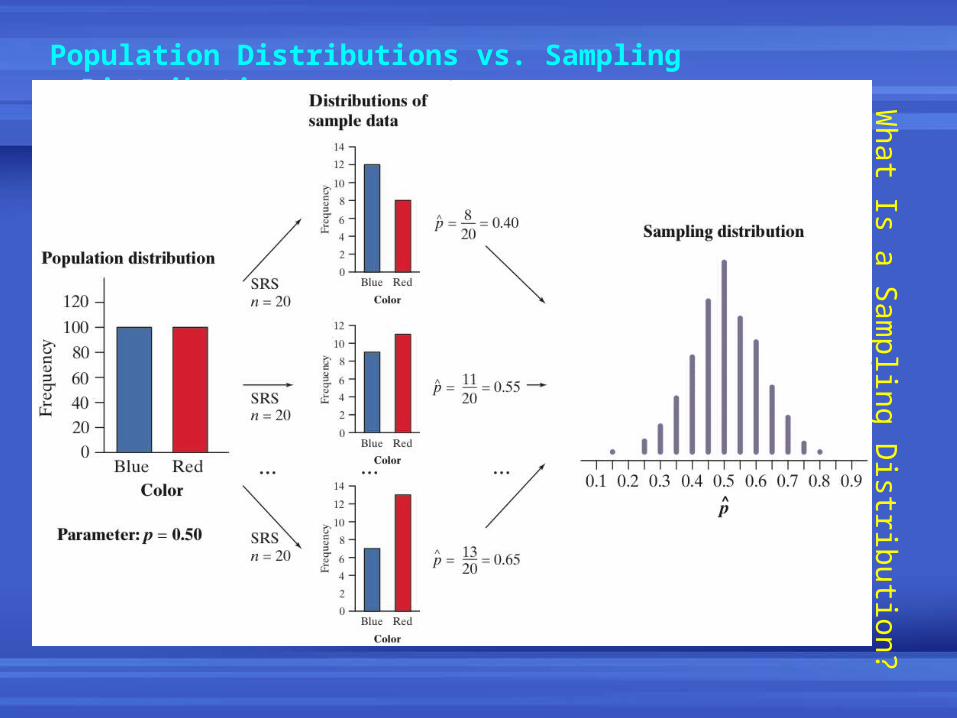
Population Distributions vs. Sampling Distributions
There are actually three distinct distributions involved when we sample repeatedly and measure a variable of interest.
1) The population distribution gives the values of the variable for all the individuals in the population.
2) The distribution of sample data shows the values of the variable for all the individuals in the sample.
3) The sampling distribution shows the statistic values from all the possible samples of the same size from the population.
What Is a
Sam
plin
g D
istributio
n?
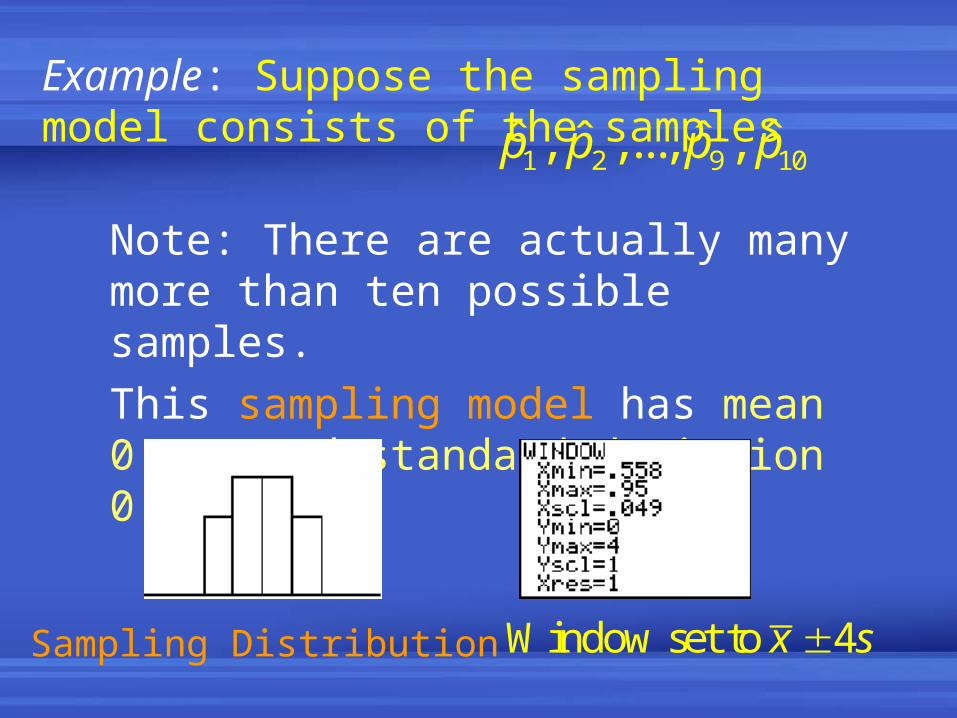
Example: Suppose the sampling model consists of the samples
Note: There are actually many more than ten possible samples.
This sampling model has mean 0.754 and standard deviation 0.049.
1 2 9 10ˆ ˆ ˆ ˆ, ,..., ,p p p p
Sampling Distribution Window set to 4x s
The statistic used to estimate a parameter is if the mean of its sampling distribution is equal to the true value of the parameter being estimated.
unbiased
Example:
Since the mean of the sampling model is 0.754, then is an unbiased estimator of if the true value of ,
(the proportion of all seniors in Anne Arundel County
with a GPA of 2.0 or higher)
equals 0.754.
p̂ pp