Embed Size (px)
Citation preview
+
The Practice of Statistics, 4th edition – For AP*
STARNES, YATES, MOORE
Chapter 7: Sampling Distributions
Section 7.1
What is a Sampling Distribution?
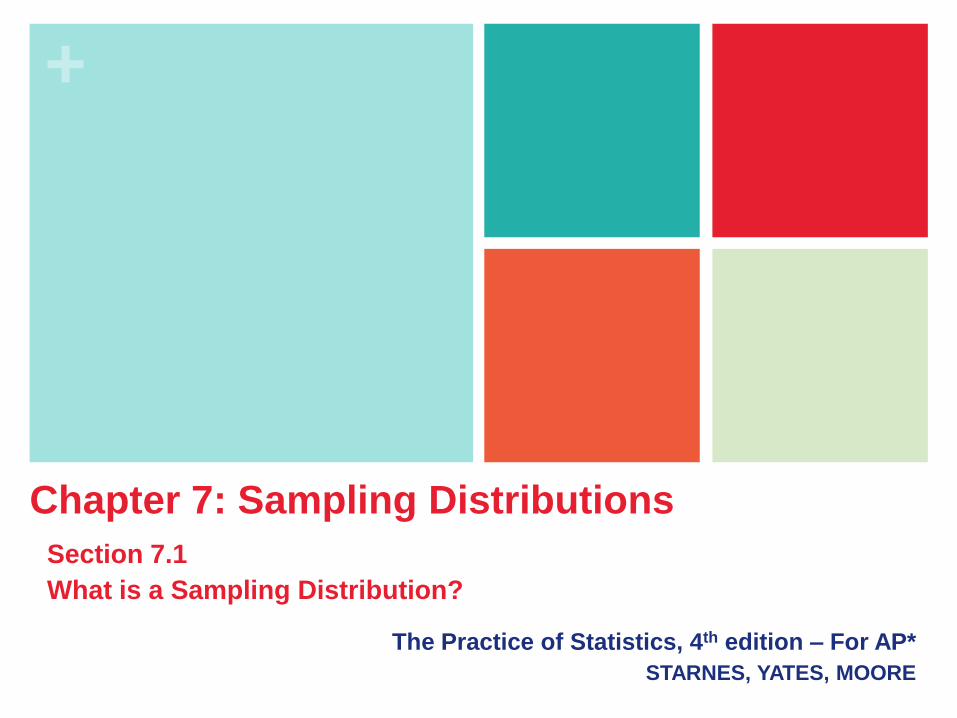
+ Chapter 7
Sampling Distributions
7.1 What is a Sampling Distribution?
7.2 Sample Proportions
7.3 Sample Means
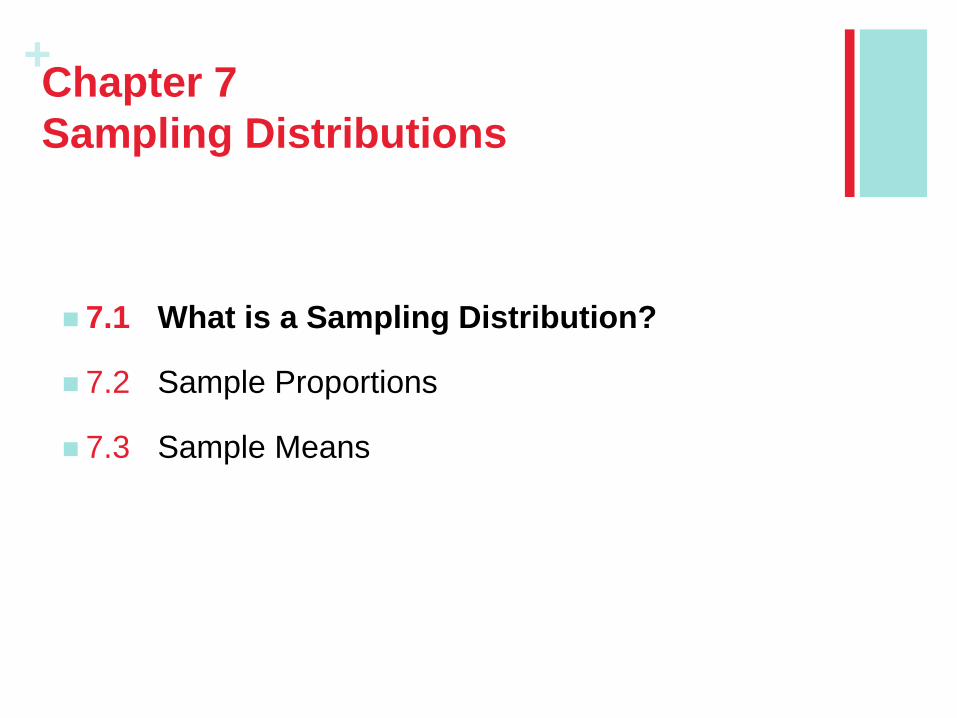
+ Section 7.1
What Is a Sampling Distribution?
After this section, you should be able to…
DISTINGUISH between a parameter and a statistic
DEFINE sampling distribution
DISTINGUISH between population distribution, sampling distribution, and the distribution of sample data
DETERMINE whether a statistic is an unbiased estimator of a population parameter
DESCRIBE the relationship between sample size and the variability of an estimator
Learning Objectives
+
Wha
t Is a
Sa
mplin
g D
istrib
utio
n?
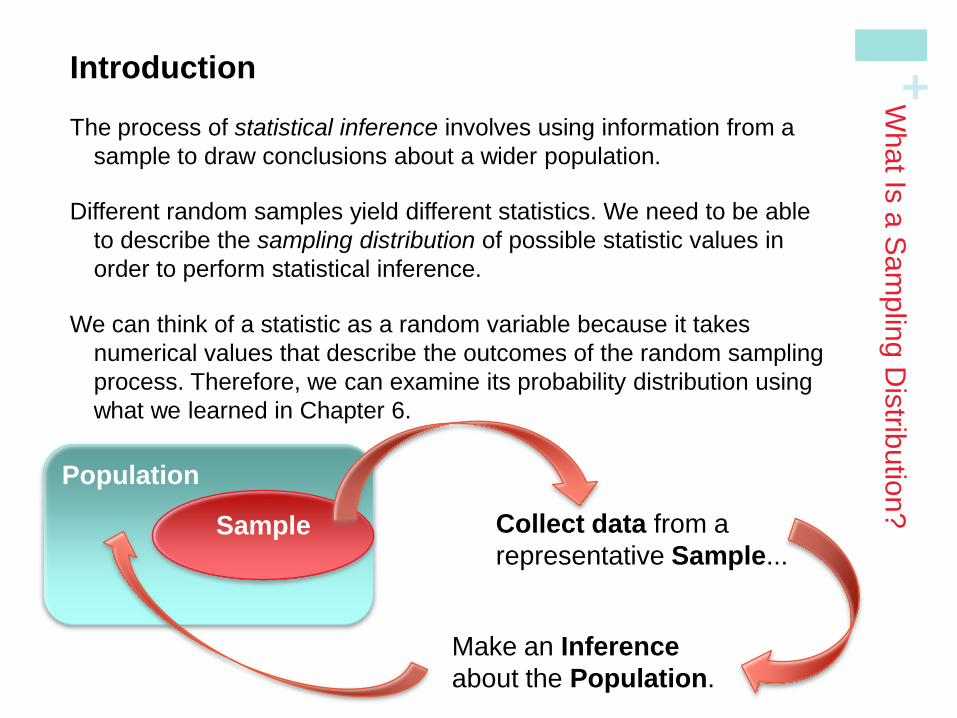
Introduction
The process of statistical inference involves using information from a
sample to draw conclusions about a wider population.
Different random samples yield different statistics. We need to be able
to describe the sampling distribution of possible statistic values in
order to perform statistical inference.
We can think of a statistic as a random variable because it takes
numerical values that describe the outcomes of the random sampling
process. Therefore, we can examine its probability distribution using
what we learned in Chapter 6.
Population
Sample Collect data from a
representative Sample...
Make an Inference
about the Population.
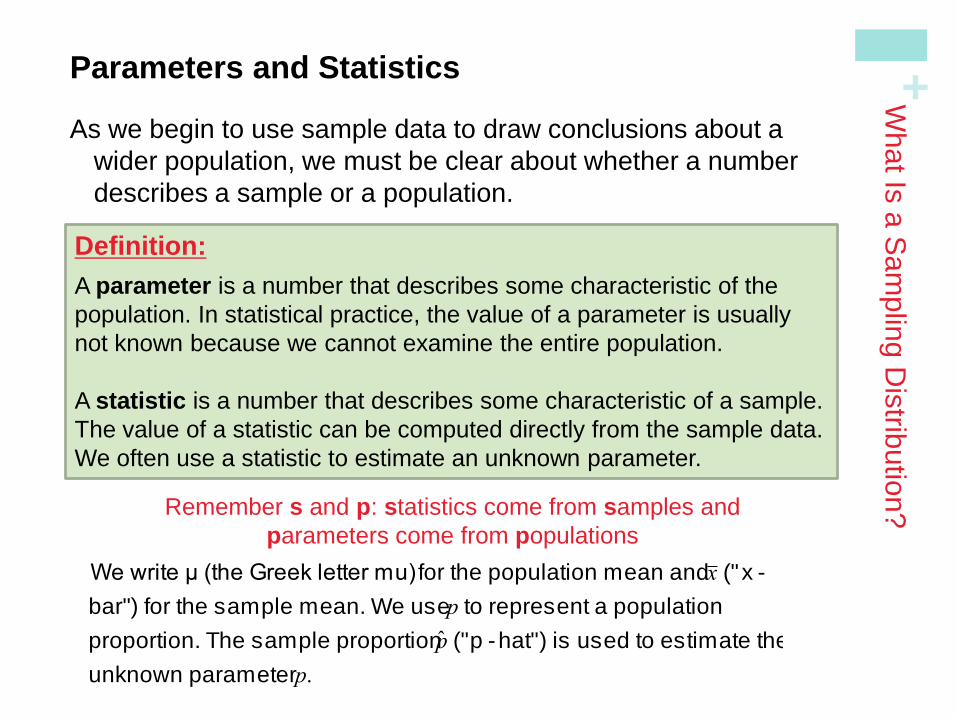
+ Parameters and Statistics
As we begin to use sample data to draw conclusions about a
wider population, we must be clear about whether a number
describes a sample or a population.
Wha
t Is a
Sa
mplin
g D
istrib
utio
n?
Definition:
A parameter is a number that describes some characteristic of the
population. In statistical practice, the value of a parameter is usually
not known because we cannot examine the entire population.
A statistic is a number that describes some characteristic of a sample.
The value of a statistic can be computed directly from the sample data.
We often use a statistic to estimate an unknown parameter.
Remember s and p: statistics come from samples and
parameters come from populations
We write µ (the Greek letter mu) for the population mean and x ("x -
bar") for the sample mean. We use p to represent a population
proportion. The sample proportion ̂ p ("p -hat") is used to estimate the
unknown parameter p.
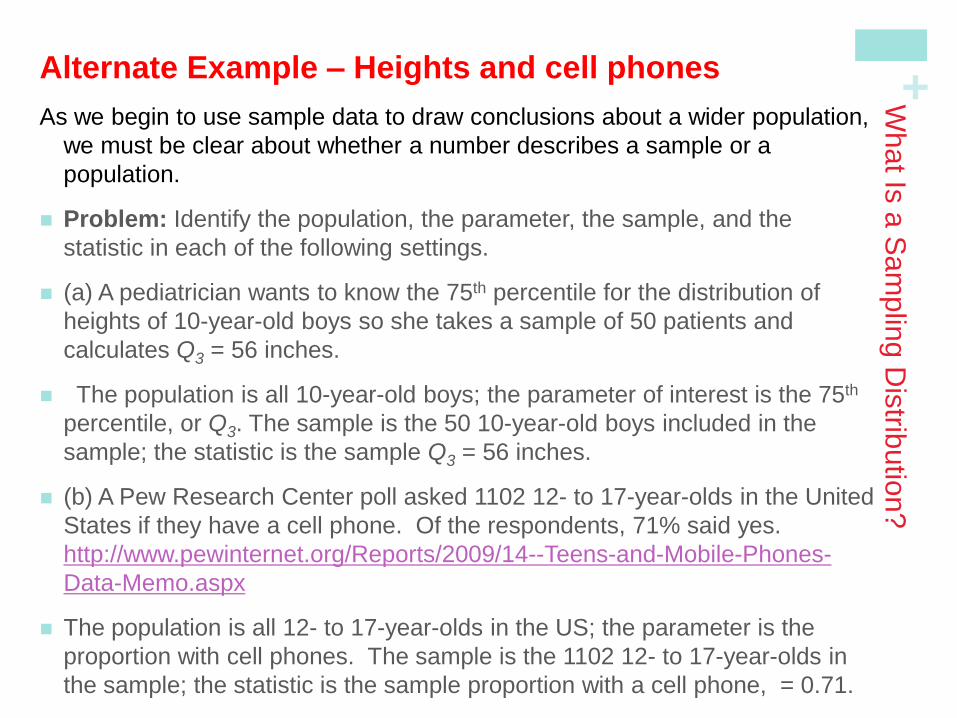
+ Alternate Example – Heights and cell phones
As we begin to use sample data to draw conclusions about a wider population,
we must be clear about whether a number describes a sample or a
population.
Problem: Identify the population, the parameter, the sample, and the
statistic in each of the following settings.
(a) A pediatrician wants to know the 75th percentile for the distribution of
heights of 10-year-old boys so she takes a sample of 50 patients and
calculates Q3 = 56 inches.
The population is all 10-year-old boys; the parameter of interest is the 75th
percentile, or Q3. The sample is the 50 10-year-old boys included in the
sample; the statistic is the sample Q3 = 56 inches.
(b) A Pew Research Center poll asked 1102 12- to 17-year-olds in the United
States if they have a cell phone. Of the respondents, 71% said yes.
http://www.pewinternet.org/Reports/2009/14--Teens-and-Mobile-Phones-
Data-Memo.aspx
The population is all 12- to 17-year-olds in the US; the parameter is the
proportion with cell phones. The sample is the 1102 12- to 17-year-olds in
the sample; the statistic is the sample proportion with a cell phone, = 0.71.
Wha
t Is a
Sa
mplin
g D
istrib
utio
n?
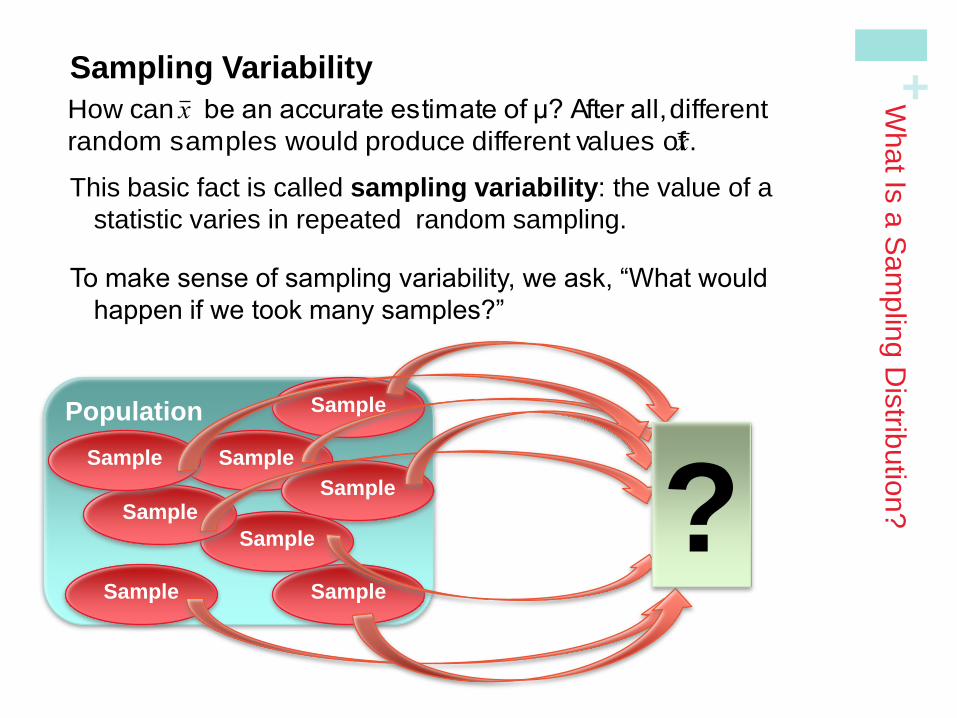
+ Sampling Variability
This basic fact is called sampling variability: the value of a
statistic varies in repeated random sampling.
To make sense of sampling variability, we ask, “What would
happen if we took many samples?”
Wha
t Is a
Sa
mplin
g D
istrib
utio
n?
Population
Sample
Sample
Sample
Sample
Sample
Sample
Sample
Sample
?
How can x be an accurate estimate of µ? After all, different
random samples would produce different values of x .
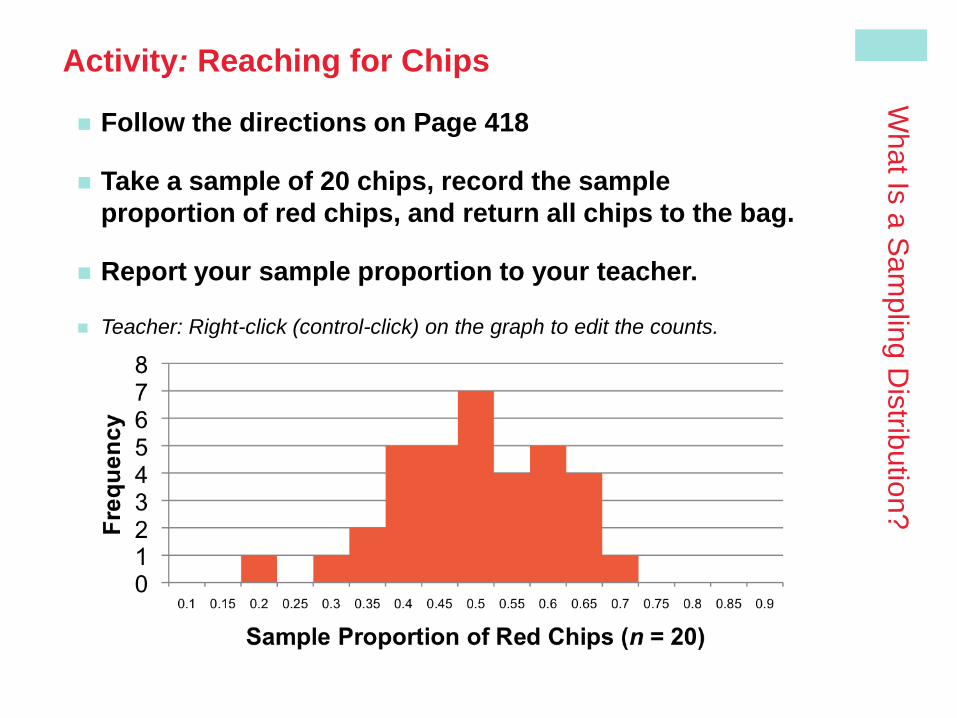
Activity: Reaching for Chips
Follow the directions on Page 418
Take a sample of 20 chips, record the sample
proportion of red chips, and return all chips to the bag.
Report your sample proportion to your teacher.
Teacher: Right-click (control-click) on the graph to edit the counts.
Wha
t Is a
Sa
mplin
g D
istrib
utio
n?
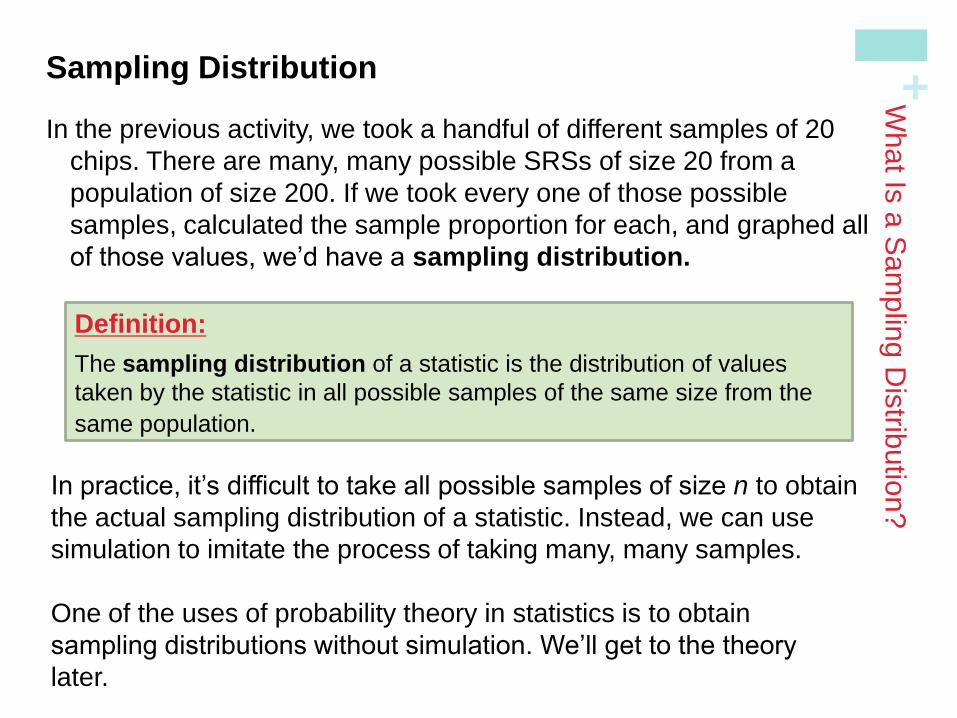
+ Sampling Distribution
In the previous activity, we took a handful of different samples of 20
chips. There are many, many possible SRSs of size 20 from a
population of size 200. If we took every one of those possible
samples, calculated the sample proportion for each, and graphed all
of those values, we’d have a sampling distribution.
Wha
t Is a
Sa
mplin
g D
istrib
utio
n?
Definition:
The sampling distribution of a statistic is the distribution of values
taken by the statistic in all possible samples of the same size from the
same population.
In practice, it’s difficult to take all possible samples of size n to obtain
the actual sampling distribution of a statistic. Instead, we can use
simulation to imitate the process of taking many, many samples.
One of the uses of probability theory in statistics is to obtain
sampling distributions without simulation. We’ll get to the theory
later.
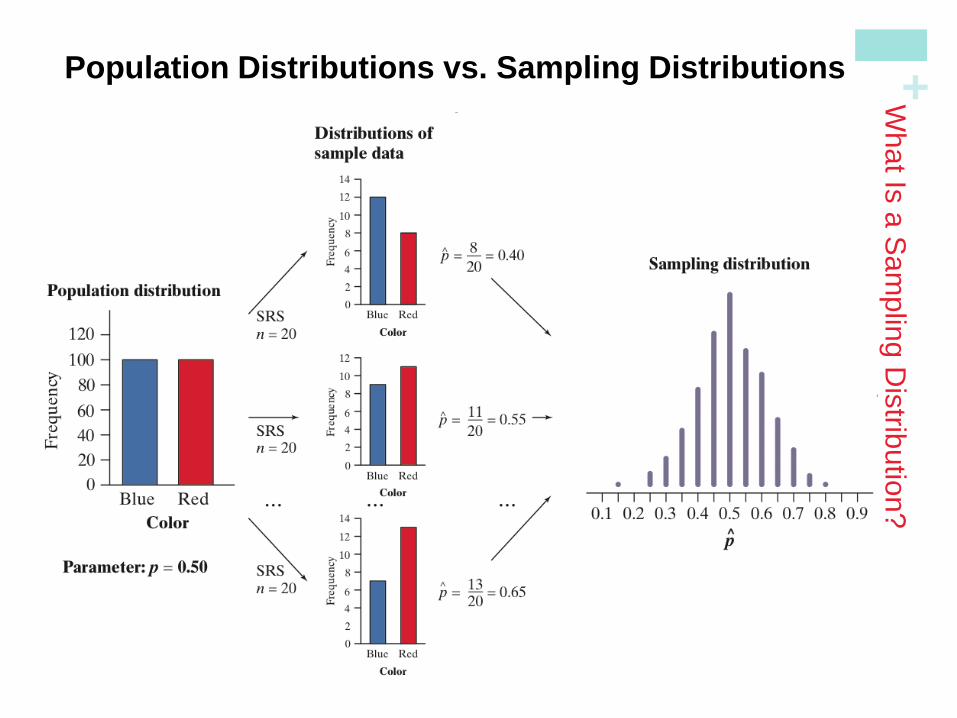
+ Population Distributions vs. Sampling Distributions
There are actually three distinct distributions involved
when we sample repeatedly and measure a variable of
interest.
1)The population distribution gives the values of the
variable for all the individuals in the population.
2)The distribution of sample data shows the values of
the variable for all the individuals in the sample.
3)The sampling distribution shows the statistic values
from all the possible samples of the same size from the
population.
Wha
t Is a
Sa
mplin
g D
istrib
utio
n?
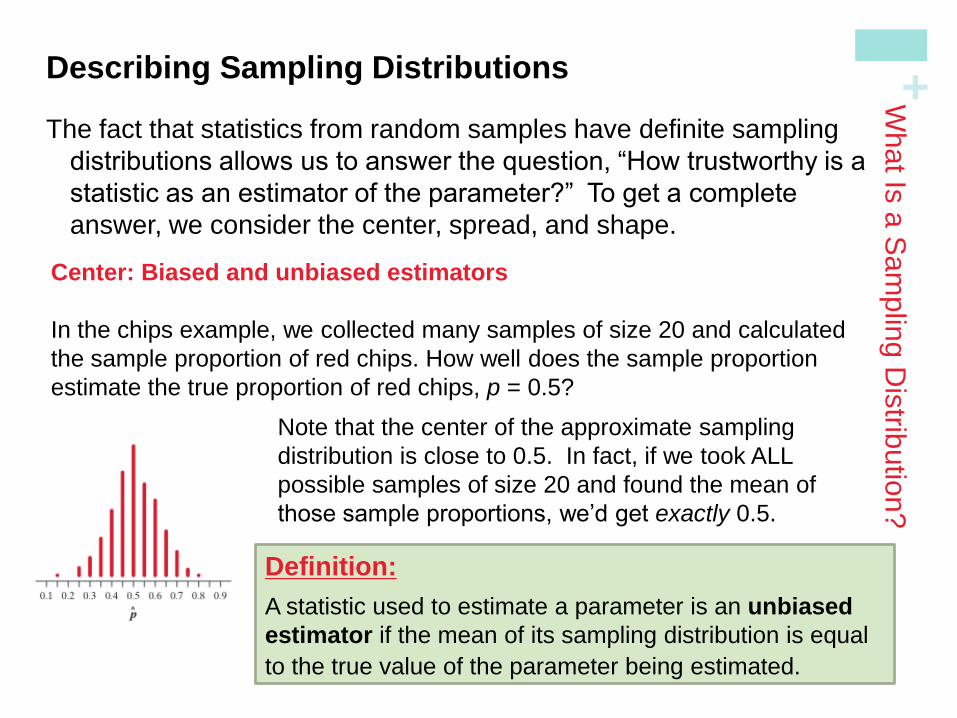
+ Describing Sampling Distributions
The fact that statistics from random samples have definite sampling
distributions allows us to answer the question, “How trustworthy is a
statistic as an estimator of the parameter?” To get a complete
answer, we consider the center, spread, and shape.
Wha
t Is a
Sa
mplin
g D
istrib
utio
n?
Definition:
A statistic used to estimate a parameter is an unbiased
estimator if the mean of its sampling distribution is equal
to the true value of the parameter being estimated.
Center: Biased and unbiased estimators
In the chips example, we collected many samples of size 20 and calculated
the sample proportion of red chips. How well does the sample proportion
estimate the true proportion of red chips, p = 0.5?
Note that the center of the approximate sampling
distribution is close to 0.5. In fact, if we took ALL
possible samples of size 20 and found the mean of
those sample proportions, we’d get exactly 0.5.
+ Describing Sampling Distributions
Wha
t Is a
Sa
mplin
g D
istrib
utio
n?
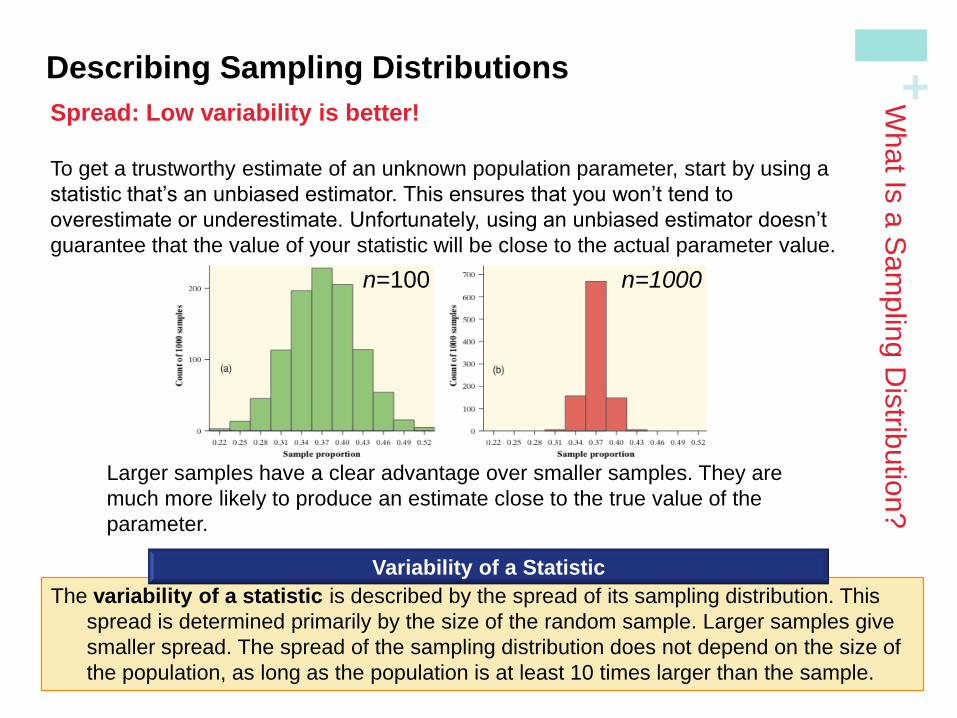
Spread: Low variability is better!
To get a trustworthy estimate of an unknown population parameter, start by using a
statistic that’s an unbiased estimator. This ensures that you won’t tend to
overestimate or underestimate. Unfortunately, using an unbiased estimator doesn’t
guarantee that the value of your statistic will be close to the actual parameter value.
Larger samples have a clear advantage over smaller samples. They are
much more likely to produce an estimate close to the true value of the
parameter.
The variability of a statistic is described by the spread of its sampling distribution. This
spread is determined primarily by the size of the random sample. Larger samples give
smaller spread. The spread of the sampling distribution does not depend on the size of
the population, as long as the population is at least 10 times larger than the sample.
Variability of a Statistic
n=100 n=1000
+ Alternate Example – Sampling Heights
Wha
t Is a
Sa
mplin
g D
istrib
utio
n?
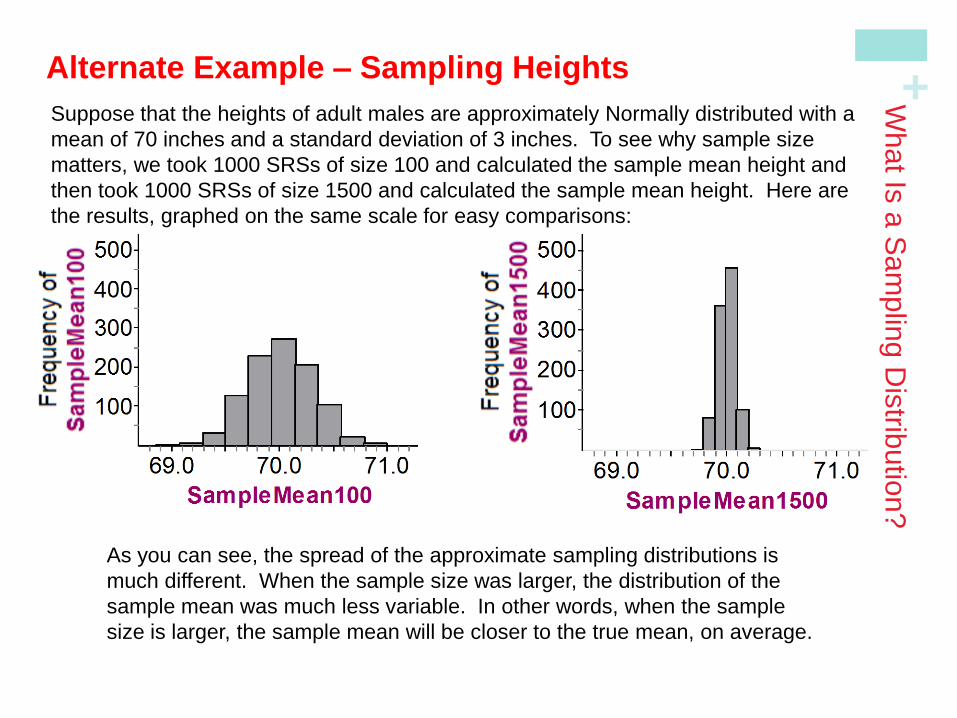
Suppose that the heights of adult males are approximately Normally distributed with a
mean of 70 inches and a standard deviation of 3 inches. To see why sample size
matters, we took 1000 SRSs of size 100 and calculated the sample mean height and
then took 1000 SRSs of size 1500 and calculated the sample mean height. Here are
the results, graphed on the same scale for easy comparisons:
As you can see, the spread of the approximate sampling distributions is
much different. When the sample size was larger, the distribution of the
sample mean was much less variable. In other words, when the sample
size is larger, the sample mean will be closer to the true mean, on average.
+ Describing Sampling Distributions
Wha
t Is a
Sa
mplin
g D
istrib
utio
n?
Bias, variability, and shape
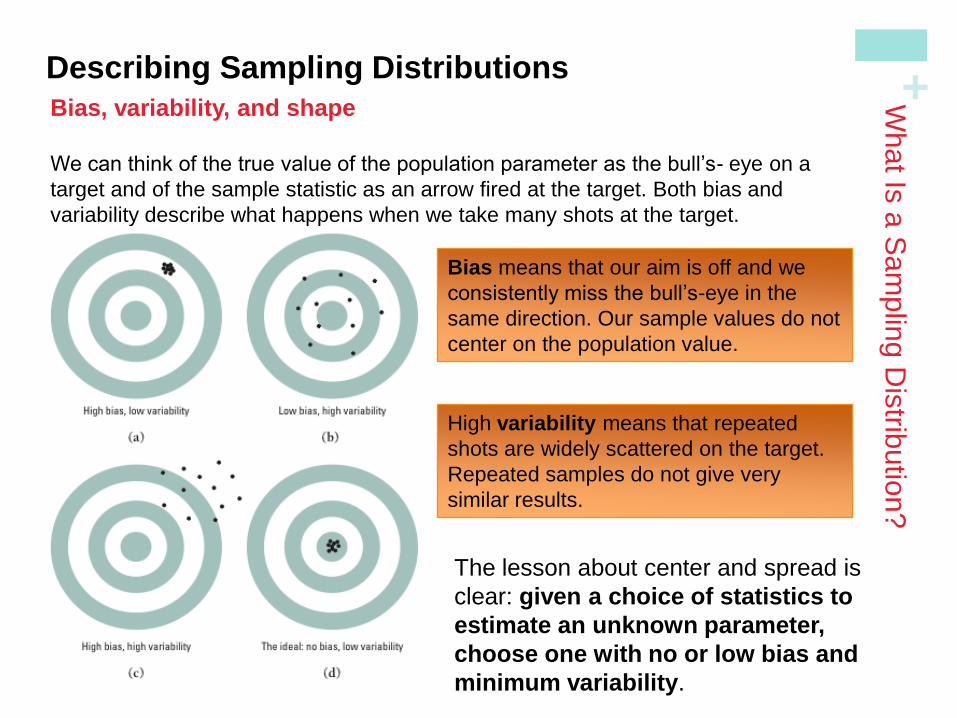
We can think of the true value of the population parameter as the bull’s- eye on a
target and of the sample statistic as an arrow fired at the target. Both bias and
variability describe what happens when we take many shots at the target.
Bias means that our aim is off and we
consistently miss the bull’s-eye in the
same direction. Our sample values do not
center on the population value.
High variability means that repeated
shots are widely scattered on the target.
Repeated samples do not give very
similar results.
The lesson about center and spread is
clear: given a choice of statistics to
estimate an unknown parameter,
choose one with no or low bias and
minimum variability.
+ Describing Sampling Distributions
Wha
t Is a
Sa
mplin
g D
istrib
utio
n?
Bias, variability, and shape
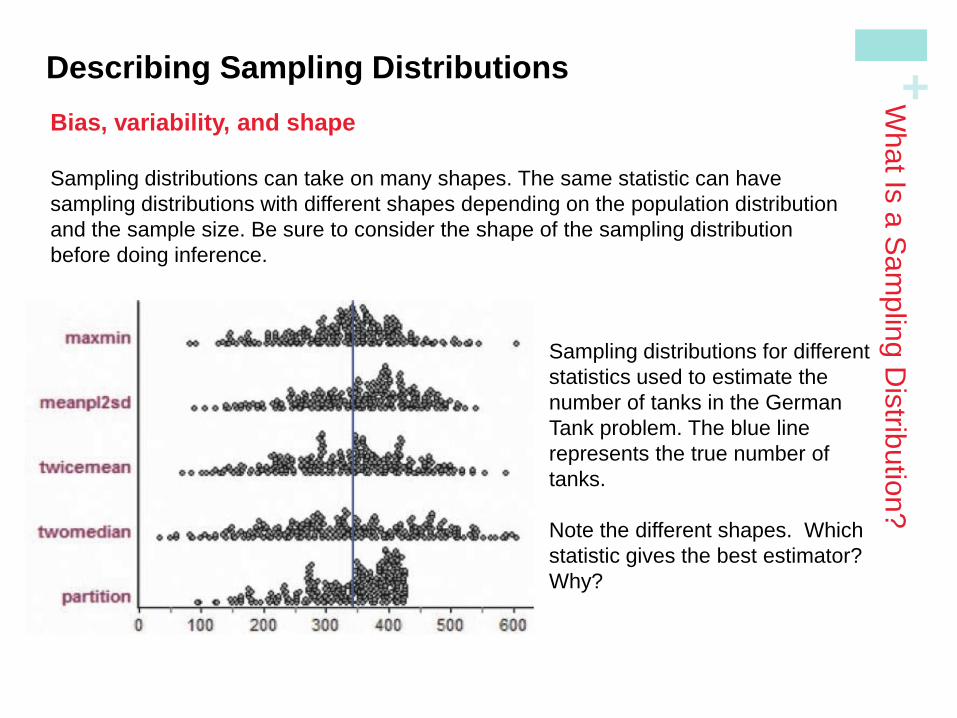
Sampling distributions can take on many shapes. The same statistic can have
sampling distributions with different shapes depending on the population distribution
and the sample size. Be sure to consider the shape of the sampling distribution
before doing inference.
Sampling distributions for different
statistics used to estimate the
number of tanks in the German
Tank problem. The blue line
represents the true number of
tanks.
Note the different shapes. Which
statistic gives the best estimator?
Why?
+
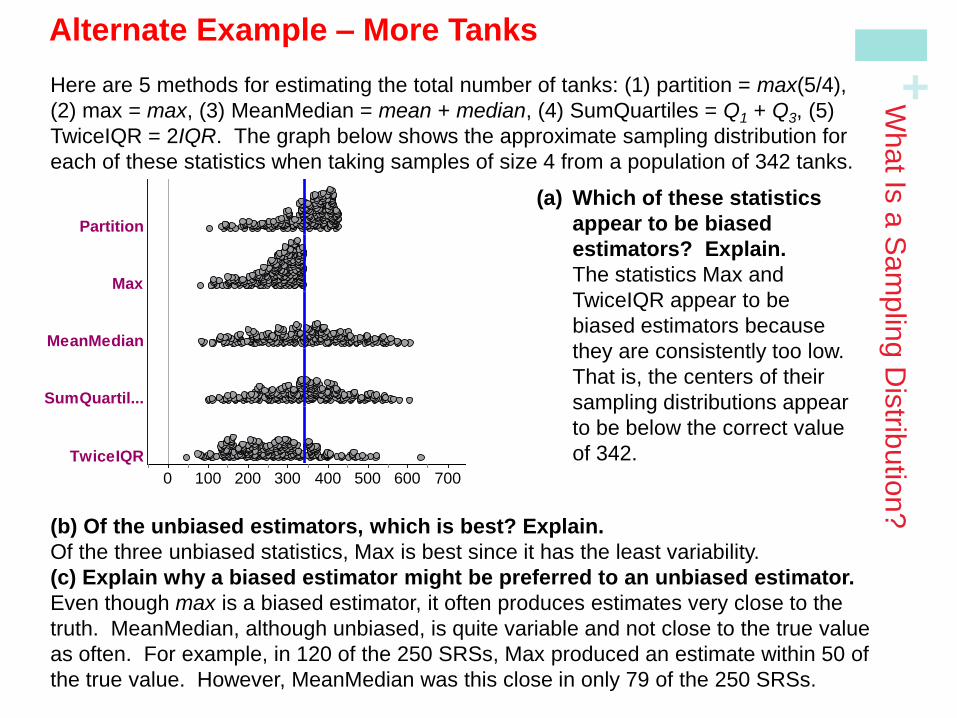
Alternate Example – More Tanks W
ha
t Is a
Sa
mplin
g D
istrib
utio
n?
Here are 5 methods for estimating the total number of tanks: (1) partition = max(5/4),
(2) max = max, (3) MeanMedian = mean + median, (4) SumQuartiles = Q1 + Q3, (5)
TwiceIQR = 2IQR. The graph below shows the approximate sampling distribution for
each of these statistics when taking samples of size 4 from a population of 342 tanks.
(a) Which of these statistics
appear to be biased
estimators? Explain.
The statistics Max and
TwiceIQR appear to be
biased estimators because
they are consistently too low.
That is, the centers of their
sampling distributions appear
to be below the correct value
of 342.
Partition
Max
MeanMedian
SumQuartil...
TwiceIQR
0 100 200 300 400 500 600 700
= 342
Measures from Sample of Collection 1 Dot Plot
(b) Of the unbiased estimators, which is best? Explain.
Of the three unbiased statistics, Max is best since it has the least variability.
(c) Explain why a biased estimator might be preferred to an unbiased estimator.
Even though max is a biased estimator, it often produces estimates very close to the
truth. MeanMedian, although unbiased, is quite variable and not close to the true value
as often. For example, in 120 of the 250 SRSs, Max produced an estimate within 50 of
the true value. However, MeanMedian was this close in only 79 of the 250 SRSs.
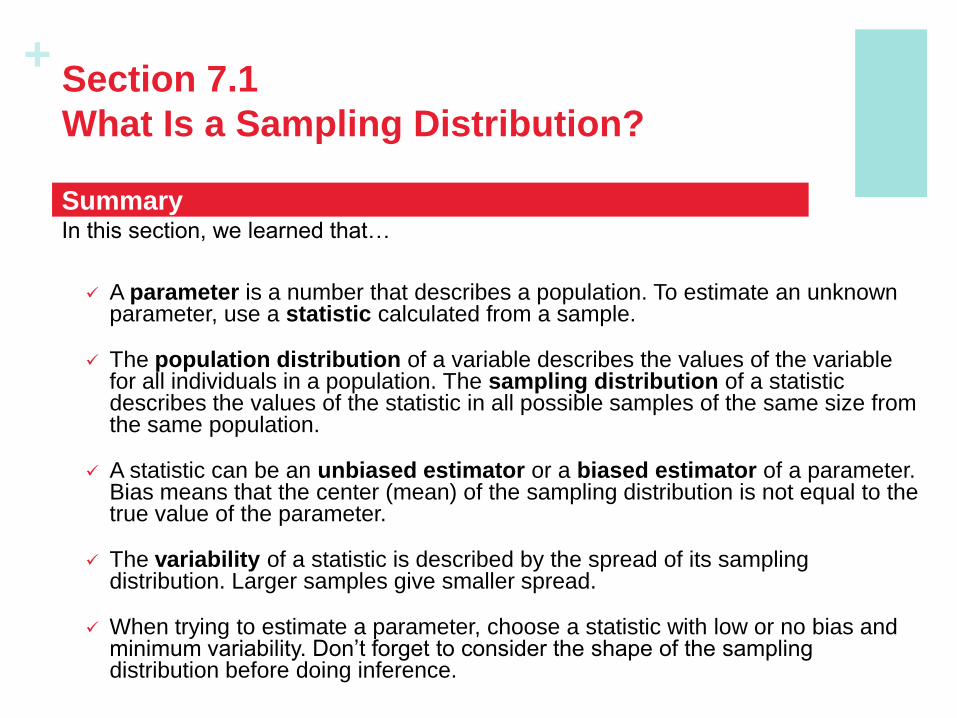
+ Section 7.1
What Is a Sampling Distribution?
In this section, we learned that…
A parameter is a number that describes a population. To estimate an unknown parameter, use a statistic calculated from a sample.
The population distribution of a variable describes the values of the variable for all individuals in a population. The sampling distribution of a statistic describes the values of the statistic in all possible samples of the same size from the same population.
A statistic can be an unbiased estimator or a biased estimator of a parameter. Bias means that the center (mean) of the sampling distribution is not equal to the true value of the parameter.
The variability of a statistic is described by the spread of its sampling distribution. Larger samples give smaller spread.
When trying to estimate a parameter, choose a statistic with low or no bias and minimum variability. Don’t forget to consider the shape of the sampling distribution before doing inference.
Summary
+ Looking Ahead…
We’ll learn how to describe and use the sampling
distribution of sample proportions.
We’ll learn about
The sampling distribution of Using the Normal approximation for
In the next Section…
ˆ p
ˆ p