Embed Size (px)
Citation preview

Right to Education – Period: April 2000 – March 2002
235
CHAPTER 7
RIGHT TO EDUCATION 1. INTRODUCTION
Education is both a human right in itself and an indispensable means of realising other human rights. As an empowerment right, education is the primary vehicle by which economically and socially marginalised adults and children can lift themselves out of poverty and obtain the means to participate fully in their communities. Education has a vital role in empowering women, safeguarding children from exploitative and hazardous labour and sexual exploitation, promoting human rights and democracy, protecting the environment, and controlling population growth. Increasingly, education is recognised as one of the best financial investments States can make. But the importance of education is not just practical: a well-educated, enlightened and active mind, able to range freely and widely, is one of the joys and rewards of human existence.1
In order to fully recognise the right to education, and to promote interdependence in human rights, the right to education must be prioritised both with a conception of rights in education, and with an understanding of the relationship between the right to education and other human rights. The right to education does not exist in a vacuum, but is intrinsically related to other widely recognised human rights. Realisation of the right to education facilitates the realisation of other human rights, and vice versa.
International perspectives
The 4-A scheme developed by the Special Rapporteur on the right to education from existing international standards provides a working model for monitoring and assessing the right to education1. According to this model, education must be available, accessible, acceptable and adaptable.
While the precise and appropriate application of these terms will depend upon the prevailing conditions in a particular state party, the overriding aim should be to achieve fundamental education. Fundamental education includes the elements of availability, accessibility, acceptability and adaptability, which are common to education in all its forms (formal or informal) and at all levels (primary, secondary, technical and vocational or tertiary).2
According to the Committee on Economic, Social and Cultural Rights, the right to education is available when functioning educational institutions and programmes are in sufficient quantity within the jurisdiction of the State party. What they require to
1 The Committee on Economic, Social and Cultural Rights - General Comment No. 13 (Twenty-first session, 1999): Article 13: The Right to Education, E/2000/22 (1999) 111 at para. 1. 2 Ibid para 21.

Right to Education – Period: April 2000 – March 2002
236
function depends upon numerous factors, including the developmental context within which they operate; for example, all institutions and programmes are likely to require buildings or other protection from the elements, sanitation facilities for both sexes, safe drinking water, trained teachers receiving domestically competitive salaries, teaching materials, and so on; while some will also require facilities such as a library, computer facilities and information technology.
It is[accessible]when educational institutions and programmes are within reach for everyone, without discrimination, within the jurisdiction of the State party. Accessibility has three overlapping dimensions: (i) non-discrimination: education must be accessible to all, especially the most vulnerable groups, in law and in fact, without discrimination on any of the prohibited grounds; (ii) physical accessibility - education has to be within safe physical reach, either by attendance at some reasonably convenient geographic location (e.g. a neighbourhood school) or via modern technology (e.g. access to a “distance learning” programme); and (iii) economic accessibility - education has to be affordable to all. Whereas primary education shall be available "free to all", States parties are required to progressively introduce free secondary and higher education.3
Education is [cceptable] when the form and substance of education, including curricula and teaching methods are relevant, culturally appropriate and of good quality to students and, in appropriate cases, parents; and it is [adaptable] when it is flexible so it can meet the needs of changing societies and communities and respond to the needs of students within their diverse social and cultural settings.
National Legislation
The basic domestic text guaranteeing the right to education is the Constitution. In terms of section 29 (1)(a) everyone has the right to a basic education, including adult basic education; and to further education4, which the State, through reasonable measures, must make progressively available and accessible. Other domestic legislation promulgated to give effect to the right to education guaranteed in the Constitution include, the South African Schools Act 84 of 1996, the Employment of Educators Act, 76 of 1998, the Further Education and Training Act, 98 of 1998, the Higher Education Amendment Act 55 of 1999 and the South African Council for Educators Act 31, of 2000. Apart from the key policy and legislative measures, relevant rules and regulations have been adopted by both national and provincial governments aimed at ensuring the effective realisation of the right to education. These include the Regulations on the Admission of Learners to Public Schools, National Norms and Standards for School Funding Policy, etc.
Domestic and International Standards compared
3 The Committee on Economic, Social and Cultural Rights-General Comment No. 13, op. cit., para 6. 4 Section 29 (1) (b)

Right to Education – Period: April 2000 – March 2002
237
South Africa adheres to a number of international human rights instruments and Declarations that guarantee the right to education, notable among them, the World Declaration on Education for All, the Vienna Declaration and Programme of Action; the Plan of Action of the United Nations Decade for Human Rights Education; the Universal Declaration of Human Rights, the Convention on the Rights of the Child; the African Charter on Human and Peoples’ Rights; the African Charter on the Rights and Welfare of the Child, etc.
These instruments provide for the progressive realisation of the right to education and require that the basic aims and objectives of education must be upheld. The Committee on Economic, Social and Cultural Rights argues that all education, whether public or private, formal or non-formal, shall be directed towards the aims and objectives identified in article 13, paragraph 1.4 The Committee notes that education shall be directed to the human personality's "sense of dignity", it shall "enable all persons to participate effectively in a free society", and it shall promote understanding among all ethnic groups, as well as nations, racial and religious groups and "… be directed to the full development of the human personality".
This chapter assesses the measures taken by the state between 1st April 2000 and 31st March 2002 towards the progressive realisation of the right to education. Amongst other things, it considers the implementation of the General Education and Training (GET),5 Further Education and Training (FET)6 and Higher Education and Training bands (HET).7 It is important that government8 policy and programmatic measures and legislation comply with section 7(2) of the Constitution.9 4 Ibid, para 4 5 This band starts from the Reception Year to Grade Nine. It is in this band that compulsory education applies. 6 The Further Education and Training (FET) band consists of all education and training from the National Qualifications Framework (NQF) levels Two to Four, or the equivalent of grades 10 to 12 in the schooling system and National Technical Certificate One to Three in Technical Colleges. Learners enter FET after the completion of the compulsory phase of education at Grade Nine or via the Adult Basic Education and Training route. 7 The Higher Education and Training (HET) band includes university and technikon education. 8 Note that the HET band is the competence of the national sphere of government only – the National Department of Education (NDE). 9 This section provides that the state must respect, protect, promote and fulfil the rights in the Bill of Rights – the right to education being one of them. Each of the constitutional obligations is defined below. The definitions of all the four constitutional obligations are those of the Centre for Human Rights (Pretoria university): The duty to respect prohibits the state from acting in ways that will:
• arbitrarily deprive people of their right to education – for example, the closing down of school without justification;
• deny or obstruct the right to education – for example a law providing that all persons who are unable to pay school fees, will be denied the right to basic education; and
• unfairly discriminate – for example a law providing that girls and women are not to receive education.
The duty to protect implies that the state must protect people against invasion by the private sector. This would call for the state to protect individuals from discrimination in private educational institutions. It would also mean that the state would have to protect individuals from interference by individuals or by private companies in the exercise of their right to education. For example the state would have to protect children from work, which would interfere with their right to education.

Right to Education – Period: April 2000 – March 2002
238
2. POLICY AND PROGRAMMATIC MEASURES National Sphere The National Department of Education (NDE) reported that it launched the South African National Literacy Initiative (SANLI) during June 2000. SANLI is a short-term volunteer-assisted initiative aimed at eradicating illiteracy in the country. The NDE further reported that national Cabinet approved the following White Papers:
• White Paper on Early Childhood Development (ECD) (May 2001) • White Paper on Inclusion of Children with Special Needs (July 2001)
The White Paper on ECD calls for the universal expansion of learning opportunities within the ten years of compulsory GET. The White Paper on Inclusion of Children with Special Education Needs provides for the inclusion of children with special needs to be mainstreamed and supported in public ordinary schools. Provincial Sphere Various provincial education departments (PEDs) instituted measures that intended to address problems or challenges that are only peculiar to each of them. The Eastern Cape Department of Education (ECDE), Free State Department of Education (FSDE), Gauteng Department of Education (GDE), KwaZulu-Natal Department of Education and Culture (KZNDEC), Mpumalanga Department of Education (MDE), Northern Cape Department of Education (NCDE), and the Western Cape Department of Education (WCDE) reported on the White Papers on ECD and Inclusion of Children with Special Needs. The FSDE instituted the following programmes and /or projects during the reporting period:
• Guidelines on Learner Pregnancy • Policy on Injuries to Learners in Public Schools
Guidelines on Learner Pregnancy
The duty to promote requires that the state actively inform people of their right to education and explain how they can gain access to this right. This duty is related to the idea of bringing human rights to the people. It would include activities such as workshops, seminars, and publications in the written media and other medium, such as radio and television. The duty to fulfil places an obligation on the state to take measures in order to advance the right to education. The state must take legislative and other measures in order to realize the right to education. Other measures, considered to be appropriate by the Committee on Economic, Social, Cultural and Economic Rights are – administrative, financial, educational and social measures. Under international law, the duty to fulfil imposes obligations namely the obligation to facilitate and the obligation to provide. According to Comment No. 13 this would require that the state take positive measures that enable and assist individuals and communities to enjoy the right to education and also to provide them with the right to education.

Right to Education – Period: April 2000 – March 2002
239
The objective of the Guidelines on Learner Pregnancy is to protect a pregnant learner’s right to education. Policy on Injuries to Learners in Public Schools The objective of the Policy on Injuries to Learners in Public Schools is to protect a learner injured on the school premises and/or during school activities. The policy lays out procedures that have to be followed should a learner be injured in either or both circumstances, as well as types of injuries that qualify for indemnity. The GDE instituted the following measures:
• National Norms and Standards for School Funding Policy • Transforming ECD in Gauteng • Admissions Policy • Local and District Education and Training Councils • Misconduct of Learners at Public Schools and Disciplinary Proceedings
National Norms and Standards for School Funding Policy The aim of the National Norms and Standards for School Funding Policy is to ensure that all learners have access to education irrespective of their socio-economic background, and to set the baseline for equitable funding. Transforming ECD in Gauteng The measure gives effect to the national policy on ECD, and is divided into two categories. The first category provides for the implementation of the Reception Year, Grade R for five-year olds turning six in the year of admission, thereby realising the educational obligation of providing ten years of compulsory general education. The second category provides for the establishment of an ECD Institute to meet the needs of families with children younger than six years. Admissions Policy The aim of the Admissions Policy in Public Schools is to ensure that schools admit all school-going age learners and serves their educational requirements without unfair discrimination of any form. Local and District Education and Training Councils The aim of the Local and District Education Councils is to mobilise communities towards the management of education at local, district and provincial levels. Misconduct of Learners at Public Schools and Disciplinary Proceedings Amongst others, the aim of the Misconduct of Learners at Public Schools and Disciplinary Proceedings (Provincial Notice 2591 of 9 May 2001) is to protect the learner against unfair disciplinary hearings that might lead to the suspension of the learners, thereby denying him/her the right to basic education.

Right to Education – Period: April 2000 – March 2002
240
The KZNDEC reported that in fulfilling the constitutional obligations it undertook the following initiatives with regards to the right to education:
• Provided training to members of School Governing Bodies with respect to each member’s function; and
• Held a series of workshops and developmental sessions to make parents aware of their responsibility to send their children to school; to promote the South African School Act 84 of 1996; and to capacitate the departmental officials so that they are better equipped to serve their communities.
The Limpopo Department of Education (LDE) instituted the following programmes and projects during the reporting period:
• Curriculum Development • Practitioner Development • Institutional Development • Rivoningo Project • Ikhwelo Project
Curriculum Development Programme The aim of the Curriculum Development Programme is to identify the learning areas that could be taught from Adult Basic Education and Training (ABET) levels One to Four. It is also supposed to indicate the role which each operational level should play in the assessment of ABET learners from levels One to Four. Other aims include the review and development of learning programmes and lesson models. Practitioner Development Programme The Practitioner Development Programme aims to create an environment, which could make training possible for all ABET educators and officers to strengthen ABET provisioning. Institutional Development Programme The Institutional Development Programme focuses on all the elements which were not mentioned in the response, but which help establish effective public Adult Learning Centres. These comprise the employment of qualified but unemployed educators, and training of core educators and Centre Governing Bodies. Rivoningo Project The Rivoningo Project is aimed at promoting, through pilot projects, the eight learning areas in the five centres of ABET in the province. It is also aimed at establishing centres of excellence by equipping Centre Managers, educators, and Centre Governing Bodies with appropriate knowledge, skills and attitudes. Ikhwelo Project

Right to Education – Period: April 2000 – March 2002
241
Ikhwelo Project piloted the ABET electives component of the curriculum. The focus of the elective project was on Agriculture and Small Medium and Micro-Enterprises (SMMEs). The MDE reported on the following programmes/projects:
• Canada South Africa Teacher Development Programme (CSATDP) • The USA Peace Corps Volunteers
Canada South Africa Teacher Development Programme CSATDP is aimed at training teachers to handle learners with disabilities, advocating education for all, promoting awareness of and knowledge about HIV/AIDS, and sensitising everyone about gender-related issues. The NCDE reported that it instituted the Revised National Curriculum Statement for Grades R to 9 and the National Policy on Whole-School Evaluation. National Curriculum Statement for Grades R to 9 The National Curriculum Statement for Grades R to 9 formulates curriculum requirements at various levels and phases in clear and simple language. It also contains an overview of the background; principles; process; key elements of the eight Learning Area Statements; guidelines for the development of Learning Programmes and related qualification framework and implementation plan. National Policy on Whole-School Evaluation The aim of the National Policy on Whole-School Evaluation is to introduce an effective monitoring and evaluation process that is vital for the improvement of quality and standards of performance in schools. The policy is also aimed at improving the overall quality of education in South African Schools. It seeks to ensure that all children are given equal opportunity to make the best use of their capabilities. The adopted model is said to be radically different from the inspection system previously practised in South Africa. Together with the accompanying guidelines, this policy prescribes an approach that is built upon interactive and transparent processes. These processes include school self-evaluation, ongoing District-based support, monitoring and development and external evaluations conducted by the supervisory units. The North West Department of Education (NWDE) reported that it implemented SANLI.

Right to Education – Period: April 2000 – March 2002
242
The Western Cape Department of Education (WCDE) reported that it instituted the following programmes and/or projects:
• Conditional Grant Programme • Integrated Land Services Project • Values in Education
Conditional Grant Programme The programme attempts to prepare learners from marginalised and impoverished areas for normal school (Grade One). The programme reached 155 learning sites with an average number of 30 learners. Integrated Land Services Project The project is aimed at training women in charge of community schools in bookkeeping and management skills. The trainees are currently being integrated into a training programme developing their capacity to offer quality pre-school learning programmes. Values in Education Initiative The initiative promotes the internalisation by learners of ten fundamental values enshrined in the Constitution via the education system. 3. LEGISLATIVE MEASURES National Sphere According to the NDE, there were no legislative developments that took place during the reporting period. Provincial Sphere The FSDE reported that the following legislative and related measures took place during the reporting period:10
• Measures on Financial Records, Statements and Public Schools Funds • Regulations on Examination Irregularities and Disciplinary Action • Regulations on Discipline of Learners at Public Schools • Regulations on Examination Board • Regulations on Merger of Public Schools • Regulations on Provincial Education and Training Council
The GDE reported that it developed Regulations for the Admission of Learners to Public Schools. Like the NWDE, the LDE11 reported that the Adult Basic Education Act 52, 200012 and Government Gazette No. 2308713 were promulgated.
10 It was not explained how each of these fulfils the right to education.

Right to Education – Period: April 2000 – March 2002
243
4. BUDGETARY MEASURES14 National Sphere Table 1 National Department of Education’s Budget Allocation
Year Total allocation in Rand(s)
Allocation as % of GDP
Projected expenditure
Actual expenditure
2000/2001 7 449 464 000 0,84 - 7 329 024 000 2001/2002 7 924 560 000 0,82 - 7 806 951 000
The dash (-) in all the tables denotes that the information requested was not made available to the Commission. Accounting for variance between the financial years The NDE did not provide a relevant response in this section. The response it provided was more on under-expenditure rather than on the variances in budget allocation between the financial years. The following are some of the responses it provided to the question:
• A delay in the mechanisms that had to be put in place to deliver the services in the provinces with regard to the Ikhwelo Project coupled with incapacity which also delayed the implementation of the project and
• Tenders not meeting the requirements on the training of practitioners, management structures and the advocacy campaign for the ECD Project.
Budget Adequacy The NDE indicated that the budget was inadequate since there were new initiatives for which more funds were required. These include Curriculum 2005, the publication of new curriculum statements, and the implementation of the whole school evaluation policy, all of which received donor funding. The NDE overspent, however, with the deviation remaining within the two percent prescribed by the National Treasury.
11 The LDE only listed the Regulations for the Provincial Board for FET but did not say exactly how these meet the constitutional obligations. 12 The Act lays the foundation for the establishment of Center Governing Bodies and their composition, merger and closure of Public Adult Learning Centers, the registration of Private Adult Learning Centers. Further, the Act makes room for the drawing of norms and standards for funding of both Public and Private Adult Learning Centers. Lastly, it provides for the establishment of the National Advisory Board for ABET (NABABET). 13 The Government Gazette is a legislative development that calls nominations for members of NABABET as per the ABET Act referred to above. 14 This section focuses on the budget allocations for the following programmes at the national level of the Education Department:
• ECD Programme • Primary School Nutrition Programme • Education About HIV/AIDS • Education for Learners with Special Educational Needs (ELSEN)
Right to Education – Period: April 2000 – March 2002
244
Table 2 Total Budget Allocations for the ECD Programme Year Total allocation
in Rand(s) Allocation as % of the department’s total revenue
Projected expenditure
Actual expenditure
2000/2001 2 256 000 0,03 - 1 177 000 2001/2002 11 450 000 0,14 - 2 231 000
Accounting for variance between the financial years The NDE did not account for variance in budget allocation between the financial years referred to in the table, instead it accounted for under-expenditure it experienced. In 2000/2001 the department experienced under-expenditure due to unfilled vacancies; undeveloped ECD Policy which resulted in the consultation process not being conducted; and the delay in the accreditation process for ECD providers. Budget Adequacy The NDE reported that the budget was adequate for its initiatives. The European Union supplemented the budget for the provision of Learning Support Materials (LSMs) to Grade R. The under-expenditure delayed the setting up of the ECD Programme and the procurement and distribution of LSMs to learning sites. However, the selection of ECD sites in the provinces has been completed, and the learning support kits ordered. This should make the programme proceed smoothly in the future. Primary School Nutrition Programme15 Table 3 Total Budget Allocations for the Primary School Nutrition Programme
Year Total allocation in Rand(s)
Per capita allocation in Rand(s) after inflation adjustment (for school feeding)
Projected expenditure
Actual expenditure
2000/2001 582 411 000 102 – 30 Average
582 411 000 504 164 000 (87%)
2001/2002 582 411 000 102 – 30 Average
582 411 000 438 940 000 (75%)
Accounting for variance between the financial years The response is inappropriate for accounting for the variance in budget allocation. It was stated as follows:
15 The information given in this section was obtained from the Department of Health (DoH), which is responsible for the programme. This is also a welfare issue.

Right to Education – Period: April 2000 – March 2002
245
Operational delays were reported by the DoH in the implementation of the feeding scheme programme. The problems that were cited were as follows:
• Delivery problems; • Disruptions in school programme; and • Delays in tender processes.
Budget Adequacy The DoH indicated that the budget was inadequate, particularly for the planned support. The department under-spent by R 78, 2 million in the financial year 2000/2001 when implementing the programme. In 2001/2002 the NDE underspent by R 143, 5 million. The following were the measures the department took to address under-spending:
• Capacity building; • Discussions with both Provincial and National Treasuries; and • Steps to improve the implementation of school feeding.
Education About HIV/AIDS Table 4 Total Budget Allocations for Education about HIV/AIDS Programme
Year Total allocation in Rand(s)
Allocation as % of the department’s total revenue
Projected expenditure
Actual expenditure
2000/2001 4 365 000 0,06 - 1 683 000 2001/2002 7 172 000 0,09 - 2 042 000
Accounting for variance between the financial years The response given by the NDE is inappropriate for this section. The following is what was said by the NDE: In 2000/2001 the department experienced under-expenditure due to late gazetting of the funds on 28 August 2000. In 2000/2001 the NDE under-spent by R 2, 7 million while in the subsequent financial year it underspent by R5, 1 million. During 2000/2001, Project Managers and Financial Administrative Officers were appointed in the provinces to manage the project. The printing of the learning materials was done and the materials distributed to the provinces. Education for Learners with Special Education Needs (ELSEN) Table 5 Total Budget Allocations for ELSEN
Year Total allocation in Rand(s)
Allocation as % of the department’s total revenue
Projected expenditure
Actual expenditure
2000/2001 1 841 000 0,02 - 802 000 2001/2002 2 677 000 0,03 - 2 520 000
Right to Education – Period: April 2000 – March 2002
246
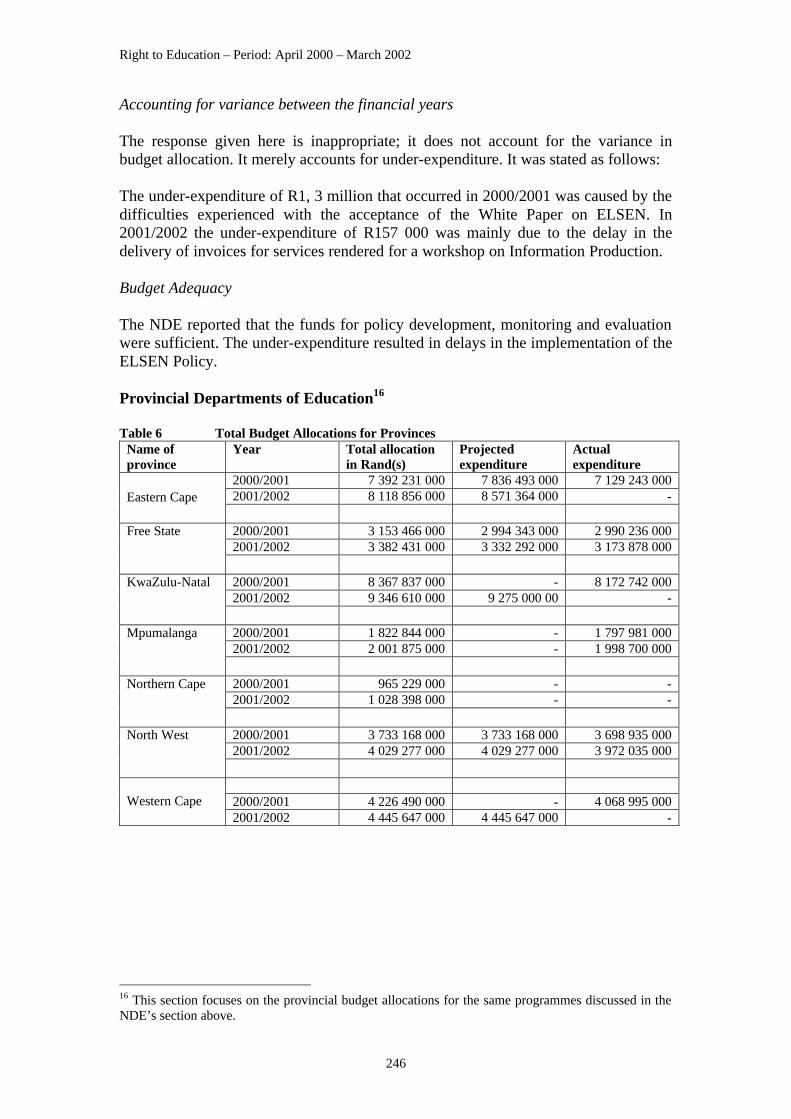
Accounting for variance between the financial years The response given here is inappropriate; it does not account for the variance in budget allocation. It merely accounts for under-expenditure. It was stated as follows: The under-expenditure of R1, 3 million that occurred in 2000/2001 was caused by the difficulties experienced with the acceptance of the White Paper on ELSEN. In 2001/2002 the under-expenditure of R157 000 was mainly due to the delay in the delivery of invoices for services rendered for a workshop on Information Production. Budget Adequacy The NDE reported that the funds for policy development, monitoring and evaluation were sufficient. The under-expenditure resulted in delays in the implementation of the ELSEN Policy. Provincial Departments of Education16 Table 6 Total Budget Allocations for Provinces
Name of province
Year Total allocation in Rand(s)
Projected expenditure
Actual expenditure
2000/2001 7 392 231 000 7 836 493 000 7 129 243 000 2001/2002 8 118 856 000 8 571 364 000 - Eastern Cape 2000/2001 3 153 466 000 2 994 343 000 2 990 236 000 2001/2002 3 382 431 000 3 332 292 000 3 173 878 000
Free State
2000/2001 8 367 837 000 - 8 172 742 000 2001/2002 9 346 610 000 9 275 000 00 -
KwaZulu-Natal
2000/2001 1 822 844 000 - 1 797 981 000 2001/2002 2 001 875 000 - 1 998 700 000
Mpumalanga
2000/2001 965 229 000 - - 2001/2002 1 028 398 000 - -
Northern Cape
2000/2001 3 733 168 000 3 733 168 000 3 698 935 000 2001/2002 4 029 277 000 4 029 277 000 3 972 035 000
North West
2000/2001 4 226 490 000 - 4 068 995 000
Western Cape
2001/2002 4 445 647 000 4 445 647 000 -
16 This section focuses on the provincial budget allocations for the same programmes discussed in the NDE’s section above.

Right to Education – Period: April 2000 – March 2002
247
Accounting for variance(s) between the financial years17 The ECDE and the KZNDEC did not respond to the question on the variances. The NCDE reported that while its budget has been nominally increasing every financial year due to inflation, it has, nonetheless, remained relatively constant, as a percentage of the total provincial budget. The NWDE reported that the variance was due to goods and/or services that were not paid for before the end of the financial years in question. The reasons cited for the non-payment of these goods and/or services included non-delivery of the goods and/or services and unsubmitted invoices of the delivered goods and/or services. The WCDE only said that the variances were minimal. Budget Adequacy The ECDE reported that the budget was adequate, and that it experienced over-spending. A ratio between personnel and non-personnel expenditure has been implemented with the objective to reach the target by 2005/2006 of 85:15 between personnel and non-personnel expenditure. Programme Managers have been appointed to monitor the utilisation of funds on a monthly basis. A Departmental Finance Committee has been established where Programme Managers must account on their monthly expenditure. The KZNDEC reported that it was allocated 38,4 percent of the national budget for personnel and related costs, which consumed 83 percent during the financial year 2001/2002. Infrastructure backlogs at schools abound, with the department estimating it will cost R1, 5 billion to bring it to a desirable standard, and a further R500 million per annum to maintain these schools. Both the Provincial and National Treasuries are addressing these issues. The KZNDEC further reported that it anticipated that an amount of R80 million would remain unspent by the end 2001/2002. R60 million of the above amount was specifically in respect of personnel expenditure which, again, was linked to a number of new College/School Educators (CS Educators) appointed in January 2002 but not paid before the close of the financial year. The department is restructuring and improving its financial administration. This is done with a view to best monitor and control future expenditure. The NCDE indicated that the budget was inadequate to address the necessary commitments and mandates for the financial years and 2000/2001. Most of the over-expenditure in the first two year was personnel-related. The rationalisation of staff, particularly the CS Educators, was still in the process of being concluded. The expenditure in 2001/2002 reflects that the budget was adequate to fulfil basic mandates. Improved control over personnel expenditure also accounted for
17 The FSDE gave a response that was more appropriate for accounting for under-expenditure and not accounting for the variance in budget allocation. The following is the response the FSDE provided: During 2001/2002 the FSDE under-spent by R208, 553 million. In its response, the FSDE gave a breakdown of this under-spent amount of R208, 553 million as follows:
• Outstanding commitments of unpaid orders amounting to R115, 547 million; • Unspent conditional grant funds amounting to R49, 967 million; • Unpaid bursary contracts amounting to R16, 139 million; and • Unspent capital projects funds amounting to R26, 900 million.

Right to Education – Period: April 2000 – March 2002
248
expenditure within the budget. To address the budget inadequacy the NCDE reportedly introduced improved control over personnel expenditure as well as improved financial controls. The introduction of measures to improve expenditure control, as well as the devolution of responsibilities to managers, resulted in greater awareness to control expenditure. The improved control over expenditure could be seen as the single most important reason for addressing budget inadequacies. The availability of additional funds, including donor funds and conditional grants, assisted in improved service delivery within the constrained budget. Over-expenditure occurred in 2000/2001. This was mainly due to excessive personnel expenditure. The over-expenditure on especially personnel (educators) was necessary at the time in order to ensure minimal disruption at schools, as classes would be without educators. The NWDE reported that the budget was adequate. The North West Education Development Trust was established to assist the department in the School Building Programme. Where funds were under-spent, they were rolled over to the following financial year. To address the problem of under-spending, the department proposed that orders be placed on time to ensure delivery and payment within the financial year the orders are placed. The budget for WCDE was inadequate; this led to a shortage of teachers, classrooms, books and equipment. Over-spending did occur in “small amounts”, though, which the department did not mention. To correct the problem of over-spending, the department revises its business plans regularly.

Right to Education – Period: April 2000 – March 2002
249
Early Childhood Development Programme (ECD) Table 7 Budget Allocations for the ECD Programme
Name of province
Year Total allocation in Rand(s)
Projected expenditure
Actual expenditure
2000/2001 5 052 077 80 5 052 077 80 5 052 078 000 2001/2002 - - -
Eastern Cape
2000/2001 2 678 000 3 266 000 1 603 000 2001/2002 1 171 000 921 000 921 000
Free State
2000/2001 - - - 2001/2002 2 583 000 - 1 500 000
Gauteng
2000/2001 - - - 2001/2002 9 441 000 8 111 447 -
KwaZulu-Natal
2000/2001 1 400 000 - - 2001/2002 3 297 000 - -
Limpopo
2000/2001 - - - 2001/2002 1 533 000 - 018
Mpumalanga
2000/2001 3 408 000 - 5 726 047 2001/2002 5 366 725 - 8 498 878 Northern Cape 2000/2001 124 280 124 280 92 507 2001/2002 96 613 96 613 94 933 North West 2000/2001 46 170 000 - 46 170 000
Western Cape 2001/2002 44 790 000 44 790 000 -
Accounting for variance(s) between the financial years The ECDE reported that during 2000/2001 the financial resources allocated to ECD only helped in the implementation of the ECD National Pilot Project. During the financial year 2001/2002, a conscious decision was made to allocate a substantial amount for ECD provision. Meanwhile, the FSDE reported that the large variance between the financial years 2001/2002 is due to the conditional grants received for the implementation of ECD. The GDE reported that the variance is a result of delays in the implementation of the entire business plan, except for the R1, 5 million utilised for LSMs. The difference was rolled over into the 2002/2003 budget. The KZNDEC reported that during 2001/2002 the ECD budget was under-spent by R1, 3 million, which was allocated the ECD conditional grant service provider to train the Conditional Grant Practitioners. The appointment of the service provider was a national responsibility. However, it was reported that the national tender process had failed such that the service was not being provided. To this end, the money has been rolled-over as training is still required.
18 No explanation was given regarding this figure. One cannot tell whether the funds were allocated and not spent, for whatever reason/s in this financial year.

Right to Education – Period: April 2000 – March 2002
250
On the other hand, the NCDE reported that the steady increase in the budget was necessary due to the steady increase in the number of learners and learning sites. Like the MDE, the WCDE did not account for variances. Budget Adequacy The ECDE reported that the budget was inadequate for ECD provisioning, given that there are 6 354 sites. Currently, only 550 of these sites have been reached through grant funding. There was a move to make R57 million available for the ECD Directorate in the current fiscal round, R9 million of which includes a ‘top up” from the conditional grant. There was under-spending of R3million ascribed to delays in the national procurement process. The pace of delivery, even of the new mandate from the White Paper on ECD is rather slow. The ECDE suggested to the NDE to borrow funds from their provincial budget and then invoice the department. Accordingly, tender specifications have already been drawn up and are ready to be forwarded to the Provincial Tender Board for review. The process will await the sanction from the NDE. The FSDE reported that the budget was adequate. There was no under-spending experienced by the department, except that some NGOs were not paid in the financial year they should have been, which resulted in under-spending for that year. To address such problems, an action plan for the implementation of Grade R has been drawn up while an ECD Council is being established for future policy development. The GDE reported that the budget was inadequate as it only catered for the subsidies of Grade R practitioners; hence, it augmented its financial resources to ensure the provisioning of LSMs and the training of practitioners. There was under-spending, however, owing to a delay by the department’s appointment of a Grade R practitioner. But since the implementation of Grade R only started in January 2002, there was no impact on the right. The KZNDEC reported that its budget allocation for ECD provision was and is grossly inadequate. The department has an estimated 250 000 Grade R learners and currently only caters for about 80 539 learners. There is no budget allocated for learners below five years of age. There are currently no management structures for ECD in the province, with only one substantive post at level four available for coordinating all ECD processes. A costed proposal for the phasing in of Grade R has been formulated. This works within the parameters of the current budget and relies on continued funding after the end of the conditional grant, and the reallocation of funding, which is currently allocated to 900 fully funded Grade R educators. A proposal on structures for ECD has been tabled while a proposal for a full investigation into using the three dividends as advocated in the ECD Policy was recommended. The delay in the appointment of a service provider has impacted greatly on the quality of teaching and learning in the selected Grade R conditional grant sites. One of the main objectives is to provide the Previously Disadvantaged Individuals (PDIs) with a career path and an opportunity to receive a full ECD qualification with the NQF status. This training is still urgently required since the appointment of a service provider is not a provincial competence.

Right to Education – Period: April 2000 – March 2002
251
The MDE reported that the conditional grant for provincial ECD provisioning was inadequate. The province experienced under-spending due to a late start in the process of registration and processing of information related to sites. So far, 193 sites have been identified. The department has hired more staff to continuously process the registration in order to curb under-spending. The NCDE reported that the budget was inadequate for the provision of ECD. The current subsidies to centres are inadequate. Some donor funding and assistance through conditional grants was sought to address the budgetary constraints. The departmental allocations show a steady increase on an annual basis. Over-expenditure was ascribed to new sites opening during the course of a financial year. The increase in expenditure on subsidies and educators caused over-expenditure. The meeting of set targets (to subsidise all sites) was compromised. Budgetary constraints were addressed through increased allocations, conditional grants, and additional funding (from donors). The WCDE reported that the budget allocation for ECD provisioning was inadequate. The Finance Directorate has increased the budget slightly to address the shortfall. According to the WCDE, there was no experience of over- or under-expenditure in ECD provisioning. Primary School Nutrition Programme19 The ECDE cited the following factors as causes of the variances:
• Non-delivery of food by women groups; • Non-payment of transporters by women groups; and • Suppliers not delivering food because they have not been paid either by the
DoH or the contracted NGOs. According to the ECDE, all the above problems resulted in the number of feeding days being reduced. Budget Adequacy The ECDE reported that the budget for the programme was inadequate. As a result, it could not feed schools for the entire calendar year. Therefore, there are attempts to use up to 70 percent of the school calendar year for feeding. As part of the solution, only certain grades are considered. The ECDE further reported that there was under-spending that creates an impression that the department is taking more money than it needs. The response further said that the under-spending on the programme impacts negatively on both school attendance as well as learners’ academic performance. The department has monitoring mechanisms in place aimed at ensuring that service delivery actually takes place to avoid under-spending. The DoH is currently reviewing its strategy in order to address the glitches in the programme. 19 At the provincial level only the Eastern Cape responded to the questions on the Primary School Nutrition Programme (PSNP). The rational for the non-reporting on the PSNP is due to the fact that the budget for the programme is the sole responsibility of the DoH. As a result, there will not be much information on the PSNP.

Right to Education – Period: April 2000 – March 2002
252
Education About HIV/AIDS Table 8 Budget Allocations for Education about HIV/AIDS Programme
Name of Province
Year Total allocation in Rand(s)
Projected expenditure
Actual expenditure
2000/2001 4 2000 000 4 2000 000 2 5000 000 2001/2002 11 747 000 11 747 000 7 4000 000 Eastern Cape
2000/2001 1 000 000 940 000 2 093 2001/2002 6 298 000 6 298 000 2 842 000
Free State
2000/2001 2 296 000 2 296 000 2 204 160 2001/2002 7 810 000 7 810 000 7 575 700
Gauteng
2000/2001 4 6000 000 4 6000 000 - 2001/2002 14 000 000 18 000 000 - KwaZulu-Natal
2000/2001 2 340 000 - 228 000 2001/2002 1 533 000 - 2 965 000
Mpumalanga
2000/2001 - 902 622 2001/2002 2 663 000 - 2 518 824 Northern Cape
2000/2001 2 339 000 - 2 339 000 2001/2002 5 080 000 - 5 080 000
North West
2000/2001 2 297 000 2 297 000 823 000
Western Cape 2001/2002 5 017 000 6 491 000 1 200 000
Accounting for variance(s) between the financial years The ECDE reported that funding for the HIV/AIDS Programme comes from a grant which keeps fluctuating. The FSDE said that funds were provided in 2000/2001 for the implementation phase of the Education about HIV/AIDS Programme, whilst conditional grants have been received from the National Treasury for 2001/2002 and to address the issue of HIV/AIDS in the workplace. The under-spending of R3, 456 million was fully committed during 2001/2002. The GDE reported that a number of schools did not access the budgets because of the following factors:
• no dedicated Life Skills teachers were appointed; • lack of financial management skills; • perceptions of ex-Model C schools that HIV/AIDS does not affect them; and • delays/ cancellations of activities due to lack of administrative and
professional human resources. The KZNDEC’s budget for 2000/2001 was transferred to the province in November. No expenditure occurred between November 2000 and January 2001 as schools were writing examinations; closed or had just re-opened. The variance between the two financial years’ budget allocations was attributed to an incorrect bookkeeping procedure, which may not have correct expenditure in two of the department’s
Right to Education – Period: April 2000 – March 2002
253
regions, viz., Vryheid and Empangeni. The LDE did not account for the variance in its budget. The NCDE reported that in 2000/2001 there was no actual provisioning for the HIV/AIDS Programme. The intensification of the programme and the appointment of dedicated staff to drive the programme necessitated substantial increases in its budget. The NWDE reported that the variance in its budget allocations was due to the fact that the funds from the conditional grant were transferred to the province only in September and November 2000; only training materials were ordered in 2000. The rest of the funds were rolled over to the 2000/2001 financial year for training and implementation. For the 2001/2002 financial year 99 per cent of the allocated budget was spent. The WCDE reported that in 1999/2000 the funds came from its department, whereas the subsequent budgets came from the NDE as a conditional grant. In 2000/2001 grant funding arrived late such that R1, 5 million was rolled over into 2001/2002. The 2001/2002 actual expenditure was estimated at R1, 2 million, which excluded funds committed (R4 million) and outstanding invoices (R2, 6 million) Thus, the R6, 491 million (which includes the previous year’s roll-over) would all have been appropriated by May 2002. Budget Adequacy The ECDE reported that the budget for HIV/AIDS Education was adequate. The department further reported that it experienced under-spending due to delays in the procurement processes and loading of budgets within the provincial departments. Under-staffing in the human resources area also contributed to under-spending. To address this problem, the department is considering employing more people in 24 of its District offices. The GDE reported that the budget for the programme was inadequate. It further said that critical aspects of an intervention programme, (which include Care, Support and Counselling of affected and infected by HIV/AIDS and HIV/AIDS programmes) was not sufficiently provided in previous budgets. To address the budget inadequacy, the department requested additional funding from NIP Life Skills Conditional Grant and for the HIV/AIDS Programme (workplace training). The budget was not fully utilised owing to lack of capacity at all levels, that is, provincial, district, and school. The department has since appointed short-term administrative staff at district level to support Life Skills Co-ordinators. The KZNDEC reported that the budget for the HIV/AIDS Programme was adequate since it was based on the approved provincial business plan. The department experienced under-spending because in November 2000 the budget was transferred to the province and could only be used for the programme by the end of January 2001 when schools re-opened. Before the end of March 2000, the procurement procedures were problematic in as far as the planned expenditure was concerned.

Right to Education – Period: April 2000 – March 2002
254
The department reported that the under-spending did not have a negative impact on the realisation of the right to basic education as the unused amount was rolled over to 2001/2002. Subsequently, it took the following measures to address under-spending:
• Implementation plans inclusive of projected expenditure are prepared; • Commitment registers are kept; • Cashflow reports are obtained; and • Monthly meetings are held with all programme implementers to evaluate
progress and cashflow. The LDE reported that the budget for the programme was adequate. The department reported that it experienced under-spending owing to the late availability of funds. To address the under-spending, the department proposed that the funds be disbursed on time. The MDE did not respond to the questions on the HIV/AIDS Programme. The NCDE reported that the budget for the programme was inadequate, and this made the expansion of the programme into other areas and the appointment of additional staff impossible. To address the budget inadequacy, budget allocations were increased as well as donor funding mobilised. In 2000/2001 the department experienced over-expenditure. The NWDE reported that the budget allocation for the HIV/AIDS Programme was adequate. The department under-spent by 1 percent in 2000/2001 as it was awaiting the Tender Board’s approval for resource materials (Afrikaans and Setswana). The department engaged the NDE to ensure that transfers are made timeously. The WCDE reported that its budget allocation for the HIV/AIDS Programme has been adequate thus far (and in fact the conditional grant has been under-spent) due to careful financial management and inadequate structures and staffing. According to the department, the under-spending has impacted negatively on the implementation of the programme, and has reduced overall efficacy of the programme in exceeding its targets. Better planning was suggested to address under-spending.

Right to Education – Period: April 2000 – March 2002
255
Education for Learners with Special Education Needs (ELSEN) Table 9 Budget Allocations for ELSEN
Name of province
Year Total allocation in Rand(s)
Projected expenditure
Actual expenditure
2000/2001 18 842 000 - 18 842 000 2001/2002 18 642 393 - 18 642 393
Eastern Cape
2000/2001 71 630 000 71 630 000 77 515 000 2001/2002 81 817 000 80 366 000 81 243 000
Free State
2000/2001 51 790 152 51 790 152 51 790 152 2001/2002 64 760 240 64 760 240 64 760 240
Gauteng
2000/2001 183 561 000 183 561 000 155 204 000 2001/2002 190 904 000 190 333 000 190 333 000 KwaZulu-Natal 2000/2001 63 701 800 - 76 994 000 2001/2002 68 190 718 - 90 863 000
Limpopo
2000/2001 52 500 000 - 50 983 000 2001/2002 55 944 000 - 52 838 000 Mpumalanga 2000/2001 27 806 000 - 24 431 336 2002/2002 31 856 488 - 31 856 222
Northern Cape
2000/ 2001 61 477 000 61 477 000 58 828 000 2001/2002 65 956 000 65 956 000 65 956 000
North West
2000/2001 276 410 000 276 410 000 276 410 000
Western Cape 2001/2002 282 976 000 282 976 000 282 976 000
Accounting for variance(s) between the financial years The ECDE reported that the variance between 2000/2001 and 2001/2002 was caused by a delay in the transfer of funds from the NDE to schools. The FSDE reported that the variance was caused by the injection of conditional grants. The GDE did not account for variances in their budget allocations. The KZNDEC reported that the variance between 2000/2001 and 2001/2002 was as a result of a delay in the inception of an allowance that was made for registration of schools located in previously disadvantaged areas. The LDE and MDE did not respond to questions relating to variances in budget allocations. The NCDE reported that the variance in budget allocations between the financial years were due to the imperatives as per the White Paper on Inclusive Education. The NWDE reported that the per capita allocations for special needs and disabled learners are determined according to a fixed formula based on disability category. The main variables in the formula are poverty and the number of learners per school. It was reported that the formula takes into account the plight of the vulnerable and marginalised groups. The WCDE reported that the cause of the variance in its budget allocations was simply influenced by inflation.

Right to Education – Period: April 2000 – March 2002
256
Budget Adequacy The ECDE reported that the budget was inadequate such that schools threatened to close. To augment the insufficient funds, some virements20 had to be made. As a result of under-expenditure in the department, learners were deprived of a quality diet, transport, and crucially - the equipment needed for quality education. The FSDE reported that the budget was inadequate. Some Special Schools still needed to be converted to Community Centers. Others struggle with maintenance, as some learners could not afford the fees. Special Schools have had to cut down on their expenses, as the budget was inadequate. Due to some parents not affording the fees they withdrew their learners from Special Schools and placed them in public ordinary schools without any therapeutic intervention. To address over-expenditure the NDE has had to increase the budget allocations for Special Schools and also allowed 5 per cent over-expenditure. The GDE indicated that its budget was adequate. The KZNDEC reported that the disabled learners’ needs, particularly those in rural areas with infrastructure backlogs, far outweigh the budget allocations. The redress allowance as well as the collaboration between departments and other organisations has helped substantially. The under-expenditure that was committed in 2000/2001 was due to procedural delays that halted the building of Special Schools, since the funds ended up not being utilised at all. The affected learners were placed in normal schools with special units until the Special Schools that were only built afterwards were registered. As a way of addressing under-expenditure, the department has resolved to adopt the following measures:
• Focused project plans incorporating projected expenditure and regular cash-flow meetings;
• Transfer payments for Special Schools subsidies to be transferred into these schools’ accounts at set intervals; and
• Review policy to guide the establishment of Special Schools to cater for the needs of the previously disadvantaged communities.
The LDE reported that its budget was inadequate due to the increasing number of learners in Special Schools. The MDE also reported that the budget needed to be increased. Currently, an attempt is being made to have the provincial grant supplementing the national grant for this sector. The NCDE reported that the budget was inadequate as the need to accommodate more disabled learners in the system of education is increasing. To augment the inadequate funds, the department had to source donor funding and conditional grants. The under-expenditure committed in 2000/2001 was a result of the lack of human resources. Much as some progress was achieved in this field, the improvement of access and support was retarded to some degree. The increase in human resources, improved financial management and capacity building helped to address the question of under-expenditure. The NWDE did not respond to the questions relating to budgetary measures. The WCDE reported that the budget was inadequate for ELSEN. However, the department did say that the services are efficient amidst the scarce financial resources and that audits are performed to help improve the utilisation of resources in schools.
20 A process in which resources are transferred between different programmes within the same department vote during the financial year.

Right to Education – Period: April 2000 – March 2002
257
5. INDICATORS National Sphere Table 10 Early Childhood Development Programme
Total Urban Rural Female Africans Coloureds Indians Total number of learners
1 030 473 711 501 318 972 519 358 761 774 106 937 22 177
Number of learners in informal settlements
- - - - - - -
Number of homeless learners
- - - - - - -
Number of learners with disabilities
11 779 9 450 2 329 - - - -
Number of previously disadvantaged racial groups (Africans, Cloureds and Indians)
104543 44718 55993 - 95687 8428 428
Number of learners in farm schools
- - - - - - -
Table 11 General Indicators
Total Females Males Literacy Rate (below 15 years)
- - -
Adult Literacy Rate from 15 to 18
83,3 85,4 81,1
Adult Literacy Rate from 18 and above
66,6 65,9 67,4
Number of school-going children who without good reasons are not able to attend school
- - -

Right to Education – Period: April 2000 – March 2002
258
Table 12 National Action Plan (NAP) Total Rural Urban Total number of schools 27 148 - - Number of schools with buildings in a state of disrepair (1).
2 280 - -
Number of schools that have a shortage of classrooms
10 723 - -
Number of schools with inadequate textbooks (3). 13 204 - - Number of learners residing beyond 5km radius (3) 8 141 195 - - 10 395 - - Number of schools with no electricity 10 859 - - Number of schools with no telephones (4) 9 638 - - Number of schools with inadequate toilet facilities 2 498 - - Number of schools with lack of access to computers 19 085 - - Number of schools with lack of access to laboratories (6)
- - -
Number of schools with lack of access to library facilities
21 773 - -
Number of schools with lack of access to recreational and sporting facilities (5)
17 762 - -
Provincial Sphere Eastern Cape Table 13 Early Childhood Development Programme
Total Urban Rural Female Africans Coloureds Indians Total number of learners
148325 63015 79914 58967 95687 8428 428
Number of learners in informal settlements
- - - - - - -
Number of homeless learners
- - - - - - -
Number of learners with disabilities
7103 - - - - - -
Number of previously disadvantaged racial groups (Africans, Coloureds and Indians)
104543 44718 55993 - 95687 8428 428
Feeding Programmes (Beneficiaries) A total number of 884 123 learners were reportedly benefiting from the Feeding Programmes nation-wide. Nonetheless, the information was not classified in race terms.

Right to Education – Period: April 2000 – March 2002
259
Table 14 National Action Plan (NAP) Total Rural Urban Total number of schools 6 520 - - Number of schools with buildings in a state of disrepair (1).
3 361 - -
Number of schools that have a shortage of classrooms 3 468 - - Number of schools with inadequate textbooks (3). - - - Number of learners residing beyond 5km radius (3) - - - 10 395 3 008 - - Number of schools with no electricity 3 236 - - Number of schools with no telephones (4) 3 821 - - Number of schools with inadequate toilet facilities 1 166 - - Number of schools with lack of access to computers 6 009 - - Number of schools with lack of access to laboratories (6) 5 754 - - Number of schools with lack of access to library facilities 5 728 - - Number of schools with lack of access to recreational and sporting facilities (5)
- - -
Northern Cape Table 15 Early Childhood Development Programme Total Urban Rural Female African Coloureds Indians Total number of learners
56299 17191 39108 27025 18089 32157 126
Number of learners in informal settlements
- - - - - - -
Number of homeless learners
- - - - - - -
Number of learners with disabilities
- - - - - - -
Number of previously disadvantaged racial groups (Africans, Coloureds and Indians)
104543 44718 55993 - 95687 8428 428
Number of learners in farm schools
5 335 - - 2 535 2431 2810 13

Right to Education – Period: April 2000 – March 2002
260
Table 16 Feeding Programme (Beneficiaries) Total number of learners
91604 17796 73808 45007 30705 49318 175
Number of learners in informal settlements
- - - - - - -
Number of homeless learners
- - - - - - -
Number of learners in farm schools
90586 17598 72988 44507 30346 48735 172
Number of learners with disabilities
- - - - - - -
Number of previously disadvantaged racial groups (Africans, Coloureds and Indians)
- - - - 30705 49318 175
Table 17 General Indicators
Total Females Males Literacy Rate (below 15 years) - - - Adult Literacy Rate from 15 to 18 - - - Adult Literacy Rate from 18 and above 53% - - Number of school-going children who without good reasons are not able to attend school
2464 - -
Table 18 National Action Plan
Total
Rural
Urban
Total number of schools 459 347 112 Number of schools with buildings in a state of disrepair (1). 7 3 4 Number of schools that have a shortage of classrooms 90 55 35 Number of schools with inadequate textbooks (3). 0 0 0 Number of learners residing beyond 5km radius (3) 2749 869 1880 Number of schools with no water within walking distance 5 3 2 Number of schools with no electricity 36 36 0 Number of schools with no telephones (4) 36 31 5 Number of schools with inadequate toilet facilities 12 8 4 Number of schools with lack of access to computers 185 157 28 Number of schools with lack of access to laboratories (6) 319 247 72 Number of schools with lack of access to library facilities 275 154 121 Number of schools with lack of access to recreational and sporting facilities (5)
146 122 24
Right to Education – Period: April 2000 – March 2002
261
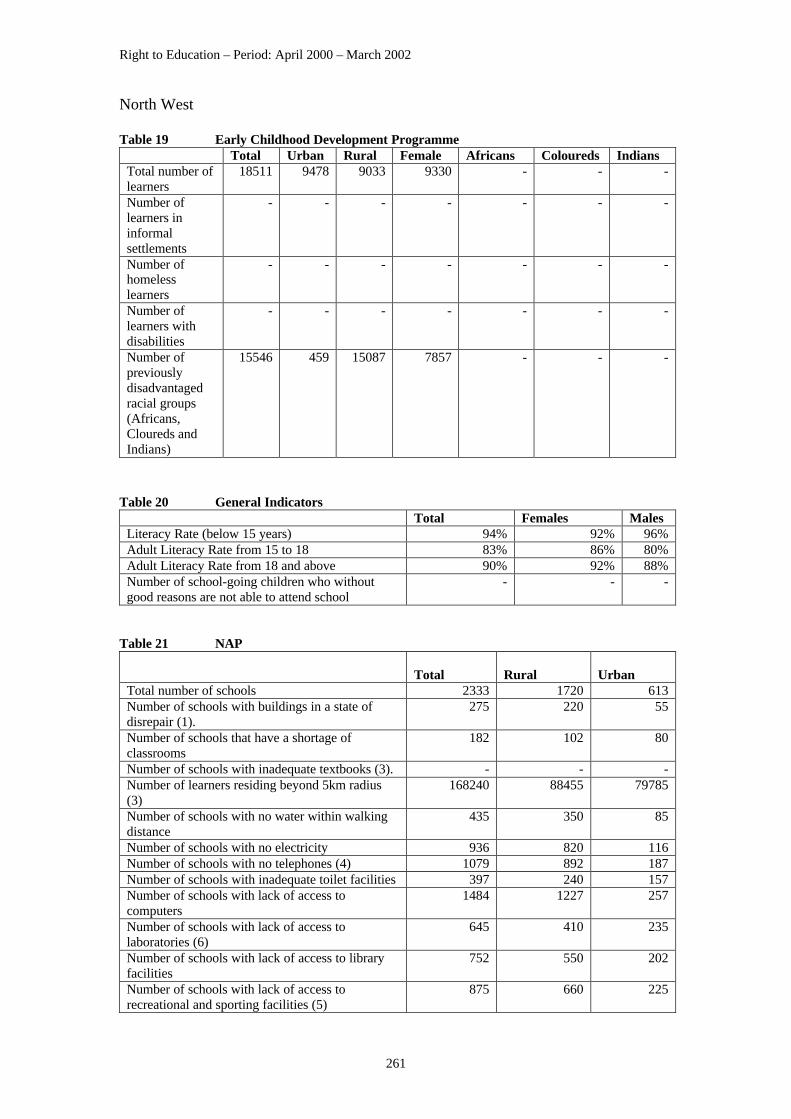
North West Table 19 Early Childhood Development Programme
Total Urban Rural Female Africans Coloureds Indians Total number of learners
18511 9478 9033 9330 - - -
Number of learners in informal settlements
- - - - - - -
Number of homeless learners
- - - - - - -
Number of learners with disabilities
- - - - - - -
Number of previously disadvantaged racial groups (Africans, Cloureds and Indians)
15546 459 15087 7857 - - -
Table 20 General Indicators
Total Females Males Literacy Rate (below 15 years) 94% 92% 96% Adult Literacy Rate from 15 to 18 83% 86% 80% Adult Literacy Rate from 18 and above 90% 92% 88% Number of school-going children who without good reasons are not able to attend school
- - -
Table 21 NAP
Total
Rural
Urban
Total number of schools 2333 1720 613 Number of schools with buildings in a state of disrepair (1).
275 220 55
Number of schools that have a shortage of classrooms
182 102 80
Number of schools with inadequate textbooks (3). - - - Number of learners residing beyond 5km radius (3)
168240 88455 79785
Number of schools with no water within walking distance
435 350 85
Number of schools with no electricity 936 820 116 Number of schools with no telephones (4) 1079 892 187 Number of schools with inadequate toilet facilities 397 240 157 Number of schools with lack of access to computers
1484 1227 257
Number of schools with lack of access to laboratories (6)
645 410 235
Number of schools with lack of access to library facilities
752 550 202
Number of schools with lack of access to recreational and sporting facilities (5)
875 660 225
Right to Education – Period: April 2000 – March 2002
262
6. CRITIQUE21 POLICY AND PROHGRAMMATIC MEASURES Early Childhood Development The government should be commended for its efforts to undo the apartheid system of education seen especially through the strengthening of the ECD, which is a critical pre-school phase for the child’s growth and development in all aspects.
It is not insignificant that in 1995 South Africa ratified the United Nations Convention on the Rights of the Child (CRC), which is based on the survival, development, protection and participation rights of children.22 In January 2000, South Africa also ratified the African Charter on the Rights and Welfare of the Child, developed by the erstwhile Organisation of African Unity to better reflect African cultural concerns and other relevant issues not adequately covered by the Convention on the Rights of the Child.23 Whilst there are efforts by the government towards the realisation of the right to basic education in the area of ECD, some attention should also be paid to the following areas: Funding of the Reception Year Programme The decision by the NDE to administer about 75 percent of ECD, specifically the Reception Year,24 shows the willingness and a sense of responsibility toward achieving its goals of providing education for all South Africans by 2015.25 The policy is also in line with Article 28 of the CRC, which, however, goes further to say that education, is also expensive and not all states will be able to meet the educational needs of their children.26
21 Inasmuch as education is a functional area of concurrent national and provincial legislative competence, excluding tertiary education, during the two financial years in question, 2000/2001 and 20012002, the PEDS had had to implement policies from the national sphere of government. Therefore, only national policies, programmes/projects and the implementation thereof are going to be critiqued. 22 The Department of Education, The Nationwide Audit of ECD Provisioning in South Africa 2001, Pretoria, 2001.p.7. 23 Ibid. p.7 24 The Reception Year is part of ECD. It prepares 4 year olds turning 5 end of June of the year of admission, i.e. for Grade 1. Before the Minister of Education, Professor Kader Asmal was taken to Constitutional Court on the admissions policy that stipulated that for a child to be admitted to Grade 1 he/she must be 7, the Reception Year programmes were for 5 year olds turning 6 in the year of admission. 0 – 4 year olds’ ECD provision is taken care of through a collaboration of departments such as Health, Social Development, Local Government, and the Office of the Presidency. The NDE will simply, within the context of ECD priority group of the National Programme of Action for Children, co-ordinate and support activities to develop national, provincial and local level strategies and services that are planned in an integrated and comprehensive manner in collaboration with relevant organizations, institutions and communities. 25This was one of the commitments taken at the World Economic Forum hosted by UNESCO, April 2000, Dakar, Senegal. 26 Rachel Hodgkin and Peter Newell, Implementation Handbook for the Convention on the Rights of the Child. Commissioned by the United Nations Children’s Funds (Unicef), 1998. p. 369.

Right to Education – Period: April 2000 – March 2002
263
However, what is problematic about the administration of 75 percent of the Reception Year programmes, which is a combination of both public primary schools-provided ECD and Community-based sites, is the fact that government will not fund the remaining 25 per cent of independent pre-primary schools-provided ECD. The problem with the administration of the Reception Year Programme is that the government will not fund, despite the fact that independent pre-primary schools have to comply with the Policy on Norms and Standards for School Funding.27 The Reception Year at public primary schools benefit from government funding whilst independent pre-primary schools do not. It would be understandable if the state eventually funded the Reception Year programmes in independent pre-primary schools. This would be an indication that the government is taking full responsibility towards the realisation of the right to education, and that the NDE is serious about providing the Reception Year according to the 2001 Report on ECD Policies and Programmes. According to the NDE ECD audit, approximately 200,000 children are currently accommodated within primary school-based Reception Year programmes. The departments’ medium-term goal (2010) is that approximately 90 percent of all five-year olds (turning six in the year of admission); some 810,000 would be accommodated through these programmes.28 Assessment Strategies for the Reception Year Programme The Constitutional Court’s,29 ruling on the unconstitutionality of the Admissions Policy, and the stipulation that the admission age be seven has had an impact on the Reception Year programmes. The change in the admission age meant that the Reception Year programmes curriculum had to accommodate the new entrants – the 5 year olds. The change in curriculum would automatically affect the assessment strategies for learners. The ECD Conditional Grant Expenditure Amongst other votes, the PEDs have conditional grants, which should be or are used for special projects. The special programmes comprise the following:
• Quality improvement and financial management; • HIV/AIDS; • Early Childhood Development; and • Infrastructure – Classroom backlogs.30
27 The policy aims to redistribute recurrent non-personnel resources to the most needy learners within each province. 28 National Education Policy Act 27 of 1996. Education White Paper 5 on Early Childhood Education, Meeting the challenge of early childhood development in South Africa, Pretoria, May, 2001. (http://www.polity.org.za/govdocs/white_papers/education.html). Visited on 29 July 2002. 29 Minister of Education v Harris 2001 (11) BCLR (CC). 30 Kader Asmal, MP, Fifth Report on the Provinces to the President from the Minister of Education, May, 2002. (pdf file).

Right to Education – Period: April 2000 – March 2002
264
The Minister of Education, in his 2000 report on the utilisation of the ECD Grant, by provinces, disclosed that six of the nine PEDs under-spent the funds allocated for the ECD provision during 2001/2002.
The overall expenditure for the Early Childhood Development grant was 15 percent of the allocation. Only three provinces spent more than 30 percent of their respective allocations. These are KwaZulu-Natal (53.9 percent), Northern Cape (53.6 percent) and Western Cape (30.3 percent). These figures might improve slightly when the accounts of the 2001/2002 financial year are finalised. Two provinces, Eastern Cape and Free State respectively spent 0.28 percent and 0.9 percent. The remaining four provinces, (Gauteng, Mpumalanga, Limpopo and North West have either not submitted reports or worse still have not spent the funds at all.31
Regardless of the consolidation of the accounts for the financial year 2001/2002, it was indicated that there is a serious problem with the provision of ECD in most provinces. Only two provinces spent just more than 50 percent of their budgets on ECD, KwaZulu-Natal and the Northern Cape. Only three of the nine provinces gave narrative reports to the Minister of Education on ECD: KwaZulu-Natal, Free State and Gauteng. Table 22 2001/2002 Conditional Grant allocation to and expenditure by provincial
departments of education for Early Childhood Development (ECD) Province Allocation
Transfers
Expenditure as per last report received
Balance
% Spent Month of last report received
R'000 R'000 R'000 R'000 Eastern Cape 3.885 3.885 11 3.874 0.28 Feb-02 Free State 1.323 1.323 12 1.311 0.91 Feb-02 Gauteng 2.583 2.583 - 2.583 0.00 Dec-01 KwaZulu-Natal
4.641 4.641 2.500 2.141 53.87 Jan-02
Mpumalanga 1.533 1.533 1.533 0.00 Northern Cape 399 399 214 185 53.63 May-01 Limpopo 3.297 3.297 3.297 0.00 Dec-01 North West 1.680 1.680 - 1.680 0.00 Western Cape 1.659 1.659 502 1.157 30.25 Feb-02 TOTAL 21.000 21.000 3.239 17.761 15.42
-information not provided Source: Kader Asmal, MP, Fifth Report on the Provinces to the President from the Minister of Education, May, 2002. (Pdf file).
It can be argued that the causes of under-expenditure in 2001/2002 are understandable in that, for Africans, tendering for ECD provision was still a new phenomenon. Those who happened to be involved in its provision, before the project was launched in 1997, provided ECD services on a small scale and depended on meager earnings that were mainly from the user-fees and fundraising. The situation in KwaZulu-Natal needs the government’s immediate attention. The provision of ECD services is ‘unreasonable’ if out of 250,000 Reception Year learners
31 Ibid.

Right to Education – Period: April 2000 – March 2002
265
only 80,539 of them receive ECD services. According to the Grootboom judgement,32 a measure has to be reasonable not only at conception, but also has to be reasonably implemented for it to be effective. Therefore, the reported lack of ECD management structures in the province is of grave concern. The NDE should fast track the appointment of ECD trainers to address the plight in the provinces. Vulnerable and Marginalised Groups The NDE reported that its budget did not necessarily take these groups into consideration since it only has to facilitate the implementation of the policy at the provincial level. However, the department did say that all its policies are responsive to the needs of the disadvantaged children. The ECDE reported that the White Paper on ECD focuses on four distinct areas: rurality, poverty, HIV/AIDS and ELSEN. These are the areas in which the White Paper mandates the Department to redress. The poverty rating scales in the policy paper ensure that those groupings that were disadvantaged by past laws are addressed. The FSDE indicated that the ECD National Pilot Project was meant mainly to accommodate the rural areas. It further said that the ECD Pilot Project sites included many sites in informal settlements. Also, the department reported that the ECD Pilot Project allocated subsidy enabled sites to benefit financially to subsidise learners from low-income families. However, no funds were allocated for children in farming communities and children with disabilities. Nonetheless, children with disabilities are admitted to ECD sites, and children in farming communities are catered for as part of rural areas. The GDE reported that it finds it difficult to identify the rural and urban dwellers within the province. However, the department has come up with a poverty index that ensures that those learners from the most disadvantaged areas receive amounts of the same amount as that given to learners from historically advantaged backgrounds. Moreover, the GDE has over the past seven years, continued to allocate R12 million towards scholar transport, targeting learners from both rural/farm schools as well as schools located in informal settlements. Although previous transport allocation was skewed in favour of the former Transvaal Education Department schools, there has been a deliberate shift in policy to redistribute ELSEN transport allocation to previously disadvantaged institutions. No special provision is made for this group since it comprises the mainstream schooling. However, the GDE has other policies that complement this provision, that is, the Admissions Policy that incorporates arrangements for feeder zones. It is expected that parents/learners would access and attend school from surrounding areas. Accordingly, those that opt to go outside these boundaries may do so at their own expense.
32 Government of the Republic of South Africa and Others v Grootbooom and Others 2000 (11) BCLR 1169 (CC).

Right to Education – Period: April 2000 – March 2002
266
The KZNDEC reported that in the 560 ECD sites selected, over 85 percent are in rural communities. About 5 percent are in informal settlements; 100 percent are from low-income groups; two specified sites cater for children with severe disabilities. The MDE reported that it gave attention to children living in rural areas, in informal settlements, and to those with disabilities, in targeted areas such as Groblersdal, KaNyamazane and Moretele. Equally, the NCDE said the expansion of learning sites and increase in access targeted the rural areas and informal settlements. The subsidisation of ECD centres increased in low-income communities, while the expansion of programmes also targeted farms as they form part of rural areas. The WCDE only reported on one category of this group, the racially disadvantaged group.33 The department said that a subsidy per learner funding model has been applied to support the said category of vulnerable and marginalised group. Poverty ranking of centres to ensure redress through targeted subsidisation is needed. Primary School Nutrition Programme Allocation for the Integrated Nutrition Programme (INP) Conditional Grant is distributed to the provinces according to an index comprised of the following indicators, namely:
• Average poverty gap (average amount by which poor households’ income differ from the poverty line) counting 60 percent; and
• Population figures for the 5 to 14 year old age group counting 40 percent. The DoH reported that although the index is responsive to poverty and children, it is based on old census figures; hence it does not cover the scope of the INP and nutritional indicators. Unfortunately, the National Treasury’s approval could not be obtained to update the index. Vulnerable and Marginalised Groups The ECDE reported that it catered for the needs of the following categories of children: children living in rural areas, children living in informal settlements, and learners from low-income groups/households. All the children, from the Reception Year up to Grade Four, were fed at a cost of R1, 07 a meal. Children on farms were also considered under the programme as feeding started at a cost of R1, 07 a meal. The department did not have information on “ child-headed households”. This is so because some schools did not register other categories of children with the ECDE through the Education Management Information System (EMIS). The department did not have information on children infected and affected by HIV/AIDS. Education About HIV/AIDS Vulnerable and Marginalised Groups
33 The response did not explain which group was considered to be racially disadvantaged.

Right to Education – Period: April 2000 – March 2002
267
Regarding the considerations given to the needs of the disadvantaged groups when making budget allocations to this programme, the NDE only reported that its policies are responsive to the needs of these groups. The ECDE reported that its Life Skills and HIV/AIDS Programme is piloted annually with sites targeting all the following categories of learners:
a) learners living in rural areas; b) learners living in informal settlements; c) learners in farming communities; and d) learners from low-income groups.
However, there is nothing the department does for the “homeless learners.” It was reported that the department’s training programme targets 90 per cent of learners and educators from racial groups disadvantaged by past discriminatory laws and practices. Again, it was reported that the department does nothing for women as the grant only targets children infected and affected by HIV/AIDS. Moreover, the department trains two educators per school on basic HIV/AIDS Counseling as well as Life Skills. During the training educators are given manuals on Care and Support for people infected and affected by HIV/AIDS. As for the “child-headed households,” the department identifies these and refers them to the Department of Social Development to access grants. However, this category does benefit from the Life Skills Programme. With regards to “girl-children”, the department reported that gender-related lessons and life skills are taught to this group. The FSDE reported that in making the budgetary allocations its considered the needs of all learners including those infected and affected by HIV/AIDS. The GDE reported that for “learners living in rural areas”, schools are always identified in line with the GDE’s strategy of redress as it pertains to Educator Development, Advocacy, LSMs, and First Aid Kits. In terms of “learners living in informal settlements”, the department reported that school communities (which include informal settlements) are included and informed of all GDE’s School Aids Awareness Campaigns and related activities. The GDE’s Poverty Index takes into account the poverty levels of communities adjacent to schools with an aim to redress previous imbalances. With regards to “learners in farming communities”, the department reported that schools participate in all Life Skills programmes and are recipients of subsidies distributed to rural schools. Regarding the “homeless learners”, the department reported that the HIV/AIDS Programme is part of an intersectoral strategy, which involves NGOs, Community Based Organisations, and other government departments (Social Services, Health), which have a focus on marginalised target groups such as “homeless learners”. The New Nation School for “learners living in the streets” within the GDE has access to all HIV/AIDS programmes and materials. Coming to “learners from racial groups disadvantaged by past discriminatory laws and practices”, the department reported that currently budgets are allocated according to weighting indices, which take into account the number of departments reflecting racial composition. For the “women” category, the department reported that issues on gender-bias and violence against women are incorporated into the Life Skills Programme. Regarding the “child-headed households”, the department reported that

Right to Education – Period: April 2000 – March 2002
268
it considered participating in policy development with the Departments of Housing and Social Services to address issues on child-headed households. Concerning “girl-children”, the department reported that special programmes dealing with gender issues and its relationship to HIV/AIDS are being developed and school communities are being workshopped on these issues. LSMs dealing with gender issues are also distributed to school communities. Care and Support manuals are distributed to all educators; training in collaboration with the Departments of Health and Social Services are held on an-ongoing basis to cater for “learners infected and affected by HIV/AIDS”. The existing support systems are being strengthened to deal with this category of learners. The KZNDEC reported that the Education Conditional Grant for HIV/AIDS was allocated to the Departments of Education and Culture to meet the needs of all the learners, including those who were previously marginalised as well as those who are socially disengaged. This was achieved through the implementation of Life Skills-based HIV/AIDS Education Programme in three phases over three financial years. Phase one targeted 20 per cent of all schools; phase two targeted 40 percent and phase three in 2002/2003 the last 40 per cent. The LDE reported that the needs of all the categories of vulnerable groups mentioned in the protocol or questionnaire were considered in the budget allocation for the HIV/AIDS Programme. The NCDE reported that the programme considered the needs of “learners living in rural areas” as it is focusing on expansion in all areas in the provinces. The Department further reported that the Programme Co-ordinators appointed in all the Districts ensure that the programme targets all the categories of learners mentioned in the protocol. Regarding the “women” category specifically, the department reported that adult women are reached in the form of educators and at ABET sites. The NWDE reported that “learners living in rural areas” and “learners in informal settlements” were included in the selection of schools that are part of the HIV/AIDS Programme. Nothing was said about “learners in farming communities.” The department reported that the “girl-children” category was a priority in its approach. The department further reported that the other categories of learners mentioned in the protocol would be included in the programme.
The WCDE reported that the following categories of learners were its programme priority:
• learners in informal settlements; • learners infected with and affected by HIV/AIDS; • child-headed households; • homeless learners; and • learners from low-income groups.
The department reported that the “women” and “girl-children” categories constitute a fundamental component of the programme. The department further reported that it had to increase costs per head allowance for educators trained for both “learners in rural areas” and “learners in farming communities.” Lastly, the department reported

Right to Education – Period: April 2000 – March 2002
269
that the PDIs are prioritised according to the degree to which HIV/AIDS affects the communities within which they live. Education White Paper 6: Special Needs Education, Building an Inclusive Education (2001) The release of this White Paper represents one of the progressive post-apartheid policies in the education system. The White Paper attempts to provide an inclusive education that recognises that learners with special needs are not the problem, per se. Rather, the system of education itself needs to be accommodative of intellectually and/or physically impaired learners to fully participate in and benefit from the education system. Against this background, the White Paper defines inclusive education and training comprehensively; that is, it involves other factors including the physical environment of learning, the language used to construct knowledge in a classroom setting, as well as factors inherent in our traditional learning environments.34 However, there is one concern regarding this policy paper. Whilst the District-based support teams are made up of experts in the area of Special Education, it is not clear how the “normal” learners will be helped to adjust to the new situation. The new situation is one in which learners with mild to moderate disabilities will be part of mainstream education. Vulnerable and Marginalised Groups National Sphere The NDE reported that its budget allocation targets primarily the disadvantaged groups listed in the protocol.35
34 In this White Paper inclusive education and training:
• Is about acknowledging that all children and youth can learn and that all children and youth need support.
• Is accepting and respecting the fact that all learners are different in some way and have different learning needs which are equally valued and an ordinary part of human experience.
• Is about enabling education structures, systems and learning methodologies to meet the needs of all learners.
• Acknowledging and respecting differences in learners, whether due to age, gender, ethnicity, language, class, disability or HIV status.
• Is broader than formal schooling and acknowledges that learning also occurs in the home and community, and with formal and informal modes and structures.
• Is about changing attitudes, behaviour, teaching methodologies, curricula and the environment to meet the needs of all learners.
• Is about maximizing the participation of all learners in the culture and the curricula of educational institutions and uncovering and minimizing barriers to learning.
• Is about empowering learners by developing their individual strengths and enabling them to participate critically in the process of learning.
35 The following are the vulnerable and marginalized groups listed in the protocol for ELSEN: a) learners living in rural areas b) learners living in informal settlements learners from low-income groups c) homeless learners f) learners from racial groups disadvantaged by past discriminatory laws and practices

Right to Education – Period: April 2000 – March 2002
270
Vulnerable and Marginalsed Groups Provincial Sphere The ECDE expressed consideration for the needs of the disabled learners as it provided appropriate facilities such as the brailed materials for the blind. The FSDE’s policy initiatives do consider the vulnerable and marginalised groups, including their own learners, “learners with disabilities.” Other departments such as Social Development and Health are also involved in assisting the FSDE to meet the needs of the disabled learners. Learners from unemployed and semi-employed parents within the low-income groups are placed in the “place of safety” and others are placed in normal schools. The learners who have made their disadvantaged financial status known are referred to the agencies (feeding schemes) to be contacted and can also apply for exemption from paying the school fees. The GDE reported that its policies are sensitive to the plight of the vulnerable and marginalised groups such that a top slice amount of the budget was paid to low-income groups. Transport for rural-based learners is also subsidised. The New Nation School project subsidised by government caters for homeless learners. The KZNDEC reported that a formula is used to determine allocation of subsidies to Special Schools. The formula categorises disabilities and gives each of them a weighting and this, influences allocation of funds to each category. Issues such as equity, equality and quality are also taken into account. A redress allowance has also been instituted for previously disadvantaged schools and it recognises all the vulnerable and marginalised groups’ needs. The allowance benefits 10 percent poorest of the poor learners. The MDE reported that its policies are sensitive to all the vulnerable and marginalised groups without stating how the policies achieve that. The NCDE reported that the budget allocations targeted the increased access to learners in areas where access was minimal, for example, rural areas, informal settlements, farms, and previously disadvantaged communities. The WCDE reported that its policies consider the conditions of the vulnerable groups. For instance, the “homeless learners”, “learners living in informal settlements”, and “learners living in rural areas” are accommodated in hostels. The department allocates more than 7 percent of its total budget to ELSEN. Admissions Policy As mentioned earlier,36 the change in age requirement for admission to public schools for Grade One learners has an impact on the age requirement for Reception Year learners. Since the Constitutional Court ruling reversing the age requirement for admission to public schools for Grade One learners to five turning six in the year of admission, it stands to reason that the Reception Year age requirement for admission had to change as well. National Norms and Standards for School Funding It is important to note that only the GDE reported on this policy. This does not necessarily mean that only the GDE implemented the policy; instead, it either means
36 Refer to the section on ECD in this chapter.

Right to Education – Period: April 2000 – March 2002
271
that the rest of the provinces have been implementing the policy the same way they have been doing since its inception in 1999 or they simply did not report on the policy. This policy helps the NDE to allocate critical non-personnel funds for public schools. It makes provision for three categories of expenditure, namely, maintenance of school buildings, providing municipal services and utilities and learner support materials.37 Paragraph 117 states that schools should provide each learner with a basic package of R100 for support materials. If funds are insufficient for this purpose, the provincial education departments must consider first the most needy learners.38 Each school is ranked in accordance with the following factors: poverty of the community and poverty of the school. The policy enables the PEDs to distinguish between schools on the basis of the socio-economic status of learners as well as differences reflecting broader physical conditions of schools. After all, these indicators/ factors have been taken into account; resource allocation is undertaken on a progressive scale targeting the poorest learners in each province. Each PED is required to produce a “resource targeting table” based on schools’ ranking on the socio-economic status of learners as well as physical conditions at schools. Each of these terms, the factors/indicators referred to above, lend themselves to different interpretations. The definition of a term determines funding allocation. For instance, if a PED defines “community” as the geographical location of the school, it therefore means that a particular school’s funding will be allocated according to that area’s socio-economic status. The problem with this approach is that poor learners may be allocated relatively insufficient funding simply because they happen to attend a school that is situated in an area that is generally not considered poor. However, the GDE should be commended for their position on this issue.
Gauteng argues that learners who move from disadvantaged schools to advantaged schools did so out of choice, and this will not necessarily mean that such schools will be positively ranked on the poverty criteria. It is only when learners from disadvantaged areas moved because there are no alternatives, that the Gauteng Department of Education will be willing to allow funding to follow learners. It is thus only this percentage of learners in their newly placed schools that will gain the benefit of redress funding, and not the whole school as such. 39
It is important for all the PEDs to remember the main objective of this policy, which is to redistribute recurrent non-personnel resources to the most needy learners within each province. The policy is not about enriching schools. The challenge remains for most provinces to come up with innovative indicators that will only take into account factors peculiar to each poor learner and school. For instance, the WCDE and the NCDE do recognise the fact that their schools have relatively good municipal
37 Russell Andrew Wildeman, Redistribution of School Funding, Budget Information Service, Budget Brief No. 48, September, 2000. (http://www.idasa.org.za/bis/). Visited on 12 July 2002. 38 Ibid. 39 Wildeman, 2000, op. cit., p. 2.

Right to Education – Period: April 2000 – March 2002
272
infrastructure and as such, both these provinces plan to significantly reduce their weighting of municipal services in their indexes. It is equally important to consider the fact that some provinces have more personnel than others such that the bulk of their funds go towards paying personnel. KwaZulu-Natal is one such province. One way to address this challenge is that such provinces should be allocated more redress funding to target the poor learners as well as satisfy their school needs. Lastly, the use of a continuous scale in allocating funds for poor learners is crucial as it vigorously targets the poorest of the poor learners. The National Policy on Whole School Evaluation One of the principles on which the policy is based refers to inputs, processes and outcomes as elements to be evaluated. One of these elements has “the quality of leadership and management” as one of the sub-elements. The NDE should be realistic about its expectations. Efforts have to be made to ensure that school management teams are trained in this particular aspect. It is also a concern that the policy goes into detail explaining how school evaluation supervisors would be trained. Surprisingly, the policy does not mention the training of teachers and school governing bodies on the Whole School Evaluation Policy. It is good and well to formulate policies that are aimed at improving teaching and learning in schools, but it is equally important to ensure that ways and means are devised to help familiarise policy practitioners with key aspects of such policies. Draft Policy for the Management of Drug Abuse by Learners in Schools (2002) The NDE did not mention this important and positive draft policy framework given the common usage of drugs in schools nowadays. The Council of Education Ministers released the draft policy framework in March 2002. According to this draft policy, learners have to be helped to deal with their addiction, while at the same time protecting non-users. The draft states:
The key thrust of the policy is to help and support not only those learners who abuse drugs, but also the majority of learners and staff who do not use drugs but who may be affected by the usage of drugs by others.40
The framework complements other related policies and legislation such as the Regulations for Safety Measures at Public Schools, Government Gazette No.22754 of 12 October 2001 and the National Drug Master Plan 1999 –2004, which deals with the control and management of drug abuse in schools. The government must be commended for the efforts it is making in fighting drug abuse in schools, even if the implementation of the policy has yet to cascade through the various levels of the education system. This will ensure a conducive learning environment, and thus access to the right to education. .
40 Department of Education (DoE), Tirisano: Working together, Draft Policy Framework For The Management Of Drug Abuse By Learners In Schools, March, 2002. (http://education.pwv.gov.za/Policies%20and%20Reports/Po…/draft%20drug%20abuse.ht). Visited on 20 July 2002.

Right to Education – Period: April 2000 – March 2002
273
The Manifesto on Values and Education Democracy The manifesto was released in July 2001. It is one other important policy development in the education sector, particularly for the GET and FET bands. It promotes values through the country’s education system. The following are the six values that the policy is promoting, namely: equity, tolerance, multilingualism, openness, accountability and social honour. Each of these values is elaborated upon in the Report of the Working Group on Values in Education.41 The report explains the strategies on how these values could be taught in schools. The report takes these values further and explores them to include ideals and concepts such as democracy, social justice, equality, non-racism and non-sexism, ubuntu (human dignity), the rule of law, and reconciliation.42 It is only fair and reasonable to remark that the policy is desirable and is a step in the right direction for correcting past inequalities in education. This initiative conforms to Commitment 6 (j) of the Copenhagen Declaration and Programme of Action.43 It provides that “… at the national level, we will:
Develop broad-based education programmes that promote and strengthen respect for all human rights and fundamental freedoms, including the right to development, promote the values of tolerance, responsibility and respect for the diversity and rights of others, and provide training in peaceful conflict resolution, in recognition of the United Nations Decade for Human Rights Education (1995 – 2000).
Constitutional obligations National Sphere Respect According to the NDE, the provision of early childhood development opportunities, general school education, education for learners with special needs, literacy and adult basic education, which are fundamental to the right to a basic education, testifies to the fact that the department’s policy and programmatic measures and/or projects respect the right to a basic education. Protect The NDE indicated that SANLI, the White Papers on ECD and Inclusion of Children with Special Needs did not completely protect the right to a basic education. The NDE further stated that plans and resources for universal access to inclusive education and early childhood development opportunities were put in place. Also, the NDE
41 Report of the Working Group on Values in Education, Values, Education and Democracy, 2000. 42 The Report of the Working Group on Values in Education. (http://education.pwv.gov.za/DoE_Sites/Curriculum/Values/Executive_Summary.htm). Visited on 26 July 2002. 43 The Copenhagen Declaration and Programme of Action: World Summit for Social Development, 6 – 12 March, United Nations, 1995.

Right to Education – Period: April 2000 – March 2002
274
noted that universal literacy and adult education require additional private resources for its expansion. Promote and to Fulfil The NDE stated that it promotes the right to a basic education; although it does not fulfil that right totally. Provincial Sphere44 Respect To illustrate that it respect the right to a basic education, the ECDE, as prescribed in the White Paper on Inclusive Education, allows learners who are barred from learning and development to be accommodated in the mainstream education system. The availability of the ECD and OBE serve as examples of how the ECDE respects the right to a basic education. . According to the FSDE the Policy on Learner Pregnancy entrenches the respect for the right to a basic education in that it gives the pregnant learner the right to receive education even during pregnancy. The GDE referred to the provision of ECD by the state as a measure that respects the right to education. The White Paper on ECD provides for the universal expansion of learning opportunities within the ten years of compulsory GET. The MDE reported that it adopted the White Paper on Inclusive Education as it purports that education be offered to all learners and potential learners regardless of, among other factors, their disabilities and socio-economic conditions. On the other hand, the NCDE asserted that the White Paper on ECD strongly addresses improvement of access for learners and support to ECD Centres, that the White Paper on Inclusive Education makes quality education accessible to all learners. The NWDE reported that the provision of ABET is proof that it respects the right to education. Meanwhile, the WCDE indicated that Circular 0003/02 on the Admission of Under-Age Learners to Public Primary Schools provided a uniform process and clear procedures that respect the right to education by ensuring that any child that was school-ready, could be enrolled in Grade One. Protect The ECDE saw the provision of the Reception Year, which advocates for the provision of a tenth year of schooling, as provided in the Education White Paper on ECD, as an illustration of how the department protects the right to basic education. On the other hand, the GDE referred to the Misconduct of Learners at Public Schools and Disciplinary Proceedings Policy for the same purpose. According to the
44 These are the only provinces that tried to give better responses to questions on the constitutional obligations. The rest of the provinces either gave unclear or no responses to questions on this subject.
Right to Education – Period: April 2000 – March 2002
275
department, the White Paper on Inclusive Education also meets the obligation to protect the learner’s right to basic education by ensuring that every school accepts any child that is physically challenged. The WCDE also used Circular 0003/02 on the Admission of Under-Age Learners to Public Primary Schools because it (the Circular), through its clear procedures, allows parents to appeal to the Member of Executive Committee (MEC) for Education regarding their child’s school-readiness. Promote and to Fulfil The ECDE stated that the introduction of the White Paper on ECD into the education landscape is an indication that the South African education system recognises the need for a formal programme of School Readiness in order to address problems such as the low matriculation pass rate, school drop-outs, to name but these two. As a result, all the provinces are required to advocate the policy. The FSDE stated that the Policy on Injury of Learners in Public Schools ensures that learners are not neglected during school activities. According to the FSDE, the policy has the effect of protecting, promoting and fulfiling the right to basic education. The GDE stated that the Misconduct of Learners in Public Schools and Disciplinary Proceedings Policy does meet the obligation to promote and fulfil the right to basic education because it allows parents to appeal against any decision that excludes learners from school due to disciplinary problems. Also, the GDE has held workshops on learners with disabilities with the aim of changing the attitudes of both the teachers and communities towards these children. The NCDE also cited the White Papers on ECD and Inclusive Education as measures that help promote access to education for those who were discriminated against by the previous laws. The department has also adopted the Whole School Evaluation Policy as another measure that promotes and fulfils the right to education. The WCDE reported that the availability of Circular 0003/02 and media reports promoted the revised admission policy for Grade One, such that where the requirements were met, the child’s right to basic education was fulfilled. Through their responses, it appears that most PEDs are either not aware of the fact that their policy, programmatic, legislative and other related measures to realise the right to education have to comply with section 7(2) of the Constitution, or they have not internalised the constitutional obligations in the implementation of these measures. Whilst most of the policy measures such as the White Papers on Inclusive Education and ECD do meet the constitutional obligations to respect, promote, and fulfil the right to education – they still fail to protect the right to education. The failure by most PEDs to respond to the questions pertaining to the state obligations is a manifestation of two things. Firstly, that at least most government departments have not internalised the state obligations in policy implementation. Secondly, government departments are not aware of the state obligations.

Right to Education – Period: April 2000 – March 2002
276
The Grootboom case serves as a guideline in this regard. In the Grootboom case, it appeared that the government had committed a serious mistake by implementing its “comprehensive” housing programme that failed to cater for the vulnerable and marginalised groups. It would be advisable for senior government officials to guide the implementation of state policy and legislative measures, as well as the completion of the HRC protocols. LEGISLATIVE MEASURES Constitutional obligations45 Respect According to the GDE, the Regulations for the Admission of Learners to Public Schools ensure access to education for every learner by eliminating all discriminatory practices in the admission of learners to public schools. The FSDE reported that the legislative measures enacted during the reporting period meet the obligation to respect the right to education since they give governance structures and school communities the powers to decide and implement education-related measures. Protect46 The FSDE adopted the Regulations on Discipline of Learners to ensure that unruly and disruptive behaviour is dealt with uncompromisingly. To that effect, punitive measures would include suspension or expulsion from school to protect the right of learners to education. Promote and to Fulfil47 According to the GDE the Regulations for the Admission to Public Schools do meet these duties as they accord learners access to education. Furthermore, parents and learners are informed about their rights on matters of discipline. Administrative Action Measures National Sphere The NDE mentioned the Harris vs Minister of Education case in which the Admissions Policy for Public Schools set out in section 3 of the South African Schools Act 84, 1996 was challenged in both the High Court and the Constitutional Court. The appellant argued that the admission age set out in the Act discriminated against learners who were school-ready but under than the age of 7. As a result, the NDE lost the appeal in the Constitutional Court. The Minister and the Council of Education Ministers agreed on an administrative procedure to admit under age learners pending the amendment of the South African Schools Act. The
45 Note that only those provinces which reported on the legislative and related measures that took place during the period under review will be dealt with in this section. The NDE reported that no legislative developments took place during the reporting period. 46 The GDE did not respond to this section. 47 The FSDE did not respond to this section.

Right to Education – Period: April 2000 – March 2002
277
administrative measure was effective as more than 12,000 under age learners were admitted to Grade One in at least two provinces. Provincial Sphere48 The ECDE reported that the only administrative action relates to a few incidents whereby learners missed their lessons because some principals excluded them from attending classes due to non-payment of fees. The department had to instruct the principals to rescind their action. Further, a circular was issued out to schools warning principals to refrain from this action. As a result of the circular, the action has stopped. In light of the above incident, it appears that educators in general have to be aware of the learners’ rights to education. One way this could be done would be to incorporate human rights education into teacher training curriculum. The issue of fees is an important one if the government is serious about achieving its ‘universal education’ goal by 2015. The GDE reported that it did not receive any report from schools in respect of the administrative action that resulted in the violation(s) of learners’ rights to education. However, the department indicated that as principals represent Heads of Department at the school level, some violations of the provisions of the Admissions Policy were noted that could have negatively influenced a learner’s right of access to basic education. The fact that some schools do not acknowledge in writing the receipt of a parent’s application for admission and whether a learner has been refused admission, may have led to the violation of some learners’ rights to administrative justice. The ongoing monitoring by district officials ensures that critical issues are brought to light and addressed. As indicated above, the department reported no specific violations. However, the Admissions Regulations have been reinforced to strengthen the requirement for administrative justice. The increased nature of the number of appeals being attended to by the GDE is indicative of two factors. Firstly, that parents are increasingly becoming aware of their rights, in terms of the policies/legislation enacted. Secondly, that schools are overlooking some of the critical constitutional provisions that have to be enforced in ensuring that the learners’ right to education is being protected. The LDE reported that the termination of the adult educators’ services on 31 December 2000, and the allocation of their insufficient payment in the financial year 2001/2002, has resulted in a number of Adult Learning Centres suspended. As a result of this administrative action, a great number of adult learners have been denied their right to basic education. The extent of the violation is great, such that about 795 Adult Learning Centres could not operate and about 34,685 adult learners were denied access to education. To address the problem, the LDE educators were encouraged to volunteer their services to some Centres that could not be opened even after the budget had been increased.
48 The Free State, KwaZulu-Natal, Mpumalanga, Northern Cape and the Western Cape provinces did not respond to the questions in this section.

Right to Education – Period: April 2000 – March 2002
278
However, these measures were not that effective, as some volunteers became disillusioned and were frustrated in the process. The increase in budget allocation did not necessarily mean the re-opening of all the closed Centres, and subsequently the rehiring of educators. Using the Grootboom case to assess the reasonableness of the ABET Programme, one may conclude that the implementation of the ABET Programme in Limpopo was unreasonable as a measure to progressively realise the right to basic education for adult learners. In Grootboom, though the right of access to adequate housing was the focal point, it was said that:
The state was obliged to act to achieve the intended result, and the legislative measures would invariably have to be supported by appropriate, well-directed policies and programmes implemented by the executive. These policies and programmes had to be reasonable both in their conception and their implementation. An otherwise reasonable programme that was not implemented reasonably would not constitute compliance with the state’s obligation.
It appears that ABET was well conceived. Nonetheless, the programme is experiencing some serious problems in its implementation. To achieve the progressive realization of the right to a basic education, including adult education, would require that hurdles of any nature, be they financial, administrative, be removed over time. However, the administrative action taken by the LDE compounded the problems engulfing ABET in Limpopo and other provinces. This scenario does not bode well for the progressive realisation of the right to a basic education, including adult basic education. According to the Grootboom judgment, progressive realisation of the right would mean that:
Legal, administrative, operational and financial hurdles should be examined and, where possible, lowered over time. It (the requirement) imposed an obligation to move as expeditiously and effectively as possible towards the goal.
It is not convincing that the Limpopo province exhausted all the available resources at their disposal to progressively realise the right to basic education, including ABET. This is indicated by the number of Adult Learning Centres as well as the number of adult learners that were affected when these Centres were closed down, which is symptomatic of the implementation challenges facing the department. However, due to the fact that the LDE did not provide the number of adult learners that were left without education after the closure of the Learning Centers, one cannot establish how many were reopened when ABET received more funding.
As to the words ‘within available resources’, these conveyed that the content of the obligation in relation to the rate at which the desired result was achieved as well as the reasonableness of the measures

Right to Education – Period: April 2000 – March 2002
279
employed to achieve the result were governed by the availability of resources.49
The NWDE reported that the LSMs and the School Building Programme were under-funded. Despite all these challenges, the NWDE raised, via the MEC for Education, the issue of electricity and water as the major cost-drivers of the schools expenditure with Council of Education Ministers. The Minister of Education is still dealing with the matter through service providers such as Water Affairs and Forestry and Eskom. The area of ECD was another one that needed restructuring. The NWDE reported that its province is the only one that inherited an ECD model from the former Bophuthatswana government. Generally, the personnel in this sector of education were under-qualified. There were other problems as well, such as ECD co-ordination; lack of proper syllabus for ECD; and inadequate funding of ECD provision. However, the NWDE was to discuss this issue on the 3rd of June 2002 for the 2003 academic year. The NWDE reported that it was invisaged that 2002/2003 financial year, an amount of R54 million would be committed to 15 projects in 15 schools in the North West in the 2002/2003 financial year. This would at least lower the infrastructure and LSMs backlogs, amongst other things, if the funds allocated to the NWDE are utilised properly. However, in his quarterly report to the provinces, the Minister of Education made the following remark on expenditure in the School Building programme.
A disturbing observation is the low level of expenditure in the Free State (17 percent) and North West (11percent). Most of the provinces have exceeded the 40 per cent expenditure level. The low level of expenditure may be an indication of the state of the financial management systems in the provincial department.
The situation in North West and Free State signifies what is happening generally in the delivery of the right to education, that the government does not necessarily need to inject more funds for the realisation of the right to education, but instead, that the PEDS must improve their financial management skills. The Financial Management and Quality Enhancement grant should be utilised properly to help people improve on their financial management skills. Regarding the ECD provision, it is disturbing that the NWDE had problems such as lack of curriculum for ECD and its co-ordination when the ECD pilot project that was launched in 1997 and ran until 2000 was meant to have addressed such problems in the first place. The ECD Conditional Grant allocation to provinces was R21 million for 2001/2002, R52 million for 2002/2003 and R88 million for 2003/2004. According to the study undertaken by IDASA Children’s Budget project,50 funding for ECD is insufficient; it needs to be increased.
49Wildeman,op.cit. 50 Shaamela Cassiem and Judith Streak, Budgeting for child socio-economic rights: Government obligations and the child rights to social security and education, IDASA, 2001.

Right to Education – Period: April 2000 – March 2002
280
Provincial Sphere51 Gauteng, KwaZulu-Natal, and North West came up with some commendable steps to address issues such as financial impropriety, maladministration and/or corruption, and poor resources management. Gauteng reported that the general labour relations processes and the approved disciplinary code for dealing with acts of maladministration and corruption committed by public servants as and when necessary to deal with such issues. Furthermore, the Provincial Treasury has also established a toll free number encouraging whistle-blowers to report acts of corruption anonymously. The efficacy of the measures is yet to be determined given that there has not been any official complaint reported to the GDE. The KZNDEC introduced the following measures to address and prevent maladministration and/or corruption:
• Appointed a Chief Financial Officer; • Introduced extensive additional financial control measures, and asset and
personnel management systems; • Promoted the reporting of fraud, corruption, and maladministration; and • Resolved to take effective steps against convicted transgressors.
The NWDE, on the other hand, investigated claims of financial mismanagement, corruption, financial impropriety, and poor resource management in no less than 13 schools. Both in-house and independent auditors have been deployed for this purpose. The NWDE has put in place a crime whistleblower hotline to deal with corruption within the schooling system. Further, a policy research with a forensic audit into the current ABET provisioning has also been instituted. This was done to strengthen the provision of ABET so that adult learners get value for money. Budgetary Measures National Sphere There are different causes of under-expenditure that appear in table 2 on the budgetary measures. Nevertheless, there are three salient causes of under-expenditure. They are:
• lack of expertise in the procurement processes; • poor logistics planning; and • poor financial planning.
51 Limpopo, Mpumalanga, Northern Cape, North West, and the Western Cape provinces did not respond to the questions in this section. The NDE responded by saying that they did not receive any official complaints of maladministration and/or corruption from the PEDs during the reporting period, and that only the PEDS would be in possession of such information. The Eastern Cape, Free State, and Gauteng provinces reported that they also did not receive any official complaints of maladministration and/or corruption from schools during the reporting period.
Right to Education – Period: April 2000 – March 2002
281
This state of affairs should not be acceptable, given the importance of education as well as the level of poverty in this country.52 Poor logistics planning leads to inaccurate financial planning that results in tarnished balance sheets. Some departments end up under-spending simply because they request more funds when there are adjustments to the initial allocation. The procurement processes is increasingly becoming a cause for concern across government departments. For instance, there is delay in the tendering processes. Specifically, the ECDE delayed a procurement process and distribution for the acquisition of LSMs due to deviation from correct procurement procedures. Hence, the NDE had to halt funding for the LSMs delivery tender. It must be understood that under-spending in general, does not only compromise initiatives and processes aimed at improving education provision, but the recipients of such an education. The under-spent funds could have been used in other areas of need in an efficient and effective manner. Another often mentioned cause of under-expenditure is the high turnover of personnel in the department, particularly non-personnel, non-teaching employees. According to the Minister of Education, the situation varies from province to province with regard to regional, district and circuit offices. At this level, the vacancies account for approximately 40 percent of the approved establishment. The majority of these vacancies are for support staff.53 It is apparent from the NDE’s responses that there is a lack of expertise in the area of business planning. Whilst the late request by the LDE to deviate from the original business plans of the National School Building Programme and the Backlog in Classrooms Project to include other schools, lends itself to suspicion of this weakness one cannot conclude on lack of expertise in business planning. However, the Minister makes an important observation in his quarterly report on the provinces to the President:
Provincial departments have been very slow in submitting their business plans. In some cases, the plans are no more than descriptions of what the departments expect to do without any quantitative information provided. This may also be due to either lack of expertise in drawing up business plans or in extreme cases plans that have not been completed.54
52 In the 2002 Estimates of National Expenditure, Vote 15: Education document, it is said that Education is pivotal to economic prosperity, plays a crucial role in improving quality of life and contributes to a peaceful, productive and democratic nation. 53 Kader Asmal, MP, Fifth Report on the Provinces to the President from the Minister of Education, May, 2002. 54 Ibid.

Right to Education – Period: April 2000 – March 2002
282
Provincial Sphere55 The ECDE reported that the budget was adequate, yet it over spent the funds. This over-spending is not even reflected in the table. Instead, the table only reflects under-spending during 2000/2001 and 2001/2002. The FSDE had a surplus of R163, 230 million during 2000/2001. A breakdown of this amount given by the FSDE is confusing and actually amounts to more than the amount it claims to have under-spent. Without mentioning the figures that were followed by a confusing explanation on under-spending, a conclusion can be drawn that the FSDE struggled with financial planning and management. It is impossible to mention the area in which the alleged difficulties in financial management were encountered because the department did not specify what the under-spent conditional grant was for. In 2001/2002 some commitments were not paid off which still displays a persistent financial management problem within this department. The overall amount that was under-spent by the FSDE in 2001/2002 was R208 553 million. This is disturbing because during the financial year in question the province had 394 schools that needed 1,759 classrooms.56 Again, this shows that under-spending in any area delays the efficient and effective use of funds where they are needed most. In 2000/2001 the KZNDEC experienced some sharp under-spending. In its response, the department did not account for the under-spending that occurred in the subsequent financial year. The Minister’s report to the President revealed that overcrowding was occurring at more than 2,900 schools in this province, and that between 1 April 2001 and March 2002, it was ‘anticipated that 1,596 new toilet units would be completed.’57 It defies logic to find out that a province that is experiencing so many backlogs in capital projects under-spent by a significant amount in the above-mentioned financial year. The NCDE over-expenditure in 2000/2001 would have been justified given that it reported that during the financial year in question its budget allocation was inadequate. However, its about-turn statement that the improved control over expenditure could be seen as the most important reason for addressing budget inadequacies nullifies their rationale for over-expenditure during 2000/2001. The implication is that the budget allocated for these financial years might have been adequate, but because of weak financial management systems the funds were over-spent.58 It is also a problem that the department did not reflect the actual expenditure figure. Again, the department is citing an adequate budget allocation in 2001/2002 without writing down the actual expenditure figure. One needs to know by how much the 55 Gauteng, Limpopo, and Mpumalanga did not respond to the questions on budgetary measures. Therefore, the only PEDs that are going to be discussed here are those that responded to the questions that were asked in this section. 56 Asmal, 2002, op cit., p. 21. 57 Asmal, 2002, op. cit. p. 22. 58 Note that the department uses the term “financial administration” instead of “financial management.” Financial administration simply refers to a process wherein the keeping of financial records takes place, whereas, financial management refers to a process wherein not only the keeping of financial records matters but wherein sound financial decision-making matters most.

Right to Education – Period: April 2000 – March 2002
283
department over-spent, and to find out if the over-spending was within or outside the National Treasury-prescribed deviation. Such information, if used properly, can be used to help the department improve on its financial management systems. Primary School Nutrition Programme Studying the table on budgetary measures for the DoH’s Primary School Nutrition Programme, one immediately notices the constant budget allocation of R582 411 000 in three consecutive financial years. Another striking factor is the level of expenditure in all the financial years. It would not be an unreasonable expectation that at least in 2001/2002 the level of expenditure improved; that is, at least surpass that of 2000/2001. This remark does not suggest that actual expenditure in this programme has been poor. On the contrary, the programme is one of those that have done well in terms of spending the financial resources allocated it. Another disturbing factor is the reportedly outdated index used to allocate funds to the programme. It is inconceivable that the DoH is currently relying on the outdated index for funds allocation. It was reported that the index did not include nutritional indicators, latest census figures, and poverty data. The possibility is that some of the learners who should have benefited from the programme may have been excluded from it, and as such, the programme risks the possibility of missing the target. Because there was no implementation, the programme could not be said to have been reasonable.
An otherwise reasonable programme that was not implemented reasonably would not constitute compliance with the state’s obligations.
The reference to the quotation above does not suggest that the department is failing the Grootboom test of reasonableness. The quotation serves to caution the department that if all the above-mentioned shortcomings are not heeded immediately, the department could well be on its way to failure in the process of contributing to the progressive realisation of the right to education. It is important that state organs take section 7 (2) of the Constitution59 seriously. Basing the caution on the Constitution again, the following is said in Grootboom:
The Constitution required that everyone be treated with care and concern. If the measures, though statistically successful, failed to respond to the needs of those most desperate, they might not pass the test.
The ‘test’, as explained in Grootboom, refers to the reasonableness. It is ironical for the DoH and the ECDE to say that the budget allocation for the programme was inadequate when there was under-spending in both the two the two financial years. Nonetheless, as said earlier, the level of actual expenditure was reasonable in this programme. Studying the figures provided by the DoH in the table,
59 The Committee on Economic, Social and Cultural Rights, General Comment No. 13, op.cit.
Right to Education – Period: April 2000 – March 2002
284
it seems the DoH does not necessarily need more funds; rather, it needs to spend the funds allocated to it better. The same holds for all the PEDs. Education about HIV/AIDS Programme The under-spending levels experienced by the NDE in the HIV/AIDS education programme (also referred to as Life Skills and HIV/AIDS Programme) are vast. The rationale for such vast expenditure levels is not sufficiently explained in the department’s response. To a large extent, the KwaZulu-Natal and Gauteng PEDs reflect the common problems experienced by all provinces with regards to delivery on the Life Skills and HIV/AIDS Programme. A remark by the Minister of Education in his quarterly report on the provinces to the President attest to this fact:
A common explanation that is cited in the reports from provincial departments of education for under-expenditure is the lack of capacity and the associated difficulty with tender processes that result in delays regarding the procurement of services and goods. The Department of Education plans to focus on the co-ordination, planning and monitoring of the grant to the same extent it has done with the process of co-ordination of the grants for financial management and quality enhancement of education that has proved to be successful.
Education for Learners with Special Education Needs (ELSEN) There are many instances when there are delays in the transfer of funds from one sphere of government to the other. The problem is that the causes of these delays of transfer of funds between spheres of government are not mentioned in the report Consequently, it becomes difficult for one to provide a solution to such a problem. The response given by the FSDE on the vulnerable and marginalised groups, specifically on “learners from low-income groups” is confusing and contradictory. Having reported that the its policies are responsive towards the needs of the vulnerable and marginalised groups, the FSDE said in one of its responses that some parents had to de-register their children from Special Schools, as they could not afford the fees. If some learners could be accommodated in a “place of safety,” why couldn’t the department give those who could not afford the fees some recourse? The White Paper on Inclusive Education is aimed at mainstreaming the disabled learners with mild and moderate disabilities into public ordinary schools whilst those with severe disabilities are catered for in the Resource Centers. Another concern is that if schools accept disabled learners without any professional advice this has the potential to create more problems for both “normal” and disabled learners. This situation should not have gone unchallenged. Studying the table on budgetary measures for ELSEN, it seems that more provinces need more funding to provide quality education to learners. However, such funding should be distributed equitably across the provinces. For instance, the Western Cape,
Right to Education – Period: April 2000 – March 2002
285
with one of the highest shares of schools, spends the largest share of all the provinces on ELSEN as a percentage of total provincial education expenditure, yet this province has one of the lowest shares of learners with special needs. Ironically, provinces such as the Eastern Cape with 17 percent of the provincial share of learners, only records 10, 7 percent of the provincial share of schools. Gauteng, with the third highest provincial share of learners, has the highest share of schools and allocates the second highest provincial expenditure for special needs education.60 Another challenge facing government in the provision of special education is the question of access. It is estimated that South Africa has approximately 400,000 children that are eligible for Special Needs Education. However, current statistics indicate that only about 16 percent of learners with disabilities or impairments are enrolled in approximately 380 Special Needs Schools.61 7. RECOMMENDATIONS Government departments need to take the issue of skills development and staffing seriously if they are to carry out policies properly. Policies may be good on paper, but if the operational and logistical aspects are not given attention, the likelihood is that the implementation of such policies will flounder. With the introduction of the White Papers on Inclusive Education and ECD, it is highly anticipated that the government will have to allocate even more financial resources into the education system. However, the challenge for the PEDs to spend better still remains. The injection of more financial resources into the schooling system is not a solution to the problems experienced by the sector; better use of the allocated financial resources is key to the progressive realisation of the right to education. The Quality and Enhancement and Financial Management Conditional Grant must be put to good use so that it achieves its intended objectives. Cassiem et al., 2001 had the following to say regarding the use of the grant by some PEDs:
Evidence suggests that many provincial education departments have used this conditional grant as additional revenue for general spending, rather than applying the allocation in line with the intentions and conditions of the grant. It has been suggested that the conditionality of grants must be tightened – for example, that each provincial department first submits a business plan including financial projections, before access to the grant is approved.62
All the PEDs, including the NDE should have the statistical information on indicators and NAP. The availability of such information is important, as most of it should be used as a tool to measure the government’s progress in a number of programmes aimed at improving the education system in the country as well as make its targets visible. 60 Cassiem et al., 2001, op. cit., p. 156. 61 Ibid. 62 Asmal, 2002, op.cit.

Right to Education – Period: April 2000 – March 2002
286
If most government departments do not have such information available, a conclusion can be drawn that they are operating in the dark. Government must be in a position to gauge itself - it must be in a position to determine how far it is from reaching its target. Moreover, such information is valuable and required for policy planning purposes. The Maastricht Guidelines, in terms of obligations of conduct and result, reinforce this point as well:
The obligation of conduct requires action reasonably calculated to realise the enjoyment of a particular right. In the case of the right to health, for example, the obligation of conduct could involve the adoption and implementation of a plan of action to reduce maternal mortality. The obligation of result requires states to achieve specific targets to satisfy a detailed substantive standard.63
8. CONCLUSION A number of issues have emerged out of the reports from the different PEDs. However, it has always been easy to note the sincere endeavour made by the state to improve schooling in the country. The fact that South Africa spends 6 percent of its Gross Domestic Product on education, which, according to Cassiem et al., is the highest proportion worldwide, is commendable. The introduction of the White Papers on Inclusive Education and ECD in the schooling system, and other programmes such as Life Skills and HIV/AIDS, LSMs and School Building is an indication that the state is committed to the achievement of better education. What happened in Limpopo in 2000, that 795 Adult Learning Centers had to be closed down stranding 34,685 adult learners, should be corrected as it constituted a serious violation of the right to adult basic education. The situation warrants the state’s attention. It should not be allowed to discredit the state for all it has achieved towards the realisation of the right to education during the reporting period. The challenges confronting the PEDs include the creative use of policy to achieve the intended objectives. An observation has been made that generally, all the state programmes in the schooling system are characterised by more under-expenditure than over-expenditure. Whilst neither of the two is preferred, it can be said that for the PEDs to request more financial resources they still have to demonstrate that they can spend their budget allocations better.
63 ESCR Document Database Maastricht Guidelines on Violations of Economic, Social and Cultural Rights, Maastricht, 22 – 26 January 1997.

Right to Education – Period: April 2000 – March 2002
287
ABBREVIATIONS ABET Adult Basic Education and Training CRC The Convention on the Rights of the Child, 1989 CSATDP Canada South Africa Teacher Development Programme DoE Department of Education DoH Department of Health ECD Early Childhood Development ECDE Eastern Cape Department of Education ELSEN Education for Learners with Special Education Needs EMIS Education Management Information System FET Further Education and Training FSDE Free State Department of Education GET General Education and Training HET Higher Education and Training HRC Human Rights Commission INP Integrated Nutrition Programme KZNDEC KwaZulu-Natal Department of Education and Culture LDE Limpopo Department of Education LSEN Learners with Special Education Needs LSMs Leaner Support Materials MDE Mpumalanga Department of Education MEC Member of Executive Council NAP National Action Plan NCDE Northern Cape Department of Education NDE National Department of Education NGOs Non-governmental Organisations NWDE North West Department of Education OBE Outcomes Based Education PDIs Previously Disadvantaged Individuals PEDs Provincial Education Departments PSNP Primary School Nutrition Programme SANLI South African National Literacy Initiative WCDE Western Cape Department of Education

Right to Education – Period: April 2000 – March 2002
288
FURTHER EDUCATION AND TRAINING (FET) 1. POLICY64 AND PROGRAMMATIC MEASURES National Sphere The National Department of Education (NDE) reported that during the period under review65 it implemented the New Institutional Landscape for FET Institutions programme: The Reform of South Africa’s Technical Colleges. The programme is about restructuring the Technical Colleges sector to serve both the social and economic needs of the country. Provincial Sphere The Eastern Cape Department of Education (ECDE) implemented the Draft Framework for Qualifications and Programme for Public FET Colleges and the Draft National Curriculum Statement. The Gauteng Department of Education (GDE) developed a number of draft policies during the reporting period. All these draft policies are based on different sections of the FET Act 98, 1998. They are as follows:
• Draft Interim Policy based on section 11 of the FET Act: Determination of Learning Programmes at Public FET Institutions
• Draft Interim Policy based on section 15 of the FET Act: Student Representative Council (SRC)
• Draft Interim Policy based on section 16 of the FET Act: Disciplinary Measures
• Draft Interim Policy based on section 17 of the FET Act: Admission to Public FET Institutions
• Draft Interim Policy based on section 21 of the FET Act: Financial Records and Statements of Public FET Institutions
Determination of Learning Programmes at Public FET Institutions The draft policy empowers the academic board of a Public FET Institution to determine the learning programmes provided by the Public FET Institution and determines the conditions under which the academic board of a Public FET Institution may determine the learning programmes provided by the Public FET Institution.
64 It must be borne in mind that other policy measures that took place during the reporting period in the GET band applied to the FET band as well. Such policy measures will not be repeated in this section of the chapter; they comprise the following:
• Public Schools Admissions Policy • The White Paper on Inclusive Education (2001) • National Norms and Standards for School Funding • Misconduct of Learners at Public Schools and Disciplinary Proceedings (Provincial Notice
2591 of 9 May 2001) • Safety Measures at Public Schools
65 This refers to 1st April 2000 to 31st March 2002.

Right to Education – Period: April 2000 – March 2002
289
Student Representative Council (SRC) The aim of this draft policy is twofold. It is to:
• ensure that a policy for the establishment of an SRC is determined at every Public FET Institution by its Council after consultation with the students and educators of that institution; and
• ensure that policies, after consultation with learners and educators of that institution, are determined by its Council for the composition of an SRC; the manner of election of an SRC; the functions of an SRC; and the privileges of an SRC.
Disciplinary Measures
The aim of the draft policy is to ensure that the Council of every Public FET Institution determines a Code of Conduct that every student at a Public FET Institution is subjected to. The Council of every Public FET Institution determines disciplinary measures and procedures and that the Code of Conduct, disciplinary measures and procedures may only be made after consultation with the academic board of the institution concerned. Admission to Public FET Institutions
The draft policy aims to ensure that the Council of every Public FET Institution, after consultation with the academic board of the institution, determines the Admission Policy.
Financial Records and Statements of Public FET Institutions
The aim of the draft policy is threefold. It is to:
• ensure that the Council of a Public FET Institution keeps records of all assets, liabilities, income and expenses and any other financial transactions of the Public FET institution as a whole; of its sub-structures; and of other bodies operating under its auspices;
• ensure that the Council of a Public FET Institution appoints an auditor to audit the records and financial statements of the Public FET Institution; and
• ensure that the Council of a Public FET Institution, in respect of the preceding financial year, and by a date or dates and in the manner determined in this policy, provides the Member of Executive Council (MEC) with a report on the overall governance of the institution; a duly audited statement of income and expenditure; a balance sheet and cash flow statement; and any additional information as the MEC may reasonably require.

Right to Education – Period: April 2000 – March 2002
290
The KwaZulu-Natal Department of Education and Culture (KZNDEC) reported that it ran some programmes involving parents in the education of their children. School Governing Bodies were also trained on their related functions. In achieving the above objectives, a number of workshops were conducted to ensure that:
• parents were made aware of their responsibility to ensure that their children attend school.
• strong advocacy initiatives were undertaken to further the aims of the South African Schools Act 84, 1996.
• departmental officials developed the required skills to better serve their communities in ensuring that children do attend school.
To give effect to the FET White Paper 4, 1998, the Northern Cape Department of Education (NCDE) instituted the New Landscape for FET sector: ‘taking up the challenge of developing and maintaining a co-ordinated, flexible and responsive FET Sector of high quality.’ Like the NCDE, the North West Department of Education (NWDE) implemented a New Landscape for Public FET Programme. To this end, 11 Technical Colleges were declared FET Colleges, which are to be merged into multi-sited campuses. The Mpumalanga Department of Education (MDE) implemented the Restructuring of the FET Landscape Policy during the reporting period. The programme saw ten Technical Colleges and one College of Education merged into three FET Colleges. According to the Limpopo Department of Education (LDE), the merger attempts to help the FET Institutions provide a further education that is responsive to the needs of their respective regions. As a result, the LDE engaged in the following:
• Review of FET Curriculum • Establishment of learnerships • Establishment of Career Guidance Centres
The LDE further reported that an Out-of-school Youth Project established two Career Guidance and Placement Centres. 2. LEGISLATIVE MEASURES National Sphere According to the NDE there were no legislative developments that took place during the reporting period at the national level in as far as the FET Sector was concerned. Provincial Sphere66 The KZNDEC reported no major legislative developments took place, except the amendments that were made to existing legislation during the reporting period. The
66 The three provinces in this section are the only provinces that reported on legislative developments and/or amendments thereto.

Right to Education – Period: April 2000 – March 2002
291
amendments were the Education Laws Amendment Act 53 of 2000 and Education Laws Amendment Act 57 of 2001. The LDE reported that it developed Regulations for the Provincial Board for FET. The NWDE gazetted the declaration and merging of the FET Landscape and established the College Councils. 3. BUDGETARY MEASURES National Sphere Table 1 Total budget allocation for the National Department of Education
Year Total allocation in Rand(s)
Allocation as % of GDP
Projected expenditure
Actual expenditure
2000/2001 69 266 000 0.01 - 59 513 000 2001/2002 85 997 000 0.01 - 74 335 000
The dash (-) that the information requested was not made available to the Human Rights Commission. This is applicable to the rest of the tables with the dash (-). Accounting for variance(s)between the financial years The NDE provided an inappropriate response in this section. The response is more on accounting for under-expenditure than on accounting for the variances between the various financial years provided in the table. It reads as follows: In 2000/2001 the NDE incurred an under-expenditure of R9 753 000. The under-expenditure was ascribed to:
• The high personnel in the department; • The appointment of fewer commissions and committees than originally
anticipated; • A delay in the delivery of accounts for printing works; and • Fewer legal services contracted to the Department of Justice than
anticipated. Like in the preceding financial years, in 2001/2002 the department incurred an under-expenditure of R11 662 000. The under-expenditure was ascribed to the following:
• The restructuring of the department; • The delay ionb the filling of vacant posts; • Delays in the implementation of a desktop management software; • The rand/dollar exchange rate as well as the late approval of business plans;
and • The education management Systems Project not commencing in 2001/2001.
Budget Adequacy The NDE indicated satisfaction with the budget allocation since it ‘largely provides a support function.’

Right to Education – Period: April 2000 – March 2002
292
Provincial Sphere Table 2 Budget allocations for provinces67
Name of province
Year Total allocation in Rand(s)
Projected expenditure
Actual expenditure
2000/2001 7 392 231 000 8 571 364 000 7 192 243 2001/2002 8 118 856 000 7 863 493 000 -
Eastern Cape
20002001 8 367 837 000 - 8 172 742 000 2001/2002 9 346 610 000 9 275 000 000 -
KwaZulu-Natal
2000/2001 1 215 229 000 - 1 198 654 000 Mpumalanga 2001/2002 1 334 620 000 - 1 332 467 000
Accounting for variance(s) between the financial years68 The NCDE cited the inflationary tendencies as causes of the variance between the yearly budget allocations. However, they also mentioned that as a percentage of the total provincial budget, the budget has remained relatively constant. Budget Adequacy The ECDE and MDE indicated satisfaction with the budget allocated during the reporting period. The NCDE reported that the budget was inadequate to address their commitments in 1999/2000 and 2000/2001. However, according to the Department, the expenditure in 2001/2002 reflects that the budget was adequate to fulfil basic mandates. Improved control over personnel expenditure also accounted for spending within the budget. The Department further reported that the devolution of responsibilities to Programme Managers resulted in a greater awareness to control expenditure. More funds in the form of Conditional Grants and donor funding assisted in improved service delivery given the limited funds. The WCDE reported that the budget was inadequate such that schools experienced a shortage of teachers, classrooms, books and equipment. Overspending was said to have occurred in “small amounts” though.
67 The KZNDEC responded to the section on budgetary measures precisely the same way they did in the same section in the GET protocol. Therefore, to find out what the response of the KZNDEC is to the questions in this section, the reader should consult the section on budgetary measures in the GET section of this chapter. 68 Both the ECDE and MDE gave inappropriate responses in this section. The ECDE cited two areas as the causes of under-expenditure experienced. The year in which these two causes of the under-expenditure applied was not mentioned. Moreover, it was not explained exactly how one of these caused the under-expenditure. The following are the areas that were said to have caused the under-expenditure:
• the Learning Support Materials (LSMs) programme; and • the delay in the implementation of the School Building programme.
The MDE cited the transformation taking place in the FET band as a cause of under-expenditure since staff could not be appointed. The specific financial years in which this applied were not mentioned. Worst of all, the GDE, LDE and NWDE did not respond to the questions that relate to budgetary measures.

Right to Education – Period: April 2000 – March 2002
293
Table 3 Total budget allocation for Technical Colleges Name of province
Year Total allocation in Rand(s)
Projected expenditure
Actual expenditure
2000/2001 246 528 000 - 221 875 000 2001/2002 258 014 168 - 252 854 000
Gauteng
2000/2001 8 172 742 124 000 00 - 2001/2002 9 346 610 127 700 00 -
KwaZulu- Natal
2000/2001 51 678 000 - 44 003 000 2001/2002 57 140 000 - 50 993 000
Mpumalanga
2000/2001 20 603 000 20 603 000 18 279 577 2001/2002 20 323 000 20 323 000 19 025 350
Northern Cape
2000/2001 60 625 000 51 124 000 - 2001/2002 60 625 000 60 625 000 -
North West
2000/2001 11 046 000 - 11 410 2000 Western Cape 2001/2002 12 516 000 - 12 585 9000
Accounting for variance(s) between the financial years The GDE ascribed the variances to growth of learner numbers, which contributed to the need for more funds in the sector. The LDE, MDE and the NCDE did not respond to the questions related to the programme. According to the NWDE, the increase in budget allocation in 2000/2001 was as a result of the filling of vacant posts in Technical Colleges. Budget Adequacy The GDE reported that the budget was inadequate and as a result thereof, a request for more funds was lodged with the Budget Control section of the department. For the department to spend better, it resolved to pay off its debts within a financial year period. Furthermore, the department improved on its expenditure patterns by introducing a performance system that linked financial resources to policy priorities as well as introduced new procurement systems to expedite procurement processes. To augment inadequate financial resources, the NWDE sought funding from donors and the private sector. The WCDE reported that the budget was inadequate to address its needs. The explanation further said that the real growth on the funding of Technical Colleges was far below the required levels. Nevertheless, the department did not take any significant measures to augment its funds since the allocation to FET Colleges ‘compared favourably with other provinces when expressed as a percentage of the overall education budget.’ It was further reported that no under or over-spending occurred in this programme.

Right to Education – Period: April 2000 – March 2002
294
Table 4 Total Budget Allocations for Secondary Education Name of province
Year Total allocation in Rand(s)
Projected expenditure
Actual expenditure
2000/2001 2 727 258 000 - 2 693 587 000 2001/2002 2 991 951 000 2 953 774 714 -
KwaZulu-Natal
2000/2001 820 500 000 - 803 535 000 2001/2002 850 500 000 - 833 831 000
Mpumalanga
2000/2001 115 696 000 115 696 000 241 697 781 2001/2002 243 199 266 243 199 266 250 777 881
Northern Cape
2000/2001 1 398 246 - 1 253 209 Western Cape 2001/2002 1 367 837 - 1 318 989
Accounting for variance(s) between the financial years69 The KZNDEC reported that the allocations for the programme were based on what was earmarked for the Policy on Norms and Standards for School Funding and calculated in terms of the Resource Targeting Funding Model. The WCDE reported that the savings that it made on the programme was as a result of the school financial year that does not end the same time as the department’s. Budget Adequacy According to the ECDE, much as the budget enabled the department to fulfil some of the needs, it was still inadequate such that a reprioritisation of needs had to be done. The expenditure that was said to have occurred related to procurement processes that could not be finalised before the end of financial year. In the KZNDEC’s view, allocations for the programme have significantly increased over the MTEF period. Furthermore, the department indicated that the under-expenditure that occurred in 2001/2002 has been considerably reduced compared to previous years. However, the department cited the delay in the acquisition of goods and services and improvement and upgrading of physical infrastructure as causes of under-expenditure. The department further reported that delays in the procurement processes have been addressed to assist schools in the expenditure of their funds. The WCDE indicated budget inadequacy. On the variances seen in table 4 above, the department accounts for these by saying that it is surplus that resulted from the department’s prudent fiscal hand.
69 The ECDE, GDE, LDE, MDE, NCDE and the NWDE did not respond to the questions regarding the programme and did not state any reason or reasons for that. However, the NDE and NCDE did fill in the table on the total budget allocation for the programme but did not respond to the questions pertaining to this section.

Right to Education – Period: April 2000 – March 2002
295
Table 5 Budget Allocations for the School Building Programme Province Year Total allocation
in Rand(s) Projected
expenditure Actual
expenditure 2000/2001 75 000 000 75 000 000 75 000 000 2001/2002 248 000 000 248 000 000 296 000 000
Eastern Cape
2000/2001 100 272 000 100 272 000 77 924 000 2001/2002 172 000 00 172 000 00 187 000 00
KwaZulu-Natal
2000/2001 19 965 000 - 11 452 000 2001/2002 34 742 000 - 27 871 000
Mpuma-langa
2000/2001 19 087 000 - 19 087 000 2001/2002 19 712 000 - 19 014 000
Northern Cape
2000/2001 55 338 000 - 58 172 000 Western Cape 2001/2002 92 361 000 - 93 840 000
Accounting for variance(s) between the financial years The ECDE reported that the cause of the variance between the financial years 2000/2001 and 2001/2002 was the commitment to the projects that had to be accomplished in the former financial year. The GDE did not account for the variances between the financial years in the table. The KZNDEC responded to the question on the variance by saying that the funds allocated to building projects are a proportion of what remains after personnel costs have been deducted. As a result of changes in learner-educator ratio, capital costs have also been fluctuating during the reporting period. The NCDE reported that the budget allocations have been relatively consistent and that delivery has been accelerated through donor funding and conditional grants. Budget Adequacy The ECDE indicated that the Eastern Cape province had huge backlogs in the provision of classrooms as a result of financial constraints. However, presentations were made to the Budget Committee as well as Provincial and National Treasuries. Donor funding was also mobilised from organisations such as the European Union and British Department for International Development. In order to address any under-expenditure in future, the department appointed implementing agents to facilitate the timeous implementation of projects. The GDE indicated that the budget has always been inadequate since allocations for the programme are based on a priority list that is compiled on a yearly basis. The allocated financial resources normally do not cover the prioritised projects such that there are always backlogs in the provision of school buildings. According to the GDE, the backlogs in the provision of school buildings have increased due to under-expenditure. This, according to the department, implies that a number of learners are still taught in overcrowded classrooms whilst others still have to travel/walk long distances to receive education. The KZNDEC indicated that the budget allocated for the programme has always been inadequate such that donor funding had to be sought. However, in some cases the department under/over-spent the allocated funds. According to the department, control measures, which were not
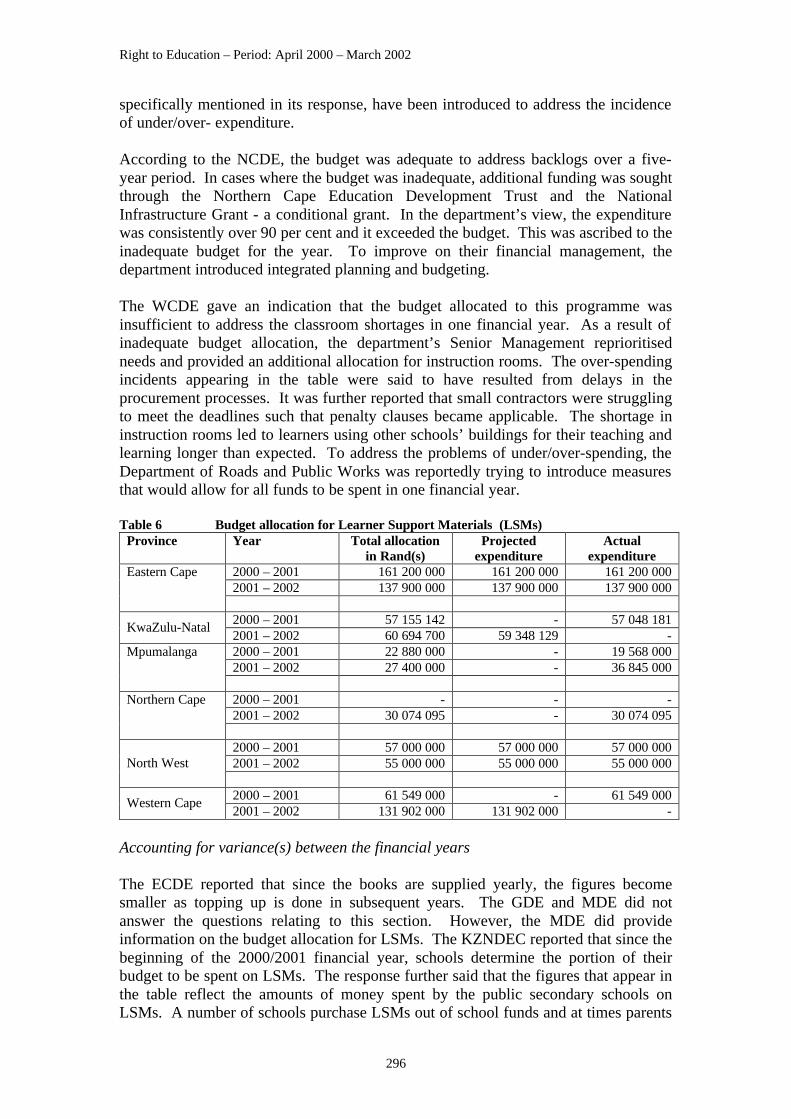
Right to Education – Period: April 2000 – March 2002
296
specifically mentioned in its response, have been introduced to address the incidence of under/over- expenditure. According to the NCDE, the budget was adequate to address backlogs over a five-year period. In cases where the budget was inadequate, additional funding was sought through the Northern Cape Education Development Trust and the National Infrastructure Grant - a conditional grant. In the department’s view, the expenditure was consistently over 90 per cent and it exceeded the budget. This was ascribed to the inadequate budget for the year. To improve on their financial management, the department introduced integrated planning and budgeting. The WCDE gave an indication that the budget allocated to this programme was insufficient to address the classroom shortages in one financial year. As a result of inadequate budget allocation, the department’s Senior Management reprioritised needs and provided an additional allocation for instruction rooms. The over-spending incidents appearing in the table were said to have resulted from delays in the procurement processes. It was further reported that small contractors were struggling to meet the deadlines such that penalty clauses became applicable. The shortage in instruction rooms led to learners using other schools’ buildings for their teaching and learning longer than expected. To address the problems of under/over-spending, the Department of Roads and Public Works was reportedly trying to introduce measures that would allow for all funds to be spent in one financial year. Table 6 Budget allocation for Learner Support Materials (LSMs)
Province Year Total allocation in Rand(s)
Projected expenditure
Actual expenditure
2000 – 2001 161 200 000 161 200 000 161 200 000 2001 – 2002 137 900 000 137 900 000 137 900 000
Eastern Cape
2000 – 2001 57 155 142 - 57 048 181
KwaZulu-Natal 2001 – 2002 60 694 700 59 348 129 - 2000 – 2001 22 880 000 - 19 568 000 2001 – 2002 27 400 000 - 36 845 000
Mpumalanga
2000 – 2001 - - - 2001 – 2002 30 074 095 - 30 074 095
Northern Cape
2000 – 2001 57 000 000 57 000 000 57 000 000 2001 – 2002 55 000 000 55 000 000 55 000 000 North West 2000 – 2001 61 549 000 - 61 549 000
Western Cape 2001 – 2002 131 902 000 131 902 000 -
Accounting for variance(s) between the financial years The ECDE reported that since the books are supplied yearly, the figures become smaller as topping up is done in subsequent years. The GDE and MDE did not answer the questions relating to this section. However, the MDE did provide information on the budget allocation for LSMs. The KZNDEC reported that since the beginning of the 2000/2001 financial year, schools determine the portion of their budget to be spent on LSMs. The response further said that the figures that appear in the table reflect the amounts of money spent by the public secondary schools on LSMs. A number of schools purchase LSMs out of school funds and at times parents

Right to Education – Period: April 2000 – March 2002
297
are expected to provide their own. The NCDE ascribed the variance to a steady annual increase of LSMs needs as a result of the introduction of Curriculum 2005. The WCDE did not account for the variance between the financial years referred to in the table above. Budget Adequacy Responding to questions on budget adequacy, the ECDE reported that the allocated budget was spread out evenly such that all grades were supplied with learning materials. The department further reported that in its budget allocation for the programme it alignes school requirements to the available financial resources. The KZNDEC indicated that the budget was inadequate. It further reported that allocations made to schools are based on what schools can afford as well as priorities of the department. The NCDE indicated satisfaction with the budget allocated to the programme. The WCDE indicated dissatisfaction with the allocations for the programme. It asserted that the programme needs more funds for textbooks and for the implementation of Curriculum 2005. 4. INDICATORS Eastern Cape Table 7 Further Education and Training (FET)
Total Female Rural Learners with special needs
Africans Coloured Indian White
Total number of secondary school learners
306207 173639 89093 3627 278472 14960 756 12019
Number of secondary learners in farming communities
527 324 527 - 523 2 - -
In the year 2001/2002, the ECDE reported that it had 306 207 learners, including not only learners in secondary schools but in the FET band as a whole. The ECDE reported that there were 101 102 children aged between 15 and 18 who were not attending secondary school. The Eastern Cape Net Enrolment Ratio (NER)70 was reported to be 15.65 percent with the learners above normal ending age of 18 years that complete secondary school pegged at 42 289.71 Furthermore, it was
70 NER refers to the number of appropriately aged learners who are in secondary school as a proportion of the corresponding age group in the population, expressed as a percentage. 71 Note that since the Ministry of Education was challenged in the High Court and Constitutional Court on the decision that a child starting grade 1 must be 7 years old, it is no longer clear at which age learners should complete their high school education. The protocol or questionnaire on this was developed before the Court’s ruling, and thus had 18 years as the age limit for high school education.

Right to Education – Period: April 2000 – March 2002
298
reported that there were 18 929 learners of school-going age who were not able to attend school. 5. NATIONAL ACTION PLAN (NAP) The ECDE reported that there were 875 secondary schools, 273 of which were without water within walking distance. It was further reported that there were 282 secondary schools without electricity and 87 secondary schools without adequate facilities. Gauteng Table 8 Matriculation Pass Rate 72
Total Female African Coloured Indian White Number of matriculants 64300 35 811 40 178 3 118 2 437 18 561 Number of learners that have passed the matriculation examination
33 713 18 353 21 505 1 940 1 875 9 393
Number of disabled learners that have passed the matriculation examination
192 60 67 7 - 118
Number of learners who obtained matriculation exemption
13 703 7 822 3 222 387 1 348 8 742
Number of disabled learners who obtained matriculation exemptions
11 6 7 - - 4
Number of learners who passed with endorsements
- - - - - -
Number of learners who wrote on Higher Grade
204 322 95 182 118 831 7 513 10 549 67 406
Number of learners who wrote on Standard Grade
199 573 135 813 135 736 11 562 - 47 523
72 These results statistics are for January/December 1999 and January/December 2000.

Right to Education – Period: April 2000 – March 2002
299
Table 9 Indicators on the Senior Certificate 73 Total Female Number of matriculants 70 874 38 777 Number of learners that have passed the matriculation examination
34 196 18 201
Number of disabled learners that have passed the matriculation examination
190 64
Number of learners who obtained matriculation exemption/endorsement
13 197 7 558
Number of learners who obtained matriculation exemption/endorsement
16 6
Number of learners that wrote subjects on the Higher Grade
217 496 119 891
Number of learners that wrote subjects on the Standard Grade
222 665 120 511
Table 10 Indicators on the NAP
Total Rural Urban Total number of secondary schools 464 462 2 Number of secondary schools with buildings in a state of disrepair
290 289 1
Number of secondary schools that have a shortage of classrooms
10 10 10
Number of secondary schools without electricity
4 4 0
Number of secondary schools without adequate toilet facilities
2 2 0
Number of secondary schools that lack computers
1 1 0
Number of secondary schools that lack laboratories
- - -
Number of secondary schools without libraries
1 1 0
Number of secondary schools that lack recreational and sporting facilities
18 18 0
The number 0 denotes that no school fits the provided category/situation KwaZulu-Natal Table 11 Indicators on FET (Secondary Schools)
Total Female Rural Learners with Special Needs
Learner/Educator Ratio 38:1 38:1 38:1 - -
Total number of secondary school learners
931 615 484 169 ±60% -
73 It must be noted that the data provided in this table was not classified in terms of race.
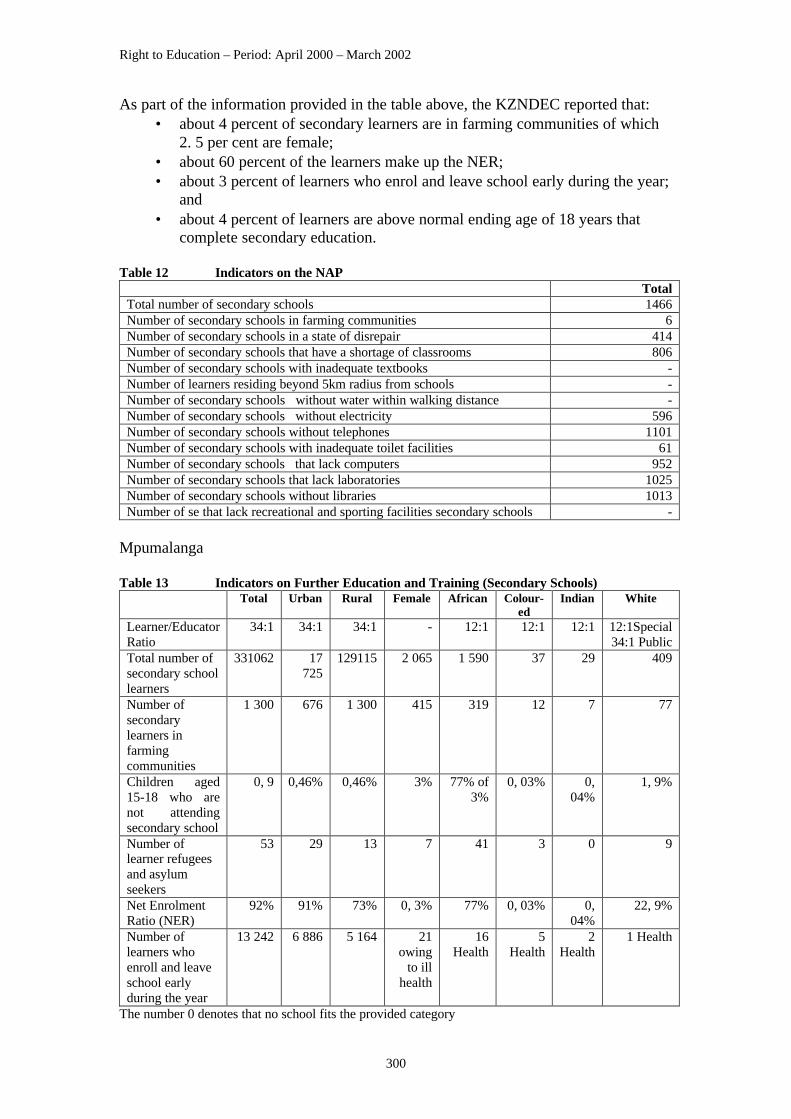
Right to Education – Period: April 2000 – March 2002
300
As part of the information provided in the table above, the KZNDEC reported that: • about 4 percent of secondary learners are in farming communities of which
2. 5 per cent are female; • about 60 percent of the learners make up the NER; • about 3 percent of learners who enrol and leave school early during the year;
and • about 4 percent of learners are above normal ending age of 18 years that
complete secondary education.
Table 12 Indicators on the NAP Total Total number of secondary schools 1466 Number of secondary schools in farming communities 6 Number of secondary schools in a state of disrepair 414 Number of secondary schools that have a shortage of classrooms 806 Number of secondary schools with inadequate textbooks - Number of learners residing beyond 5km radius from schools - Number of secondary schools without water within walking distance - Number of secondary schools without electricity 596 Number of secondary schools without telephones 1101 Number of secondary schools with inadequate toilet facilities 61 Number of secondary schools that lack computers 952 Number of secondary schools that lack laboratories 1025 Number of secondary schools without libraries 1013 Number of se that lack recreational and sporting facilities secondary schools -
Mpumalanga Table 13 Indicators on Further Education and Training (Secondary Schools)
Total Urban Rural Female African Colour-ed
Indian White
Learner/Educator Ratio
34:1 34:1 34:1 - 12:1 12:1 12:1 12:1Special 34:1 Public
Total number of secondary school learners
331062 17 725
129115 2 065 1 590 37 29 409
Number of secondary learners in farming communities
1 300 676 1 300 415 319 12 7 77
Children aged 15-18 who are not attending secondary school
0, 9 0,46% 0,46% 3% 77% of 3%
0, 03% 0, 04%
1, 9%
Number of learner refugees and asylum seekers
53 29 13 7 41 3 0 9
Net Enrolment Ratio (NER)
92% 91% 73% 0, 3% 77% 0, 03% 0, 04%
22, 9%
Number of learners who enroll and leave school early during the year
13 242 6 886 5 164 21 owing
to ill health
16 Health
5 Health
2 Health
1 Health
The number 0 denotes that no school fits the provided category

Right to Education – Period: April 2000 – March 2002
301
Northern Cape Table 14 Indicators on FET (Secondary Schools)
Total Female Rural Learners with Special Needs
Africans Coloured Indian White
Learner/Educator Ratio
30,4:1 - 28:1 with integration of schools a realistic figure cannot be calculated
Total number of secondary school learners
30728 15879 18196 - - - - -
Number of secondary learners in farming communities
Per learner records needed to be calculated – farm school learners do not fully constitute this category; some are in urban schools boarding privately.
Children aged 15-18 who are not attending secondary school
19727 9582 10145 - - - - -
Net Enrolment Ratio (NER)
20% 21% 17% Tendency in province to start school later – figure may be misleading
Number of persons above normal ending age of 18 years that complete secondary school
2490 1252 1541 - - - - -
In addition to the information provided in the table above, the NCDE reported the following:
• the total number of matriculants was 6 619. • the total number of learners who obtained matriculation exemption was 975.
In 2000, the Northern Cape recorded the lowest ratio in primary schools (28:1), and the Eastern Cape and Mpumalanga recorded the highest ratio in the combined schools (36:1).74
74 Brochure for the 2000 School Register of Needs Report, op cit., p. 10.
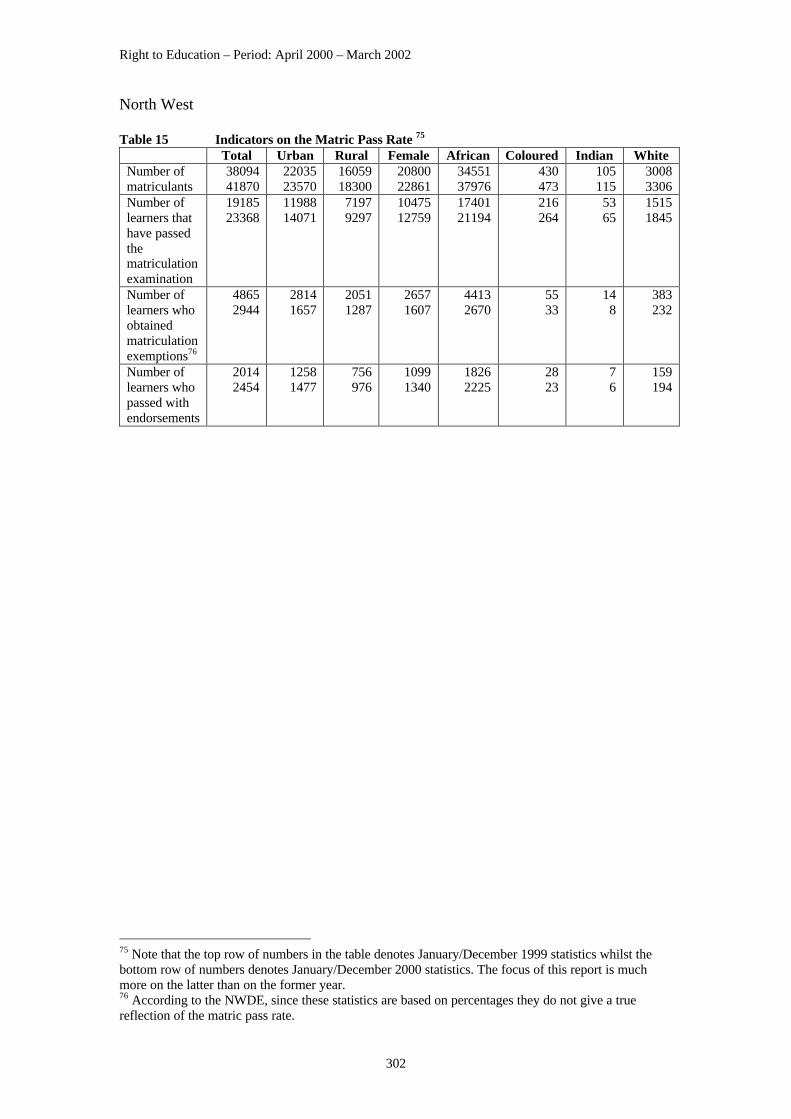
Right to Education – Period: April 2000 – March 2002
302
North West Table 15 Indicators on the Matric Pass Rate 75
Total Urban Rural Female African Coloured Indian White Number of matriculants
38094 41870
22035 23570
16059 18300
20800 22861
34551 37976
430 473
105 115
3008 3306
Number of learners that have passed the matriculation examination
19185 23368
11988 14071
7197 9297
10475 12759
17401 21194
216 264
53 65
1515 1845
Number of learners who obtained matriculation exemptions76
4865 2944
2814 1657
2051 1287
2657 1607
4413 2670
55 33
14 8
383 232
Number of learners who passed with endorsements
2014 2454
1258 1477
756 976
1099 1340
1826 2225
28 23
7 6
159 194
75 Note that the top row of numbers in the table denotes January/December 1999 statistics whilst the bottom row of numbers denotes January/December 2000 statistics. The focus of this report is much more on the latter than on the former year. 76 According to the NWDE, since these statistics are based on percentages they do not give a true reflection of the matric pass rate.
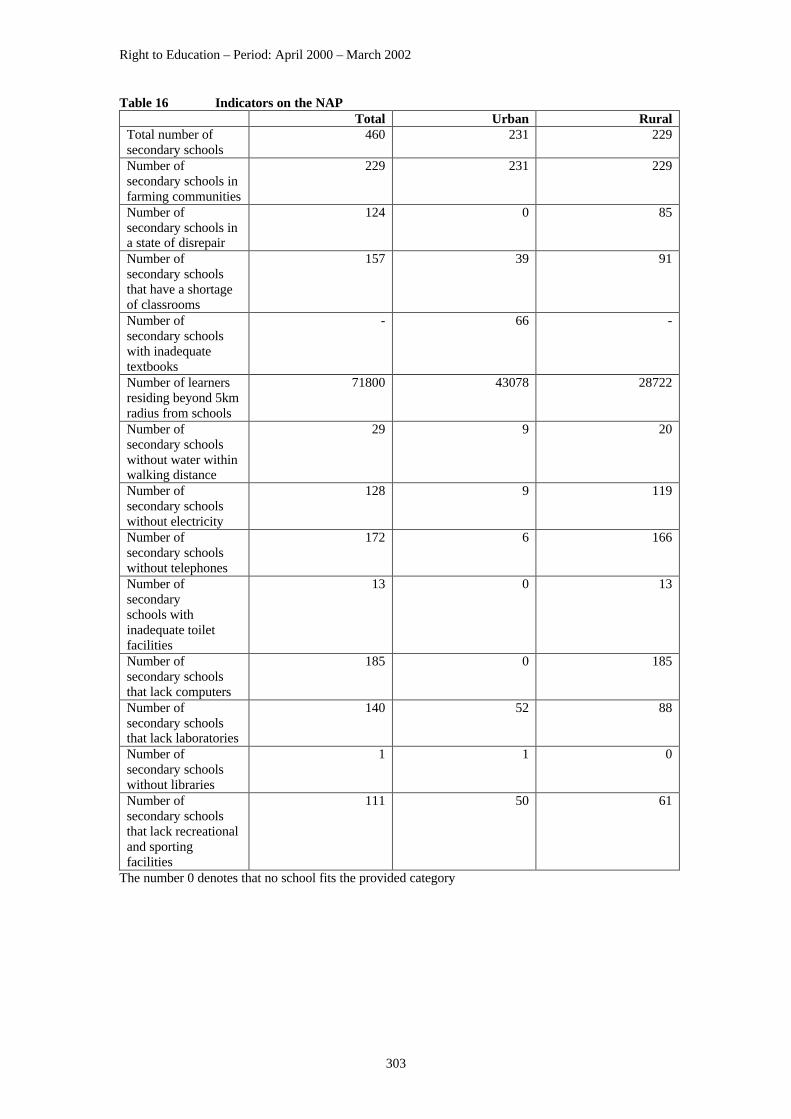
Right to Education – Period: April 2000 – March 2002
303
Table 16 Indicators on the NAP Total Urban Rural Total number of secondary schools
460 231 229
Number of secondary schools in farming communities
229 231 229
Number of secondary schools in a state of disrepair
124 0 85
Number of secondary schools that have a shortage of classrooms
157 39 91
Number of secondary schools with inadequate textbooks
- 66 -
Number of learners residing beyond 5km radius from schools
71800 43078 28722
Number of secondary schools without water within walking distance
29 9 20
Number of secondary schools without electricity
128 9 119
Number of secondary schools without telephones
172 6 166
Number of secondary schools with inadequate toilet facilities
13 0 13
Number of secondary schools that lack computers
185 0 185
Number of secondary schools that lack laboratories
140 52 88
Number of secondary schools without libraries
1 1 0
Number of secondary schools that lack recreational and sporting facilities
111 50 61
The number 0 denotes that no school fits the provided category

Right to Education – Period: April 2000 – March 2002
304
Western Cape Table 17 Matric Pass Rate77
Total Urban Rural Female Number of matriculants
37199 38318
22949 23761
14250 14557
-
Number of learners that have passed the matriculation examination
29304 30447
17545 18258
11759 12189
-
Number of disabled learners that have passed the matriculation examination
119 120
-
- -
Number of learners who obtained matriculation exemption
9090 9169
5800 5760
3290 3409
-
Number of disabled learners who obtained matriculation exemption
10 15
- - -
Number of learners who passed with endorsements
- - - -
Number of learners who wrote on Higher Grade
118008 113863
75107 71489
42901 42374
-
Number of learners who wrote on Standard Grade
117612 114510
44310 44557
44310 44557
-
Table 18 Availability of Learner Support Materials (LSMs) per subject
Subjects Number of learners/schools reached:
Rural
Urban
Mathematics 20568/ 173 58242/ 200 Physical Science 11912/ 129 30153/ 183 Geography 24177/ 148 48409/ 184 History 17895/ 135 37452/ 186 Life orientation Not available Home Economics 6768/ 94 12041/ 138
77 These statistics were not classified in terms of race. Note, as well, that the top row of numbers denotes the matric pass rate for January/December 1999 whilst the bottom row of numbers denotes the January/December 2000 matric pass rate.

Right to Education – Period: April 2000 – March 2002
305
Table 19 Indicators on the NAP Total Rural Urban Total number of secondary schools
1484 774 710
Number of secondary schools in farming communities
- - -
Number of secondary schools in a state of disrepair
5 - -
Number of secondary schools that have a shortage of classrooms
195 - -
Number of secondary schools with inadequate textbooks
64% - -
Number of learners residing beyond 5km radius from schools
298352 86747 211605
Number of secondary schools without water within walking distance
0 8 -
Number of secondary schools without electricity
47 44 3
Number of secondary schools without telephones
17 16 1
Number of secondary schools with inadequate toilet facilities
71 68 3
Number of secondary schools that lack computers
293 245 48
Number of secondary schools that lack laboratories
113 66 47
Number of secondary schools without libraries
33 22 11
Number of secondary schools that lack recreational and sporting facilities
514 328 186

Right to Education – Period: April 2000 – March 2002
306
6. CRITIQUE Quality of Government Reports Generally, there is a problem with some responses the Human Rights Commission (HRC) receives from government departments. Some departments do not take the work of the HRC seriously. This is reflected in the responses they send to the HRC. Some of the salient problems experienced with the departments’ reports, include inadequate responses, skipped questions and unsatisfactory responses. The same problems are occurring in the completion of the budgetary measures tables as well. I n some instances figures are written incorrectly requiring researchers to call the relevant departments to explain the figures. Most of these problems could be avoided if government departments could devote more time to respond to the HRC’s protocols as well as finding out what is expected of them. The quality of the reports submitted to the HRC affects the quality of the report the HRC produces at the end of the monitoring process. Policy and Programmatic Measures It is surprising that PEDs and the NDE failed to report on some important and positive developments that took place during the period under review either in a form of projects or programmes. Such developments comprise the following:
• The upgrading of approximately 65 000 unqualified and under-qualified educators;
• A programme focusing on farm and rural school educators was also initiated to deal with the needs and challenges presented by these schools; and
• The launch of the National Teacher Awards by the Minister of Education in May 2000.78
A total of R95 million was made available through the Education Labour Relations Council for this project which will assist this group of teachers to obtain the required levels of qualification by offering a National Professional Diploma in Education. In 2000/2001 financial year attention was given to assisting teachers with Outcomes-Based Education (OBE). The same group of teachers was also offered training on teaching effectively in multi-grade classrooms, a common feature of rural and farm schools.79 Constitutional Obligations80 National Sphere Respect The NDE asserted that the following developments that took place during the transformation of the further education landscape respected the right to education: 78 http://education.pwv.gov.za/DoE_Sites/communication/An…/Highlights&%20Achiev 1.ht. Site visited on 23 October 2002. 79 Ibid. 80 The NDE did not respond to the duty “to protect” the right to further education.

Right to Education – Period: April 2000 – March 2002
307
• In the case of mergers no learning sites were closed down • Planning included site and access issues for citizens • More programmes were added to the institutional curriculum range • Demand-led programmes received priority allowing a link between training
and economic development and the improvement of quality of life
Promote and Fulfil The NDE reported that its programme of delivery has been accompanied by a range of consultative processes, which highlighted access to training programmes, especially for the disadvantaged. The NDE’s response shows that a sincere attempt was made to respect the right to FET. The facts that the learners country-wide have access to FET institutions in their respective regions despite the merging of FET Colleges and the diversification of academic programmes in the FET band, etc., are commendable. Provincial Sphere81 Respect The GDE only mentioned that all its policies and programmes do meet the obligation to respect the right to education as they ensure that learners access education without any hindrances. The LDE reported that the location of its seven FET Colleges in all the regions in the province makes the Public FET accessible to all learners. Protect The GDE referred to the draft interim policy made in terms of section 16 of the FET Act 98, 1998 on Disciplinary Measures. The policy provides that learners may appeal against a decision that could result in their exclusion from receiving the Public FET. The LDE did not give a clear explanation regarding this duty. Promote and to Fulfil The GDE referred to the draft interim policy based on section 17 of the FET Act on Admission to Public FET institutions. According to the GDE, this policy makes specific provisions for students previously disadvantaged by discriminatory laws and practices. Again, the LDE failed to give a clear explanation on these duties. National Sphere Respect The NDE’s response shows that a sobcere attempt was made to respect the right to FET. The facts that the learners country-wide have access top FET Institutions in their
81 The ECDE and KZNDEC responded to this section the same way they did in the GET part. As a result, their responses will not be repeated here in the FET section on the duties imposed by the right to education.

Right to Education – Period: April 2000 – March 2002
308
respective regions despite the merging of FET Colleges and the diversification of academic programmes in the FET band, etc., are commendable. Protect This obligation calls upon the state to protect the individual learner’s right from interference by individuals or private companies in the exercise of the learner’s right to education.82 The NDE did not explain how it meets the obligation to protect the right to FET. It is important that the state demonstrates its commitment to the observance of all the constitutional obligations to guarantee everyone the right to education. As it stands, it is not clear if everyone’s right to FET is protected. Promote The obligation to promote requires the state to actively inform people of their right to education as well as how this right can be accessed. Workshops; seminars; different forms of media can be used to promote the right to education.83 The NDE’s response to this obligation sounds superficial. Stating clearly what ‘a range of consultative processes, which highlighted access to training programmes, could have helped.
Fulfil
This places an obligation on the state to take measures in order to advance the right to education. The state must take legislative or other measures in order to realise the right to education. Other measures, considered by the Committee on Economic, Social, Cultural Rights are – administrative, financial, educational and social measures.84 Much as the state has taken some administrative and financial measures as seen in its various programmes such as School Building, Technical Colleges, etc., its response does not go any far in demonstrating how it fulfils the obligation. Provincial Sphere Respect As part of the response on how the ECDE respects the right to FET, the ECDE referred to the White Paper on Inclusive Education as it allows learners who experience barriers to learning and development to be accommodated in the mainstream education. The OBE was another example cited to illustrate how the ECDE respects the right to FET. According to the FSDE, the Policy on Learner Pregnancy entrenches the respect for the right to FET in that it provides the pregnant learner the right to receive education despite being pregnant. This is in line with contemporary international norms that require education to be accessible, available, adaptable and acceptable. The GDE’s response on how it observes the obligation to respect the right to FET is not helpful, as it does not go into detail on how learners have access to FET ‘without
82 Lawrence V. Mashava (ed.), A Compilation of Essential Documents on the Right to Education, Economic and Social Rights Series, Volume 2, Centre for Human Rights (University of Pretoria), 2000. 83 Ibid.p.14. 84 Mashava, 2000, op.cit., p. 15.

Right to Education – Period: April 2000 – March 2002
309
hindrances.’ However, the LDE clearly demonstrates its observance of the obligation as it ensured that during the merging of the FET Colleges in the province, all of its seven FET Colleges were spread across all their regions thereby making Public FET accessible to all learners. Like the MDE, the NCDE reported that it respects the right to education through the White Paper on Inclusive Education as it purports that education be offered to all learners and potential learners regardless of their disabilities, socio-economic conditions, etc. Protect The Policy on Disciplinary Measures the GDE referred to, does meet the obligation to protect the right to FET as it allows learners to appeal against a decision that may exclude them from the Public FET Institutions. Also the Policy on Admission to Public FET institutions, based on section 17 of the FET Act, to which the GDE referred, goes an extra mile making specific provisions for the previously disadvantaged learners. The assumption here is that the policy does not discriminate unfairly against other groups of learners. However, the challenge lies in the implementation of the policy. Promote According to the FSDE, the Policy on Injury of Learners in Public Schools ensures that learners are not neglected during educational and extra-curricula activities. The GDE’s reference to the Policy on Admission to Public FET Institutions could be said to be meeting the obligation as it makes specific provisions for the admission of the previously disadvantaged learners. However, the implementation of the draft policy is yet to be tested. The NCDE referred to the White Paper on Inclusive Education as a measure that promotes access to education for learners previously denied the right to FET. The response further referred to the Whole School Evaluation Policy as another policy measure that promotes the right to FET without explaining how the policy measure meets this obligation. Fulfil The GDE seems to be fulfilling the right to FET through the draft policy on Admission to Public FET Institutions. The KZNDEC is another department that seems to be taking a step forward in fulfilling this right through the advocacy initiatives it engaged in during the reporting period. Such advocacy initiatives comprise the training of the KZNDEC’s officials to better serve their respective communities and the education of parents and teachers about the right to education. The LDE’s provision of FET Colleges in all their regions is also indicative of its commitment to meeting the obligation to fulfil the right to FET. All the above is consistent with the two dimensions to the obligation to fulfil the right to education under international law. The two dimensions to the obligation to fulfil the right to education would be to provide and facilitate the right to FET in the case of this band.85 According to General Comment No. 13 this would require that the state take positive
85 Section on ECD, op.cit.
Right to Education – Period: April 2000 – March 2002
310
measures that enable and assist individuals and communities to enjoy the right to education and also to provide them with the right to education. The NCDE cited the Whole School Evaluation Policy as a policy measure that fulfils the right to FET. However, the NCDE did not explain how the policy measure fulfils this obligation. All the PEDs need to demonstrate their understanding of the constitutional obligations both in the formulation and implementation of government policy, programmatic and legislative measures. Such internalisation helps to ensure that in the country’s quest to provide quality education, the learners’ right to FET is not infringed upon. Legislative Measures The NDE and some six PEDs did not mention the positive legislative developments that took place during the period under review. The legislative developments referred to above include:
• The promulgation of the South African Council for Educators (SACE)86 Act, 2000 (Act No. 31 of 2000)
The main purpose of the Act is to provide for the registration of educators, to promote the professional development of educators and to set, maintain and protect ethical and professional standards for educators.
• Notice No. 327 of 31 March 2000 This notice deals with regulations, which apply to managers prior to strike action. Managers are to give notice in advance of their intention to participate in a strike so as to enable the employer to make arrangements such as the appointment of temporary managers. These regulations apply to all Heads of Public Schools, Colleges of Education, Technical Colleges and other Colleges, FET institutions, Adult Basic Education and Training Centres, Early Childhood Development Centres and to all office-based educators. The two legislative developments above indirectly contribute to the progressive realisation of the right to education. However, the two legislative developments are essential in that they try to address issues pertaining to professionalism and development of educators as well as ensuring that the right to education is not compromised by labour action such as strikes that educators sometimes engage in. One of the key elements referred to in progressively realising the right of access to housing is doing so ‘within the available resources’. This phrase does not only refer to financial resources and related material; it also refers to human resources. However, having sufficient human resources to carry out the state policies is not and should not be seen as an end in itself. Human resources have to be well-trained if the implementation of the state policies is to achieve any success. Therefore, the existence of a professional and developmental body such as the SACE is desirable to also protect the integrity of the teaching profession. 86 SACE has had the legislated competence to promote the professional image of educators. The Council is a body of 30 persons appointed by the Minister. Its members have a commitment to serving the interests of the profession, and of education, on a voluntary basis.

Right to Education – Period: April 2000 – March 2002
311
The issue of the legal notice, that is, Notice No. 327 above, is also a positive legislative development. It indicates the seriousness on the part of the state in realising the right to education. However, the practicability of the notice is doubtful given the rarity of educators going on strike for a period of time that would necessitate the appointment of temporary educators. Constitutional obligations87 Respect According to the GDE, the Regulations for the Admission of Learners to Public Schools ensure access to education for every learner as it purports to eliminate all discriminatory practices in the admission of learners to public schools. According to the FSDE the legislative measures that took place during the reporting period do meet the obligation to respect the right to education since they give governance structures and school communities the powers to decide on and implement education-related measures. The WCDE gave a long and unclear response on this duty and did not respond on how their legislative measures protect the right to FET. Promote and Fulfil The GDE submitted that the Regulations for the Admission of Learners to Public Schools do meet the obligations to promote and fulfil the right to FET as they accord learners access to education. Moreover, parents and learners are informed of their rights on matters of discipline. The WCDE reported that both national and provincial education laws ensure by means of legislation and policy that learners in each province must attend school between the ages of seven and fifteen and if a parent fails to place a child in a school, such action is perceived as a criminal offence in terms of the South African Schools Act 84, 1996. The response further said that the parent’s inability to pay school fees does not affect the learner’s right to education, which further respects the right to education. Administrative Action88 and Maladministration and/or Corruption89 The NDE indicated that it did not have any administrative action reported to it during the period under review. The ECDE reported that some principals refused learners to attend classes owing to non-payment of school fees. However, the ECDE issued a circular calling upon the principals concerned to refrain from that action. The second administrative action that resulted in the violation of the learners’ right to FET was the delay in the implementation of FET Curriculum. Interim arrangements had to be made to address the problem.
87 The LDE simply listed the Regulations for the Provincial Board for FET but did not say exactly how these meet the constitutional obligations. The NWDE gave an unclear response. Like the ECDE, the NCDE reported on policy measures and not on legislative measures as required in the protocol. The MDE did not even respond to the questions posed in this section. 88 All the following PEDs reported that there was not any administrative action that resulted in the violation of the learners’ right to further education during the reporting period: KZNDEC, LDE, MDE, NWDE, NCDE and WCDE. 89The ECDE, GDE, KZNDEC, LDE, MDE, NCDE and WCDE reported that they did not have any act of maladministration and/or corruption brought to their attention during the reporting period.

Right to Education – Period: April 2000 – March 2002
312
The GDE did not report any specific incidents of administrative action that resulted in the violation of the learners’ right to FET. The only incident the GDE cited as a possible violation of learners’ right to education was the fact that most schools do not inform learner applicants of their application outcome for admission to schools. Section 33(1) of the Constitution on just administrative action provides that everyone has the right to administrative action that is lawful, reasonable and procedurally fair. The GDE did not say what it plans to do to correct the situation. However, the GDE further reported that regular visits to schools by District officials ensure that critical issues are brought to light and addressed. The GDE has strengthened the administrative justice aspect in relation to admission to schools. The NDE did not report any acts of maladministration and/or corruption committed during the reporting period. Although nothing pertaining to maladministration and/or corruption was brought to the KZNDEC’s attention, the KZNDEC has introduced the following measures to deal with such issues:
• appointed a Chief Financial Officer; • introduced extensive additional financial control measures, asset and
personnel management systems; • advocated the reporting of fraud, corruption and maladministration; and • resolved to take effective steps against convicted transgressors.
Budgetary Measures Like the GET band, the FET Sector seems to be experiencing problems in the areas of project management and procurement processes. Some of the common problems cited in both the GET and FET bands in the areas of project management and procurement processes comprise understaffing and delay in the delivery of account printing works. Most PEDs did not respond to the questions posed in this section nor provided reasons for doing so. The ECDE did not explain how the under-expenditure occurred, except mentioning that the under-expenditure occurred in the LSMs and School Building Programmes. It is disturbing that some departments do not even know how much they spent in previous financial years. The ECDE indicated that its budget allocation was inadequate for the financial years 2000/2001 but the department experienced under-expenditure in that financial year. This situation calls on the department to spend better instead of asking for more funds. Technical Colleges The GDE under-spent in this programme in the financial year 2001/2002. The under-expenditure was ascribed to ‘the financial system that made it difficult with long tender processes.’ It is important that government departments do programme review regularly to ensure that their programmes do serve the purpose that they are intended for when instituted. The under-expenditure that occurred in the GDE or in any other government department short-changes the beneficiaries in that particular programme. In the Grootboom judgment, for the State to progressively realise a right it ‘should examine legal, administrative, operational and financial hurdles, and where possible, lower

Right to Education – Period: April 2000 – March 2002
313
these over time.’ In this case, it appears that the GDE has not been taking stock of the programme since the same problems have been recurring in three consecutive financial years. This kind of a situation needs to be carefully looked into, given that most students enrolled in the Technical Colleges are paying for themselves as the HRSC findings indicate. Vulnerable and Marginalised Groups The GDE gave an elaborate account on how the programme caters for these groups in their budget allocation. Only four categories of the vulnerable and marginalised groups will be referred to here. For “persons living in informal settlements”, the GDE reported that it experienced increased migration and annual growth of learners’ demands for additional classrooms annually. It links the demand of additional classrooms to the provision of basic services such that it promised to build 500 classrooms in 2002/2003. In selecting learners for projects, it gives more consideration to women. For “persons living with disabilities”, the GDE reported that it is making institutions accessible to these learners by providing infrastructure and necessary facilities. Regarding “persons living with HIV/AIDS,” programmes on HIV/AIDS are offered at colleges, which also comprise support in social and economic areas hard hit by the pandemic. The KZNDEC reported that Skills Centres have been established for the training of various categories of vulnerable and marginalised groups. Furthermore, the department reported that it has embarked on a Professional Researched Needs Analysis that takes into account the provincial population, growth and development points and the situation of business in the province. This is an attempt by the department to partner with the private sector to provide training to the said categories of vulnerable and marginalised groups. Another partner the department is working closely with is the Department of Labour. The Departments of Labour and Education ascertain unemployment levels and skills training needs, taking into account the Sector Education and Training Authority’s (SETA) available financial resources. The NWDE indicated that it considers the beneficiaries when allocating funds to the programme. For instance, tutors and lecturers were trained on dealing with people infected and affected by HIV/AIDS. The WCDE reported that in its budget allocation for this programme it does consider the vulnerable and marginalised groups. For example, for “persons living in informal settlements,” the department has established Skills Development Centres in these areas: Thembalethu near George in the Southern Cape as well as in the Noordhoek Valley at Masipumelele informal settlement. Some initiatives to establish more Skills Centres have also been initiated in Caledon and Paarl. Regarding the “low-income groups,” the department endorses and encourages the work of the Technical College Student Aid Trust, whose mission is to provide financial assistance to learners from low-income backgrounds. Lastly, a Pilot Support Programme has been developed for colleges to include learners with disabilities. This is also seen through the adaptation of physical facilities in order to make them more accessible to learners with physical disabilities.
Right to Education – Period: April 2000 – March 2002
314
Secondary Education In the financial year 2000/2001 the NWDE under-spent drastically and did not provide the actual expenditure figure for the 2001/2002 financial year. One point that is not clear is that the NWDE sought funding from donors, including the private sector to augment its allocation for this programme when it had under-spent in the financial year 2000/2001. If it had furnished the HRC with a figure for the financial year in question, it would have been easier to monitor and analyse its expenditure patterns. The WCDE’s statement that the ‘surplus’ seen in the table for this programme is as a result of its ‘prudent fiscal hand’ is not an easy one to believe given that at one stage the department experienced shortages of teachers, classrooms, books and equipment such that its budget had to be augmented eventually. Vulnerable and Marginalised Groups The ECDE reported that since the province is predominantly rural, it spends most of its funds on the rural areas. It was further reported that the budget allocation for 2002/2003 was allocated to schools according to poverty rating as per the Policy on Norms and Standards for School Funding. According to the KZNDEC, the criteria used to allocate funds to the programme do take into account the following categories of vulnerable and marginalised groups:
• persons living in rural areas • persons living in informal settlements • persons from low-income groups • persons with disabilities
The WCDE reported that the Policy on Norms and Standards for School Funding favours the poor learners of which a number of vulnerable and marginalised groups are part, including persons living in rural areas, low-income groups as well as persons living in informal settlements. The department further reported that the White Paper on Inclusive Education takes care of “learners with disabilities.” School Building Programme One of the common weaknesses across the departments that reported on this programme relate to financial management and procurement processes specifically in the case of the WCDE. Other provinces, including the WCDE, cite inadequate budget allocations and hence over-spent. Over-expenditure might, of course, be a corollary to overwhelming needs of the people as some departments do say in their responses to questions relating to budgetary measures. However, it is important to remember that the MTEF and the Public Finance Management Act (PFMA)90 guide government 90 Section 16 (1) of the PFMA provide that:
• The Minister may authorise the use of funds from the National Revenue Fund to defray expenditure of an exceptional nature which is currently not provided for and which cannot, without serious prejudice to the public interest, be postponed to a future parliamentary appropriation of funds. Section 25 (1) of the PFMA provides that:
• The MEC for finance in a province may authorise the use of funds from that province’s Provincial Revenue Fund to defray expenditure of an exceptional nature which is currently not provided for and which cannot, without serious prejudice to the public interest in the province, be postponed to a future appropriation by the provincial legislature.
Right to Education – Period: April 2000 – March 2002
315
departments’ expenditure, particularly on the use of funds in emergency situations, adjustments budgets and unauthorised expenditure. Therefore, over-expenditure may only take place under the circumstances outlined in the PFMA, if not, such over-expenditure becomes unauthorised.91 In some instances government departments might have followed the applicable procedures, referred to in this document as outlined in the PFMA, in spending or augmenting their budgets. What becomes a problem is that most government departments do not mention this in their reports to the HRC such that it appears as unauthorised expenditure in the eyes of the HRC. In the financial year 2000/2001 the GDE experienced under-expenditure which is likely to have contributed to some learners being taught in overcrowded classrooms and thereby making the situation not conducive to learning and teaching. The shortage of instruction rooms also forces learners from areas where there are no schools to travel and/or walk long distances to receive education. If the financial resources allocated to the School Building Programme are used efficiently and effectively problems such as shortage of instruction rooms that result in overcrowding could be minimised. It was reported that since 1996, there has been a decline in the number of schools that had buildings in excellent and good conditions and an increase in the number of schools that reported weak and very weak buildings.
• In 1996, 11 003 schools reported that they had excellent and good building conditions. This number decreased to 5 078 in 2000
• Schools that reported weak and very weak buildings increased from 4 377 in 1996 to 9 375 in 200092
The above report indicates the lack of maintenance on infrastructure. Even if more schools can be built, if they are not maintained, the School Building Programme becomes self-defeating. However, in the School Register of Needs 2000 Survey, the NDE cites the use of different methodologies in conducting the 1996 and 2000 surveys as a possible reason for the reported increase in the number of weak and very weak buildings referred to above.
91 Section 34 of the PFMA clarifies this point even further-: (1) Unauthorised expenditure does not become a charge against a Revenue Fund except when- (a) the expenditure is an overspending of a vote and Parliament or a provincial legislature, as may be appropriate, approves, as a direct charge against the relevant Revenue Fund, an additional amount for that vote which covers the overspending; or (b) the expenditure is unauthorised for another reason and Parliament or a provincial legislature, as may be appropriate, authorises the expenditure as a direct charge against the relevant Revenue Fund. (2) If Parliament or a provincial legislature does not approve in terms of subsection (1) (a) an additional amount of any overspending, that amount becomes a charge against the funds allocated for the next or future financial years under the relevant vote. 92 Kader Asmal, MP, Minister of Education, The National School Register of Needs 2000 Survey.
Right to Education – Period: April 2000 – March 2002
316
Vulnerable and Marginalised Groups The ECDE reported that its allocation criteria recognise the needs of low-income groups, persons living in rural areas, and communities/persons living in informal settlements. The latter category is provided with prefabricated classes whilst the former categories of vulnerable and marginalised groups are given a priority in the allocation for the programme. The GDE reported that in allocating resources to the programme, it does cater for communities/persons living in rural areas, communities/persons living in informal settlements, low-income groups, and persons with disabilities. For the first category of vulnerable and marginalised groups, (which includes communities/persons living in rural areas, communities/persons in informal settlements and low-income groups), the department has already set aside R2,8 million to move learners from dilapidated to decent buildings. An additional amount of R2 million has been set aside for the repairs to rural/farm schools. Regarding the second category of vulnerable and marginalised groups, (comprising communities/persons living in rural areas), the department prioritises new school buildings based on need. Informal settlements that become permanent residential areas are given priority in this programme, and these are areas that are also characterised by the third category of vulnerable and marginalised groups, namely, low-income groups. The historically disadvantaged racial groups (African, Coloured and Indian) are catered for through the White Paper on Inclusive Education such that all new schools are now built with access facilities for persons with physical disabilities. Ramps are currently being built in older schools to fully accommodate this category of vulnerable and marginalised groups. However, the response only showed how the department provides for the physically disable; it did not say how it provides for other disabilities, for instance, blindness. The KZNDEC did not elaborate on how it considers the needs of the vulnerable and marginalised groups when allocating resources to the programme. The NCDE reported that in its budget allocation for the programme it did consider the vulnerable and marginalised groups. For instance, most infrastructure development happens in the rural areas of the province. According to the department, persons with disabilities are accommodated through the White Paper on Inclusive Education, which is reflected in the modification of ordinary schools through the building of ramps, toilets and other specialised facilities. Learner Support Materials (LSMs) Programme The KZNDEC’s submission that some schools have to use their own money to purchase LSMs is disturbing. The NDE makes a budget allocation to all the PEDs, specifically for the purchase of LSMs on an annual basis. As per section 21 of the South African Schools Act 84 of 1996, the NDE, through the Head of Department, allocates functions with financial implications to schools that are considered to have the capacity to manage financial matters.93 The procurement and delivery of stationery and textbooks happens to be one of the functions that are assigned to
93 These schools are sometimes referred to as section 21 schools.

Right to Education – Period: April 2000 – March 2002
317
section 21 schools. However, according to the Fifth Report on the Provinces to the President from the Minister of Education, May 2002, PEDs were required to report on deliveries made to section 21 schools. Only the Northern Cape and Western Cape provided the reports on the programme. The other seven PEDs did not report on the performance of the section 21 schools. The Northern Cape reported that schools with assigned functions had provided approximately 97.82 per cent of all LSMs required. The percentage includes grades 5 and 9 requirements and a top up of LSMs in the remaining grades. The WCDE reported that some of the schools did not order stationery as they had enough stock available from the previous year.94 It is worrying that some schools, both section 21 and non-section 21, did not report to the Minister of Education on their performance on the delivery of LSMs to schools before they opened in January 2000. As a result, in his quarterly report referred to above, the Minister had the following to say about delivery on the LSMs programme:
… it can be concluded that the delivery of textbooks has not been managed as well as it should have been in most provinces. Only four provinces Free State, Northern Cape, North West and Western Cape appear to have reached the 75 per cent level of delivery by the time schools opened.
The ECDE and WCDE’s submissions that since stationery and textbooks are purchased on an annual basis, expenditure on textbooks becomes smaller should be happening in all the PEDs. All the schools should develop effective textbook retrieval systems to avoid textbook losses to subsequently spend less on this item. Vulnerable and Marginalised Groups In considering the vulnerable and marginalised groups in its budget allocation for the programme, the ECDE reported that the Policy on Norms and Standards for School Funding is biased towards the vulnerable and marginalised category of learners. Regarding the consideration of vulnerable and marginalised groups in allocating the budget for the programme, the KZNDEC reported that it considers the following categories albeit without saying how exactly it considers these categories:
• schools/persons in rural areas • schools/persons in informal settlements
In making allocations to the LSMs programme, the NCDE reported that it gives consideration to the vulnerable and marginalised groups through the use of the Policy on Norms and Standards for School Funding, which takes into account poverty levels of schools, learners and communities around schools. However, the department reported that there were no provisions for refugees and asylum seekers. The WCDE reported that in making allocations for the LSMs programme, it does consider the needs of the vulnerable and marginalised groups. Nevertheless, it did not say exactly how this is achieved.
94 Kader Asmal, MP, Fifth Report on the Provinces to the President from the Minister of Education, May 2002.

Right to Education – Period: April 2000 – March 2002
318
NAP Indicators Gauteng: Indicators on the NAP The statistics on the number of secondary schools in farming communities are unbelievable. The GDE should know how many schools are built on farms. In cases where information is non-existent, the GDE should ensure that it has the records of all the schools from physical conditions to textbook stocks to help align provincial planning across various areas. KwaZulu-Natal: Indicators on FET (Secondary Schools) The learner/educator ratio of 38:1 is more by 6 percentage points95, and this is relatively high. This might be attributed to classroom shortages or a decline in educator numbers. However, the Register of Needs Report, 2000, has the following finding: A decrease (1.3 per cent) in the number of educators nationally from 370 599 in 1996 to 365 965 was reported. The largest number and share of educators are in KwaZulu-Natal (21.1 per cent), while the Eastern Cape reported the largest increase (3 929) in the teaching service. Regarding the matriculation results pass rate, the KZNDEC provided very meagre information. It only reported that out of 95 407 matriculation learners who wrote the examination 54 696 passed. Of the 54 696 learners who passed the examination, only 15 607 obtained university exemptions. KwaZulu-Natal: Indicators on the NAP The statistics for all the indicators in table 11 are relatively high; more drastic action needs to be taken to bring down such high statistics on all the areas in the table. Almost all the indicators in the table directly affect the realisation of the right to education. Libraries, toilet facilities, computer facilities and so forth, are crucial to the realisation of the right to education. The government’s effort to compile a School Register of Needs Survey Report as a planning tool is highly appreciated. However, a more vigorous action is required from the side of government, in conjunction with other stakeholders, to address the plight of the impoverished schools.96 Improvements in access to technology were noted but significant provincial variations still exist. 6 616 (24.4 %) schools indicated that they had access to computers (used for any purpose including administration, teaching and learning). Just over 70 % (19 094) of schools are still without computers for any purpose, mainly in the more rural provinces.
In 1996, 2 335 (8.7 per cent) of schools had 16 359 computers for teaching and learning between them whereas in 2000 there were 3 351 (12.3 per cent) schools with
95 The national average learner: educator ratio is 32:1. 96 Studying table 15 closely, (North West province: Indicators on the NAP) the indication is that infrastructure backlogs in various areas of the schooling system in North West deserve the government’s utmost attention.

Right to Education – Period: April 2000 – March 2002
319
70 711 computers between them. The number of computers for teaching and learning has quadrupled since 1996.97 North West: Matric Pass Rate Studying the NWDE’s table carefully, it can still be observed that very few matriculation learners passed with university exemption during the year 2000. At face value, the 2000 year’s pass rate looks good given that well above half the matriculants passed the examination (approximately 56 per cent). However, on further analysis of the results, one finds out that only about seven per cent of the 56 per cent who passed matriculation obtained matriculation exemption. Comparing the previous year’s results to the 2000 results, there appears a picture worth examining. In 1999 about 50. 3 per cent of matriculation learners passed their examination. Of the 50. 3 per cent, about 13 per cent obtained university exemption. The NWDE did not supply the HRC with information on the disabled learners. Mpumalanga: Indicators on Further Education and Training (Secondary Schools) The reported learner:educator ratio for the Mpumalanga province (34:1) is only 2 percentage points higher than the national average learner:educator ratio of 32:1, which is still tolerable. However, it is surprising that the same province reported the highest learner: educator ratio (39:1) in 2000, 7 points higher than the national average.98 Western Cape: Matric Pass Rate The Western Cape matriculation results for 2000 are promising at face value. 79. 4 per cent of learners passed the matriculation examination. Of this percentage 23. 9 percent obtained university exemption. Comparing the year 2000 results to the 1999 results, one finds that 78. 7 per cent of learners passed the examination. Of this 78. 7 per cent only 24. 4 per cent obtained university examination. The WCDE did not provide the HRC with statistics on provincial literacy rates. Western Cape: Indicators on the NAP The table shows a number of areas in which government and other concerned stakeholders still have to do some considerable work that would contribute towards the progressive realisation of the right to education. However, other areas require the state’s urgent attention. Such areas comprise the following:
• the lack of electricity in 47 secondary schools; • the inadequate toilet facilities in 71 secondary schools (this is also a health
hazard); and • the inadequate textbooks in 64 per cent99 of secondary schools in the
Western Cape.
97 Department of Education, Brochure for the 2000 School Register of Needs Report. 98 Ibid. 99 This is a disturbing state of affairs as this figure translates into about 950 of secondary schools without adequate textbooks. The inadequacy of textbooks in these schools hampers the education of

Right to Education – Period: April 2000 – March 2002
320
The WCDE’s lack of statistics on secondary schools located in farming communities is problematic. Such information is crucial to the department’s integrated planning. 7. RECOMMENDATIONS The already existing collaboration between the Departments of Labour and Education and the private sector should be strengthened to involve more partners from the private sector. The involvement of the private sector partners in education is crucial since the private sector is in a better position to establish the skills and knowledge required in the labour market. More teachers should be trained appropriately to teach Science and Mathematics to help increase the number of learners who would do Mathematics on Higher Grade. The emphasis on Mathematics and Science is necessary to address the skills shortage in SET.
Currently, the matriculation pass rate is used as an indicator of performance in the schooling system and that learners are not performing up to the expectation. It is generally accepted that South Africa’s education outcomes are poor relative to the high level of resources allocated to education.100
Table 20 The following table shows the matriculation failure and exemption rates, 1996 –
2000 No. of candidates No. of candidates
that failed Matriculation
failure rate (%) Matriculation
exemption (%) 1996 513868 234381 45.6 15.6 1997 558970 294175 52.6 12.5 1998 552384 279896 50.7 12.6 1999 511159 261328 51.1 12.5 2000 489941 206004 42.1% 14.0%
Source: IDASA The above table clearly shows that South Africa needs quality education, which can only be achieved by better spending of the financial resources allocated to education. If Strategic Objective 1101 of the government’s HRD is to be achieved, the education system should be flexible enough to offer choices to learners. Therefore, the current education system has a direct bearing on the number of enrolments in SET in Technical Colleges and HET. According to the study that was undertaken by the Human Sciences Research Council (HSRC) captured in the government’s HRD, it was found that between 1993 and 1999 there has been a downward trend in HET in student enrolments in the humanities.
learners. A drastic step needs to be taken to ensure that the state provides education to these learners within available resources in order to fully realise the right to education. 100 Shameela Cassiem and Judith Streek, Budgeting for Child socio-economic rights: Government obligations and the child’s right to social security and education, IDASA, 2001. 101 Strategic Objective 1, Improving the foundations for human development, Mathematics and Science results. The following are part of the indicative action for the strategic objective:
• Increase number of candidates enrolling for these subjects, especially at the Higher Grade • Identification and training of suitable teachers for these subjects • Intervention strategies

Right to Education – Period: April 2000 – March 2002
321
Total enrolments in the humanities decreased from 57 per cent to 49 per cent, business/commerce enrolments increased from 19 per cent to 26 per cent, and science, engineering and technology (SET) enrolments improved marginally from 24 per cent to 25 per cent during this period. The movements are in the right direction although the growth in SET is still insufficient to meet national priorities. Increases in SET are restricted by the fact that only 25 000 matriculants per year are obtaining exemptions in Mathematics on the higher grade. In the N1 – 3 provision, 54. 4 per cent of learners are enrolled in Engineering Studies and 30 per cent in Business Studies. In the post-school N4 – N6 band, this ratio is reversed with 71. 9 per cent enrolled for Business Studies and only 16. 5 per cent in Engineering Studies. These figures are problematic, particularly given the importance of producing sufficient skilled and highly skilled technical personnel needed in the South African labour market currently and in future.102
Curriculum Development The current economic and social conditions require that learning institutions offer relevant programmes, that is, an education that offers solutions to today’s problems and challenges. It is, therefore, important that government, through SETAs, National Skills Authority and Provincial Skills Development Forums, collaborate with the private sector to directly address the question of skills shortage in the country through a responsive curriculum. The current move that sees the FET Curriculum as outcome-based and learner-centred and vocationally specific (offered in Technical Colleges) as it offers both general/academic and vocational (offered in schools), might also help in encouraging learners to take Mathematics as it has a fundamental component that comprises Communication and Mathematics and restricted choice of electives.
The Report of the Ministerial Investigation into the Senior Certificate notes that the Senior Certificate serves three different purposes, failing to achieve any of them successfully. It serves as a school leaving certificate but is not attained by the majority of learners who leave school. It serves as a university screening mechanism but is only effective as a predictor of success among high scoring students. It serves as an employment screening mechanism but does not address work-related competences and is not perceived by employers as a particularly good indicator of success.103
Therefore, the current proposal to replace the Senior Certificate (obtainable in grade 12) with the Further Education and Training Certificate (FETC) is a progressive step by the NDE. Nonetheless, this is dependent upon whether the newly proposed curriculum would address this and other related challenges within this sector since the primary purpose of the FETC is to equip learners with the knowledge, skills and
102 Human Resource Development Strategy for South Africa: A Nation at Work for a Better Life for All, 2000. 103 FETC Policy document, February 2001. (http://www.saqa.org.za/publications/pol-docs/fetc.html) Site visited on 14 August 2002.
Right to Education – Period: April 2000 – March 2002
322
values that will enable meaningful participation in, and offer benefits for, society. This will also provide a basis for continuing learning in Higher Education and Training, and thus enable learners to be productive and responsible in the workplace. 8. CONCLUSION The South African education system is currently feeling the impact of the ‘new economy’ changes. According to the study conducted by the HSRC in KwaZulu-Natal, the labour market has become dysfunctional. One of the highlights of the study is the collapse of the structured apprenticeship-technical labour market that ensured the placement of most of the young graduated white artisans in the racially exclusive labour markets of the 1940s–1970s. The following paints a clear picture of both the previous and current scenarios:
In the era of great apartheid economic boom (late 1950s to early 1970s) almost all students at Technical Colleges were apprentices who were sponsored by industry to study mainly technical/engineering fields. They trained part-time in block release format, working for their employer for the rest of the time. They had access to work experience and received practical training from senior artisans on the shop floor. In the period since the statutory de-racialisation of the apprenticeship system (1981), and more recently with the rapid de-racialisation of Technical Colleges (since 1994), these social conditions have been dramatically inverted. 90 per cent of students in Technical Colleges are now black. Most study full-time with no employer sponsorship. Job placement rates after training are estimated to be at an average of about 15 per cent. Employer indenturing of new apprenticeship has dropped dramatically.104
The scenario described above requires commitment from all the sectors, public/government and private to work together to help the country gain the skills that it requires particularly in those fields that display skills shortage. The introduction of learnerships in all the nine provinces is a good move by government; it should be a continuous process that would also help the youth that does not have work experience.
Youth unemployment impacts principally on two groupings – the immediately out-of-school youth but also those young people who have not had any previous experience. Unemployment is the highest amongst this latter category.105
Initiatives such as the Colleges Collaboration Fund (CCF) formed between government and private sector in Cape Town in October 1999 should be supported and strengthened to make the FET Sector a vibrant and a responsive one to the needs of the country’s economy. The Business Trust injected an amount of R100 million
104 Ibid. 105 HRD: A Nation at Work for a Better Life for All, op.cit., p. 40.

Right to Education – Period: April 2000 – March 2002
323
into the CCF with an aim of transforming the vocational education in Technical Colleges so that they meet the needs of the 21st century.106 If graduates receive relevant education and experience, chances are that those who cannot find employment can create some thereby contributing to the economy of the country through their participation in the Small Micro and Medium Enterprises (SMMEs) sector. The exclusion of blacks from participating meaningfully in the economy can no longer be allowed as it now affects the entire country negatively. The relationship between the Departments of Education and Labour and the private sector is a step in the right direction if the state is to succeed in making education responsive to the country’s economic and social needs. This relationship between these parties is desirable and highly commendable. Co-operation between the two government departments and the private sector could be utilised to provide relevant skills to the qualified but unemployed and out-of-school youth. The government’s Human Resource Development (HRD) Strategy for South Africa highlights a number of challenges facing the FET and HET bands, including the following:
• Learning in areas of scarce skills; • Placement rate of FET and HET graduates; and • Labour market discrimination.
106 Delien Burger, South African Yearbook, Government Communication and Information System, 2001/2002.

Right to Education – Period: April 2000 – March 2002
324
ABBREVIATIONS CCF Colleges Collaboration Fund ECDE Eastern Cape Department of Education FET Further Education and Training FETC Further Education and Training Certificate GDE Gauteng Department of Education HET Higher Education and Training HRC Human Rights Commission HRD Human Resource Development Strategy for South Africa HSRC Human Sciences Research Council KZNDEC KwaZulu-Natal Department of Education and Culture LDE Limpopo Department of Education LSMs Learner Support Materials MEC Member of Executive Committee MDE Mpumalanga Department of Education NAP National Action Plan NCDE Northern Cape Department of Education NDE National Department of Education NWDE North West Department of Education PEDs Provincial Education Departments PFMA Public Finance Management Act SET Science, Engineering and Technology SETA Sector Education and Training Authority SMMEs Small Medium Micro Enterprises SRC Student Representative Council WCDE Western Cape Department of Education
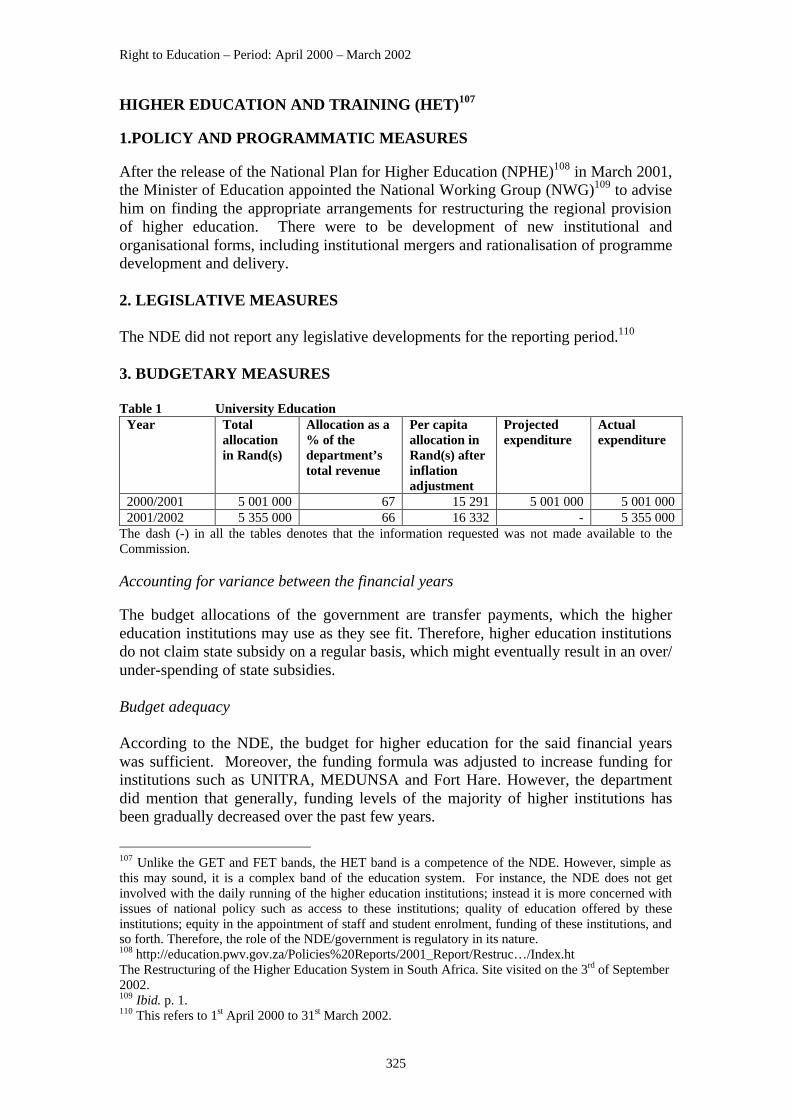
Right to Education – Period: April 2000 – March 2002
325
HIGHER EDUCATION AND TRAINING (HET)107 1.POLICY AND PROGRAMMATIC MEASURES After the release of the National Plan for Higher Education (NPHE)108 in March 2001, the Minister of Education appointed the National Working Group (NWG)109 to advise him on finding the appropriate arrangements for restructuring the regional provision of higher education. There were to be development of new institutional and organisational forms, including institutional mergers and rationalisation of programme development and delivery. 2. LEGISLATIVE MEASURES The NDE did not report any legislative developments for the reporting period.110 3. BUDGETARY MEASURES Table 1 University Education
Year Total allocation in Rand(s)
Allocation as a % of the department’s total revenue
Per capita allocation in Rand(s) after inflation adjustment
Projected expenditure
Actual expenditure
2000/2001 5 001 000 67 15 291 5 001 000 5 001 000 2001/2002 5 355 000 66 16 332 - 5 355 000
The dash (-) in all the tables denotes that the information requested was not made available to the Commission. Accounting for variance between the financial years The budget allocations of the government are transfer payments, which the higher education institutions may use as they see fit. Therefore, higher education institutions do not claim state subsidy on a regular basis, which might eventually result in an over/ under-spending of state subsidies. Budget adequacy According to the NDE, the budget for higher education for the said financial years was sufficient. Moreover, the funding formula was adjusted to increase funding for institutions such as UNITRA, MEDUNSA and Fort Hare. However, the department did mention that generally, funding levels of the majority of higher institutions has been gradually decreased over the past few years.
107 Unlike the GET and FET bands, the HET band is a competence of the NDE. However, simple as this may sound, it is a complex band of the education system. For instance, the NDE does not get involved with the daily running of the higher education institutions; instead it is more concerned with issues of national policy such as access to these institutions; quality of education offered by these institutions; equity in the appointment of staff and student enrolment, funding of these institutions, and so forth. Therefore, the role of the NDE/government is regulatory in its nature. 108 http://education.pwv.gov.za/Policies%20Reports/2001_Report/Restruc…/Index.ht The Restructuring of the Higher Education System in South Africa. Site visited on the 3rd of September 2002. 109 Ibid. p. 1. 110 This refers to 1st April 2000 to 31st March 2002.

Right to Education – Period: April 2000 – March 2002
326
Table 2 Technikon Education Year Total
allocation in Rand(s)
Allocation as % of the
department’s total revenue
Per capita allocation in Rand(s) after
inflation adjustment
Projected expenditure
Actual expenditure
2000/2001 1 977 000 26 10 752 000 1 977 000 1 977 000 2001/2002 2 104 000 26 11 875 000 2 104 000 2 104 000
Accounting for variances between the financial years in the table See the same section under “University Education” table. Budget Adequacy The budget allocation for technikons was said to be sufficient. Table 3 National Student Financial Aid Scheme (NSFAS)
Year Total allocation
in Rand(s)
Allocation as % of the
department’s total revenue
Per capita allocation in
Rand(s) after
inflation adjustment
Projected expenditure
Actual expenditure
2000/2001 444 000 6 6 712 444 000 444 000 2001/2002 450 000 6 - 450 000 450 000
Budget Adequacy The NDE reported that most higher education institutions were able to spend all their funds. Unspent funds at some higher education institutions owing to administrative restrictions applicable to those institutions were re-allocated to other institutions in need of financial resources. 4. INDICATORS Table 4 Tertiary Education
Universities Technikons Learner/Educator Ratio 35 60 Total number of learners 407 401 202 730 Female 228 462 93 832 Disabled - - African 218 615 148 236 Coloured 19 956 12 490 Indian 31 987 8 189 White 132 221 33 631 Indigenous groups - - Refugees and asylum seekers - -

Right to Education – Period: April 2000 – March 2002
327
5. CRITIQUE Policy and Programmatic Measures Currently, the dominating theme in the HET band is restructuring and transformation. This resulted in the rationalisation of some programmes and reduction of institutions of higher education from 36 to 22.111 The NPHE was the culmination of a wide-ranging policy process for the transformation of the higher education system, which started in the early 1990s.112 The transformation and restructuring of the higher education includes merging and incorporation of, inter alia, financially unstable institutions and the rationalisation of facilities between some institutions through regional collaboration. Other important factors that were taken into account in the restructuring and transformation of the higher education system comprised the following:
• the size of student enrolment in an institution • graduation rates113 • weak leadership and governance structures114 • the size of research output115 • the quality of educational processes116 • student drop-out rates117
There is a profound contrast between the Historically Black Institutions (HBIs) and Historically White Institutions (HWIs). In the words of the Minister of Education:
The origins of the current institutional structure of the higher education system can be traced to the geo-political imagination of
111 Not 21 as initially suggested in the NWG report on the restructuring and transformation of the higher education system in South Africa. 112 See 2 supra. 113 For example, during their study of the higher education system, the NWG found that:
• The Eastern Cape Technikon and Border Technikon had the lowest graduation rates in the technikon sector.
• The University of Port Elizabeth had graduation rates that were all below comparable national averages.
• In 2000 Fort Hare produced a total of only 536 graduates; of whom only 12 obtained masters or doctoral degrees.
114 Currently, the University of Transkei and the University of the North (in Limpopo) are both managed by administrators. 115 The NWG found that Fort Hare’s research publication total had been below 50 units for a number of years. 116 One of the recommendations made by the NWG for the Eastern Cape was that the Eastern Cape Technikon and Border Technikon be merged into one unitary institution to improve the quality of their educational processes, and to procure the additional resources that would be needed. According to the NWG, the data obtained on Vaal Triangle Technikon in Vanderbijlpark showed that there was considerable room for improvement with regard to the productivity of its educational processes. 117 The NWG found that student drop-out rates at Vaal Triangle Technikon were higher than the national averages for the technikon system. It was also found that the Northern Gauteng Technikon had high rates of student dropping out without completing their qualifications.

Right to Education – Period: April 2000 – March 2002
328
apartheid’s master planner, Hendrik Verwoerd, and his reactionary ideological vision of “separate but equal development.”118
It is important to note that most of the problem areas identified by the NWG are more common in the HBIs of higher learning. By the same token there are also those features that are only peculiar to the HWIs of higher learning. It is worth referring to them as well; they comprise the following:
• staff and student inequity119 • financial stability120 • success rate of students121 • overlap in programme offerings122
The differentiation between the types of problems and challenges facing the HBIs on one hand, and those of the HWIs on the other, does not suggest that the two types of higher learning institutions do not share the same problems. For instance, the HBIs also do experience the problem of duplicating their programme offerings. However, much as there are those problems that are common to both types of institutions, almost all of the problems referred to above seem to be salient in each type of an institution. It is such salience that justifies the reconfiguration of the higher education landscape. In its report on the restructuring and transformation of the higher education system in South Africa, the NWG paints a clear picture of the current state of the higher education system in the country:
The structural inefficiencies, furthermore, have given rise to a range of systemic problems, which adversely impact on the effectiveness and efficiency of the higher education system. These problems, as the National Plan suggests, relates to the “overall quality and quantity of graduate and research outputs; management, leadership
118 http://education.pwv.gov.za/Policies%20and%20R…/transformation_and_restructuring.ht Transformation and Restructuring: A New Institutional Landscape for Higher Education, Ministry of Education, June 2002. Site visited on 11 July 2002. 119 The University of Free State, Technikon Free State, Rand Afrikaans Universiteit (RAU) and the University of the Witwatersrand are a good example of this. The NWG found that the University of Free State and Technikon Free State are below national averages with respect to staff equity. The NWG also found that the University of the Witwatersrand had made good progress in achieving equity in its student body, however, there was still more room for improvement in terms of achieving equity in its academic and administrative staff profiles. Regarding RAU, the NWG had the following to say:
Likewise, Rand Afrikaans Universiteit has gone through a process of transformation in which black students are now slightly in the majority in overall enrolments, and where English has become one of the languages of tuition. Notwithstanding this, a great deal still needs to be done to correct the imbalances in demographic profile of the contact student body, which to date remains as much as 70 per cent white.
The institution also needs to move towards a more satisfactory degree of representivity among academic and administrative staff. 120 The NWG found that the University of the Witwatersrand and Rand Afrikaans Universiteit are stable, well managed and in good financial positions. 121 In the case of the University of Pretoria, the NWG found that the different success rates of students, particularly those of African students in undergraduate contact programmes are further signs of inequities at the university. 122 The NWG proposed that RAU, the University of the Witwatersrand and University of Pretoria rationalise some of their programmes offerings.

Right to Education – Period: April 2000 – March 2002
329
and governance failures; lack of representative staff profiles; institutional cultures that have not transcended the racial divides of the past; and the increased competition between institutions which threaten to fragment further the higher education system.123
The issues of distribution of students in various study fields, staff and student equity, drop-out student rates and success rate of students need to be brought to the fore and be addressed as a matter of urgency. The rationale for according these issues urgency stems from their location in the HWIs. Distribution of students in various fields of study This is one challenge facing the higher education system. The distribution of students across the various fields of study has improved, however, they are still skewed both in terms of race and gender.
The rapid increase in African students, however, masks an equity similar to that of female students. Large proportions of African students were in 1999 enrolled in distance education programmes, most of which were humanities and teacher-upgrade programmes. The numbers and proportions of African students in programmes in science, engineering and technology and in business/management remained low in 1999. Postgraduate enrolments across most fields are also extremely low.124 Female students tend to be clustered in the humanities, and in particular, teacher education programmes. They remain seriously under-represented in science, engineering and technology and in business and management. These are programmes that produce higher levels of private benefits to successful graduates than those in education and in the humanities. (Quoted in the NPHE document).125
A recommendation by the Human Sciences Research Council (HSRC) to government is as follows:
Data will need to be continuously collected, analysed and acted upon in future – especially to measure and promote black student participation in post-graduate programmes and fields of study such as medicine, law and engineering.126
Staff and student equity
Black students (and specifically African students) are now in the majority in South Africa’s HET institutions. This is an improving
123Human Resource Development Strategy for South Africa 124 http://education.pwv.gov.za/DoE_Sites/Higher_Education/…/CHE_Report30June2000.ht Towards a New Higher Education Landscape: Meeting the Equity, Quality and Social Development Imperatives of South Africa in the 21st Century, 30 June 2000. Site visited on 10 July 2002. 125 Ibid. p. 18. 126 Human Resource Development Strategy for South Africa: A Nation at Work for a Better Life for All, 2000. p. 9.

Right to Education – Period: April 2000 – March 2002
330
trend, but inequalities in the staffing of institutions still prevail. In 1998, whites still constituted 80 per cent of academic staff in HET, with Africans at 12 per cent, Coloureds at 3 per cent, and Indian academic staff at 5 per cent.127
It should be recalled that most of the HWIs were not directly affected by the process of restructuring and transformation. Most of their challenges are more internal, including the three referred to above. This is one area which government will have to monitor through the setting of clear and realistic targets. The internal transformation envisaged in NWG Report will not and cannot happen by itself; the government needs to steer the middle ground to achieve this goal. The following excerpt makes the point clearly on this matter:
As a general rule, states parties are obliged to fulfil (provide) a specific right in the Covenant on Economic, Social and Cultural Rights when an individual or group is unable, for reasons beyond their control, to realise the right themselves by the means at their disposal.128
Drop-out student rates Whilst the Council on Higher Education was able to establish the number of first-time entering undergraduates who drop out of university and technikon each year, they did not provide the causes of these alarming statistics on drop-out student rates. The only cause that seemed to be mentioned, indirectly so, is the lack of student academic development programmes. It would be useful to establish the number of students who drop out of higher learning institutions on other grounds such as financial challenges and family responsibilities. Success rates of students The NWG found that the success rates of students in some higher education institutions were low. The University of Pretoria and RAU are some of the institutions facing a challenge of ensuring that the success rates of their students improve. The different success rates of students, particularly those of African students in undergraduate contact programmes are further signs of inequities at the university.129 One way of dealing with this challenge is the design of effective academic development programmes to bridge the gap between high school and university environments. One of the inefficiencies raised in the report on restructuring and transformation of the higher education system is the issue of students who fail their courses but are retained in the institutions of higher learning without any assistance, such as, academic development programmes.
127Ibid. p. 9. 128 Committee on Economic, Social and Cultural Rights: Reports on the Twentieth and Twenty-First Sessions (26 April – 14 May 1999, 15 November – 3 December 1999), Economic and Social Council, Supplement No. 2, Official Records, 2000.

Right to Education – Period: April 2000 – March 2002
331
A number of students report poor success rates by course (averages of 70 per cent and below), low graduation rates (often 15 per cent or below), and yet record no academic exclusions. This means that their enrolment (and their subsidy student) totals are inflated by repeating students who have little or no prospect of completing the ir studies. Of course, such prospects are not unrelated to whether there are appropriate academic support and development initiatives at institutions.130
The need for appropriate academic development programmes to assist the students who are struggling academically cannot be over-emphasised. Students’ academic performance needs to be monitored so that financial resources can be given to those students who show greater prospects of completing their academic programmes. The funding of students who keep failing burdens the state financial resources. Higher learning institutions should do everything possible to ensure that students who are struggling academically are given an equal opportunity with those who are coping academically. Vulnerable and Marginalised Groups According to the NDE, to address the needs of the vulnerable and marginalised groups, the department made amounts of R60 million and R30 million available to all higher education institutions in 1999/2000 and 2000/2001. Regarding technikons the NDE’s response was that historically black technikons operate on a 90 per cent government contribution ratio in the subsidy formula, whereas historically white technikons operate on an 80 per cent government contribution ratio. The NSFAS supports academically deserving - but financially constrained students to obtain qualification in higher education. This is an efficient mechanism of redistributing resources to the underprivileged. Most students benefiting from the NSFAS are Africans. Budgetary Measures The funds should not have been reallocated to other institutions in case of universities; instead the administrative restrictions placed on the use of funds should have been dealt with to ensure that the institutions that had been allocated such funds use the funds. Taking a closer look at the budget allocation for the higher education as a whole, it could be said that the budget allocation has increased in nominal terms compared to previous years. However, it can only be hoped that once the process of restructuring and transformation has taken off, better use of resources would help leverage the scarce financial resources. The report on transformation and restructuring in higher education endorses this view as well:
130 Towards a New Higher Education Landscape, CHE Reports, op. cit.

Right to Education – Period: April 2000 – March 2002
332
The Ministry has, however, decided that it would not require all institutions to submit three-year “rolling” plans in 2002. This is informed by the fact that the Ministry anticipates that the institutions affected by the merger proposals are likely to be preoccupied with assessing the implications of, and developing their responses to, the merger proposals. The additional requirement to submit three-year “rolling” plans would be beyond the capacity of most institutions.131
Whilst the NDE asserted that the funds allocated to the higher education institutions during the reporting period were sufficient, there is still a need to establish the number of students who drop out in the higher education band on financial grounds. The establishment of the National Student Financial Aid Scheme (NSFAS) in 1999 was a commendable step, however, more innovative ways still have to be found to leverage the scarce financial resources for higher education. Indicators Whilst it is acknowledged that the enrolment of African and female students in the higher education institutions has increased compared to the previous years, it is disconcerting that the NDE did not furnish the HRC with information on the enrolment statistics of the following categories of vulnerable and marginalised groups:
• The disabled; • Indigenous groups; and • Refugees and asylum seekers.
It is important that the statistics on these categories of vulnerable and marginalised groups are considered for the purpose of government policy planning. Any programme that does not cater for the vulnerable and marginalised groups would not pass the Grootbooom test of reasonableness:
To be reasonable, measures cannot leave out of account the degree and extent of the denial of the right they endeavour to realise. Those whose needs are the most urgent and whose ability to enjoy all rights therefore is most in peril, must not be ignored by the measures aimed at achieving realisation of the right. It may not be sufficient to meet the test of reasonableness to show that the measures are capable of achieving a statistical advance in the realisation of the right. Furthermore, the Constitution requires that everyone must be treated with care and concern. If the measures, though statistically successful, fail to respond to the needs of those most desperate, they may not pass the test.132
131 Ibid, p. 19. 132 Grootboom, op.cit.

Right to Education – Period: April 2000 – March 2002
333
6. RECOMMENDATIONS Appropriate academic development programmes need to be put in place if the state financial resources are to be used efficiently and effectively. If such programmes are put in place and other related initiatives developed, clear policies on exclusions based on poor academic performance can then be applied. In addressing the issue of poor academic performance by students in the HET sector, the report of the Council on Higher Education on the Shape and Size of Higher Education goes even beyond the “common” definition of “equity”:
Equity should mean more than access into higher education. It must incorporate equity of opportunity – environments in which learners, through academic support, excellent teaching and mentoring and other initiatives, genuinely have every chance of succeeding. Equity, to be meaningful, is also ensuring that learners have access to quality education, and graduate with the relevant knowledge, competencies, skills and attributes that are required for any occupation and profession.133
It is important for government to come up with clear targets on issues such as student and staff equity to guide the internal transformation in higher learning institutions that were not directly affected by transformation and restructuring. Leaving such a process to higher learning institutions would not be a guarantee that the process indeed takes place meaningfully. 7. CONCLUSION Whilst the State has taken a bold step in leading the transformation and restructuring of the higher education system, a few post-transformation and restructuring challenges still await the Ministry of Education and the rest of the constituencies. These include the Ministry of Education ensuring that:
• the reduction of the number of higher learning institutions from 36 to 22 does not amount to an arithmetics game, but to a process that enables the higher learning sector to respond positively to the socio-economic challenges the country is currently facing;
• those higher learning institutions that are not directly affected by the process of transformation and restructuring do not become the preserve of an entrenched culture of the few;
• those institutions not directly affected by the process of transformation and restructuring undergo the necessary internal transformation proposed in the NPHE, and realistic targets are designed to achieve this goal; and
• the National Institutes of Higher Education envisaged for Mpumalanga and the Northern Cape, do not produce an oversupply of their graduates like the apartheid government did particularly in the areas of education and humanities.
133 Op. cit. p. 9.

Right to Education – Period: April 2000 – March 2002
334
The CHE Report attests to the scenario referred to above:
In terms of national development needs, there is a greater concentration of students in the humanities and education fields relative to other fields. In 1999 about 15 per cent of all students in universities and technikons were following teacher training programmes and about 35 per cent other humanities programmes.134
134Ibid. p. 18.

Right to Education – Period: April 2000 – March 2002
335
ABBREVIATIONS CHE Council on Higher Education HBIs Historically Black Institutions HET Higher Education and Training HSRC Human Sciences Research Council HRC Human Rights Commission HRD Human Resource Development Strategy for South Africa HWIs Historically White Institutions NDE National Department of Education NPHE National Plan for Higher Education NSFAS National Student Financial Aid Scheme NWG National Working Group UNITRA University of Transkei

Right to Education – Period: April 2000 – March 2002
336