Embed Size (px)
Citation preview
CHAPTER 7PRINCIPLES OF EUTRALIZATION
TITRATIONS: DETERMINING ACIDS, BASES, AND THE pH OF
BUFFER SOLUTIONS
Introduction toIntroduction toAnalytical ChemistryAnalytical Chemistry
Copyright © 2011 Cengage Learning7-2
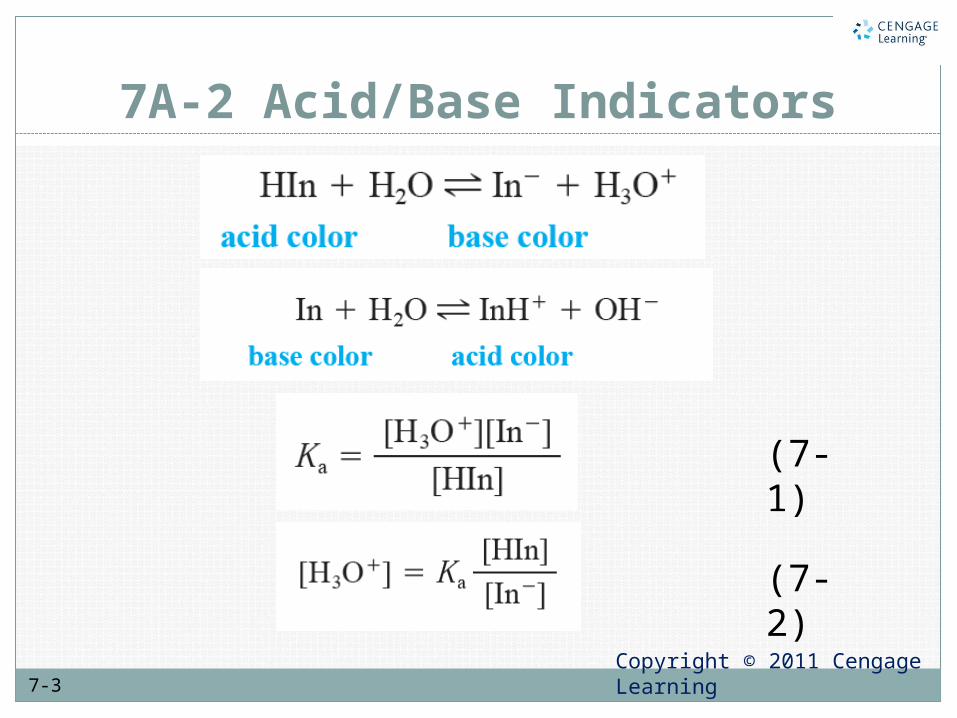
7A-2 Acid/Base Indicators
An acid/base indicator is a weak organic acid or a weak organic base whose undissociated form differs in color from its conjugate form.
Copyright © 2011 Cengage Learning7-3
7A-2 Acid/Base Indicators
(7-1)
(7-2)
Copyright © 2011 Cengage Learning7-4
7A-2 Acid/Base Indicators
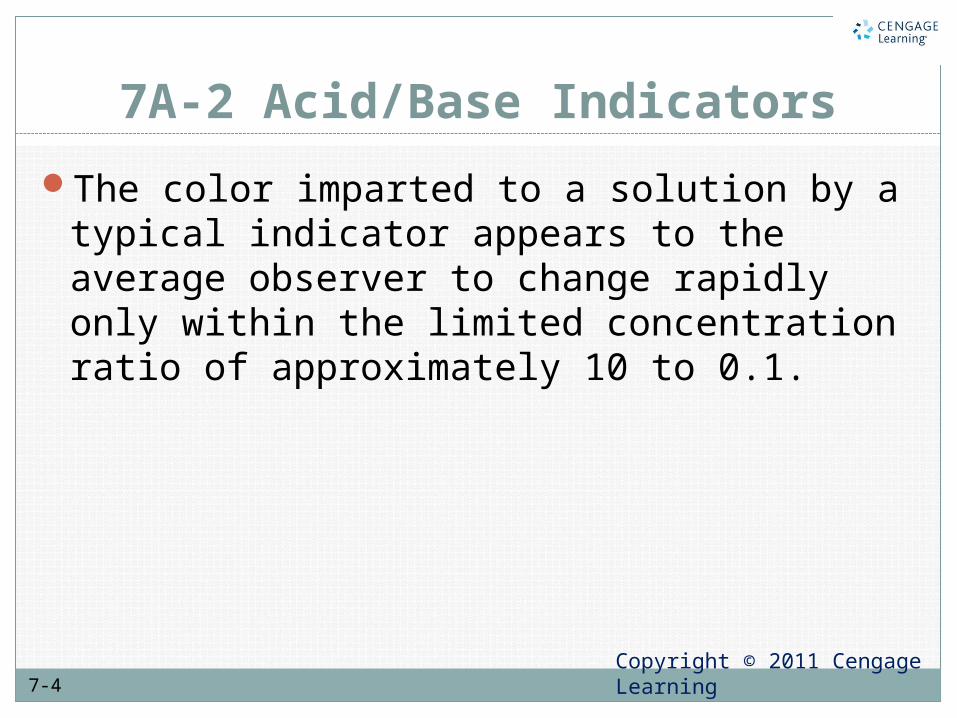
The color imparted to a solution by a typical indicator appears to the average observer to change rapidly only within the limited concentration ratio of approximately 10 to 0.1.

Copyright © 2011 Cengage Learning7-5
7A-2 Acid/Base Indicators
HIn exhibits its pure acid color when
and its base color when
Copyright © 2011 Cengage Learning7-6
7A-2 Acid/Base Indicators
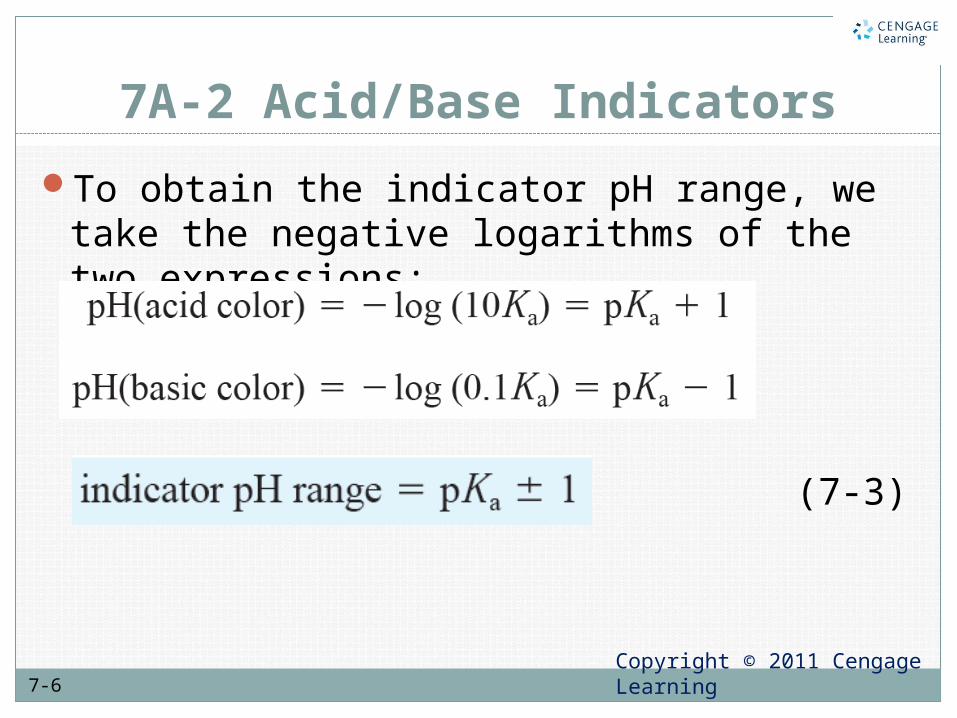
To obtain the indicator pH range, we take the negative logarithms of the two expressions:
(7-3)

Copyright © 2011 Cengage Learning7-7
7A-2 Acid/Base Indicators
What Variables Influence the Behavior of Indicators? The pH interval over which a given indicator exhibits a color
change is influenced by temperature, by the ionic strength of the medium, and by the presence of organic solvents and colloidal particles.

Copyright © 2011 Cengage Learning7-8
7B Calculating ph In Titrations Of Strong Acids And Strong
Bases
The hydronium ions in an aqueous solution of a strong acid have two sources: (1) the reaction of the acid with water and (2) the dissociation of water itself.
Copyright © 2011 Cengage Learning7-9
7B-1 Titrating a Strong Acid with a Strong Base
Each calculation corresponds to a distinct stage in the titration: (1) preequivalence, (2) equivalence, and (3) postequivalence.
Copyright © 2011 Cengage Learning7-10
7B-1 Titrating a Strong Acid with a Strong Base
Before the equivalence point, we calculate the pH from the molar concentration of unreacted acid.
At the equivalence point, the solution is neutral and pH=7.00.
Beyond the equivalence point, we first calculate pOH and then pH. Remember that pH = pKw – pOH = 14.00 – pOH.

Copyright © 2011 Cengage Learning7-11
Example 7-1
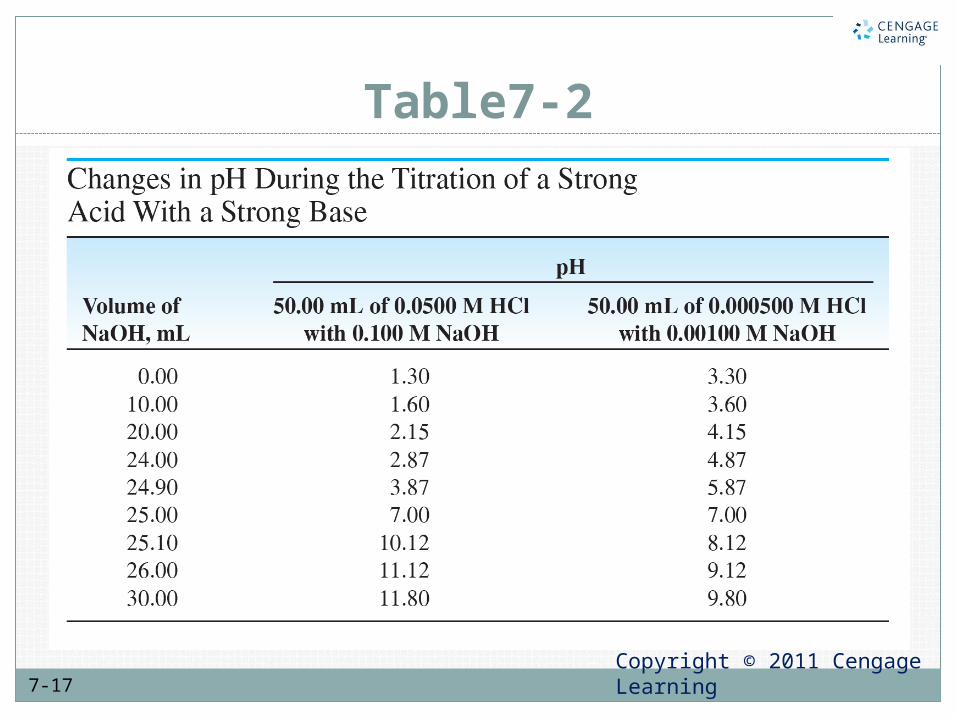
Do the calculations needed to generate the hypothetical titration curve for the titration of 50.00 mL of 0.0500 M HCl with 0.1000 M NaOH.
Initial Point

Copyright © 2011 Cengage Learning7-12
Example 7-1
After Addition of 10.00 mL of Reagent
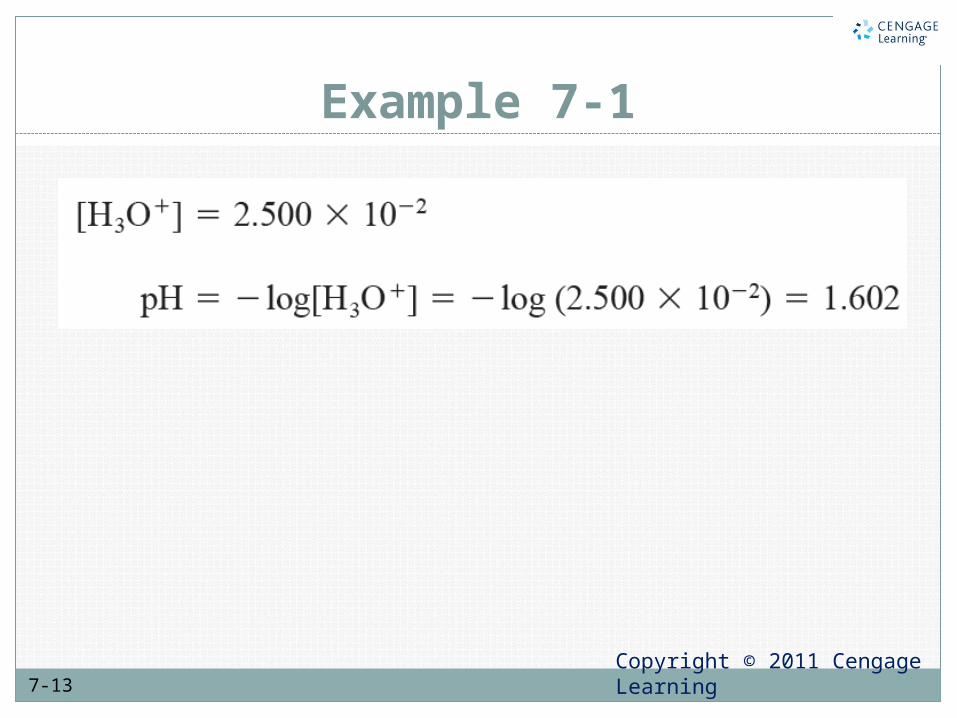
Copyright © 2011 Cengage Learning7-13
Example 7-1
Copyright © 2011 Cengage Learning7-14
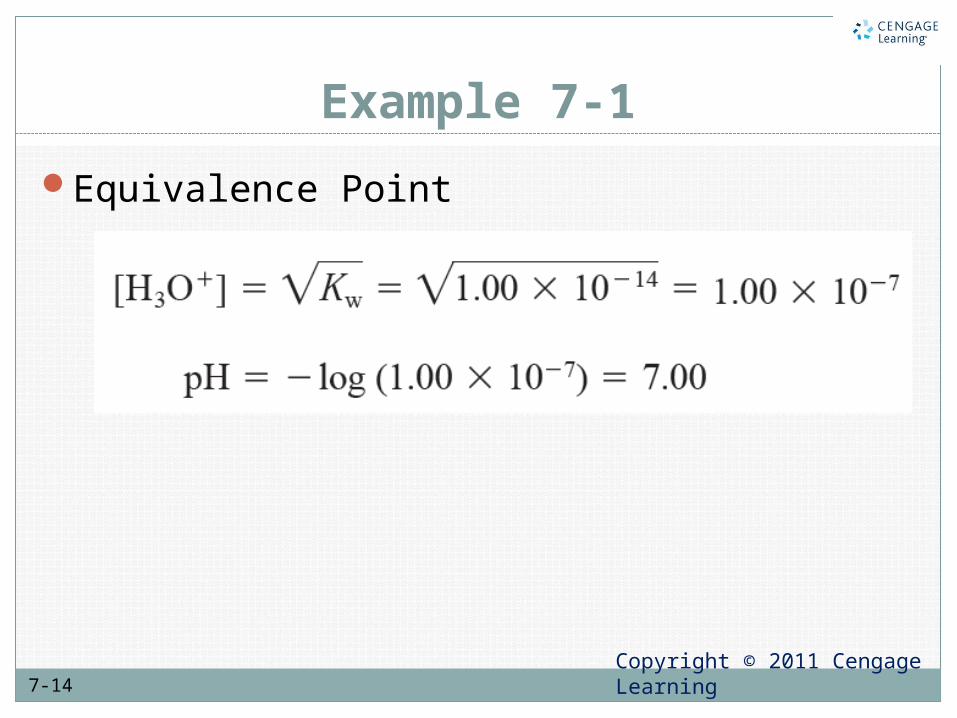
Example 7-1
Equivalence Point

Copyright © 2011 Cengage Learning7-15
Example 7-1
After Addition of 25.10 mL of Reagent

Copyright © 2011 Cengage Learning7-16
Example 7-1
and
Copyright © 2011 Cengage Learning7-17
Table7-2
Copyright © 2011 Cengage Learning7-18
Figure 7-4
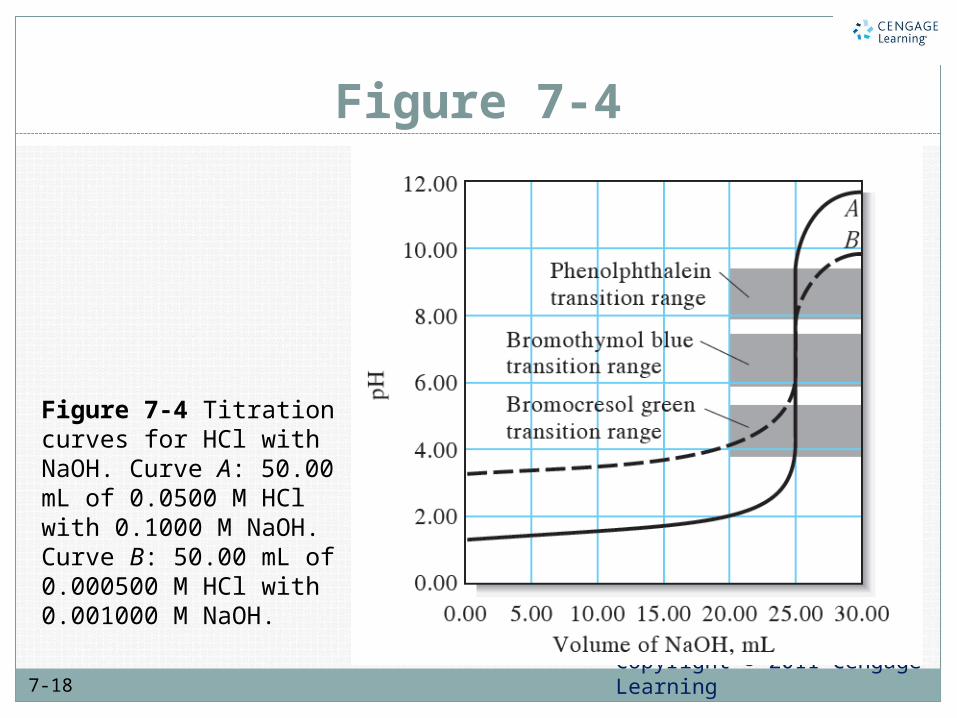
Figure 7-4 Titration curves for HCl with NaOH. Curve A: 50.00 mL of 0.0500 M HCl with 0.1000 M NaOH. Curve B: 50.00 mL of 0.000500 M HCl with 0.001000 M NaOH.
Copyright © 2011 Cengage Learning7-19
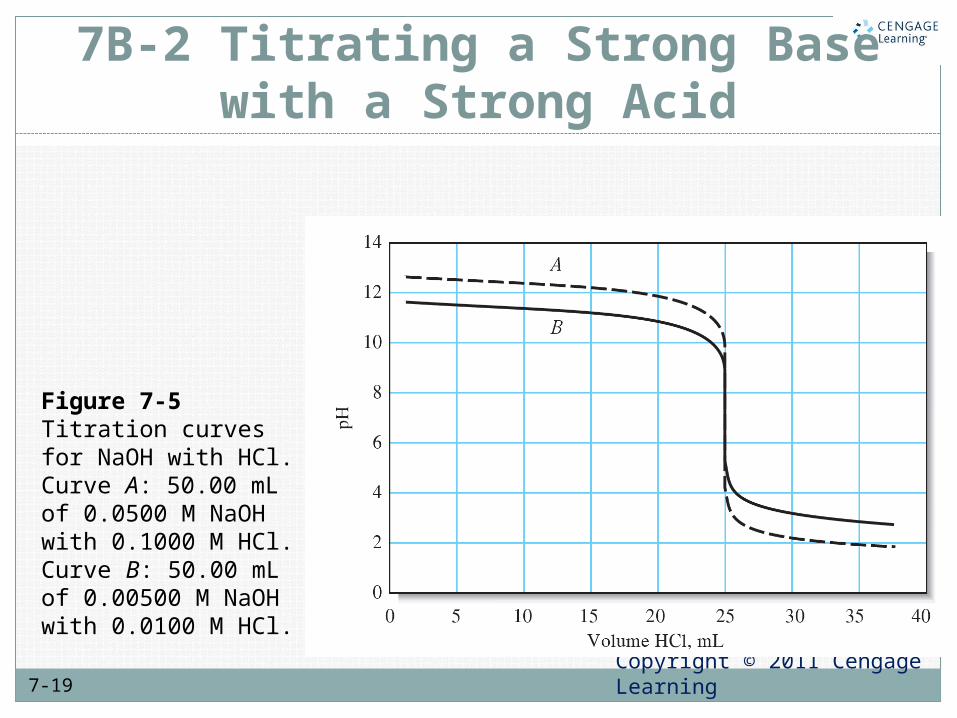
7B-2 Titrating a Strong Base with a Strong Acid
Figure 7-5 Titration curves for NaOH with HCl. Curve A: 50.00 mL of 0.0500 M NaOH with 0.1000 M HCl. Curve B: 50.00 mL of 0.00500 M NaOH with 0.0100 M HCl.
Copyright © 2011 Cengage Learning7-20
7B-2 Titrating a Strong Base with a Strong Acid
A buffer is a mixture of a weak acid and its conjugate base or a weak base and its conjugate acid that resists changes in pH of a solution.
Copyright © 2011 Cengage Learning7-21
7C Buffer SolutionsBy definition, a buffer solution is a solution of a
conjugate acid / base pair that resists changes in pH.

Copyright © 2011 Cengage Learning7-22
7C-1 Calculating the pH of Buffer Solutions
Buffers Formed from a Weak Acid and Its Conjugate Base
If the first equilibrium lies farther to the right than the second, the solution is acidic. If the second equilibrium is more favorable, the solution is basic.
7-22
(7-4)
(7-5)

Copyright © 2011 Cengage Learning7-23
7C-1 Calculating the pH of Buffer Solutions
(7-7)
(7-6)
(7-8)
(7-9)
Copyright © 2011 Cengage Learning7-24
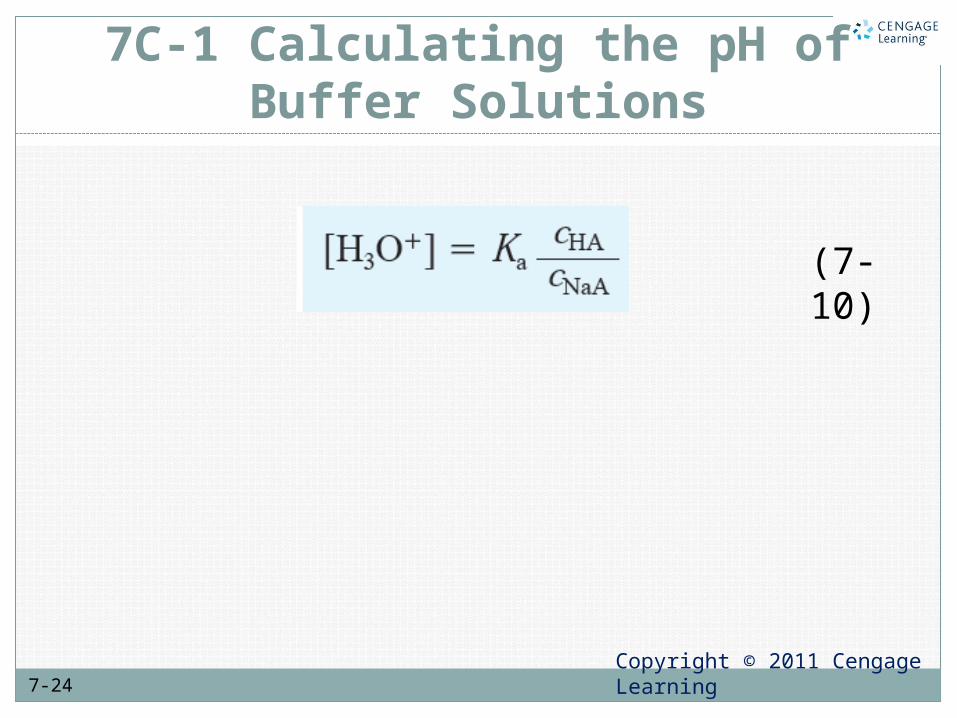
7C-1 Calculating the pH of Buffer Solutions
(7-10)

Copyright © 2011 Cengage Learning7-25
7C-2 What Are the Unique Properties of Buffer Solutions?
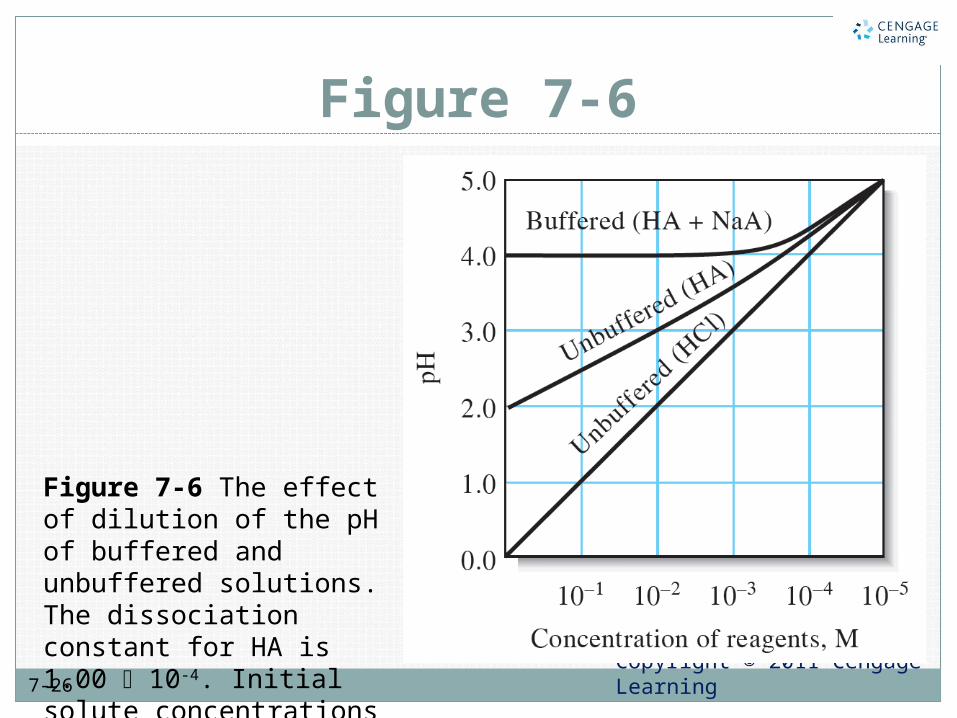
Buffers do not maintain pH at an absolutely constant value, but changes in pH are relatively small when small amounts of acid or base are added.
Copyright © 2011 Cengage Learning7-26
Figure 7-6
Figure 7-6 The effect of dilution of the pH of buffered and unbuffered solutions. The dissociation constant for HA is 1.00 10-4. Initial solute concentrations are 1.00 M.
Copyright © 2011 Cengage Learning7-27
7C-2 What Are the Unique Properties of Buffer Solutions?
The buffer capacity of a buffer is the number of moles of strong acid or strong base that causes one liter of the buffer to change pH by one unit.
Copyright © 2011 Cengage Learning7-28
Example 7-5
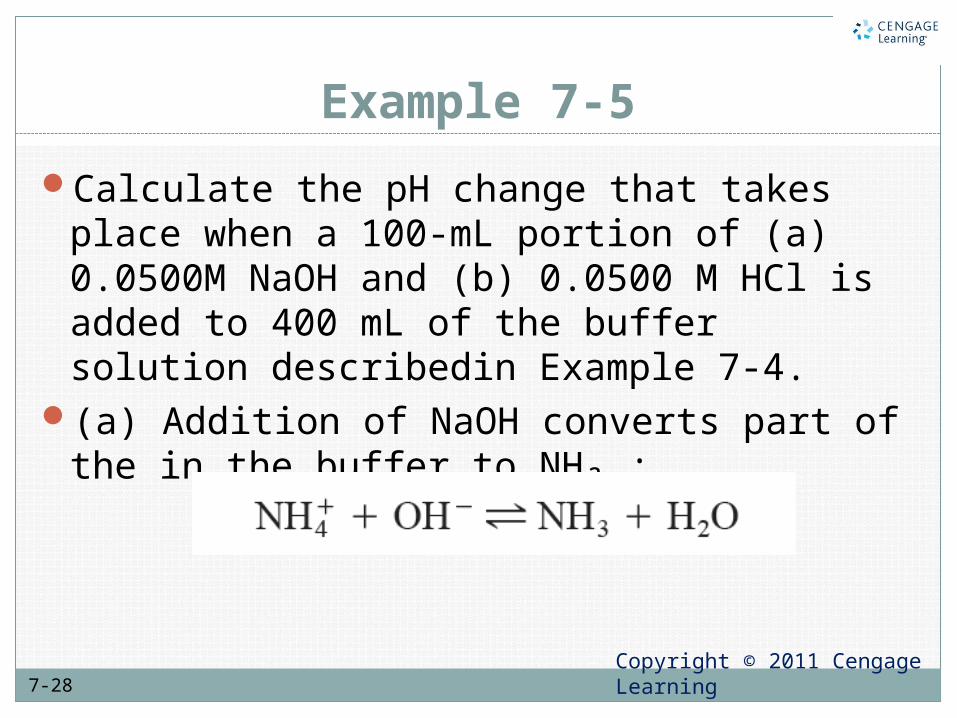
Calculate the pH change that takes place when a 100-mL portion of (a) 0.0500M NaOH and (b) 0.0500 M HCl is added to 400 mL of the buffer solution describedin Example 7-4.
(a) Addition of NaOH converts part of the in the buffer to NH₃ :
Copyright © 2011 Cengage Learning7-29
Example 7-5
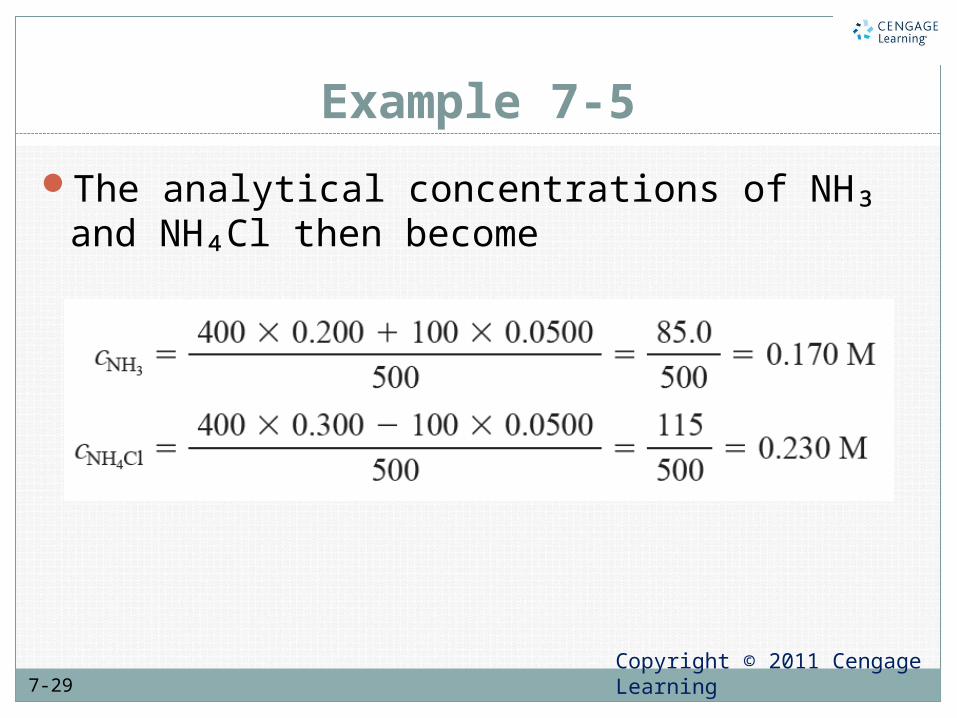
The analytical concentrations of NH₃ and NH₄Cl then become
Copyright © 2011 Cengage Learning7-30
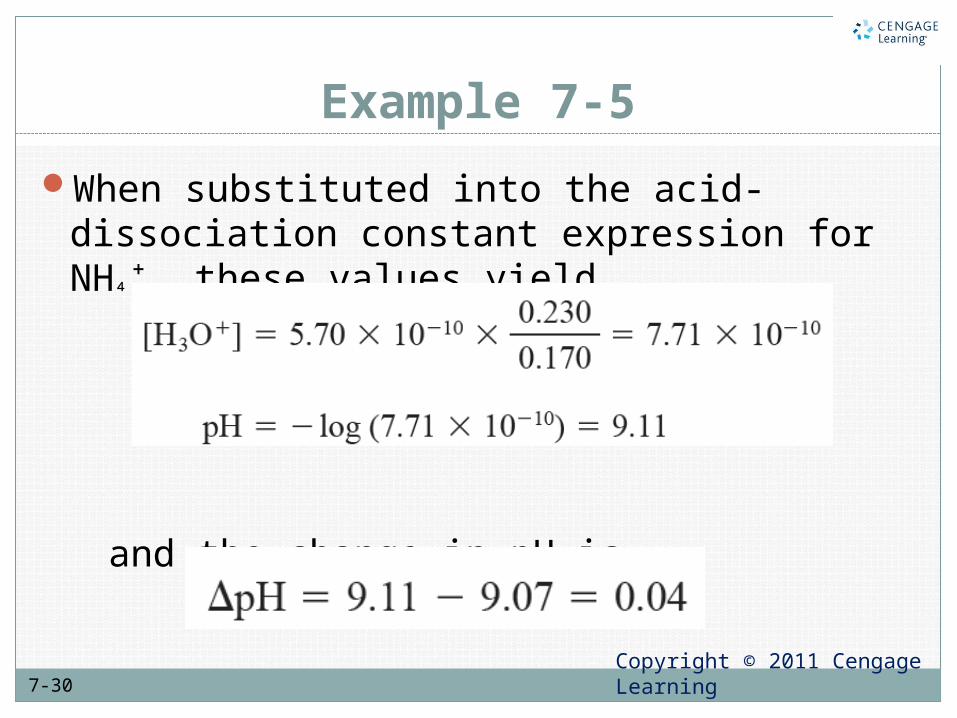
Example 7-5
When substituted into the acid-dissociation constant expression for NH⁴⁺, these values yield
and the change in pH is
Copyright © 2011 Cengage Learning7-31
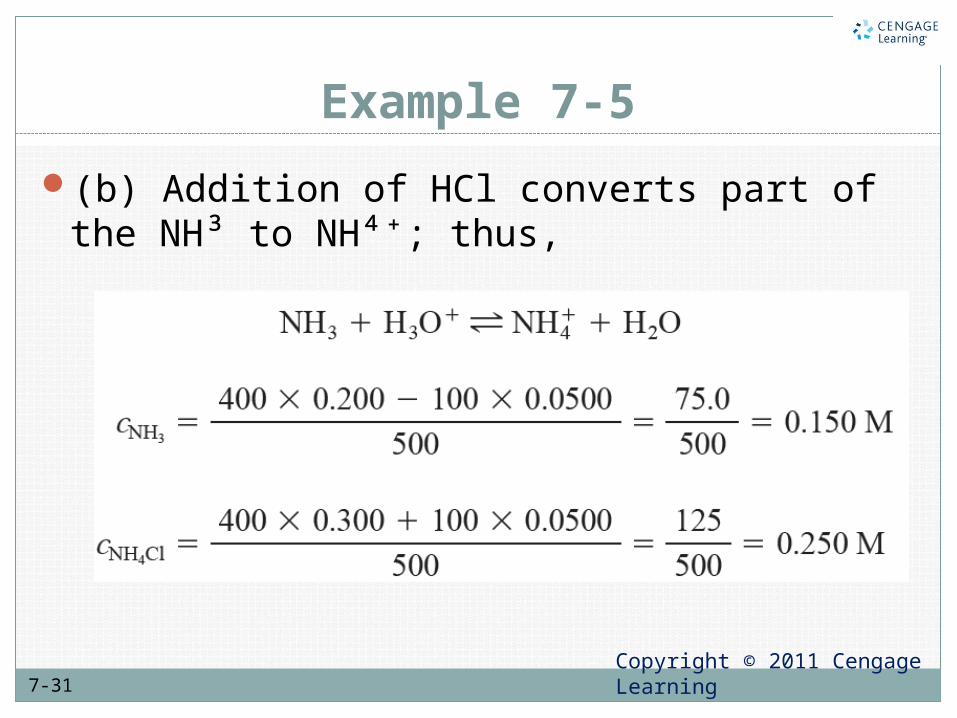
Example 7-5
(b) Addition of HCl converts part of the NH³ to NH⁴⁺; thus,

Copyright © 2011 Cengage Learning7-32
Example 7-5

Copyright © 2011 Cengage Learning7-33
Figure 7-7
Figure 7-7 Buffer capacity as a function of the ratio cNaA/cHA .
Copyright © 2011 Cengage Learning7-34
7C-2 What Are the Unique Properties of Buffer Solutions?
Preparing BuffersWe prepare buffers by making up a solution of
approximately the desired pH and then adjust by adding acid or conjugate base until the required pH is indicated by a pH meter.
Copyright © 2011 Cengage Learning7-35
7D Calculating pH in Weak Acid Titrations
1. At the beginning, the solution contains only a weak acid or a weak base, and the pH is calculated from the concentration of that solute and its dissociation constant.
2. After various increments of titrant have been added (in quantities up to, but not including, an equivalent amount), the solution consists of a series of buffers. The pH of each buffer can be calculated from the analytical concentrations of the conjugate base or acid and the residual concentrations of the weak acid or base.

Copyright © 2011 Cengage Learning7-36
7D Calculating pH in Weak Acid Titrations
3. At the equivalence point, the solution contains only the conjugate of the weak acid or base being titrated (that is, a salt), and the pH is calculated from the concentration of this product.
4. Beyond the equivalence point, the excess of strong acid or base titrant represses the acidic or basic character of the reaction product to such an extent that the pH is governed largely by the concentration of the excess titrant.
Copyright © 2011 Cengage Learning7-37
Figure 7-9
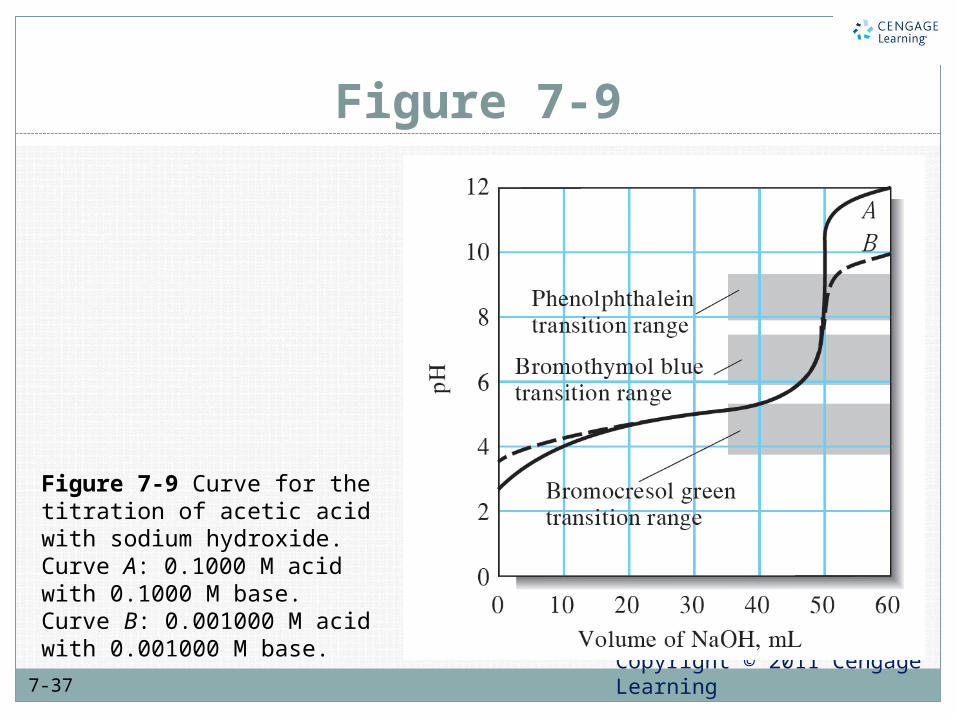
Figure 7-9 Curve for the titration of acetic acid with sodium hydroxide. Curve A: 0.1000 M acid with 0.1000 M base. Curve B: 0.001000 M acid with 0.001000 M base.
Copyright © 2011 Cengage Learning7-38
Figure 7-10
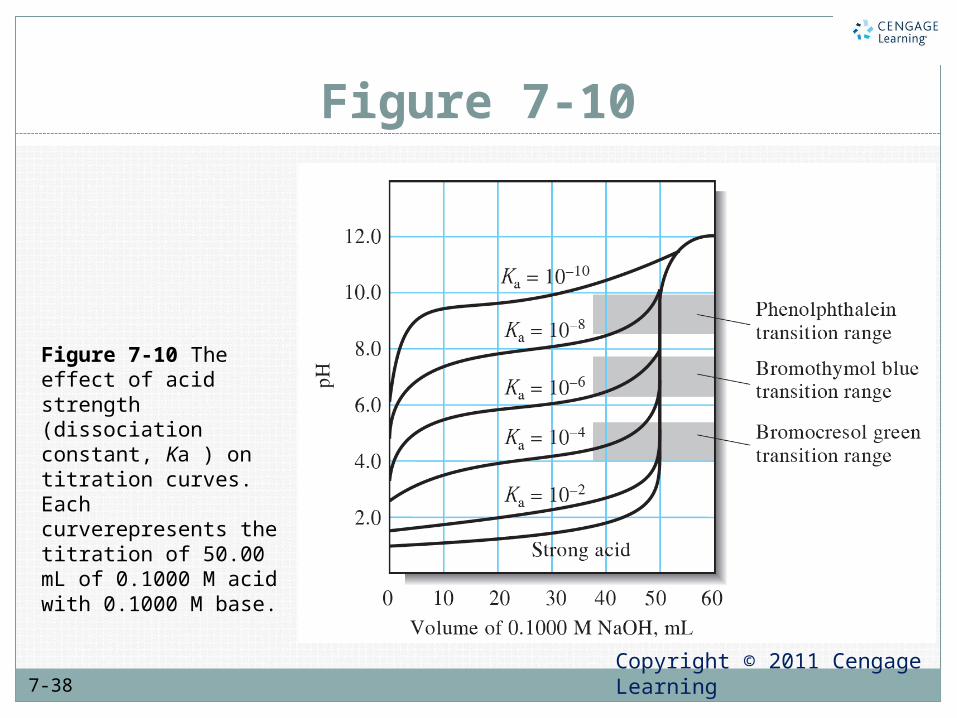
Figure 7-10 The effect of acid strength (dissociation constant, Ka ) on titration curves. Each curverepresents the titration of 50.00 mL of 0.1000 M acid with 0.1000 M base.

Copyright © 2011 Cengage Learning7-39
Example 7-7
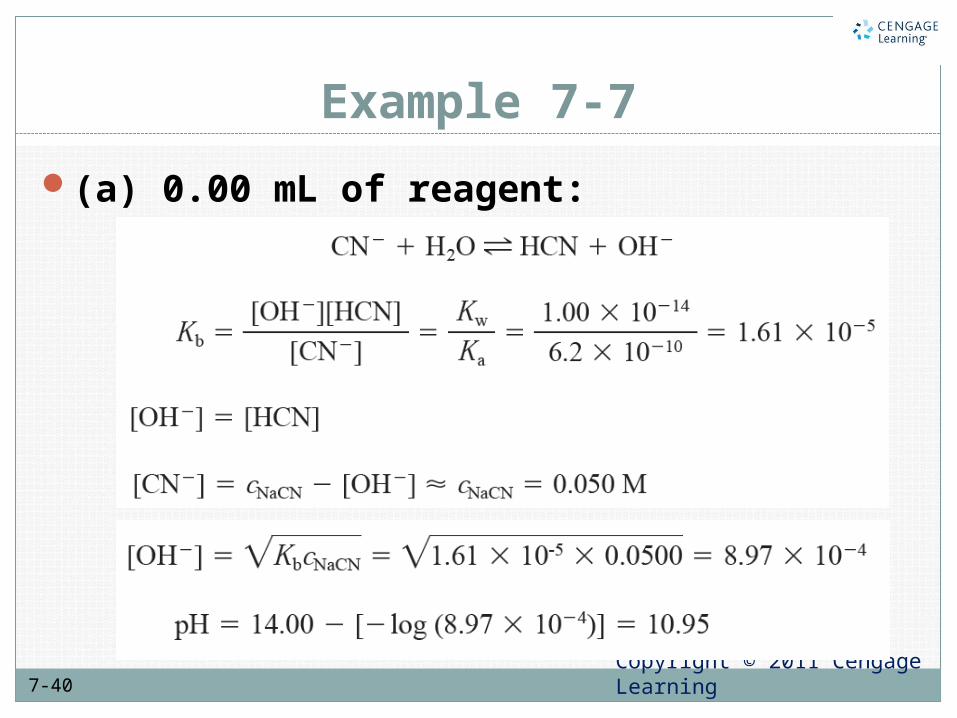
A 50.00-mL aliquot of 0.0500 M NaCN is titrated with 0.1000 M HCl. The reaction is
Calculate the pH after the addition of (a) 0.00, (b) 10.00, (c) 25.00, and(d) 26.00 mL of acid.
Copyright © 2011 Cengage Learning7-40
Example 7-7
(a) 0.00 mL of reagent:
Copyright © 2011 Cengage Learning7-41
Example 7-7
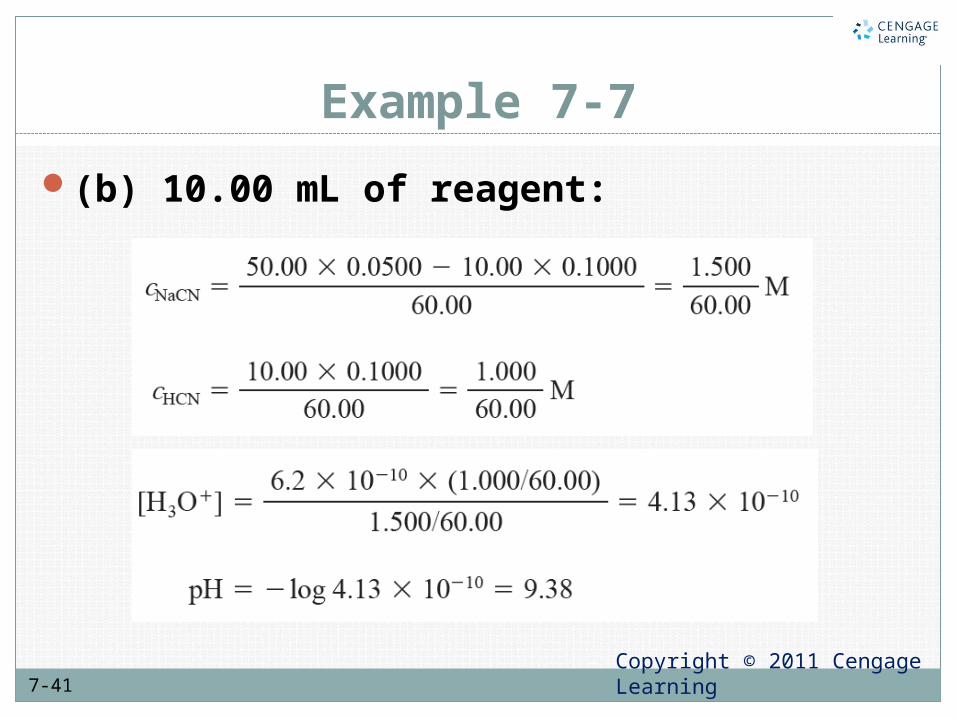
(b) 10.00 mL of reagent:

Copyright © 2011 Cengage Learning7-42
Example 7-7
(c) 25.00 mL of reagent:
Copyright © 2011 Cengage Learning7-43
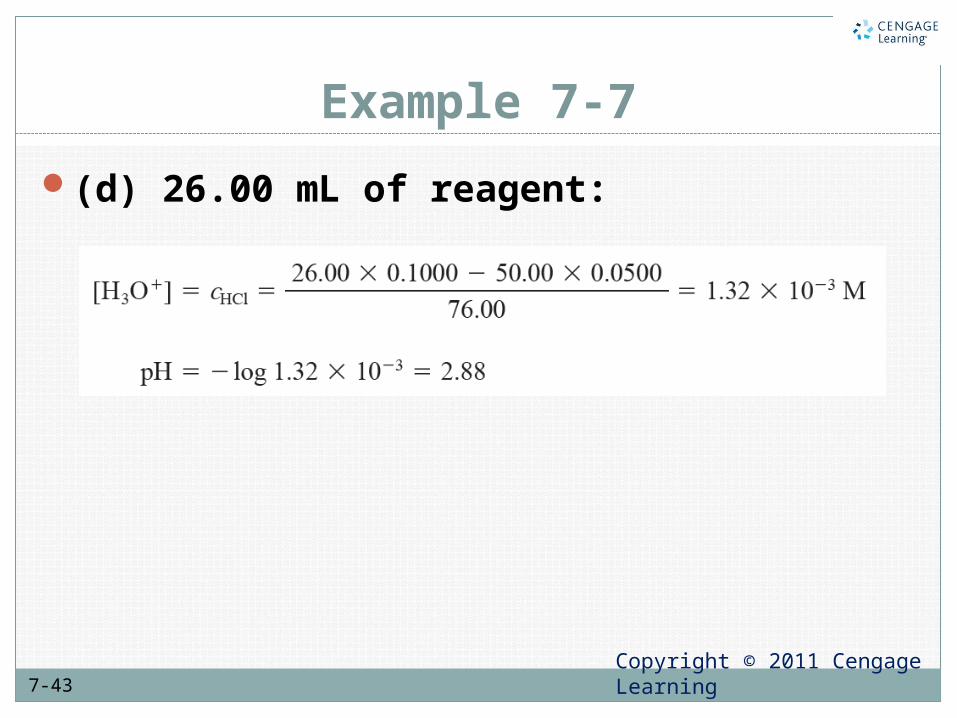
Example 7-7
(d) 26.00 mL of reagent:

Copyright © 2011 Cengage Learning7-44
Figure 7-11
Figure 7-11 The effect of base strength (Kb) on titration curves. Each curve represents the titration of 50.00 mL of 0.1000 M base with 0.1000 M HCl.

Copyright © 2011 Cengage Learning7-45
7F How Do Buffer Solutions Change as A Function of pH?
(7-13)
(7-12)
(7-14)
Copyright © 2011 Cengage Learning7-46
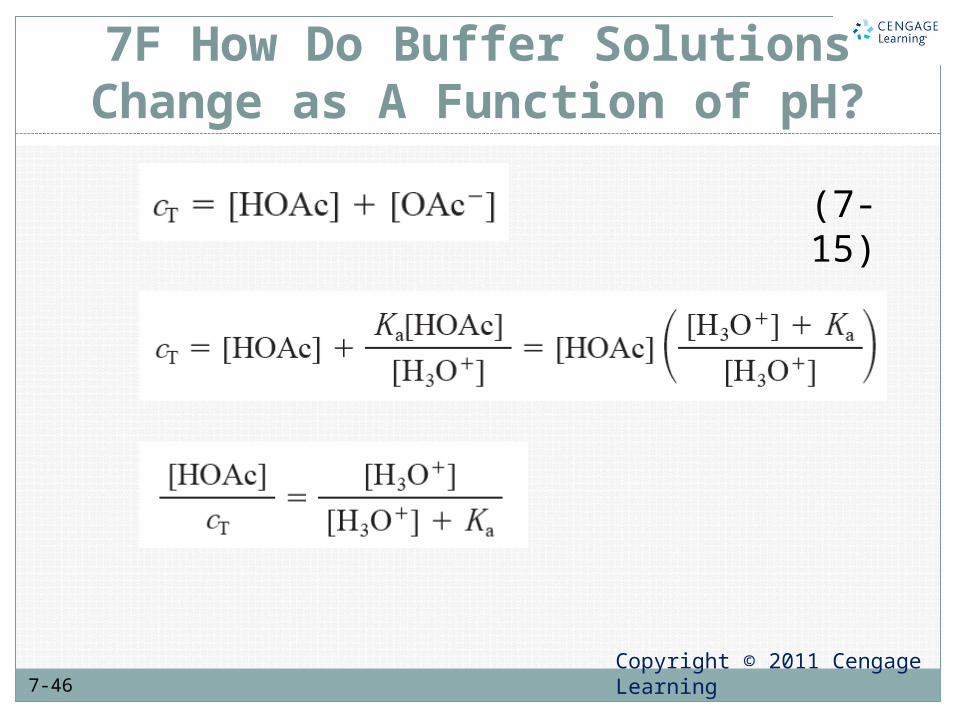
7F How Do Buffer Solutions Change as A Function of pH?
(7-15)
Copyright © 2011 Cengage Learning7-47
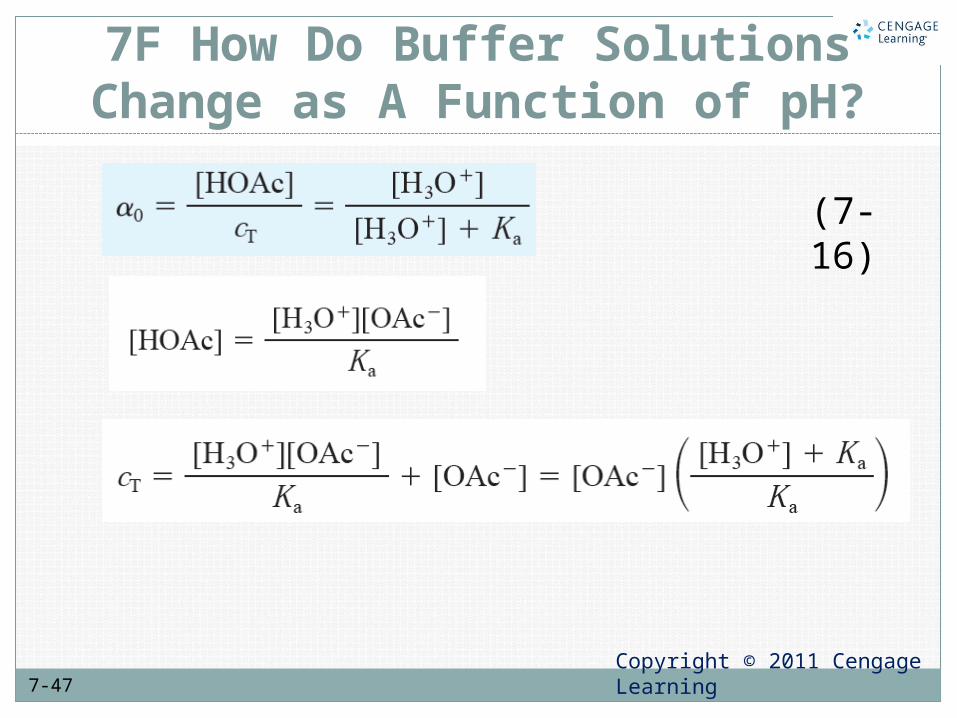
7F How Do Buffer Solutions Change as A Function of pH?
(7-16)
Copyright © 2011 Cengage Learning7-48
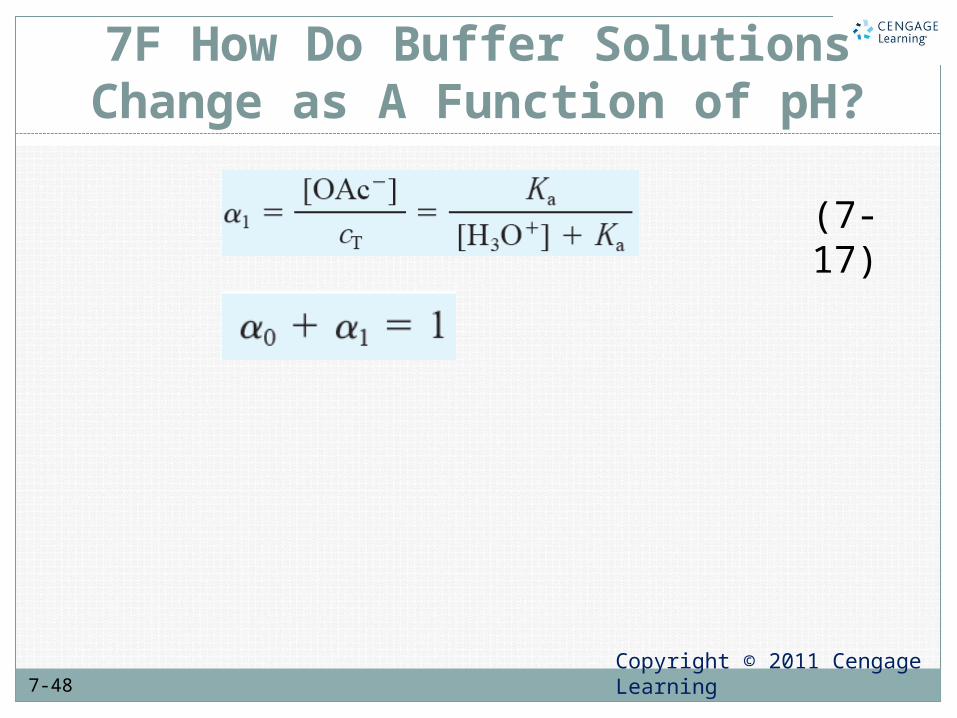
7F How Do Buffer Solutions Change as A Function of pH?
(7-17)
Copyright © 2011 Cengage Learning7-49
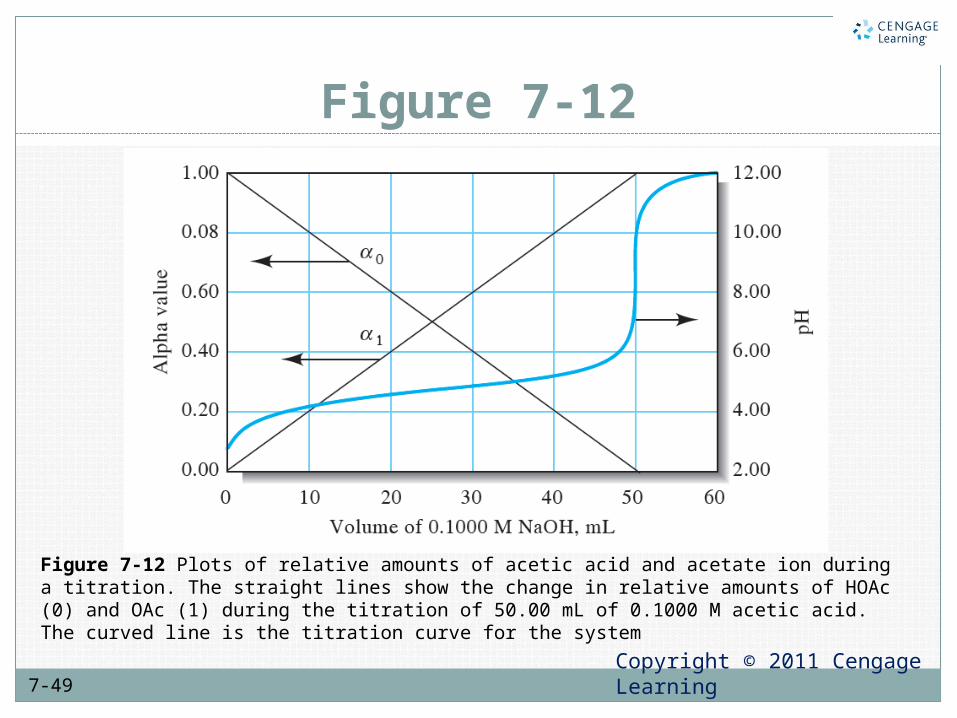
Figure 7-12
Figure 7-12 Plots of relative amounts of acetic acid and acetate ion during a titration. The straight lines show the change in relative amounts of HOAc (0) and OAc (1) during the titration of 50.00 mL of 0.1000 M acetic acid. The curved line is the titration curve for the system
Copyright © 2011 Cengage Learning7-50
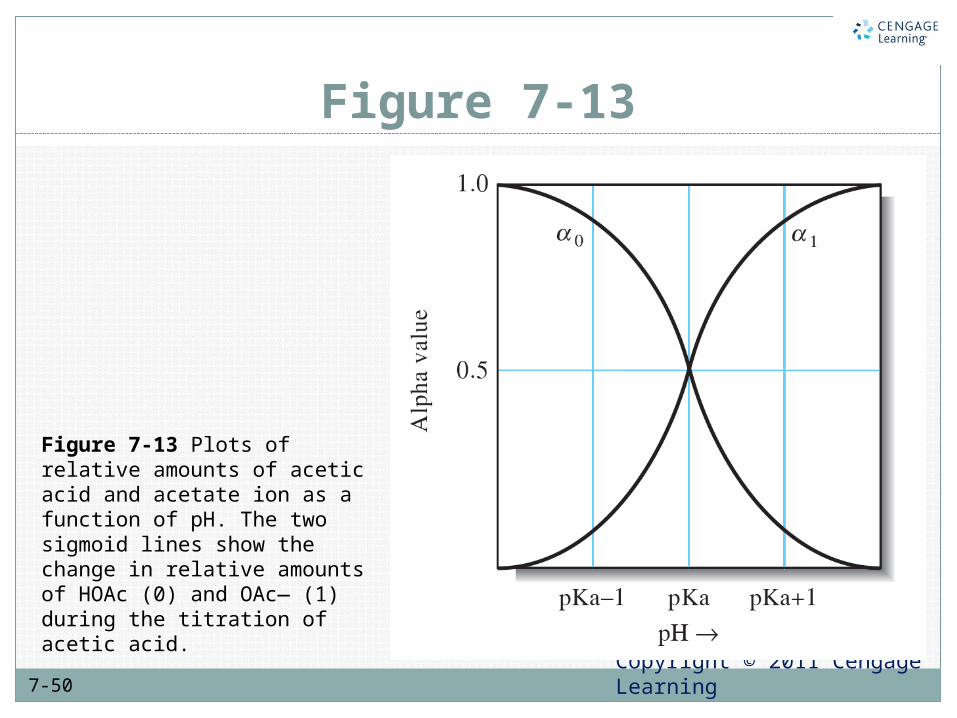
Figure 7-13
Figure 7-13 Plots of relative amounts of acetic acid and acetate ion as a function of pH. The two sigmoid lines show the change in relative amounts of HOAc (0) and OAc— (1) during the titration of acetic acid.
Copyright © 2011 Cengage Learning7-51
THE END


![Neutralization of Acids and Bases. Titrations Standard Solution Sample Solutio n Burett e Primary Standard with a precisely known [ ] Unknown [ ] Sample](https://img.pdfslide.us/doc/110x75/56649efe5503460f94c1352f/neutralization-of-acids-and-bases-titrations-standard-solution-sample-solutio.jpg)