Embed Size (px)
Citation preview

Chapter 7Monitoring the Switch
Setting Monitoring Options
The navigation pane at the top of the web browser interface contains a Monitoring tab that enables you to manage your GS700AT Series Smart Switch with features under the following main menu options:
• “Logs”
• “RMON”
• “Port Mirroring”
The description that follows in this chapter describes configuring and managing monitoring settings in the GS700AT Series Smart Switch.
Logs
Event messages have a unique format, as per the SYSLOG RFC recommended message format for all error reporting, for example, Syslog+ local device reporting. Messages are assigned a severity code, and include a message mnemonic, which identifies the source application generating the message. Messages are filtered based on their urgency or relevancy. The following table contains the Log Severity Levels:
Table 7-1. Severity Levels
Severity Severity Level Severity Level Description
Emergency 0 The system is not functioning.
Alert 1 The system needs immediate attention.
Critical 2 The system is in a critical state.
Error 3 A system error has occurred.
Warning 4 A system warning is logged.
Notice 5 The system is functioning properly, but a system notice is logged.
7-1
v1.0, March 2008
GS700AT Series Smart Switch Software Administration Manual
This section provides information for managing logs. The logs enable viewing device events in real time, and recording the events for later usage. Logs record and manage events and report errors and informational messages.
The Logs menu contains the following options:
• “Logs Configuration”
• “Log Filter”
• “Memory Log”
• “Flash Log”
• “Server Log”
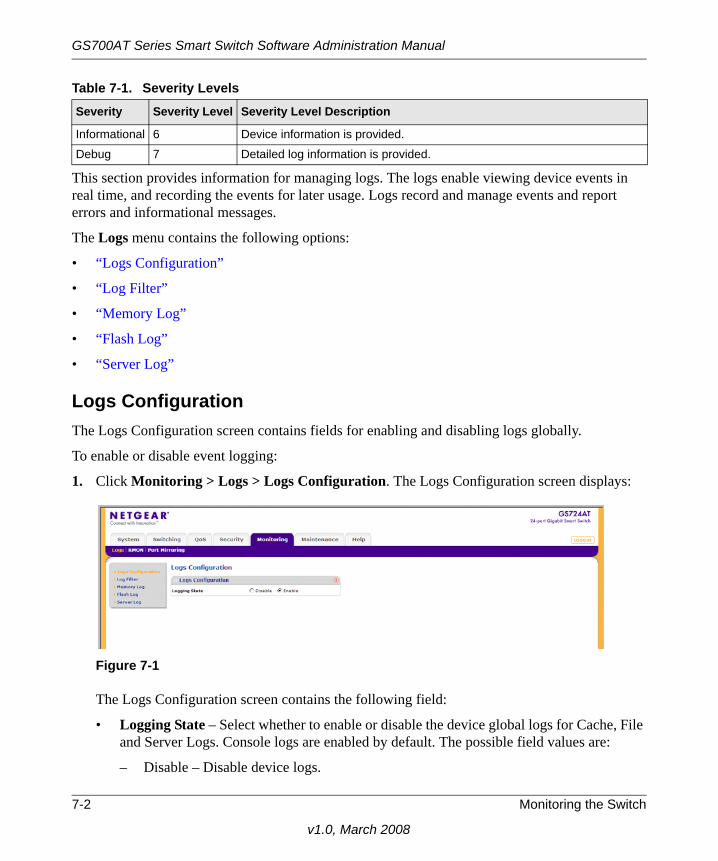
Logs ConfigurationThe Logs Configuration screen contains fields for enabling and disabling logs globally.
To enable or disable event logging:
1. Click Monitoring > Logs > Logs Configuration. The Logs Configuration screen displays:
The Logs Configuration screen contains the following field:
• Logging State – Select whether to enable or disable the device global logs for Cache, File and Server Logs. Console logs are enabled by default. The possible field values are:
– Disable – Disable device logs.
Informational 6 Device information is provided.
Debug 7 Detailed log information is provided.
Figure 7-1
Table 7-1. Severity Levels
Severity Severity Level Severity Level Description
7-2 Monitoring the Switch
v1.0, March 2008

GS700AT Series Smart Switch Software Administration Manual
– Enable – Enable device logs.
2. Select either Enable or Disable as the Logging State in the provided field.
3. Click Apply to update the device.
Log FilterTo configure log filters:
1. Click Monitoring > Logs > Log Filter. The Log Filter screen displays:
The Log Filter screen contains the following fields:
• RAM Logs – Select the minimum message severity level to appear in the RAM Log. The following are the available message severity levels:
– Emergency – The highest warning level. If the device is down or not functioning properly, an emergency log message is saved to the specified logging location.
– Alert – The second highest warning level. An alert log is saved, if there is a serious device malfunction; for example, all device features are down.
– Critical – The third highest warning level. A critical log is saved if a critical device malfunction occurs; for example, two device ports are not functioning, while the rest of the device ports remain functional.
– Error – A device error has occurred; for example, if a single port is offline.
– Warning – The lowest level of a device warning. The device is functioning, but an operational problem has occurred.
– Notice – Provides device information.
– Informational – Provides device information.
Figure 7-2
Monitoring the Switch 7-3
v1.0, March 2008

GS700AT Series Smart Switch Software Administration Manual
– Debug – Provides debugging messages.
• Log File – Select the minimum message severity level to appear in the log file. The following are the available message severity levels:
– Emergency – The highest warning level. If the device is down or not functioning properly, an emergency log message is saved to the specified logging location.
– Alert – The second highest warning level. An alert log is saved, if there is a serious device malfunction; for example, all device features are down.
– Critical – The third highest warning level. A critical log is saved if a critical device malfunction occurs; for example, two device ports are not functioning, while the rest of the device ports remain functional.
– Error – A device error has occurred; for example, if a single port is offline.
– Warning – The lowest level of a device warning. The device is functioning, but an operational problem has occurred.
– Notice – Provides device information.
– Informational – Provides device information.
– Debug – Provides debugging messages.
2. Select the minimum severity level for RAM logs.
3. Select the minimum severity level for FLASH logs.
4. Click Apply to update the device.
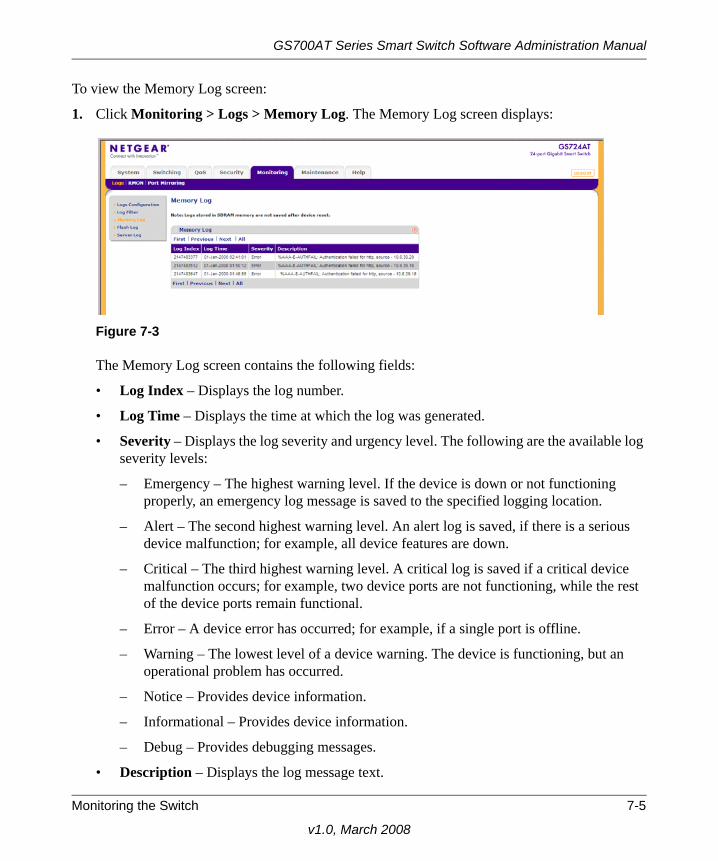
Memory LogThe Memory Log screen contains all system logs in a chronological order that are saved in RAM (Cache).
7-4 Monitoring the Switch
v1.0, March 2008
GS700AT Series Smart Switch Software Administration Manual
To view the Memory Log screen:
1. Click Monitoring > Logs > Memory Log. The Memory Log screen displays:
The Memory Log screen contains the following fields:
• Log Index – Displays the log number.
• Log Time – Displays the time at which the log was generated.
• Severity – Displays the log severity and urgency level. The following are the available log severity levels:
– Emergency – The highest warning level. If the device is down or not functioning properly, an emergency log message is saved to the specified logging location.
– Alert – The second highest warning level. An alert log is saved, if there is a serious device malfunction; for example, all device features are down.
– Critical – The third highest warning level. A critical log is saved if a critical device malfunction occurs; for example, two device ports are not functioning, while the rest of the device ports remain functional.
– Error – A device error has occurred; for example, if a single port is offline.
– Warning – The lowest level of a device warning. The device is functioning, but an operational problem has occurred.
– Notice – Provides device information.
– Informational – Provides device information.
– Debug – Provides debugging messages.
• Description – Displays the log message text.
Figure 7-3
Monitoring the Switch 7-5
v1.0, March 2008

GS700AT Series Smart Switch Software Administration Manual
2. Click Refresh or Clear Logs to refresh or reset the Memory Logs screen.
Flash LogThe Flash Log screen contains information about log entries saved to the log file in Flash, including the time the log was generated, the log severity, and a description of the log message. The message log is available after reboot.
To view the message logs in Flash:
1. Click Monitoring > Logs > Flash Log. The Flash Log screen displays:
The Flash Log screen contains the following fields:
• Log Index – Displays the log number.
• Log Time – Displays the time at which the log was generated.
• Severity – Displays the log severity and urgency level. The following are the available log severity levels:
– Emergency – The highest warning level. If the device is down or not functioning properly, an emergency log message is saved to the specified logging location.
– Alert – The second highest warning level. An alert log is saved, if there is a serious device malfunction; for example, all device features are down.
Figure 7-4
7-6 Monitoring the Switch
v1.0, March 2008

GS700AT Series Smart Switch Software Administration Manual
– Critical – The third highest warning level. A critical log is saved if a critical device malfunction occurs; for example, two device ports are not functioning, while the rest of the device ports remain functional.
– Error – A device error has occurred; for example, if a single port is offline.
– Warning – The lowest level of a device warning. The device is functioning, but an operational problem has occurred.
– Notice – Provides device information.
– Informational – Provides device information.
– Debug – Provides debugging messages.
• Description – Displays the log message text.
2. Click Refresh or Clear Logs to refresh or reset the Flash Logs screen.
Server LogThe Server Log screen contains information for viewing and configuring the remote log servers. New log servers can be defined and the log severity sent to each server.
To configure remote log servers:
1. Click Monitoring > Logs > Server Log. The Server Log screen displays:
The Server Log screen contains the following fields:
• Server IP – Enter the server’s IP address to which logs can be sent.
• UDP Port – Enter the UDP port to which the server logs are sent. The possible range is 1 – 65535. The default value is 514.
Figure 7-5
Monitoring the Switch 7-7
v1.0, March 2008

GS700AT Series Smart Switch Software Administration Manual
• Facility – Select an application from which system logs are sent to the remote server. Only one facility can be assigned to a single server. If a second facility level is assigned, the first facility is overridden. All applications defined for a device utilize the same facility on a server. The field default is Local 0. The possible field values are Local 0 - Local 7.
• Description – Enter a user-defined server description.
• Minimum Severity – Select the minimum severity level for which logs are sent to the server. For example, if Notice is selected, all logs with a severity level of Notice and higher are sent to the remote server. The default value is Informational. The possible field values are:
– Emergency – The highest warning level. If the device is down or not functioning properly, an emergency log message is saved to the specified logging location.
– Alert – The second highest warning level. An alert log is saved, if there is a serious device malfunction; for example, all device features are down.
– Critical – The third highest warning level. A critical log is saved if a critical device malfunction occurs; for example, two device ports are not functioning, while the rest of the device ports remain functional.
– Error – A device error has occurred; for example, if a single port is offline.
– Warning – The lowest level of a device warning. The device is functioning, but an operational problem has occurred.
– Notice – Provides device information.
– Informational – Provides device information.
– Debug – Provides debugging messages.
2. Select the server entry.
3. Enter the Server IP address in the provided field in the first row.
4. Enter the UDP Port number in the provided field in the first row.
5. Select the Facility assigned to the server from the list in the provided field in the first row.
6. Enter an optional server Description in the provided field in the first row.
7. Select the Minimum Severity level message sent to the server from the list in the provided field in the first row.
8. Click Apply to update the device.
7-8 Monitoring the Switch
v1.0, March 2008

GS700AT Series Smart Switch Software Administration Manual
To add a remote log server:
1. Click Monitoring > Logs > Server Log. The Server Log screen displays.
2. Enter the Server IP address in the provided field in the first row.
3. Enter the UDP Port number in the provided field in the first row.
4. Select the Facility assigned to the server from the list in the provided field in the first row.
5. Enter an optional server Description in the provided field in the first row.
6. Select the Minimum Severity level message sent to the server from the list in the provided field in the first row.
7. Click Add to update the device.
To remove a remote log server:
1. Click Monitoring > Logs > Server Log. The Server Log screen displays.
2. Select the log server entry.
3. Click Delete to remove the log server entry.
RMON
This section contains information for viewing Remote Monitoring Statistics. RMON Statistics allow network managers to view network traffic information from a single workstation.
The RMON menu contains the following options:
• “Basic”
• “Advanced”
BasicThe RMON Basic menu contains the following options:
• “Statistics”
StatisticsThe RMON Basic Statistics screen contains fields for viewing information about device utilization and errors that occurred on the device.
Monitoring the Switch 7-9
v1.0, March 2008

GS700AT Series Smart Switch Software Administration Manual
To view RMON Basic Statistics:
1. Click Monitoring > RMON > Basic > Statistics. The RMON Basic Statistics screen displays:
The RMON Basic Statistics screen contains the following fields:
• Interface – Displays the port or LAG for which statistics are displayed.
• Drop Events – Displays the number of dropped events that have occurred on the interface since the device was last refreshed.
• Received Bytes – Displays the number of octets received on the interface since the device was last refreshed. This number includes bad packets and FCS octets, but excludes framing bits.
• Received Packets – Displays the number of packets received on the interface, including bad packets, Multicast, and Broadcast packets, since the device was last refreshed.
• Broadcast Packets Received – Displays the number of good broadcast packets received on the interface since the device was last refreshed. This number does not include Multicast packets.
• Multicast Packets Received – Displays the number of good Multicast packets received on the interface since the device was last refreshed.
Figure 7-6
7-10 Monitoring the Switch
v1.0, March 2008

GS700AT Series Smart Switch Software Administration Manual
• CRC & Alignment Errors – Displays the number of CRC and Align errors that have occurred on the interface since the device was last refreshed.
2. Click Refresh or Clear All Counters to refresh or reset the RMON Basic Statistics screen.
AdvancedThe RMON Advanced menu contains the following options:
• “Statistics”
• “History Control”
• “History Table”
• “Events Control”
• “Events Log”
• “Alarms”
StatisticsThe RMON Advanced Statistics screen contains fields for viewing information about device utilization and errors that occurred on the device.
Monitoring the Switch 7-11
v1.0, March 2008

GS700AT Series Smart Switch Software Administration Manual
To view RMON Advanced Statistics:
1. Click Monitoring >RMON > Advanced > Statistics. The RMON Advanced Statistics screen displays:
The RMON Advanced Statistics screen contains the following fields:
RMON Interface Statistics
• Interface – Select the device for which statistics are displayed. The possible field values are:
– Port – Select the specific port for which RMON statistics are displayed.
– LAG – Select the specific LAG for which RMON statistics are displayed.
Figure 7-7
7-12 Monitoring the Switch
v1.0, March 2008
GS700AT Series Smart Switch Software Administration Manual
• Received Bytes – Displays the number of octets received on the interface since the device was last refreshed. This number includes bad packets and FCS octets, but excludes framing bits.
• Broadcast Packets Received – Displays the number of good broadcast packets received on the interface since the device was last refreshed. This number does not include Multicast packets.
• Multicast Packets Received – Displays the number of good Multicast packets received on the interface since the device was last refreshed.
• CRC & Align Errors – Displays the number of CRC and Align errors that have occurred on the interface since the device was last refreshed.
• Undersize Packets – Displays the number of undersized packets (less than 64 octets) received on the interface since the device was last refreshed.
• Oversize Packets – Displays the number of oversized packets (over 1518 octets) received on the interface since the device was last refreshed.
• Fragments – Displays the number of fragments (packets with less than 64 octets, excluding framing bits, but including FCS octets) received on the interface since the device was last refreshed.
• Jabbers – Displays the total number of received packets that were longer than 1518 octets. This number excludes frame bits, but includes FCS octets that had either a bad Frame Check Sequence (FCS) with an integral number of octets (FCS Error) or a bad FCS with a non-integral octet (Alignment Error) number. The field range to detect jabbers is between 20 ms and 150 ms.
• Collisions – Displays the number of collisions received on the interface since the device was last refreshed.
• Frames of 64 Bytes – Displays the number of 64-byte frames received on the interface since the device was last refreshed.
• Frames of 65 to 127 Bytes – Displays the number of 65 to 127 byte frames received on the interface since the device was last refreshed.
• Frames of 128 to 255 Bytes – Displays the number of 128 to 255 byte frames received on the interface since the device was last refreshed.
• Frames of 256 to 511 Bytes – Displays the number of 256 to 511 byte frames received on the interface since the device was last refreshed.
• Frames of 512 to 1023 Bytes – Displays the number of 512 to 1023 byte frames received on the interface since the device was last refreshed.
Monitoring the Switch 7-13
v1.0, March 2008

GS700AT Series Smart Switch Software Administration Manual
• Frames of 1024 to 1522 Bytes – Displays the number of 1024 to 1522 byte frames received on the interface since the device was last refreshed.
RMON Summary Statistics
• Interface – Displays the port or LAG for which statistics are displayed.
• Drop Events – Displays the number of dropped events that have occurred on the interface since the device was last refreshed.
• Received Bytes – Displays the number of octets received on the interface since the device was last refreshed. This number includes bad packets and FCS octets, but excludes framing bits.
• Received Packets – Displays the number of packets received on the interface, including bad packets, Multicast, and Broadcast packets, since the device was last refreshed.
• Broadcast Packets Received – Displays the number of good broadcast packets received on the interface since the device was last refreshed. This number does not include Multicast packets.
• Multicast Packets Received – Displays the number of good Multicast packets received on the interface since the device was last refreshed.
• CRC & Alignment Errors – Displays the number of CRC and Align errors that have occurred on the interface since the device was last refreshed.
2. To view RMON Interface Statistics, select Port or LAG as the type of Interface and select the interface from the list in the provided field. The RMON Interface Statistics for the selected interface are displayed.
3. To view RMON Summary Statistics, select the interface and click Go.
To refresh or clear the RMON Advanced Statistics screen:
1. Open the RMON Advanced Statistics screen.
2. Click Refresh or Cleear All Counters to clear or reset the RMON Advanced Statistics screen.
History ControlThe RMON History Control screen contains information about samples of data taken from ports. For example, the samples may include interface definitions or polling periods.
7-14 Monitoring the Switch
v1.0, March 2008

GS700AT Series Smart Switch Software Administration Manual
To configure RMON history information:
1. Click Monitoring >RMON > Advanced > History Control. The RMON History Control screen displays:
The RMON History Control screen contains the following fields:
• History Entry No. – Displays the entry number for the History Control Table screen.
• Source Interface – Enter the interface from which the history samples were taken.
• Sampling Interval – Enter in seconds the time that samples are taken from the ports. The field range is 1-3600. The default is 1800 seconds (equal to 30 minutes).
• Samples Requested – Enter the number of samples to be saved. The field range is 1-65535. The default value is 50.
• Current Number of Samples – Displays the current number of samples taken.
• Owner – Enter the RMON station or user that requested the RMON information.
2. Select the history control entry.
3. Enter the Source Interface, Sampling Interval, Samples Requested and Owner in the provided field in the first row.
4. Click Apply to update the device.
To add a history control entry:
1. Click Monitoring >RMON > Advanced > History Control. The RMON History Control screen displays.
2. Enter the Source Interface, Sampling Interval, Samples Requested and Owner in the provided field in the first row.
3. Click Add to update the device.
Figure 7-8
Monitoring the Switch 7-15
v1.0, March 2008

GS700AT Series Smart Switch Software Administration Manual
To remove a history control entry:
1. Click Monitoring >RMON > Advanced > History Control. The RMON History Control screen displays.
2. Select the history control entry.
3. Click Delete to remove the history control entry.
History TableThe RMON History Table screen contains interface specific statistical network samples. Each table entry represents all counter values compiled during a single sample.
To view the RMON History Table:
1. Click Monitoring > RMON > Advanced > History Table. The RMON History Table screen displays:
The RMON History Table screen contains the following fields:
History Entry
• History Entry No. – Select the entry number for the History Control Table screen.
• Owner – Displays the RMON station or user that requested the RMON information. The field range is 0-20 characters.
History Table
• Sample No. – Displays the sample number from which the statistics were taken.
• Drop Events – Displays the number of dropped events that have occurred on the interface since the device was last refreshed.
Figure 7-9
7-16 Monitoring the Switch
v1.0, March 2008

GS700AT Series Smart Switch Software Administration Manual
• Received Bytes – Displays the number of octets received on the interface since the device was last refreshed. This number includes bad packets and FCS octets, but excludes framing bits.
• Received Packets – Displays the number of packets received on the interface since the device was last refreshed, including bad packets, Multicast, and Broadcast packets.
• Broadcast Packets – Displays the number of good Broadcast packets received on the interface since the device was last refreshed. This number does not include Multicast packets.
• Multicast Packets – Displays the number of good Multicast packets received on the interface since the device was last refreshed.
• CRC Errors – Displays the number of CRC and Align errors that have occurred on the interface since the device was last refreshed.
• Undersize Packets – Displays the number of undersized packets (less than 64 octets) received on the interface since the device was last refreshed.
• Oversize Packets – Displays the number of oversized packets (over 1518 octets) received on the interface since the device was last refreshed.
• Fragments – Displays the number of fragments (packets with less than 64 octets, excluding framing bits, but including FCS octets) received on the interface since the device was last refreshed.
• Jabbers – Displays the total number of received packets that were longer than 1518 octets. This number excludes frame bits, but includes FCS octets that had either a bad Frame Check Sequence (FCS) with an integral number of octets (FCS Error) or a bad FCS with a non-integral octet (Alignment Error) number. The field range to detect jabbers is between 20 ms and 150 ms.
• Collisions – Displays the number of collisions received on the interface since the device was last refreshed.
• Utilization – Displays the percentage of the interface utilized.
2. Select the History Entry No. from the list in the provided field. The statistics are displayed.
3. To refresh the RMON History Table screen, click Refresh.
Monitoring the Switch 7-17
v1.0, March 2008
GS700AT Series Smart Switch Software Administration Manual
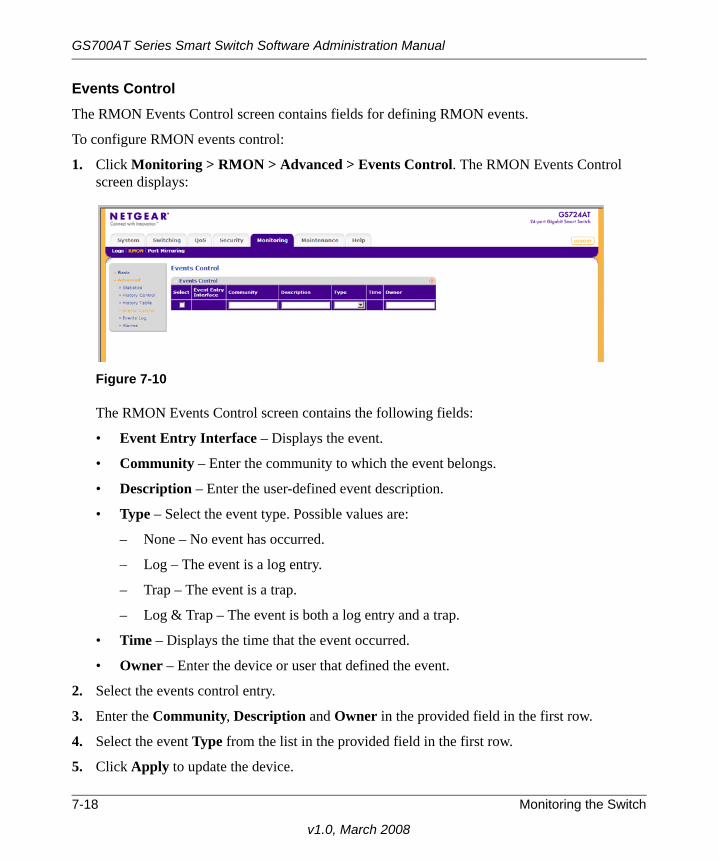
Events ControlThe RMON Events Control screen contains fields for defining RMON events.
To configure RMON events control:
1. Click Monitoring > RMON > Advanced > Events Control. The RMON Events Control screen displays:
The RMON Events Control screen contains the following fields:
• Event Entry Interface – Displays the event.
• Community – Enter the community to which the event belongs.
• Description – Enter the user-defined event description.
• Type – Select the event type. Possible values are:
– None – No event has occurred.
– Log – The event is a log entry.
– Trap – The event is a trap.
– Log & Trap – The event is both a log entry and a trap.
• Time – Displays the time that the event occurred.
• Owner – Enter the device or user that defined the event.
2. Select the events control entry.
3. Enter the Community, Description and Owner in the provided field in the first row.
4. Select the event Type from the list in the provided field in the first row.
5. Click Apply to update the device.
Figure 7-10
7-18 Monitoring the Switch
v1.0, March 2008
GS700AT Series Smart Switch Software Administration Manual
To add an events control entry:
1. Click Monitoring > RMON > Advanced > Events Control. The RMON Events Control screen displays.
2. Enter the Community, Description and Owner in the provided field in the first row.
3. Select the event Type from the list in the provided field in the first row.
4. Click Add to update the device.
To remove an events control entry:
1. Click Monitoring > RMON > Advanced > Events Control. The RMON Events Control screen displays.
2. Select the events control entry.
3. Click Delete to remove the events control entry.
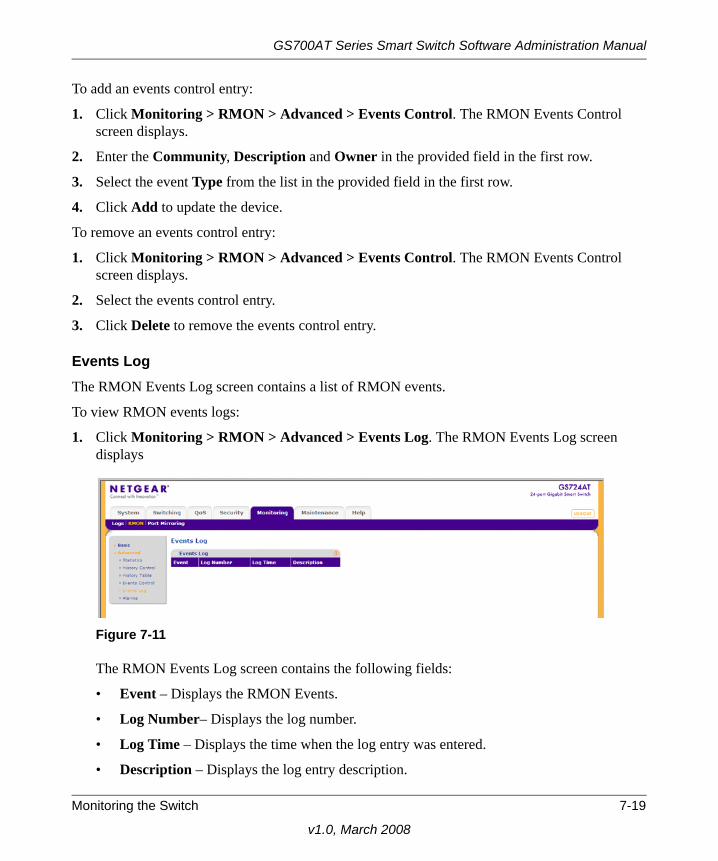
Events LogThe RMON Events Log screen contains a list of RMON events.
To view RMON events logs:
1. Click Monitoring > RMON > Advanced > Events Log. The RMON Events Log screen displays
The RMON Events Log screen contains the following fields:
• Event – Displays the RMON Events.
• Log Number– Displays the log number.
• Log Time – Displays the time when the log entry was entered.
• Description – Displays the log entry description.
Figure 7-11
Monitoring the Switch 7-19
v1.0, March 2008
GS700AT Series Smart Switch Software Administration Manual
2. To refresh the RMON Events Log screen, click Refresh.
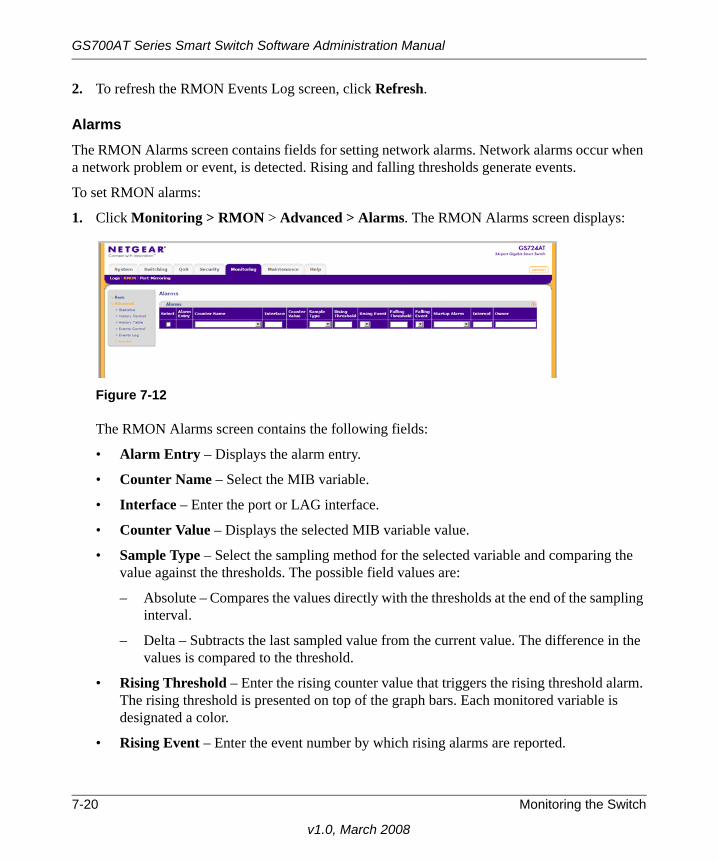
AlarmsThe RMON Alarms screen contains fields for setting network alarms. Network alarms occur when a network problem or event, is detected. Rising and falling thresholds generate events.
To set RMON alarms:
1. Click Monitoring > RMON > Advanced > Alarms. The RMON Alarms screen displays:
The RMON Alarms screen contains the following fields:
• Alarm Entry – Displays the alarm entry.
• Counter Name – Select the MIB variable.
• Interface – Enter the port or LAG interface.
• Counter Value – Displays the selected MIB variable value.
• Sample Type – Select the sampling method for the selected variable and comparing the value against the thresholds. The possible field values are:
– Absolute – Compares the values directly with the thresholds at the end of the sampling interval.
– Delta – Subtracts the last sampled value from the current value. The difference in the values is compared to the threshold.
• Rising Threshold – Enter the rising counter value that triggers the rising threshold alarm. The rising threshold is presented on top of the graph bars. Each monitored variable is designated a color.
• Rising Event – Enter the event number by which rising alarms are reported.
Figure 7-12
7-20 Monitoring the Switch
v1.0, March 2008

GS700AT Series Smart Switch Software Administration Manual
• Falling Threshold – Enter the falling counter value that triggers the falling threshold alarm. The falling threshold is graphically presented on top of the graph bars. Each monitored variable is designated a color.
• Falling Event – Enter the event number by which falling alarms are reported.
• Startup Alarm – Select the trigger that activates the alarm generation. Rising is defined by crossing the threshold from a low-value threshold to a higher-value threshold. The possible field values are:
– Rising Alarm – The alarm is triggered by the rising counter crossing the rising threshold value.
– Falling Alarm – The alarm is triggered by the falling counter crossing the falling threshold value.
– Rising and Falling – The alarm is triggered by either the rising counter crossing the rising threshold value or the falling counter crossing the falling threshold value.
• Interval – Enter the alarm interval time in seconds.
• Owner – Enter the device or user that defined the alarm.
2. Select the alarm entry.
3. Select the Counter Name from the list of MIB variable values in the provided field in the first row.
4. Enter the Interface in the provided field in the first row.
5. Select the Sample Type from the list in the provided field in the first row.
6. Select the Startup Alarm from the list in the provided field in the first row.
7. If you selected Rising Alarm or Rising and Falling as the Startup Alarm, enter the Rising Threshold and select the Rising Event number in the provided fields in the first row.
8. If you selected Falling Alarm or Rising and Falling as the Startup Alarm, enter the Falling Threshold and select the Falling Event number in the provided fields in the first row.
9. Enter the Interval and Owner in the provided fields in the first row.
10. Click Apply to update the device.
To add an alarm entry:
1. Click Monitoring > RMON > Advanced > Alarms. The RMON Alarms screen displays.
Monitoring the Switch 7-21
v1.0, March 2008

GS700AT Series Smart Switch Software Administration Manual
2. Select the Counter Name from the list of MIB variable values in the provided field in the first row.
3. Enter the Interface in the provided field in the first row.
4. Select the Sample Type from the list in the provided field in the first row.
5. Select the Startup Alarm from the list in the provided field in the first row.
6. If you selected Rising Alarm or Rising and Falling as the Startup Alarm, enter the Rising Threshold and select the Rising Event number in the provided fields in the first row.
7. If you selected Falling Alarm or Rising and Falling as the Startup Alarm, enter the Falling Threshold and select the Falling Event number in the provided fields in the first row.
8. Enter the Interval and Owner in the provided fields in the first row.
9. Click Add to update the device.
To remove an events control entry:
1. Click Monitoring > RMON > Advanced > Alarms. The RMON Alarms screen displays.
2. Select the alarm entry.
3. Click Delete to remove the alarm entry.
Port Mirroring
Port mirroring monitors and mirrors network traffic by forwarding copies of incoming and outgoing packets from one port to a monitoring port. Port mirroring can be used as a diagnostic tool as well as a debugging feature. Port mirroring also enables switch performance monitoring.
Network administrators can configure port mirroring by selecting a specific port from which to copy all packets, and other ports to which the packets are copied. The device supports one destination port and up to eight source ports.
The Port Mirroring menu contains the following option:
• “Port Mirroring”
7-22 Monitoring the Switch
v1.0, March 2008
GS700AT Series Smart Switch Software Administration Manual
Port MirroringTo define port mirroring:
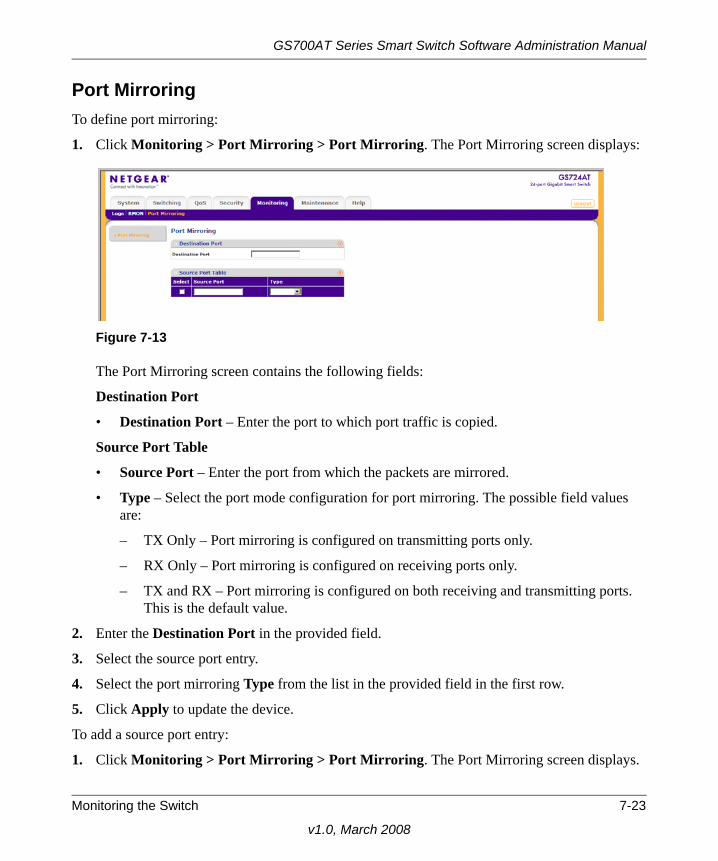
1. Click Monitoring > Port Mirroring > Port Mirroring. The Port Mirroring screen displays:
The Port Mirroring screen contains the following fields:
Destination Port
• Destination Port – Enter the port to which port traffic is copied.
Source Port Table
• Source Port – Enter the port from which the packets are mirrored.
• Type – Select the port mode configuration for port mirroring. The possible field values are:
– TX Only – Port mirroring is configured on transmitting ports only.
– RX Only – Port mirroring is configured on receiving ports only.
– TX and RX – Port mirroring is configured on both receiving and transmitting ports. This is the default value.
2. Enter the Destination Port in the provided field.
3. Select the source port entry.
4. Select the port mirroring Type from the list in the provided field in the first row.
5. Click Apply to update the device.
To add a source port entry:
1. Click Monitoring > Port Mirroring > Port Mirroring. The Port Mirroring screen displays.
Figure 7-13
Monitoring the Switch 7-23
v1.0, March 2008

GS700AT Series Smart Switch Software Administration Manual
2. Enter the Source Port in the provided field in the first row.
3. Select the port mirroring Type from the list in the provided field in the first row.
4. Click Add to update the device.
To remove a source port entry:
1. Click Monitoring > Port Mirroring > Port Mirroring. The Port Mirroring screen displays.
2. Select the source port entry.
3. Click Delete to remove the source port entry.
7-24 Monitoring the Switch
v1.0, March 2008