Embed Size (px)
DESCRIPTION
Chapter 7 Human Population Change and the Environment. Population Growth In China. Largest population in the world 1971: government involved 1979 More aggressive plan One-child policy Why do it?. Population Growth In China. 1984: program relaxed; why? - PowerPoint PPT Presentation
Citation preview

Chapter 7 Chapter 7 Human Population Change Human Population Change
and the Environmentand the Environment

Population Growth In ChinaPopulation Growth In China
Largest population in the worldLargest population in the world 1971: government involved1971: government involved 19791979
More aggressive planMore aggressive plan One-child policyOne-child policy Why do it?Why do it?
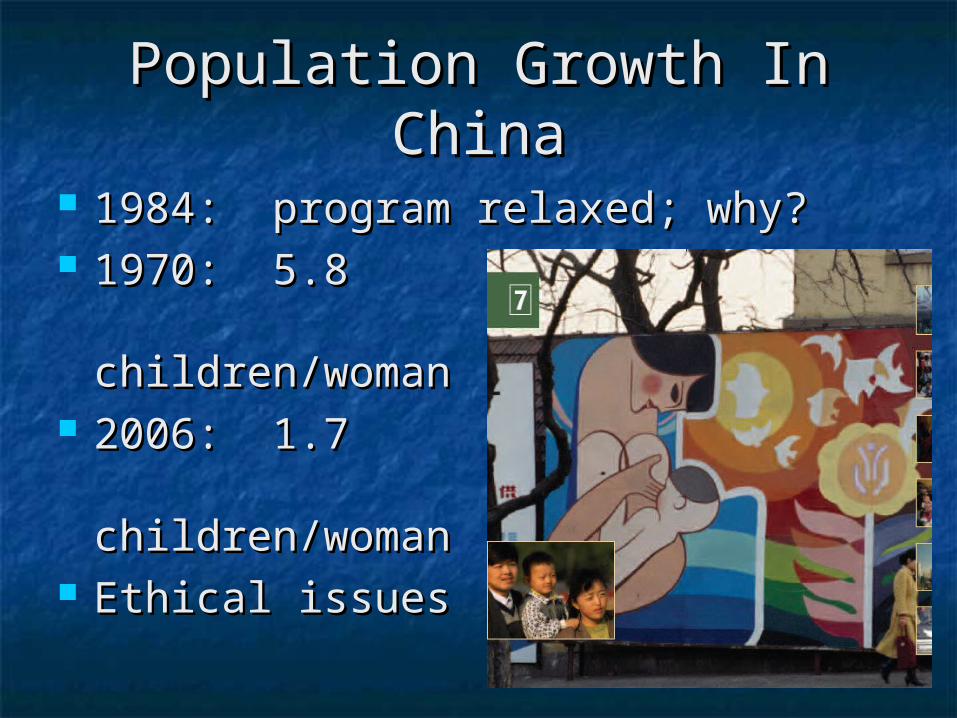
Population Growth In ChinaPopulation Growth In China
1984: program relaxed; why?1984: program relaxed; why? 1970: 5.8 1970: 5.8
children/womanchildren/woman 2006: 1.7 2006: 1.7
children/woman children/woman Ethical issuesEthical issues

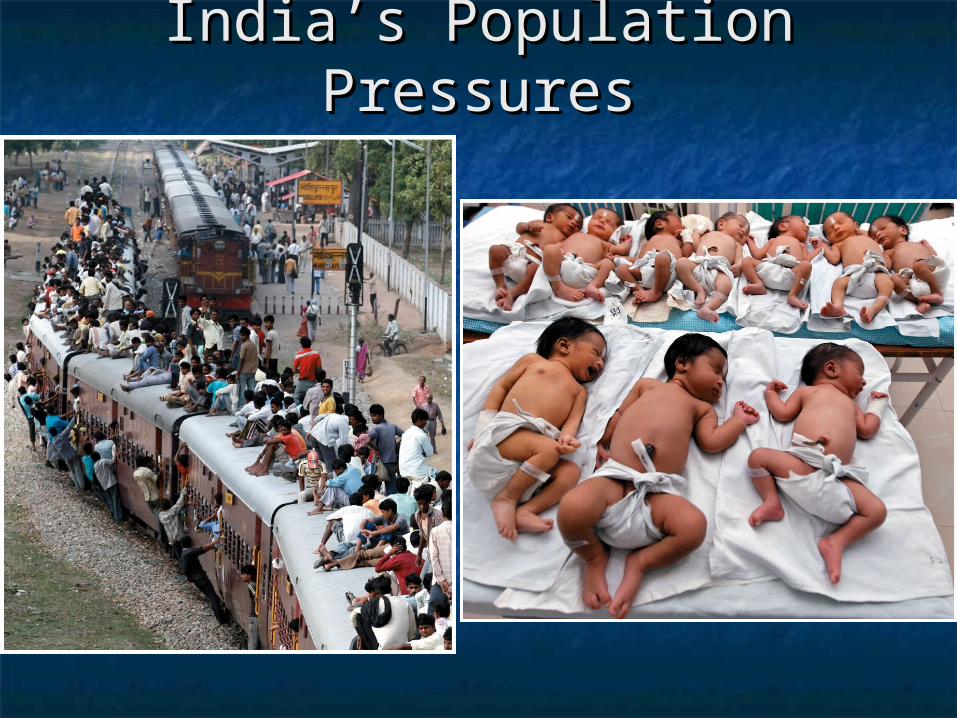
India’s Population PressuresIndia’s Population Pressures World’s second most populous nationWorld’s second most populous nation
1.2 billion1.2 billion 1950s - government sponsored family planning1950s - government sponsored family planning
Number of children per woman declined Number of children per woman declined from 5.3 (1980) to 2.7 (2009)from 5.3 (1980) to 2.7 (2009)
Despite successDespite success Population pressure has cause Population pressure has cause
environmental degradationenvironmental degradation 76% live under poverty level (less than $2 76% live under poverty level (less than $2
/day)/day)
India’s Population PressuresIndia’s Population Pressures

Population EcologyPopulation Ecology Branch of biologyBranch of biology Study of populationsStudy of populations
Individuals of a given speciesIndividuals of a given species How they respond to the How they respond to the
environmentenvironment Look for similaritiesLook for similarities

How Populations ChangeHow Populations Change
Global scale: dependent on two thingsGlobal scale: dependent on two things Birth rate (b)Birth rate (b) Death rate (d)Death rate (d)
Growth rate (r)Growth rate (r) r = b - dr = b - d

How Populations ChangeHow Populations Change
Local populationsLocal populations DispersalDispersal
Immigration (i)Immigration (i) Emigration (e)Emigration (e)
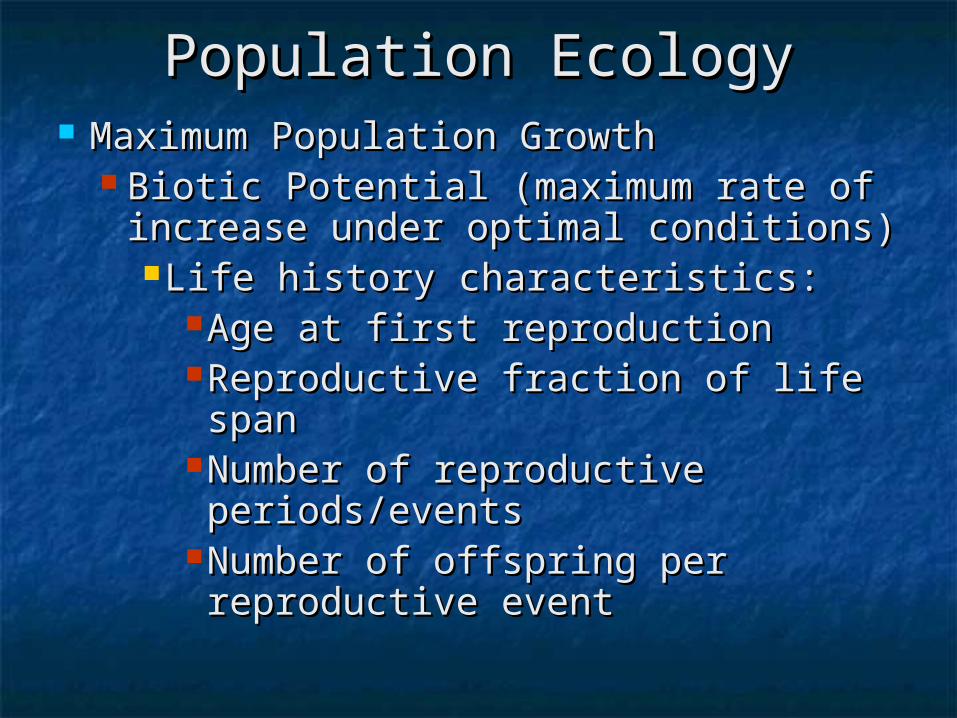
Population EcologyPopulation Ecology Maximum Population GrowthMaximum Population Growth
Biotic Potential (maximum rate of Biotic Potential (maximum rate of increase under optimal conditions)increase under optimal conditions)Life history characteristics:Life history characteristics:
Age at first reproductionAge at first reproductionReproductive fraction of life spanReproductive fraction of life spanNumber of reproductive Number of reproductive periods/eventsperiods/events
Number of offspring per Number of offspring per reproductive eventreproductive event

Average Number of Children, Average Number of Children, Grandchildren, and Great Grandchildren, and Great
GrandchildrenGrandchildren AmericaAmerica West GermanyWest Germany AfricaAfrica
1414 55 258258
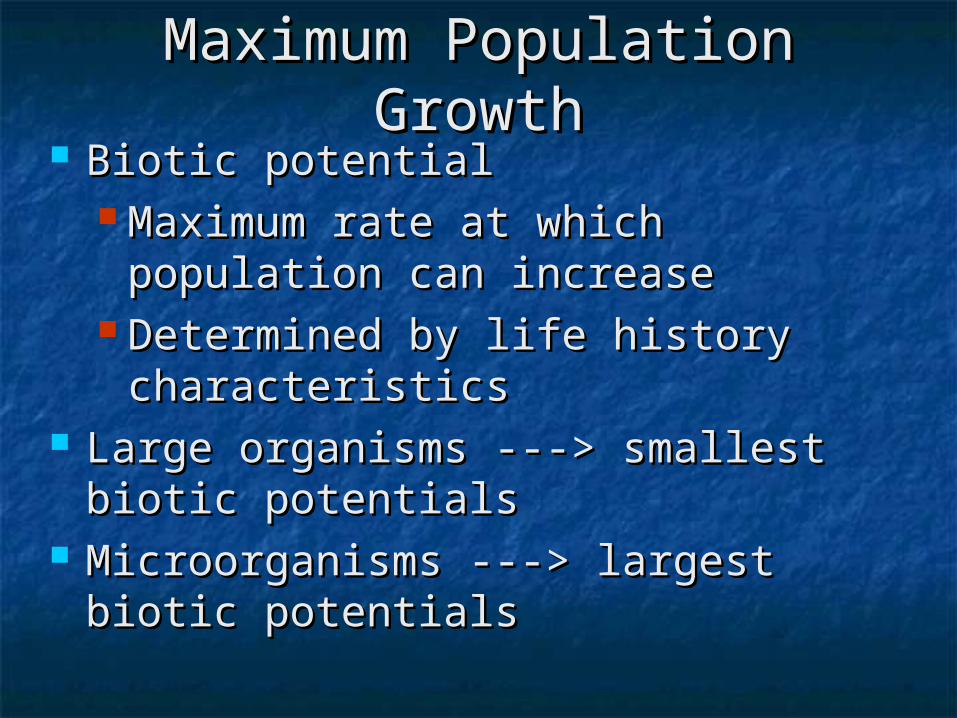
Maximum Population Maximum Population GrowthGrowth
Biotic potentialBiotic potential Maximum rate at which population Maximum rate at which population
can increasecan increase Determined by life history Determined by life history
characteristicscharacteristics Large organisms ---> smallest biotic Large organisms ---> smallest biotic
potentialspotentials Microorganisms ---> largest biotic Microorganisms ---> largest biotic
potentialspotentials
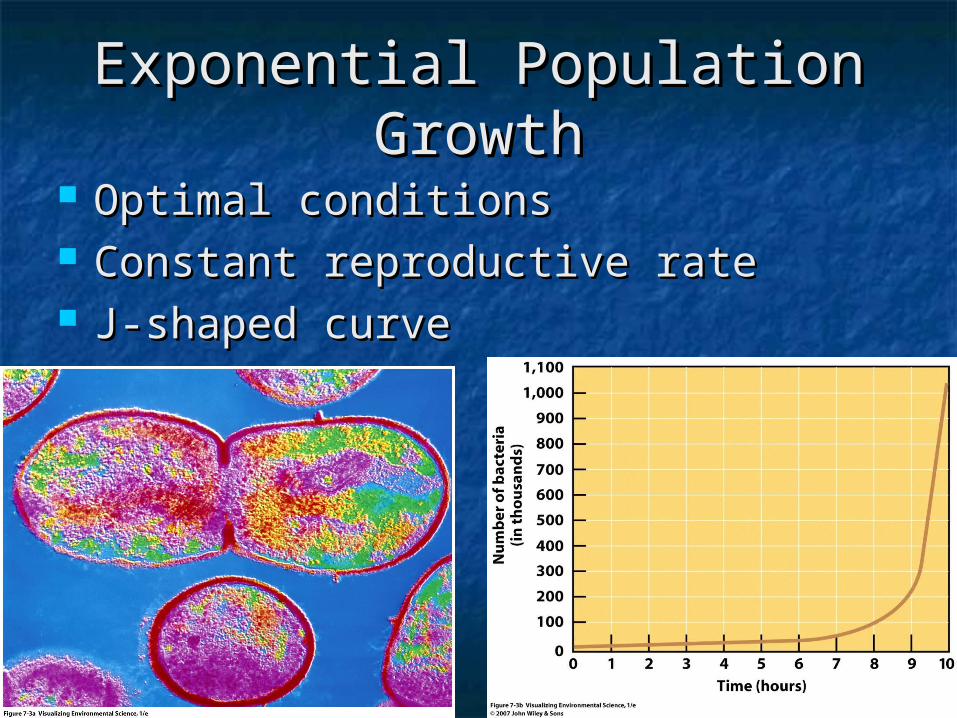
Exponential Population Exponential Population GrowthGrowth
Optimal conditionsOptimal conditions Constant reproductive rateConstant reproductive rate J-shaped curveJ-shaped curve
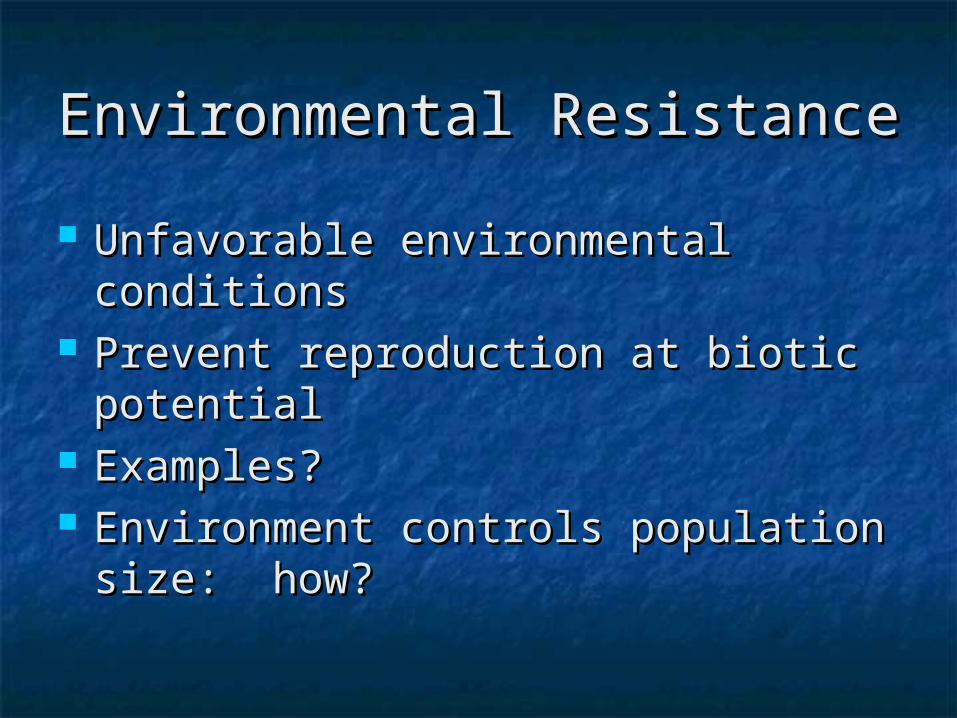
Environmental ResistanceEnvironmental Resistance
Unfavorable environmental Unfavorable environmental conditionsconditions
Prevent reproduction at biotic Prevent reproduction at biotic potentialpotential
Examples?Examples? Environment controls population size: Environment controls population size:
how? how?

Carrying CapacityCarrying Capacity Largest population that can be Largest population that can be
sustained indefinitelysustained indefinitely Changes in response to environmentChanges in response to environment J-shaped curve ---> S-shaped curveJ-shaped curve ---> S-shaped curve

Carrying CapacityCarrying Capacity
Populations are always changingPopulations are always changing Slightly above or below carrying Slightly above or below carrying
capacitycapacity Too high ---> crashToo high ---> crash
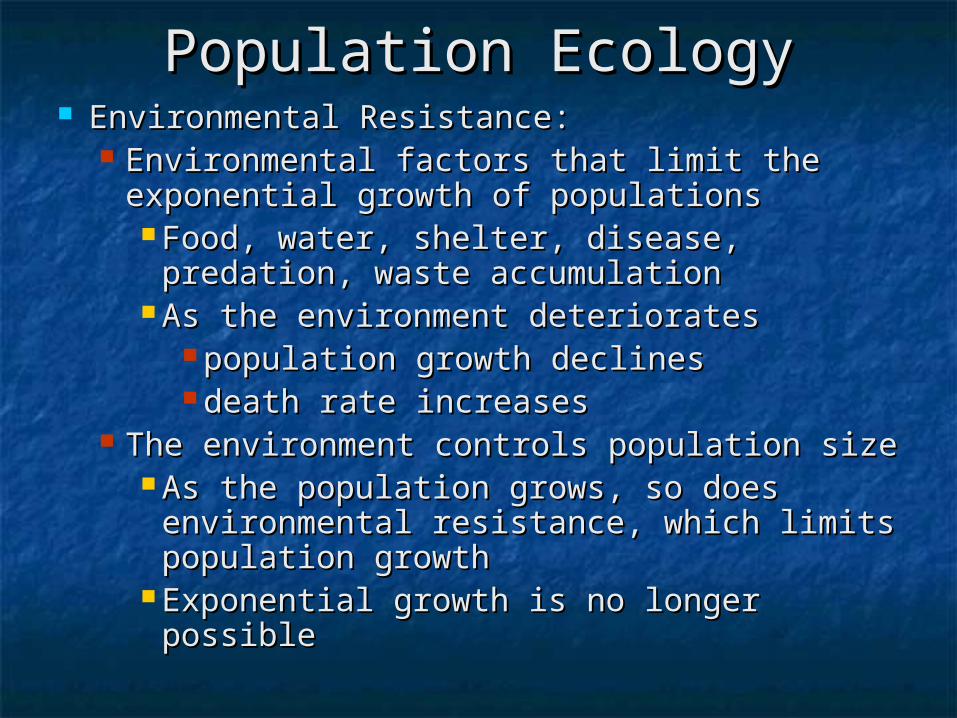
Population EcologyPopulation Ecology Environmental Resistance:Environmental Resistance:
Environmental factors that limit the Environmental factors that limit the exponential growth of populationsexponential growth of populations Food, water, shelter, disease, predation, Food, water, shelter, disease, predation,
waste accumulationwaste accumulation As the environment deteriorates As the environment deteriorates
population growth declinespopulation growth declines death rate increasesdeath rate increases
The environment controls population sizeThe environment controls population size As the population grows, so does As the population grows, so does
environmental resistance, which limits environmental resistance, which limits population growthpopulation growth
Exponential growth is no longer possibleExponential growth is no longer possible

The Human PopulationThe Human Population 7 billion by 20127 billion by 2012 Why the increase?Why the increase?

Thomas Malthus 1766-1834Thomas Malthus 1766-1834
British economistBritish economist Hypothesized that human population Hypothesized that human population
would be kept in check: how?would be kept in check: how? Thinking shaped by rapid Thinking shaped by rapid
urbanization & industrializationurbanization & industrialization Was he correct?Was he correct?
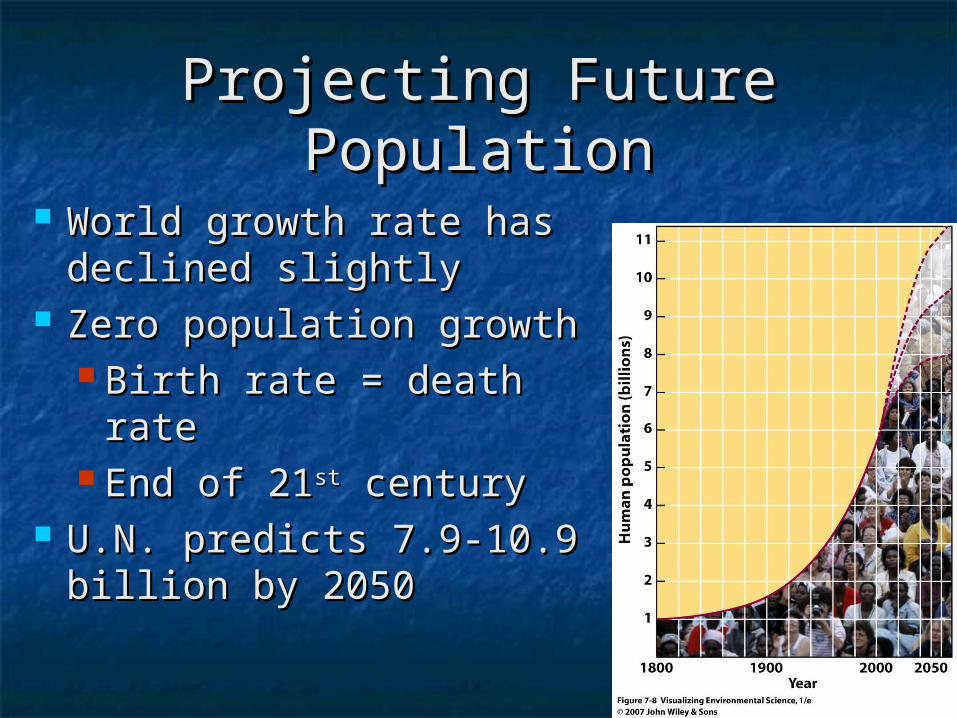
Projecting Future PopulationProjecting Future Population
World growth rate has World growth rate has declined slightlydeclined slightly
Zero population growthZero population growth Birth rate = death rateBirth rate = death rate End of 21End of 21stst century century
U.N. predicts 7.9-10.9 U.N. predicts 7.9-10.9 billion by 2050billion by 2050

Calculating Fertility Rates Calculating Fertility Rates and Doubling Timesand Doubling Times
(CBR – CDR)/10 = Rate of increase or decrease in population per 1,000 per year
70/Rate of Increase = Doubling Time

Calculating Fertility Rates Calculating Fertility Rates and Doubling Times: and Doubling Times:
PracticePractice
Country CBR CDR Rate of Increase
Doubling Time
Kenya 33 13 2.0 35
Mexico 27 5 2.2 32
USA 15 9 0.6 116
Denmark 13 11 0.2 350

Demographic Transition Demographic Transition ComparisonsComparisons

Earth’s Carrying CapacityEarth’s Carrying Capacity 4 billion – 16 billion people4 billion – 16 billion people Why such a large range?Why such a large range? What could happen to the environment?What could happen to the environment? Have we already exceeded our carrying Have we already exceeded our carrying
capacity?capacity?

Demographics of CountriesDemographics of Countries Demographics:Demographics:
Applied branch of sociology that deals with Applied branch of sociology that deals with population statisticspopulation statistics
Countries are grouped byCountries are grouped by Population growth ratesPopulation growth rates Degree of industrializationDegree of industrialization Relative prosperityRelative prosperity
GNI PPP = gross national income in purchasing GNI PPP = gross national income in purchasing power paritypower parity
Per person GNI PPP = GNI PPP/number of peoplePer person GNI PPP = GNI PPP/number of people The amount of goods and services an average The amount of goods and services an average
citizen of a particular country could buy in the UScitizen of a particular country could buy in the US

DemographicsDemographics Study of populationsStudy of populations Highly developed countriesHighly developed countries
Low birth ratesLow birth rates Low infant mortalityLow infant mortality Longer life Longer life
expectanciesexpectancies High GNI PPPHigh GNI PPP

DemographicsDemographics
Less developed countriesLess developed countries High birth ratesHigh birth rates High infant High infant
mortalitymortality Shortest life Shortest life
expectanciesexpectancies Low GNI PPPLow GNI PPP

Demographics of CountriesDemographics of Countries
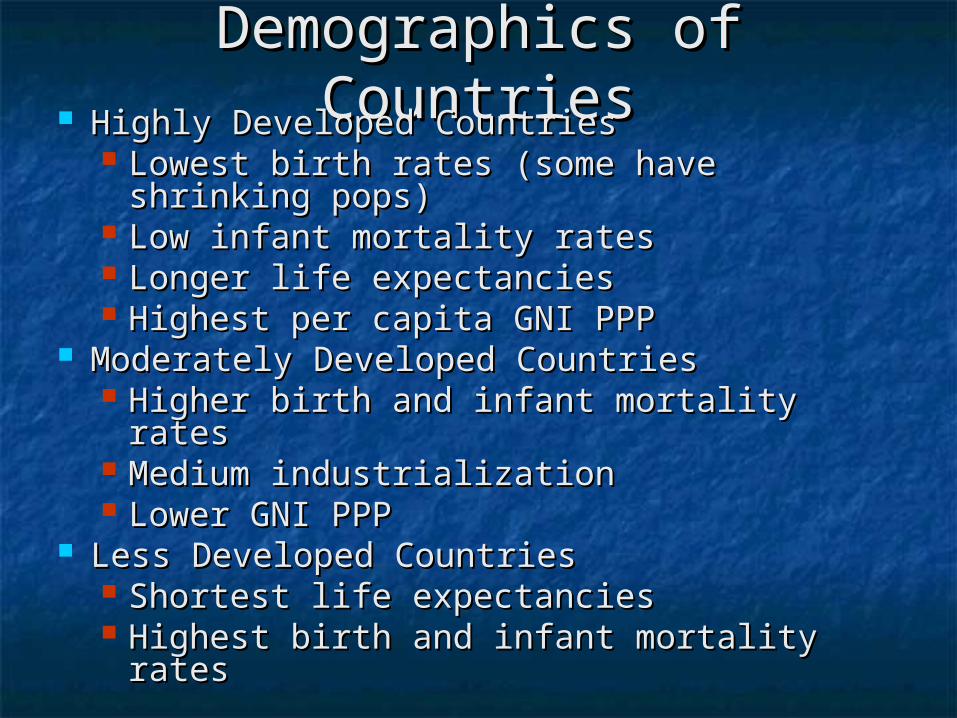
Demographics of CountriesDemographics of Countries Highly Developed CountriesHighly Developed Countries
Lowest birth rates (some have shrinking Lowest birth rates (some have shrinking pops)pops)
Low infant mortality ratesLow infant mortality rates Longer life expectanciesLonger life expectancies Highest per capita GNI PPPHighest per capita GNI PPP
Moderately Developed CountriesModerately Developed Countries Higher birth and infant mortality ratesHigher birth and infant mortality rates Medium industrializationMedium industrialization Lower GNI PPPLower GNI PPP
Less Developed CountriesLess Developed Countries Shortest life expectanciesShortest life expectancies Highest birth and infant mortality ratesHighest birth and infant mortality rates
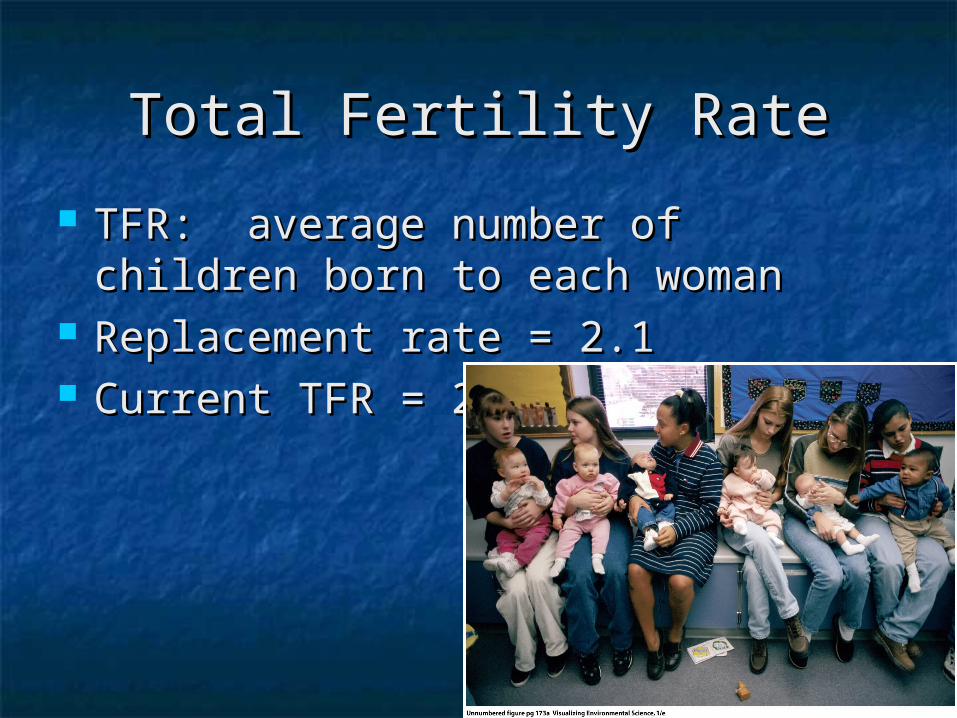
Total Fertility RateTotal Fertility Rate
TFR: average number of children TFR: average number of children born to each womanborn to each woman
Replacement rate = 2.1Replacement rate = 2.1 Current TFR = 2.6Current TFR = 2.6
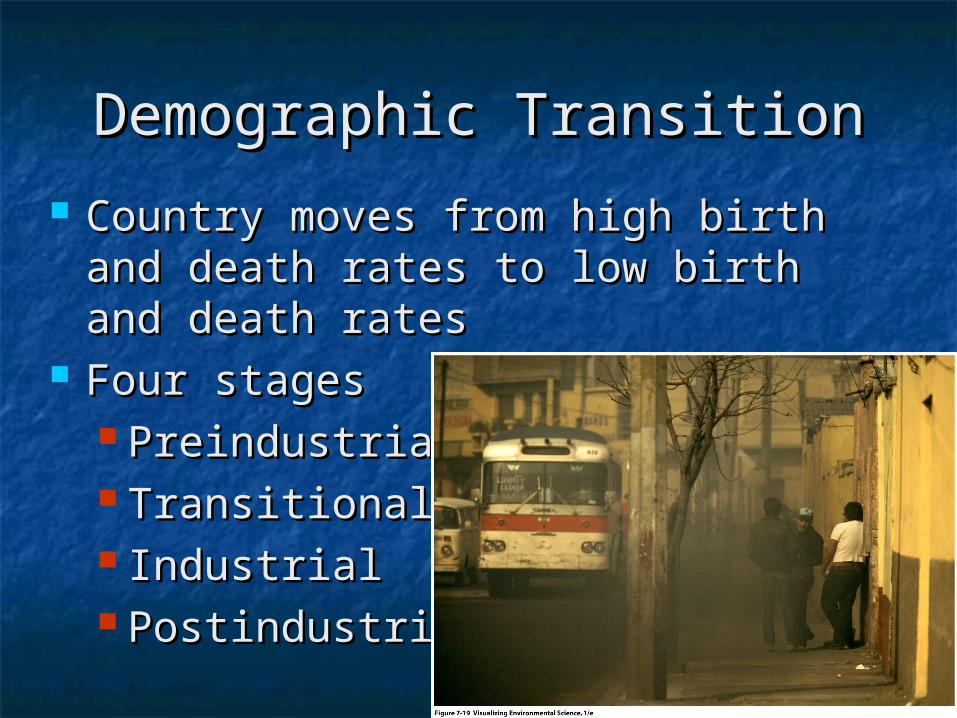
Demographic TransitionDemographic Transition
Country moves from high birth and Country moves from high birth and death rates to low birth and death death rates to low birth and death ratesrates
Four stagesFour stages PreindustrialPreindustrial TransitionalTransitional IndustrialIndustrial PostindustrialPostindustrial

Demographic TransitionDemographic Transition

The Demographic The Demographic TransitionTransition

What happens when a population reaches What happens when a population reaches the 4the 4thth stage? stage?
We don’t know:We don’t know: We see that TFR are dropping as countries We see that TFR are dropping as countries
become more industrializedbecome more industrialized BrazilBrazil
1960 = 6.7 children/woman, 2010 = 21960 = 6.7 children/woman, 2010 = 2 WorldwideWorldwide
1970 = 6.1 children/woman, 2010 = 2.71970 = 6.1 children/woman, 2010 = 2.7 Despite great advances, population still Despite great advances, population still
increasingincreasing
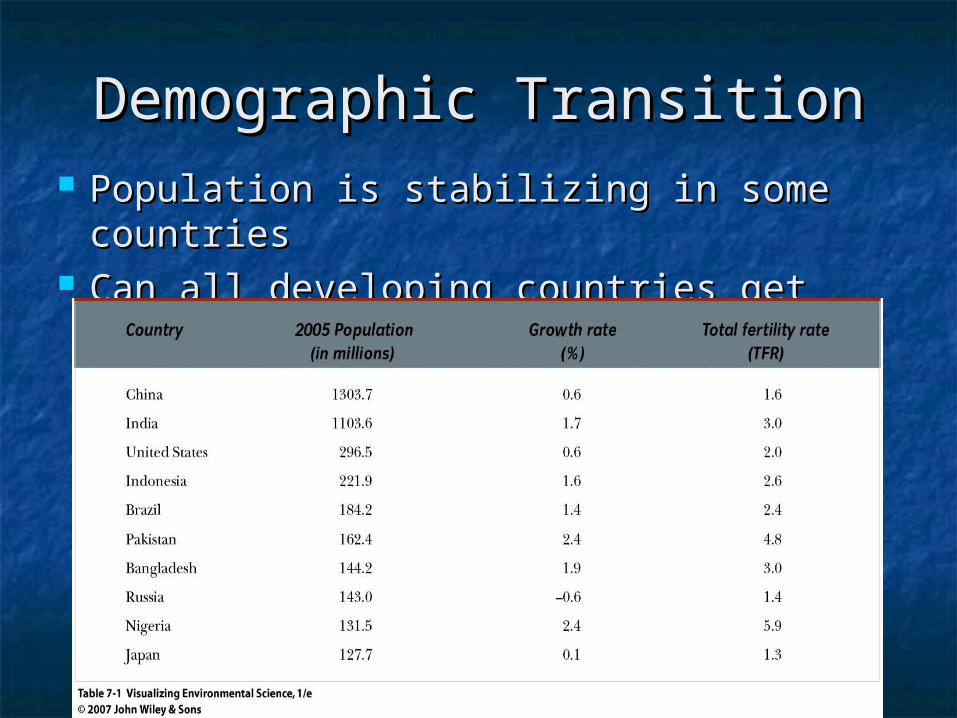
Demographic TransitionDemographic Transition Population is stabilizing in some Population is stabilizing in some
countriescountries Can all developing countries get there?Can all developing countries get there?

Age StructureAge Structure
Number and proportion of people in Number and proportion of people in each age group in a populationeach age group in a population
Helps predict future growthHelps predict future growth Shape is importantShape is important
Pyramid = fast growthPyramid = fast growth Tapered bases = slow or negative Tapered bases = slow or negative
growthgrowth

Age Structure DiagramsAge Structure Diagrams
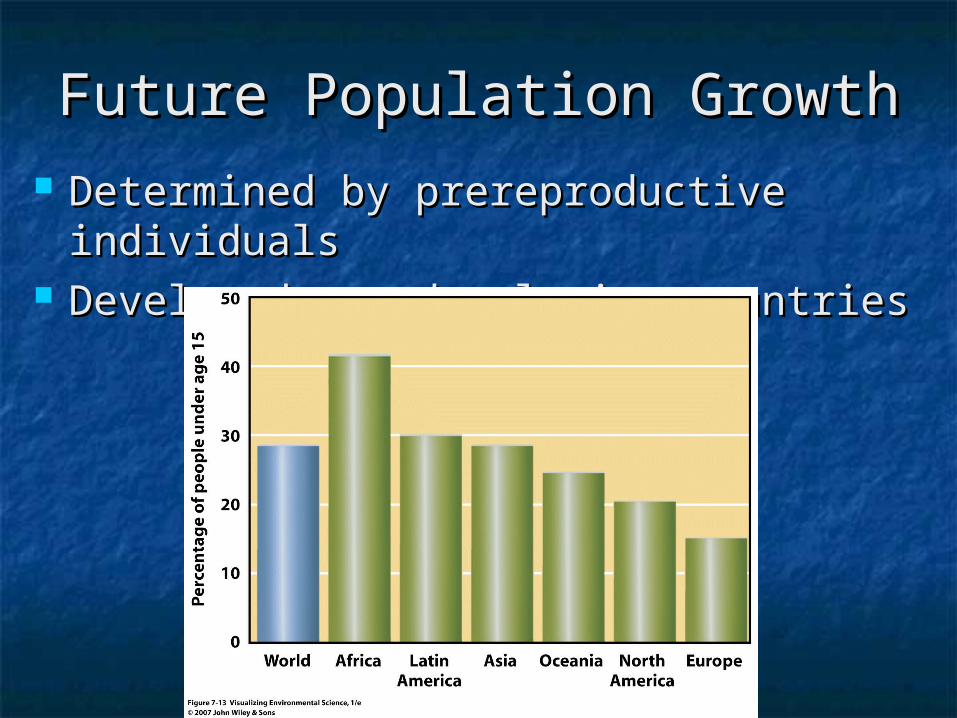
Future Population GrowthFuture Population Growth Determined by prereproductive Determined by prereproductive
individualsindividuals Developed vs. developing countriesDeveloped vs. developing countries

Stabilizing World PopulationStabilizing World Population Dispersal is not a solutionDispersal is not a solution Increase the death rate?Increase the death rate? Reduce the birth rate!Reduce the birth rate!

Culture and FertilityCulture and Fertility Gender and societyGender and society Different societies have different Different societies have different
expectations; impacts fertility ratesexpectations; impacts fertility rates

Culture and FertilityCulture and Fertility
High TFRs may be traditionalHigh TFRs may be traditional High infant mortality ratesHigh infant mortality rates Children can workChildren can work Males more valuedMales more valued Religious valuesReligious values Changing traditions Changing traditions
takes timetakes time

Status of WomenStatus of Women
Gender inequality still existsGender inequality still exists Most developing countriesMost developing countries
More illiterate womenMore illiterate women Fewer women attend secondary Fewer women attend secondary
schoolschool Limits womenLimits women
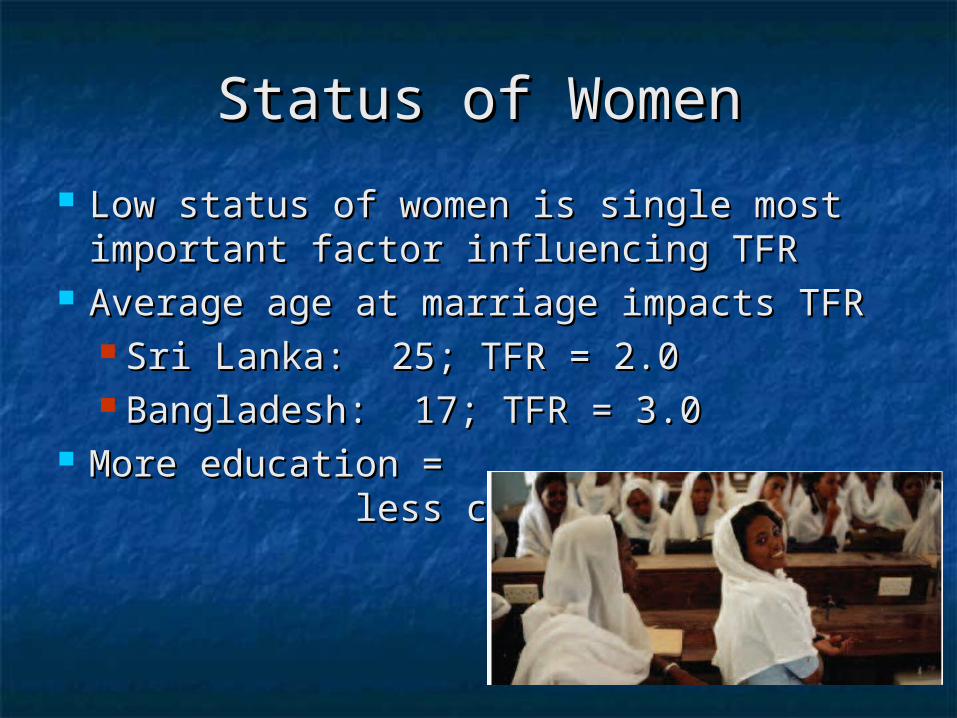
Status of WomenStatus of Women
Low status of women is single most Low status of women is single most important factor influencing TFRimportant factor influencing TFR
Average age at marriage impacts TFRAverage age at marriage impacts TFR Sri Lanka: 25; TFR = 2.0Sri Lanka: 25; TFR = 2.0 Bangladesh: 17; TFR = 3.0Bangladesh: 17; TFR = 3.0
More education = More education = less children; why?less children; why?

Family Planning ServicesFamily Planning Services Prenatal care, proper birth spacingPrenatal care, proper birth spacing Healthier women ---> healthier babies Healthier women ---> healthier babies
---> fewer infant deaths ---> lower ---> fewer infant deaths ---> lower TFRTFR
Provide information and Provide information and contraceptivescontraceptives
Local social and Local social and cultural beliefscultural beliefs

Government Policies & Government Policies & FertilityFertility
Laws determining minimum marriage Laws determining minimum marriage ageage
Budget for family planning, education, Budget for family planning, education, health care, old-age securityhealth care, old-age security
Economic rewards and penaltiesEconomic rewards and penalties Many countries recognize the problemMany countries recognize the problem

Population and UrbanizationPopulation and Urbanization Human population becoming more Human population becoming more
urbanizedurbanized 79% U.S. population lives in cities; why?79% U.S. population lives in cities; why?
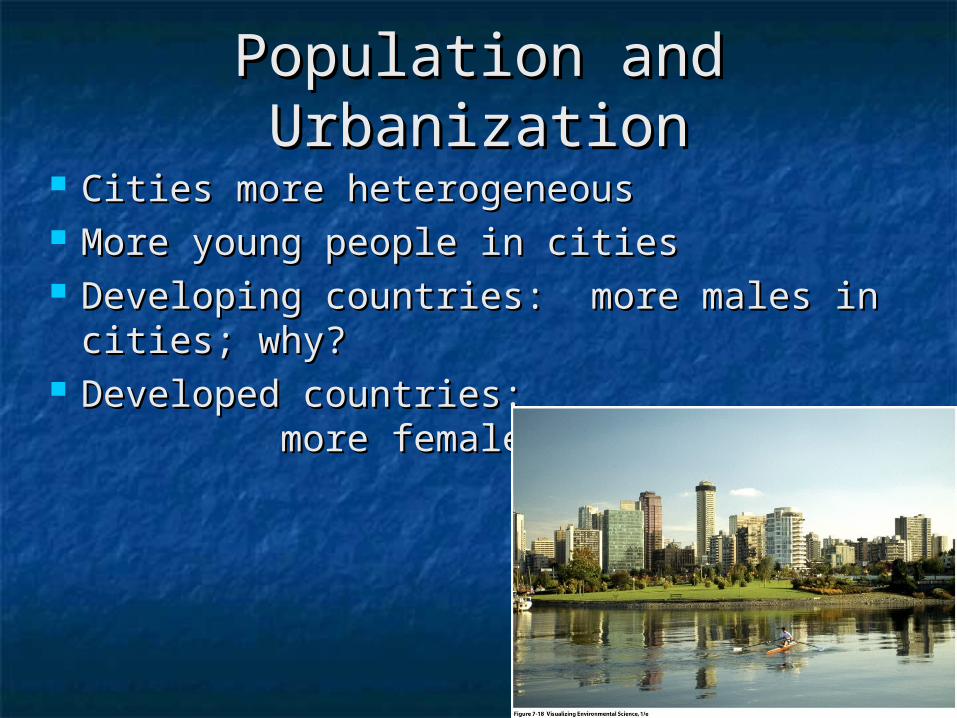
Population and UrbanizationPopulation and Urbanization Cities more heterogeneousCities more heterogeneous More young people in citiesMore young people in cities Developing countries: more males in Developing countries: more males in
cities; why?cities; why? Developed countries: Developed countries:
more females in more females in cities; why?cities; why?

Environmental Problems of Environmental Problems of Urban AreasUrban Areas
Encroachment into habitatEncroachment into habitat BrownfieldsBrownfields Long commute ---> more air pollutionLong commute ---> more air pollution Buildup of emissionsBuildup of emissions Paved roads, Paved roads,
buildings affect buildings affect water flowwater flow

Environmental Benefits of Environmental Benefits of UrbanizationUrbanization
Compact developmentCompact development Tall, multiple-unit residential Tall, multiple-unit residential
buildings are close to shops and jobsbuildings are close to shops and jobs Connected by public transportationConnected by public transportation Reduces pollutionReduces pollution Preserves rural areasPreserves rural areas
Requires smart planning!Requires smart planning!
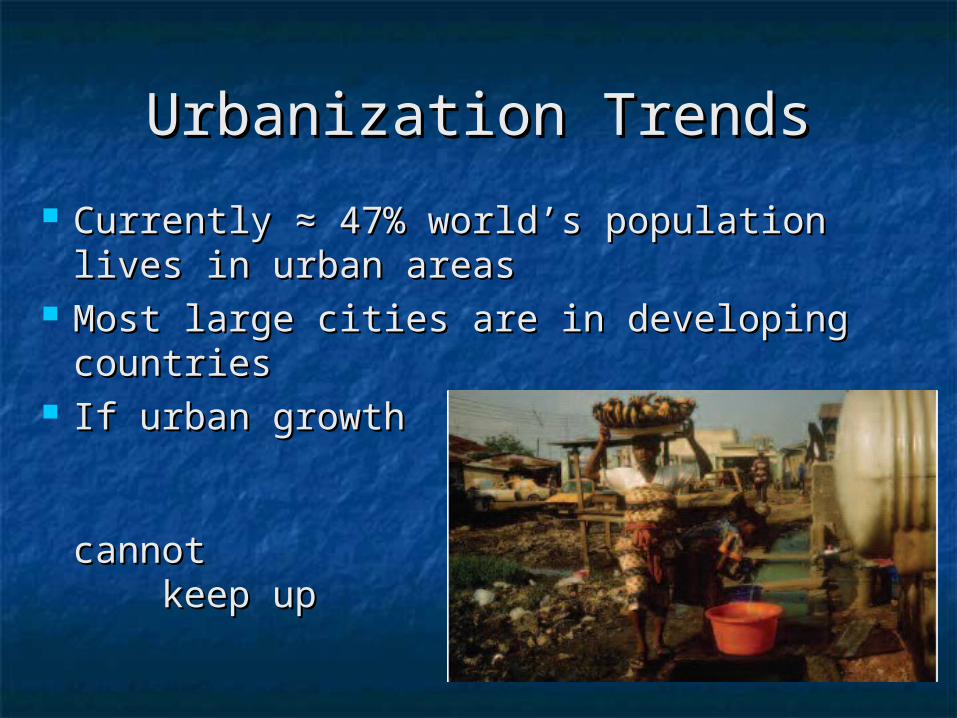
Urbanization TrendsUrbanization Trends
Currently ≈ 47% world’s population Currently ≈ 47% world’s population lives in urban areaslives in urban areas
Most large cities are in developing Most large cities are in developing countriescountries
If urban growth If urban growth is too fast, basic is too fast, basic services cannot services cannot keep upkeep up

Urbanization TrendsUrbanization Trends

Population and UrbanizationPopulation and Urbanization Urbanization TrendsUrbanization Trends Highly Developed Countries ( e.g., US) Highly Developed Countries ( e.g., US)
Most migration to cities in last 150 yrsMost migration to cities in last 150 yrs Need for industrial laborNeed for industrial labor Slow growth, services could keep upSlow growth, services could keep up
Water purification, sewage treatment, Water purification, sewage treatment, education, adequate housingeducation, adequate housing
Developing CountriesDeveloping Countries Rapid growth - cities can’t provide basic servicesRapid growth - cities can’t provide basic services Low job possibilities (still greater than in rural Low job possibilities (still greater than in rural
areas)areas) Substandard housing (slums)Substandard housing (slums) PovertyPoverty UnemploymentUnemployment Pollution, water, and sewage issuesPollution, water, and sewage issues
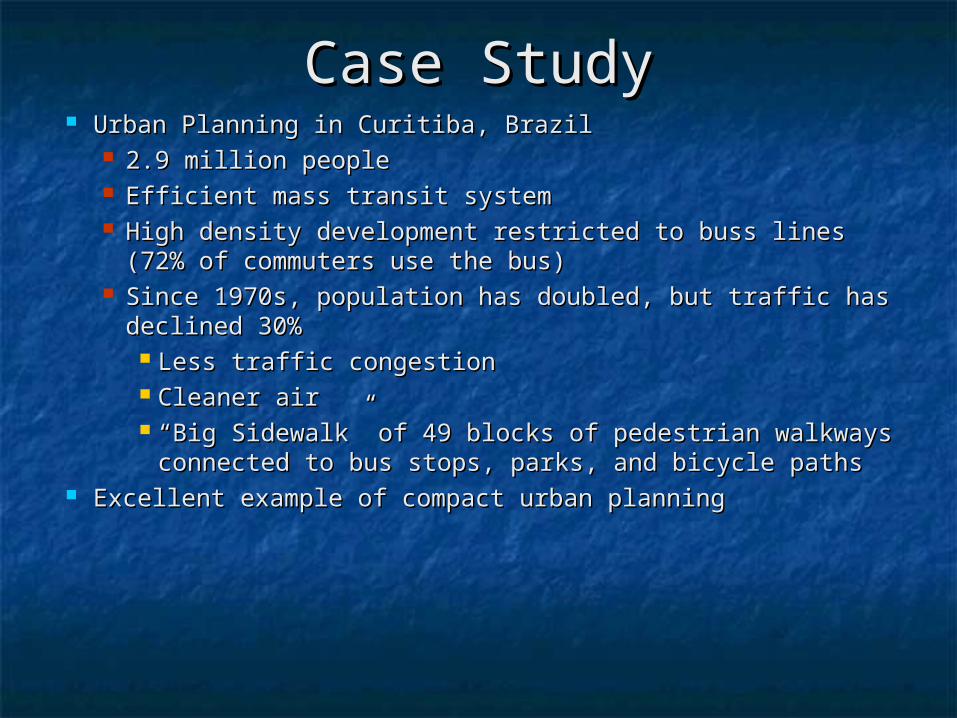
Case StudyCase Study Urban Planning in Curitiba, BrazilUrban Planning in Curitiba, Brazil
2.9 million people2.9 million people Efficient mass transit systemEfficient mass transit system High density development restricted to buss lines (72% of High density development restricted to buss lines (72% of
commuters use the bus)commuters use the bus) Since 1970s, population has doubled, but traffic has Since 1970s, population has doubled, but traffic has
declined 30%declined 30% Less traffic congestionLess traffic congestion Cleaner airCleaner air ““Big Sidewalk” of 49 blocks of pedestrian walkways Big Sidewalk” of 49 blocks of pedestrian walkways
connected to bus stops, parks, and bicycle pathsconnected to bus stops, parks, and bicycle paths Excellent example of compact urban planningExcellent example of compact urban planning