Embed Size (px)
Citation preview

CHAPTER 7
BONE AND TISSUE TRANSPLANTATION
Editor:
Assoc Prof Dr Suzina Sheikh Ab Hamid
Expert Panel:
Assoc Prof Dr Suzina Sheikh Ab Hamid (Chairperson)
Dr Abdul Malik Mohamed Hussein
Assoc Prof Dr Ahmad Hafiz Zulkifly
Dr Thiageswari Umapathy
Dr Ewe Teong Wan
Assoc Prof Dr Vivek Ajit Singh
Dr Norimah Yusof
Contents
7.0 Introduction
7.1 Stock of Tissue Allografts and Hospitals Where Tissues are Utilised from 2004 to
2010
7.2 Reporting Centres
7.3 Recipient Details
7.4 Pre Transplant Data
7.5 Transplant Surgery Data

BONE AND TISSUE TRANSPLANTATION
Seventh Report of the
National Transplant Registry 2010
2
List of Tables
Table 7.1.1 Types of Tissue Allografts Supplied by USM Tissue Bank, 2004-
2010
5
Table 7.1.2 Hospitals/Other Sectors Using Bone, Tendon and Skin Allografts
Provided by USM Tissue Bank, 2004-2010
6
Table 7.1.3 Hospitals/Other Sectors Using Amniotic Membranes provided by
USM Tissue Bank, 2004-2010
7
Table 7.2.1 Distribution of Reporting Centre, 2004-2010 8
Table 7.3.1 Distribution of Number of Transplant by Gender, 2004-2010 9
Table 7.3.2 Distribution of Number of Transplant by Ethnic Group, 2004-2010 10
Table 7.3.3 Distribution of Number of Transplant by Age Group, 2004-2010 11
Table 7.3.4 Distribution of Number of Transplant by Diagnosis Warranting
Tissue Graft, 2004-2010
12
Table 7.4.1 Distribution of Number of Transplantation According to Tissue
Provider, 2004-2010
13
Table 7.4.2 Distribution of Number of Transplantation by Origin of Tissue
Graft, 2004-2010
14
Table 7.4.3 Distribution of Number of Transplantation by Tissue Graft Types,
2004-2010
15
Table 7.4.3(a) Distribution of Tissue Graft Types (breakdowns), 2004-2010 16
Table 7.4.4 Distribution of Graft Sterilization Types, 2004-2010 16
Table 7.4.5 Distribution of Mode of Transport Storage to Recipient Hospital
during Transportation, 2004-2010
16
Table 7.4.6 Distribution of Temperature of Storage During Transportation,
2004-2010
17
Table 7.5.1 Distribution of Mode of Storage in Recipient Hospital, 2004-2010 18
Table 7.5.2 Distribution of Additional Tissue Usage (Composite Graft), 2004-
2010
18
Table 7.5.3 Distribution of Presence of Pre Operative Infection at Implant Site,
2004-2010
18
Table 7.5.4 Distribution of Pre Implant Graft Cultural Swab, 2004-2010 19
Table 7.5.5 Distribution of Grafts Soaked in Antibiotics Prior to
Transplantation, 2004-2010
19
Table 7.5.6 Distribution of Number of Transplant by Systemic Antibiotics
Given Prior to Transplantation, 2004-2010
20
List of Figures
Figure 7.3.1 Distribution of Number of Transplant by Gender, 2004-2010 9
Figure 7.3.2 Distribution of Number of Transplant by Ethnic Group, 2004-2010 10
Figure 7.3.3 Distribution of Number of Transplant by Age Group, 2004-2010 11
Figure 7.4.2 Distribution of Number of Transplantation by Origin of Tissue
Graft, 2004-2010
14
Figure 7.4.3 Distribution of Number of Transplantation by Tissue Graft Types,
2004-2010
15

Seventh Report of the
National Transplant Registry 2010
3
BONE AND TISSUE TRANSPLANTATION
7.0 INTRODUCTION
The first part of this chapter presents data on tissue allografts that have been distributed and
data about recipient centres. The second part presents data obtained from the Bone and Tissue
Transplant Notification Form. It is noticeable that bone and tissue transplantation notification
is poor.
Besides USM Tissue Bank there are other centres and hospitals that are involved in human
tissue procurement, processing, storage and distribution. Some had failed to provide data
when requested by NTR and many might not aware that they have to report their data. It is
unfortunate that the Ministry of Health does not have the database on human tissue providers.
Limited outcome data was collected as very few surgeons submitted the Bone and Tissue
Transplant Notification Form to NTR. These deficiencies are due to poor participation of
human tissue providers and health professionals who perform bone and tissue transplantation
(Source Data Provider, SDP), ineffective enforcement of notification and networking. Efforts
have been initiated to identify human tissue providers in this country and to improve SDP
involvement.

BONE AND TISSUE TRANSPLANTATION
Seventh Report of the
National Transplant Registry 2010
4
7.1 STOCK OF TISSUE ALLOGRAFTS AND HOSPITALS WHERE TISSUES ARE
UTILISED FROM 2004 TO 2010
Table 7.1.1 presents the various types of tissue allografts supplied by USM Tissue Bank from
2004 until 2010. The main tissue allografts that were distributed were amniotic membranes,
deep frozen femoral heads, femur & tibia and freeze dried cancellous bone. The total number
of deep frozen bones was markedly reduced in 2009 and 2010 compared to the previous
years. The reason for this is unknown. It may be due to limited stock attributable to reduced
number of donors, there may be other centres and hospitals providing tissue allografts or
tissue allografts were imported by the surgeons.
Table 7.1.1 Types of Tissue Allografts Supplied by USM Tissue Bank, 2004-2010
Types of Tissue Allograft No. of pieces
2004 2005 2006 2007 2008 2009 2010 Total
Deep Frozen Bone
Knee Slices 1 0 0 0 0 0 0 1
Femur 10 7 5 2 8 7 8 47
Femoral Head 50 88 80 65 54 24 26 387
Humerus 1 3 0 2 2 1 4 13
Tibia 9 1 4 4 9 2 9 38
Radius 1 2 1 0 4 0 1 9
Ulna 0 3 0 0 0 0 0 3
Patella/ Bone-Patella-Bone 2 1 4 2 1 0 0 10
Others (Type not stated) 4 0 0 0 5 0 1 10
Deep Frozen Tendon
Achilles Tendon 0 0 0 2 1 1 4 8
Quadriceps Tendon 0 0 0 0 0 0 0 0
Others (Type not stated) 0 0 1 3 6 2 4 16
Freeze Dried Bone
Cancellous chip 17 19 37 2 27 5 44 151
Cortical 2 0 0 0 0 0 0 2
Cortico-cancellous 5 2 0 0 0 3 0 10
Others (Type not stated) 0 0 0 8 0 0 3 11
Skin
Deep Frozen Skin 0 0 0 0 72 0 0 72
Amniotic membrane
Air-dried & Glycerol Preserved 1128 64 379 175 2082 932 972 5732
Others 0 0 0 0 0 0 0 0
Total 1230 190 511 265 2271 977 1076 6520
USM Tissue Bank continues to provide tissue allografts to Ministry of Health hospitals,
private hospitals and other sectors (Table 7.1.2 and 7.1.3).
Seventh Report of the
National Transplant Registry 2010
5
BONE AND TISSUE TRANSPLANTATION
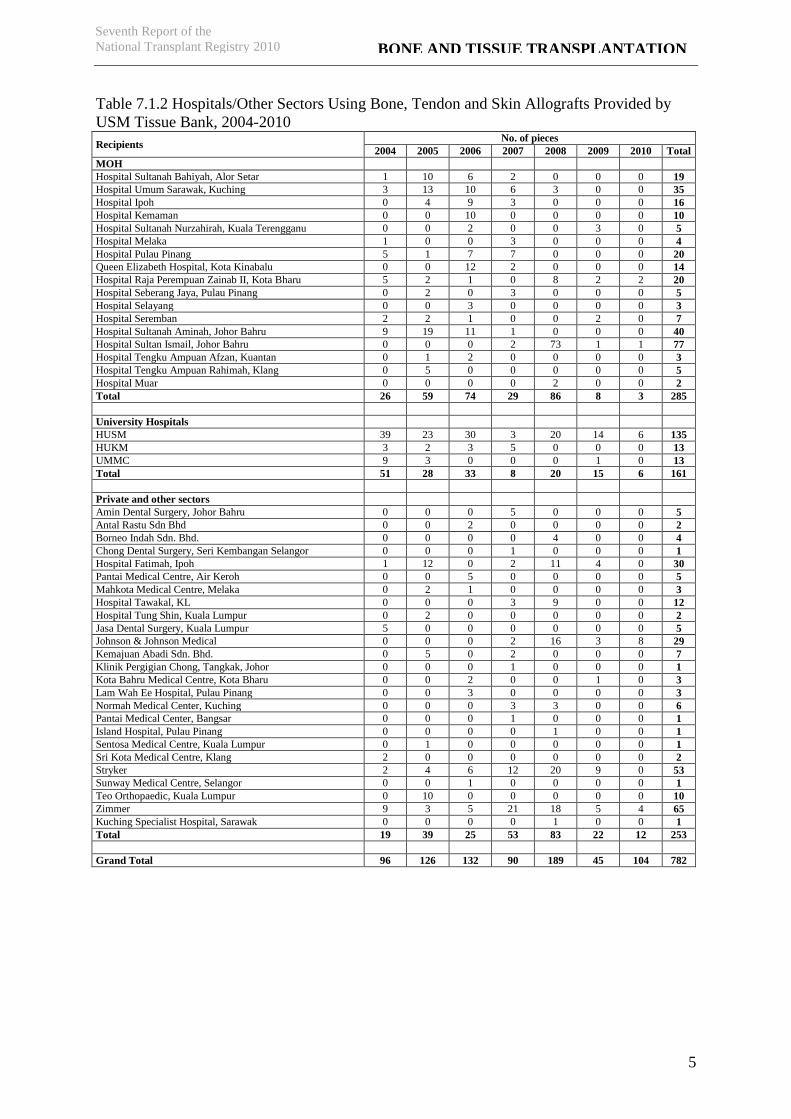
Table 7.1.2 Hospitals/Other Sectors Using Bone, Tendon and Skin Allografts Provided by
USM Tissue Bank, 2004-2010
Recipients No. of pieces
2004 2005 2006 2007 2008 2009 2010 Total
MOH
Hospital Sultanah Bahiyah, Alor Setar 1 10 6 2 0 0 0 19
Hospital Umum Sarawak, Kuching 3 13 10 6 3 0 0 35
Hospital Ipoh 0 4 9 3 0 0 0 16
Hospital Kemaman 0 0 10 0 0 0 0 10
Hospital Sultanah Nurzahirah, Kuala Terengganu 0 0 2 0 0 3 0 5
Hospital Melaka 1 0 0 3 0 0 0 4
Hospital Pulau Pinang 5 1 7 7 0 0 0 20
Queen Elizabeth Hospital, Kota Kinabalu 0 0 12 2 0 0 0 14
Hospital Raja Perempuan Zainab II, Kota Bharu 5 2 1 0 8 2 2 20
Hospital Seberang Jaya, Pulau Pinang 0 2 0 3 0 0 0 5
Hospital Selayang 0 0 3 0 0 0 0 3
Hospital Seremban 2 2 1 0 0 2 0 7
Hospital Sultanah Aminah, Johor Bahru 9 19 11 1 0 0 0 40
Hospital Sultan Ismail, Johor Bahru 0 0 0 2 73 1 1 77
Hospital Tengku Ampuan Afzan, Kuantan 0 1 2 0 0 0 0 3
Hospital Tengku Ampuan Rahimah, Klang 0 5 0 0 0 0 0 5
Hospital Muar 0 0 0 0 2 0 0 2
Total 26 59 74 29 86 8 3 285
University Hospitals
HUSM 39 23 30 3 20 14 6 135
HUKM 3 2 3 5 0 0 0 13
UMMC 9 3 0 0 0 1 0 13
Total 51 28 33 8 20 15 6 161
Private and other sectors
Amin Dental Surgery, Johor Bahru 0 0 0 5 0 0 0 5
Antal Rastu Sdn Bhd 0 0 2 0 0 0 0 2
Borneo Indah Sdn. Bhd. 0 0 0 0 4 0 0 4
Chong Dental Surgery, Seri Kembangan Selangor 0 0 0 1 0 0 0 1
Hospital Fatimah, Ipoh 1 12 0 2 11 4 0 30
Pantai Medical Centre, Air Keroh 0 0 5 0 0 0 0 5
Mahkota Medical Centre, Melaka 0 2 1 0 0 0 0 3
Hospital Tawakal, KL 0 0 0 3 9 0 0 12
Hospital Tung Shin, Kuala Lumpur 0 2 0 0 0 0 0 2
Jasa Dental Surgery, Kuala Lumpur 5 0 0 0 0 0 0 5
Johnson & Johnson Medical 0 0 0 2 16 3 8 29
Kemajuan Abadi Sdn. Bhd. 0 5 0 2 0 0 0 7
Klinik Pergigian Chong, Tangkak, Johor 0 0 0 1 0 0 0 1
Kota Bahru Medical Centre, Kota Bharu 0 0 2 0 0 1 0 3
Lam Wah Ee Hospital, Pulau Pinang 0 0 3 0 0 0 0 3
Normah Medical Center, Kuching 0 0 0 3 3 0 0 6
Pantai Medical Center, Bangsar 0 0 0 1 0 0 0 1
Island Hospital, Pulau Pinang 0 0 0 0 1 0 0 1
Sentosa Medical Centre, Kuala Lumpur 0 1 0 0 0 0 0 1
Sri Kota Medical Centre, Klang 2 0 0 0 0 0 0 2
Stryker 2 4 6 12 20 9 0 53
Sunway Medical Centre, Selangor 0 0 1 0 0 0 0 1
Teo Orthopaedic, Kuala Lumpur 0 10 0 0 0 0 0 10
Zimmer 9 3 5 21 18 5 4 65
Kuching Specialist Hospital, Sarawak 0 0 0 0 1 0 0 1
Total 19 39 25 53 83 22 12 253
Grand Total 96 126 132 90 189 45 104 782

BONE AND TISSUE TRANSPLANTATION
Seventh Report of the
National Transplant Registry 2010
6
Table 7.1.3 Hospitals/Other Sectors Using Amniotic Membranes provided by USM Tissue
Bank, 2004-2010
Recipients No. of pieces
2004 2005 2006 2007 2008 2009 2010 Total
Ministry of Health
Hospital Miri, Sabah 0 0 0 5 10 0 0 15
Hospital Kuala Lumpur 22 15 13 40 0 0 0 90
Hospital Sultanah Bahiyah, Alor Setar 0 0 2 7 0 0 0 9
Hospital Umum Sarawak, Kuching 6 10 0 6 1 0 0 23
Hospital Sultanah Nurzahirah, Kuala Terengganu 0 1 0 5 0 0 0 6
Hospital Melaka 5 5 10 0 5 0 0 25
Hospital Pakar Sultanah Fatimah, Johor Bahru 0 0 100 0 0 0 0 100
Hospital Pulau Pinang 0 0 0 3 0 0 0 3
Queen Elizabeth Hospital, Kota Kinabalu 0 0 4 1 0 0 0 5
Hospital Raja Perempuan Zainab II, Kota Bharu 0 5 0 2 1 0 0 8
Hospital Selayang 0 0 1 0 0 0 0 1
Hospital Sultanah Aminah, Johor Bahru 73 0 200 0 0 0 0 273
Hospital Sultan Ismail, Johor Bahru 0 0 0 50 0 0 0 50
Hospital Teluk Intan 0 0 1 4 0 0 0 5
Hospital Tengku Ampuan Afzan, Kuantan 6 6 7 0 0 0 0 19
Hospital Tengku Ampuan Rahimah, Klang 4 5 0 0 0 0 0 9
Hospital Kuala Krai 0 0 0 0 1 0 0 1
Hospital Sungai Buloh 0 0 0 21 40 0 0 61
Total 116 47 338 144 58 0 0 703
University Hospitals
HUSM 1001 1 8 7 4 0 0 1021
HUKM 4 0 0 7 32 0 0 43
UMMC 5 0 6 0 5 0 0 16
IIUM 0 0 0 6 0 0 0 6
Total 1010 1 14 20 41 0 0 1086
Private and other sectors
Gleneagles Medical Centre, Pulau Pinang 2 4 8 0 6 0 0 20
Hospita Mata Tun Hussein Onn 0 4 0 0 5 0 0 9
Hospital Tawakal, KL 0 0 4 0 0 0 0 4
ISEC Sdn. Bhd. 0 0 0 2 0 0 0 2
Klinik Iman, Seremban 0 1 0 0 0 0 0 1
Kuala Terengganu Specialist Center, Kuala
Terengganu 0 0 0 3 0 0 0 3
Peter Kong Eye Clinic, Kota Kinabalu 0 0 0 0 2 0 0 2
Pusat Rawatan Islam Al-Zahirah, Bangi, Selangor 0 0 10 0 0 0 0 10
Puteri Specialist Hospital, Johor Bahru 0 5 0 5 0 0 0 10
Putra Medical Centre, Alor Setar 0 0 1 1 0 0 0 2
Sri Kota Medical Centre, Klang 0 2 4 0 2 0 0 8
CryoCord Sdn. Bhd. 0 0 0 0 1968 932 972 3872
Total 2 16 27 11 1983 932 972 3943
Grand Total 1128 64 379 175 2082 932 972 5732

Seventh Report of the
National Transplant Registry 2010
7
BONE AND TISSUE TRANSPLANTATION
7.2 Reporting Centre
The recipient centres that reported to the National Transplant Registry using the Bone and
Tissue Transplant Notification Form are shown on Table 7.2.1. The total number of reporting
centres between 2004 and 2010 show a decreasing trend.
Table 7.2.1 Distribution of Reporting Centre, 2004-2010 Reporting centre 2004 2005 2006 2007 2008 2009 2010 Total
Orthopaedics Department
Department of Orthopaedics, HUSM 1 7 2 1 1 0 3 15
Institute of Orthopaedic & Traumatology, Hospital Kuala Lumpur 2 0 0 0 0 0 0 2
Department of Orthopaedics Surgery, UMMC 1 0 0 0 0 0 0 1
Department of Orthopaedics, Hospital Pulau Pinang 0 0 0 1 0 0 0 1
Department of Orthopaedics, Hospital Ipoh 0 1 0 0 0 0 0 1
Department of Orthopaedics, Hospital Raja Perempuan Zainab II 9 3 0 0 0 0 0 12
Department of Orthopaedics, Hospital Umum Sarawak 1 0 1 0 0 0 0 2
Department of Orthopaedics, Hospital Tengku Ampuan Afzan 0 0 0 1 0 0 0 1
Department of Orthopaedics, Hospital Sultanah Aminah 0 1 0 0 0 0 0 1
Wan Orthopaedic, Trauma & Sports Injury Centre (WOTSIC), Seremban
Specialist Hospital 0 0 2 0 0 0 0 2
Department of Orthopaedics, Island Hospital, Pulau Pinang 0 1 0 0 0 0 0 1
Department of Orthopaedics, Normah Medical Specialist Centre, Kuching
0 1 0 0 0 0 0 1
Department of Orthopaedics, Hospital Fatimah, Ipoh 0 3 0 1 0 1 0 5
Department of Orthopaedics, Kota Bharu Medical Centre 0 0 2 0 0 0 0 2
Department of Orthopaedics, Pantai Medical Centre, Kuala Lumpur 0 0 0 1 0 0 0 1
Department of Orthopaedics, Gleneagles Medical Centre, Pulau Pinang 0 0 0 0 1 0 0 1
Department of Orthopaedics, Penang Adventis Hospital, Pulau Pinang 0 0 0 0 1 0 0 1
Spine Unit, HUSM 0 0 1 0 1 0 0 2
Department of Orthopaedics & Traumatology, Hospital Kangar 0 0 0 0 0 0 1 1
Orthopaedics Unit, Hospital Kemaman 0 0 0 0 0 0 1 1
Total 14 17 8 5 4 1 5 54
Ophthalmology Department
Department of Ophthalmology, Hospital Tengku Ampuan Rahimah,
Klang 1 1 0 0 0 0 0 2
Department of Ophthalmology, Hospital Tengku Ampuan Afzan, Kuantan
1 1 0 0 0 0 0 2
Department of Ophthalmology, Hospital Teluk Intan 0 0 1 0 0 0 0 1
Department of Ophthalmology, Hospital Kuala Lumpur 0 0 23 20 15 10 1 69
Department of Ophthalmology, Hospital Sultanah Bahiyah, Alor Setar 0 0 1 0 0 0 0 1
Department of Ophthalmology, Hospital Sungai Buloh 0 0 0 9 0 5 0 14
Department of Ophthalmology, Hospital Umum Sarawak 0 0 0 0 1 0 0 1
Department of Ophthalmology, Sri Kota Medical Centre, Klang 0 1 0 0 0 0 0 1
Department of Ophthalmology, HUSM 0 0 1 2 2 0 0 5
Pusat Pakar Mata Centre For Sight 0 0 0 0 1 0 0 1
Total 2 3 26 31 19 15 1 97
Others
Maxillofacial Surgery, HUSM 1 1 0 0 0 0 0 2
Timberland Medical Centre, Kuching 0 1 0 0 0 0 0 1
Sri Kota Medical Centre, Klang 0 0 1 0 0 0 0 1
Total 1 2 1 0 0 0 0 4
Grand Total 17 22 35 36 23 16 6 155

BONE AND TISSUE TRANSPLANTATION
Seventh Report of the
National Transplant Registry 2010
8
7.3 Recipient Details
The bone and tissue allografts recipients’ gender (Table 7.3.1), ethnicity (Table 7.3.1), age
(Table 7.3.3) and diagnosis (Table 7.3.4) are presented in this section.
Table 7.3.1 Distribution of Number of Transplant by Gender, 2004-2010
Gender 2004 2005 2006 2007 2008 2009 2010 Total
No. % No. % No. % No. % No. % No. % No. % No. %
Male 9 53 10 45 27 77 21 58 10 43 12 75 5 83 94 61
Female 8 47 12 55 8 23 15 42 13 57 4 25 1 17 61 39
Total 17 100 22 100 35 100 36 100 23 100 16 100 6 100 155 100
*1 patient can undergo more than 1 transplant
Figure 7.3.1 Distribution of Number of Transplant by Gender, 2004-2010

Seventh Report of the
National Transplant Registry 2010
9
BONE AND TISSUE TRANSPLANTATION
Table 7.3.2 Distribution of Number of Transplant by Ethnic Group, 2004-2010
Race 2004 2005 2006 2007 2008 2009 2010 Total
No. % No. % No. % No. % No. % No. % No. % No. %
Malay 11 65 14 64 26 74 18 50 13 57 8 50 5 83 95 61
Chinese 3 18 5 23 7 20 12 33 6 26 0 0 1 17 34 22
Indian 1 6 1 5 1 3 4 11 1 4 3 19 0 0 11 7
Bumiputra Sabah 0 0 0 0 0 0 0 0 1 4 0 0 0 0 1 1
Bumiputra Sarawak 1 6 0 0 0 0 1 3 0 0 0 0 0 0 2 1
Others 1 6 2 9 1 3 1 3 2 9 5 31 0 0 12 8
Total 17 100 22 100 35 100 36 100 23 100 16 100 6 100 155 100
*1 patient can undergo more than 1 transplant
Figure 7.3.2 Distribution of Number of Transplant by Ethnic Group, 2004-2010

BONE AND TISSUE TRANSPLANTATION
Seventh Report of the
National Transplant Registry 2010
10
Table 7.3.3 Distribution of Number of Transplant by Age Group, 2004-2010
Age group 2004 2005 2006 2007 2008 2009 2010 Total
No. % No. % No. % No. % No. % No. % No. % No. %
0-9 0 0 1 5 4 11 5 14 4 17 4 25 2 33 20 13
10-19 1 6 6 27 2 6 1 3 5 22 1 6 0 0 16 10
20-39 9 53 6 27 16 46 8 22 6 26 6 38 1 17 52 34
40-59 5 29 3 13 8 23 11 30 5 22 4 25 2 33 38 25
>=60 2 12 5 23 5 14 10 28 3 13 1 6 1 17 27 17
Missing 0 0 1 5 0 0 1 3 0 0 0 0 0 0 2 1
Total 17 100 22 100 35 100 36 100 23 100 16 100 6 100 155 100
Mean 37 36 37 42 30 28 35 36
SD 16 23 20 23 22 18 24 21
Median 35 27 36 49 27 31 42 35
Min 15 7 0 0 1 0 3 0
Max 75 80 77 80 69 61 60 80
*1 patient can undergo more than 1 transplant
Figure 7.3.3 Distribution of Number of Transplant by Age Group, 2004-2010

Seventh Report of the
National Transplant Registry 2010
11
BONE AND TISSUE TRANSPLANTATION
Table 7.3.4 Distribution of Number of Transplant by Diagnosis Warranting Tissue Graft,
2004-2010
Diagnosis 2004 2005 2006 2007 2008 2009 2010 Total
No. % No. % No. % No. % No. % No. % No. % No. %
Congenital deformity 1 6 0 0 1 3 1 3 1 4 0 0 0 0 4 3
Infection 0 0 0 0 3 8 3 8 4 17 0 0 0 0 10 6
Trauma 5 28 1 5 6 16 1 3 2 9 2 13 3 50 20 13
Degenerative disease 1 6 2 9 0 0 1 3 1 4 0 0 0 0 5 3
Tumour - benign 5 28 4 18 1 3 1 3 0 0 0 0 0 0 11 7
Tumour - malignant 0 0 6 27 1 3 0 0 0 0 1 6 2 33 10 6
Burn 0 0 1 5 2 5 0 0 0 0 0 0 0 0 3 2
Scald 0 0 0 0 1 3 0 0 0 0 0 0 0 0 1 1
Sports injury 0 0 1 5 0 0 1 3 0 0 0 0 0 0 2 1
Failed primary surgery 1 6 2 9 1 3 2 5 0 0 0 0 0 0 6 4
Ophtalmological disease 0 0 0 0 16 42 7 19 4 17 8 50 1 17 36 23
Others 5 28 3 14 6 16 20 54 11 48 5 31 0 0 50 31
Missing 0 0 2 9 0 0 0 0 0 0 0 0 0 0 2 1
Total 18 100 22 100 38 100 37 100 23 100 16 100 6 100 160 100
*1 transplantation performed in 2004 and 2007 showed signs of 2 different types of diagnosis
*3 transplantation performed in 2006 showed signs of 2 different diagnosis

BONE AND TISSUE TRANSPLANTATION
Seventh Report of the
National Transplant Registry 2010
12
7.4 Pre-Transplant Data
This section presents data on the tissue provider (Table 7.4.1), origin of tissue graft (Table
7.4.2), tissue graft type (Table 7.4.3), type of sterilisation of the graft (Table 7.4.4), mode of
transport storage of tissue graft to recipient hospital (Table 7.4.5) and temperature of storage
tissue graft during transportation (Table 7.4.6).
Table 7.4.1 Distribution of Number of Transplantation According to Tissue Provider, 2004-
2010
Name of Tissue Bank 2004 2005 2006 2007 2008 2009 2010 Total
No. % No. % No. % No. % No. % No. % No. % No. %
Amniocord 0 0 0 0 0 0 0 0 0 0 1 6 0 0 1 1
USM Tissue Bank 13 76 18 82 31 88 34 94 23 100 13 81 5 83 137 88
Bone Bank, UMMC 1 6 0 0 0 0 0 0 0 0 0 0 0 0 1 1
Bone Bank, Hospital
Kuala Lumpur 3 18 0 0 0 0 0 0 0 0 0 0 0 0 3 2
Eucara Pharmaceutical
(P) Ltd., India 0 0 0 0 2 6 0 0 0 0 0 0 0 0 2 1
Osteo Tech Inc., USA 0 0 1 5 0 0 0 0 0 0 0 0 0 0 1 1
Missing 0 0 3 13 2 6 2 6 0 0 2 13 0 0 9 6
Total 17 100 22 100 35 100 36 100 23 100 16 100 6 100 155 100
*1 patient can undergo more than 1 transplant

Seventh Report of the
National Transplant Registry 2010
13
BONE AND TISSUE TRANSPLANTATION
Table 7.4.2 Distribution of Number of Transplantation by Origin of Tissue Graft, 2004-2010
Origin of
Tissue Graft
2004 2005 2006 2007 2008 2009 2010 Total
No. % No. % No. % No. % No. % No. % No. % No. %
Local 17 100 15 68 31 89 34 94 22 96 15 94 6 100 140 90
Imported 0 0 3 14 2 6 0 0 0 0 0 0 0 0 5 3
Not Available 0 0 0 0 0 0 0 0 0 0 0 0 0 0 0 0
Missing 0 0 4 18 2 6 2 6 1 4 1 6 0 0 10 6
Total 17 100 22 100 35 100 36 100 23 100 16 100 6 100 155 100
*1 patient can undergo more than 1 transplant
Figure 7.4.2 Distribution of Number of Transplantation by Origin of Tissue Graft,
2004-2010

BONE AND TISSUE TRANSPLANTATION
Seventh Report of the
National Transplant Registry 2010
14
Table 7.4.3 Distribution of Number of Transplantation by Tissue Graft Types, 2004-2010
Tissue graft types 2004 2005 2006 2007 2008 2009 2010 Total
No. % No. % No. % No. % No. % No. % No. % No. %
Deep frozen tissues 9 53 15 68 5 14 5 14 3 13 1 6 4 66 42 27
Freeze dried (Lyophilised) 6 35 2 9 3 9 0 0 1 4 0 0 1 17 13 8
Others 2 12 3 14 26 74 31 86 19 83 15 94 1 17 97 63
Missing 0 0 2 9 1 3 0 0 0 0 0 0 0 0 3 2
Total 17 100 22 100 35 100 36 100 23 100 16 100 6 100 155 100
*1 patient can undergo more than 1 transplant
Figure 7.4.3 Distribution of Number of Transplantation by Tissue Graft Types, 2004-2010

Seventh Report of the
National Transplant Registry 2010
15
BONE AND TISSUE TRANSPLANTATION
Table 7.4.3(a) Distribution of Tissue Graft Types (breakdowns), 2004-2010 Tissue graft types
(breakdowns)
2004 2005 2006 2007 2008 2009 2010 Total
No. % No. % No. % No. % No. % No. % No. % No. %
Femur 3 11 3 6 0 0 0 0 2 8 0 0 1 7 9 4
Femoral head 2 7 12 26 5 11 7 18 2 8 3 17 1 7 32 15
Humerus 0 0 1 2 0 0 0 0 0 0 0 0 1 7 2 1
Tibia 1 4 1 2 1 2 0 0 0 0 0 0 0 0 3 1
Radius 2 7 5 11 0 0 0 0 0 0 0 0 1 7 8 4
Patella 1 4 1 2 2 4 0 0 0 0 0 0 0 0 4 2
Other tendon fascia
cartilage 0 0 1 2 0 0 1 3 0 0 0 0 0 0 2 1
Skin 0 0 0 0 0 0 0 0 1 4 0 0 0 0 1 0
Air-dried Amnion 1 4 1 2 0 0 0 0 1 4 0 0 0 0 3 1
Glycerolized Amnion 0 0 2 4 26 57 31 79 18 76 15 83 1 7 93 44
Glycerol Cryopreserved
Amnion 1 4 0 0 0 0 0 0 0 0 0 0 0 0 1 0
Cancellous 15 55 19 41 2 4 0 0 0 0 0 0 10 65 46 22
Cortical 0 0 0 0 6 13 0 0 0 0 0 0 0 0 6 3
Cortical_cancellous 1 4 1 2 0 0 0 0 0 0 0 0 0 0 2 1
Bone granule 0 0 0 0 1 2 0 0 0 0 0 0 0 0 1 0
Bone powder 0 0 0 0 3 7 0 0 0 0 0 0 0 0 3 1
Total 27 100 47 100 46 100 39 100 24 100 18 100 15 100 216 100
Table 7.4.4 Distribution of Graft Sterilization Types, 2004-2010 Graft sterilization
types
2004 2005 2006 2007 2008 2009 2010 Total
No. % No. % No. % No. % No. % No. % No. % No. %
Irradiation 16 94 15 68 30 86 27 75 19 83 10 63 6 100 123 79
Peracetic Acid-Ethanol 0 0 0 0 0 0 0 0 0 0 0 0 0 0 0 0
Ethylene Oxide 0 0 0 0 0 0 0 0 0 0 0 0 0 0 0 0
Others 0 0 0 0 1 3 0 0 0 0 0 0 0 0 1 1
Not Sterillized 0 0 0 0 0 0 0 0 0 0 0 0 0 0 0 0
Missing 1 6 7 32 4 11 9 25 4 17 6 37 0 0 31 20
Total 17 100 22 100 35 100 36 100 23 100 16 100 6 100 155 100
*1 patient can undergo more than 1 transplant
Table 7.4.5 Distribution of Mode of Transport Storage to Recipient Hospital during
Transportation, 2004-2010 Mode of transport
storage to recipient
hospital
2004 2005 2006 2007 2008 2009 2010 Total
No. % No. % No. % No. % No. % No. % No. % No. %
By flight and/or land
vehicle 1 6 2 8 2 6 3 8 1 4 1 6 2 33 12 8
By courier service 2 12 3 14 22 63 23 64 17 74 10 63 1 17 78 50
By hand directly from
bank 4 24 7 32 1 3 0 0 0 0 0 0 3 50 15 10
Dry ice box 5 29 3 14 0 0 0 0 0 0 0 0 0 0 8 5
Sterile package 0 0 0 0 2 6 0 0 0 0 0 0 0 0 2 1
Missing 5 29 7 32 8 22 10 28 5 22 5 31 0 0 40 26
Total 17 100 22 100 35 100 36 100 23 100 16 100 6 100 155 100
*1 patient can undergo more than 1 transplant

BONE AND TISSUE TRANSPLANTATION
Seventh Report of the
National Transplant Registry 2010
16
Table 7.4.6 Distribution of Temperature of Storage During Transportation, 2004-2010 Temperature of
storage during
transportation (ºC)
2004 2005 2006 2007 2008 2009 2010 Total
No. % No. % No. % No. % No. % No. % No. % No. %
-80 to -50 2 12 0 0 0 0 0 0 1 4 0 0 1 17 4 3
-49 to 0 6 35 10 45 2 6 2 6 1 4 0 0 3 49 24 15
Room temperature 3 18 4 18 27 77 22 61 17 74 11 69 1 17 85 55
Others 0 0 1 5 0 0 0 0 0 0 0 0 0 0 1 1
Missing 6 35 7 32 6 17 12 33 4 18 5 31 1 17 41 26
Total 17 100 22 100 35 100 36 100 23 100 16 100 6 100 155 100
*1 patient can undergo more than 1 transplant
Seventh Report of the
National Transplant Registry 2010
17
BONE AND TISSUE TRANSPLANTATION
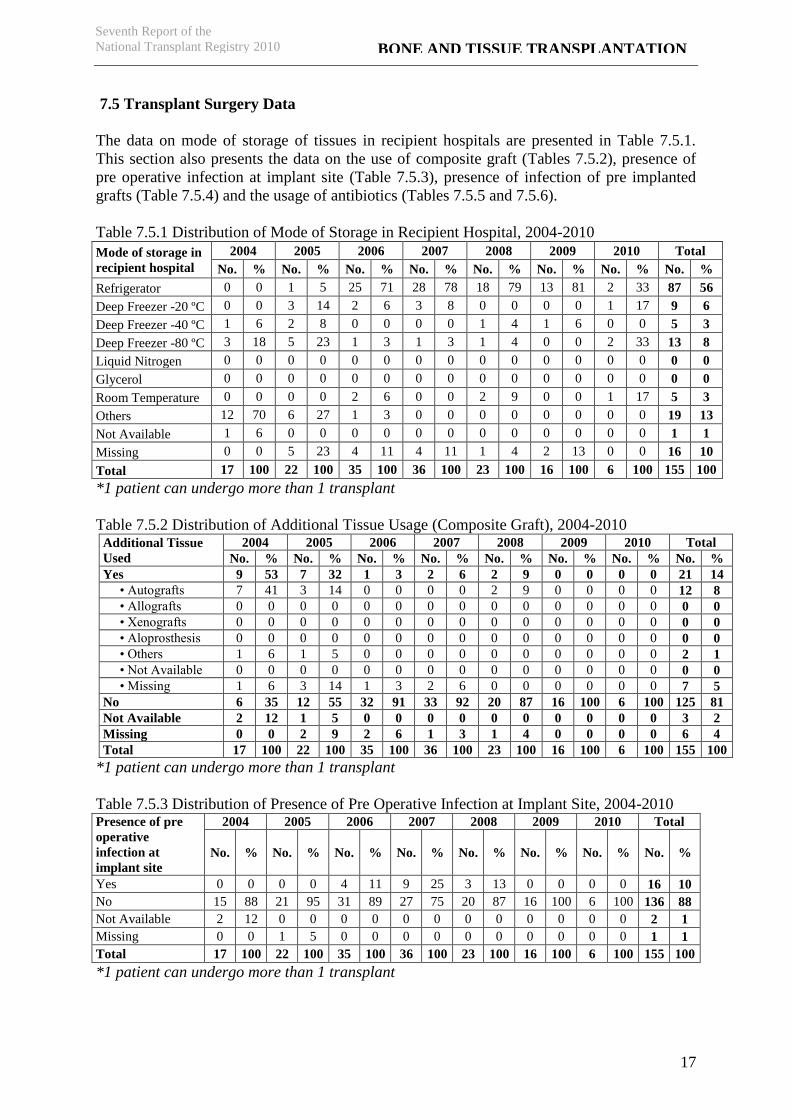
7.5 Transplant Surgery Data
The data on mode of storage of tissues in recipient hospitals are presented in Table 7.5.1.
This section also presents the data on the use of composite graft (Tables 7.5.2), presence of
pre operative infection at implant site (Table 7.5.3), presence of infection of pre implanted
grafts (Table 7.5.4) and the usage of antibiotics (Tables 7.5.5 and 7.5.6).
Table 7.5.1 Distribution of Mode of Storage in Recipient Hospital, 2004-2010
Mode of storage in
recipient hospital
2004 2005 2006 2007 2008 2009 2010 Total
No. % No. % No. % No. % No. % No. % No. % No. %
Refrigerator 0 0 1 5 25 71 28 78 18 79 13 81 2 33 87 56
Deep Freezer -20 ºC 0 0 3 14 2 6 3 8 0 0 0 0 1 17 9 6
Deep Freezer -40 ºC 1 6 2 8 0 0 0 0 1 4 1 6 0 0 5 3
Deep Freezer -80 ºC 3 18 5 23 1 3 1 3 1 4 0 0 2 33 13 8
Liquid Nitrogen 0 0 0 0 0 0 0 0 0 0 0 0 0 0 0 0
Glycerol 0 0 0 0 0 0 0 0 0 0 0 0 0 0 0 0
Room Temperature 0 0 0 0 2 6 0 0 2 9 0 0 1 17 5 3
Others 12 70 6 27 1 3 0 0 0 0 0 0 0 0 19 13
Not Available 1 6 0 0 0 0 0 0 0 0 0 0 0 0 1 1
Missing 0 0 5 23 4 11 4 11 1 4 2 13 0 0 16 10
Total 17 100 22 100 35 100 36 100 23 100 16 100 6 100 155 100
*1 patient can undergo more than 1 transplant
Table 7.5.2 Distribution of Additional Tissue Usage (Composite Graft), 2004-2010 Additional Tissue
Used
2004 2005 2006 2007 2008 2009 2010 Total
No. % No. % No. % No. % No. % No. % No. % No. %
Yes 9 53 7 32 1 3 2 6 2 9 0 0 0 0 21 14
• Autografts 7 41 3 14 0 0 0 0 2 9 0 0 0 0 12 8
• Allografts 0 0 0 0 0 0 0 0 0 0 0 0 0 0 0 0
• Xenografts 0 0 0 0 0 0 0 0 0 0 0 0 0 0 0 0
• Aloprosthesis 0 0 0 0 0 0 0 0 0 0 0 0 0 0 0 0
• Others 1 6 1 5 0 0 0 0 0 0 0 0 0 0 2 1
• Not Available 0 0 0 0 0 0 0 0 0 0 0 0 0 0 0 0
• Missing 1 6 3 14 1 3 2 6 0 0 0 0 0 0 7 5
No 6 35 12 55 32 91 33 92 20 87 16 100 6 100 125 81
Not Available 2 12 1 5 0 0 0 0 0 0 0 0 0 0 3 2
Missing 0 0 2 9 2 6 1 3 1 4 0 0 0 0 6 4
Total 17 100 22 100 35 100 36 100 23 100 16 100 6 100 155 100
*1 patient can undergo more than 1 transplant
Table 7.5.3 Distribution of Presence of Pre Operative Infection at Implant Site, 2004-2010 Presence of pre
operative
infection at
implant site
2004 2005 2006 2007 2008 2009 2010 Total
No. % No. % No. % No. % No. % No. % No. % No. %
Yes 0 0 0 0 4 11 9 25 3 13 0 0 0 0 16 10
No 15 88 21 95 31 89 27 75 20 87 16 100 6 100 136 88
Not Available 2 12 0 0 0 0 0 0 0 0 0 0 0 0 2 1
Missing 0 0 1 5 0 0 0 0 0 0 0 0 0 0 1 1
Total 17 100 22 100 35 100 36 100 23 100 16 100 6 100 155 100
*1 patient can undergo more than 1 transplant
BONE AND TISSUE TRANSPLANTATION
Seventh Report of the
National Transplant Registry 2010
18
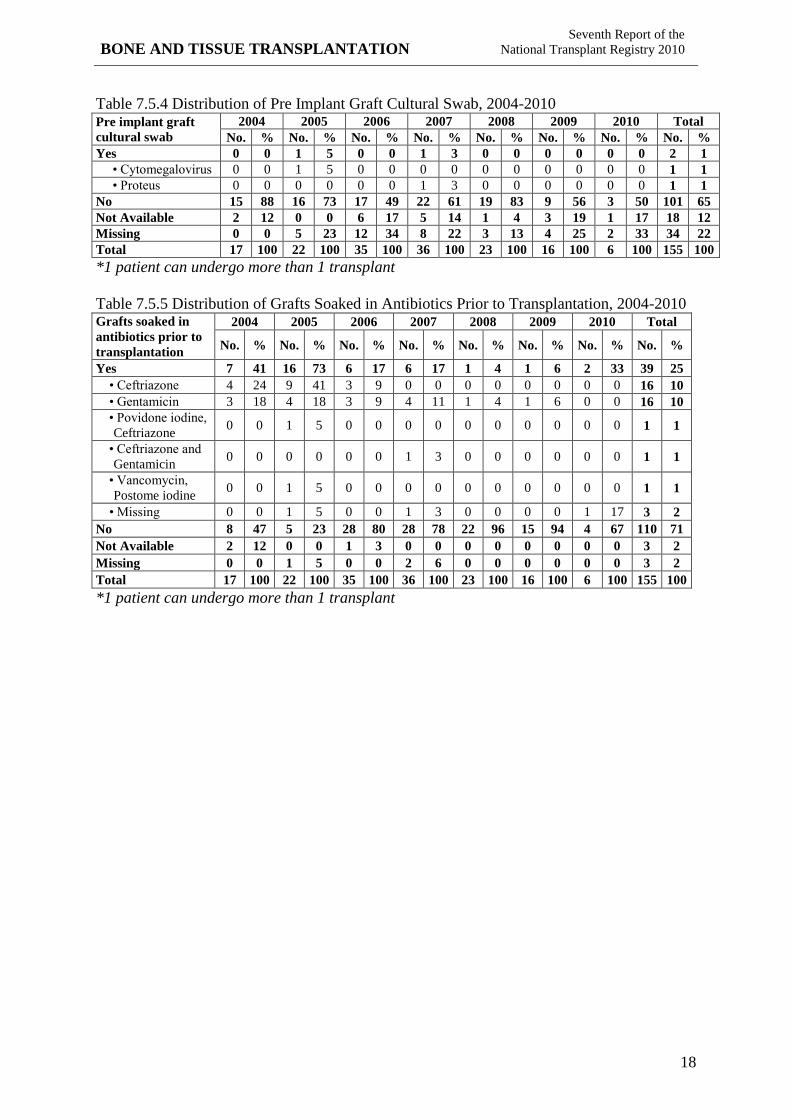
Table 7.5.4 Distribution of Pre Implant Graft Cultural Swab, 2004-2010 Pre implant graft
cultural swab
2004 2005 2006 2007 2008 2009 2010 Total
No. % No. % No. % No. % No. % No. % No. % No. %
Yes 0 0 1 5 0 0 1 3 0 0 0 0 0 0 2 1
• Cytomegalovirus 0 0 1 5 0 0 0 0 0 0 0 0 0 0 1 1
• Proteus 0 0 0 0 0 0 1 3 0 0 0 0 0 0 1 1
No 15 88 16 73 17 49 22 61 19 83 9 56 3 50 101 65
Not Available 2 12 0 0 6 17 5 14 1 4 3 19 1 17 18 12
Missing 0 0 5 23 12 34 8 22 3 13 4 25 2 33 34 22
Total 17 100 22 100 35 100 36 100 23 100 16 100 6 100 155 100
*1 patient can undergo more than 1 transplant
Table 7.5.5 Distribution of Grafts Soaked in Antibiotics Prior to Transplantation, 2004-2010 Grafts soaked in
antibiotics prior to
transplantation
2004 2005 2006 2007 2008 2009 2010 Total
No. % No. % No. % No. % No. % No. % No. % No. %
Yes 7 41 16 73 6 17 6 17 1 4 1 6 2 33 39 25
• Ceftriazone 4 24 9 41 3 9 0 0 0 0 0 0 0 0 16 10
• Gentamicin 3 18 4 18 3 9 4 11 1 4 1 6 0 0 16 10
• Povidone iodine,
Ceftriazone 0 0 1 5 0 0 0 0 0 0 0 0 0 0 1 1
• Ceftriazone and
Gentamicin 0 0 0 0 0 0 1 3 0 0 0 0 0 0 1 1
• Vancomycin,
Postome iodine 0 0 1 5 0 0 0 0 0 0 0 0 0 0 1 1
• Missing 0 0 1 5 0 0 1 3 0 0 0 0 1 17 3 2
No 8 47 5 23 28 80 28 78 22 96 15 94 4 67 110 71
Not Available 2 12 0 0 1 3 0 0 0 0 0 0 0 0 3 2
Missing 0 0 1 5 0 0 2 6 0 0 0 0 0 0 3 2
Total 17 100 22 100 35 100 36 100 23 100 16 100 6 100 155 100
*1 patient can undergo more than 1 transplant

Seventh Report of the
National Transplant Registry 2010
19
BONE AND TISSUE TRANSPLANTATION
Table 7.5.6 Distribution of Number of Transplant by Systemic Antibiotics Given Prior to
Transplantation, 2004-2010 Systemic antibiotics
given prioir to
transplantation
2004 2005 2006 2007 2008 2009 2010 Total
No. % No. % No. % No. % No. % No. % No. % No. %
Yes 12 71 17 77 9 26 10 28 4 17 2 13 4 67 58 37
• Cefeperazone 2 12 2 9 0 0 0 0 1 4 0 0 0 0 5 3
• Ceftriazone/
Imipenam 2 12 2 9 3 9 3 8 0 0 0 0 0 0 10 6
• Cefuroxine 7 41 7 32 4 11 2 6 1 4 0 0 0 0 21 14
• Ciproflaxacin 0 0 2 9 0 0 2 6 1 4 1 6 0 0 6 4
• Chloramphenicol 0 0 0 0 1 3 0 0 0 0 0 0 0 0 1 1
• Gentamicin 0 0 0 0 0 0 0 0 1 4 0 0 0 0 1 1
• Metronidazole 1 6 1 5 0 0 0 0 0 0 0 0 0 0 2 1
• Ceftazidime 0 0 0 0 1 3 0 0 0 0 0 0 0 0 1 1
• T. Augmentin 0 0 0 0 0 0 1 3 0 0 0 0 0 0 1 1
• T.Flurariazole 0 0 0 0 0 0 2 6 0 0 0 0 0 0 2 1
• Ampicillin /
Sulbactam 0 0 2 9 0 0 0 0 0 0 0 0 0 0 2 1
• Vancomycin 0 0 0 0 0 0 0 0 0 0 1 6 0 0 1 1
• Missing 0 0 1 5 0 0 0 0 0 0 0 0 0 0 1 1
No 4 24 3 14 26 74 26 72 18 78 14 88 2 33 93 60
Not Available 1 6 0 0 0 0 0 0 0 0 0 0 0 0 1 1
Missing 0 0 2 9 0 0 0 0 1 4 0 0 0 0 3 2
Total 17 100 22 100 35 100 36 100 23 100 16 100 6 100 155 100
*1 patient can undergo more than 1 transplant


![6. Tissue Engineering [호환 모드]monet.yonsei.ac.kr/mediawiki/images/5/56/Ch._5.pdf · Tissue Engineering Bone Marrow Transplantation (BMT) 1 Red bone marrow is the site of all](https://img.pdfslide.us/doc/110x75/5ec174dcf7cde622c528f9b9/6-tissue-engineering-eeoemonet-tissue-engineering-bone-marrow-transplantation.jpg)