Embed Size (px)
Citation preview
CHAPTER 7
BEHAVIOUR OF THE COMBINED EFFECT OF ROOFING
ELEMENTS
7.1 GENERAL
An analytical study on behaviour of combined effect of optimised channel sections using
ANSYS was carried out and discussed in this chapter. The ANSYS is a powerful multi
purpose program that can be used in a wide variety of industries and in all disciplines of
engineering. ANSYS is a sophisticated and comprehensive finite element program that
has capabilities in many different physics fields such as static structural, nonlinear,
thermal, implicit and explicit dynamics, fluid flow, electromagnetic, and electric field
analysis.
7.2 PROBLEM DEFINITION
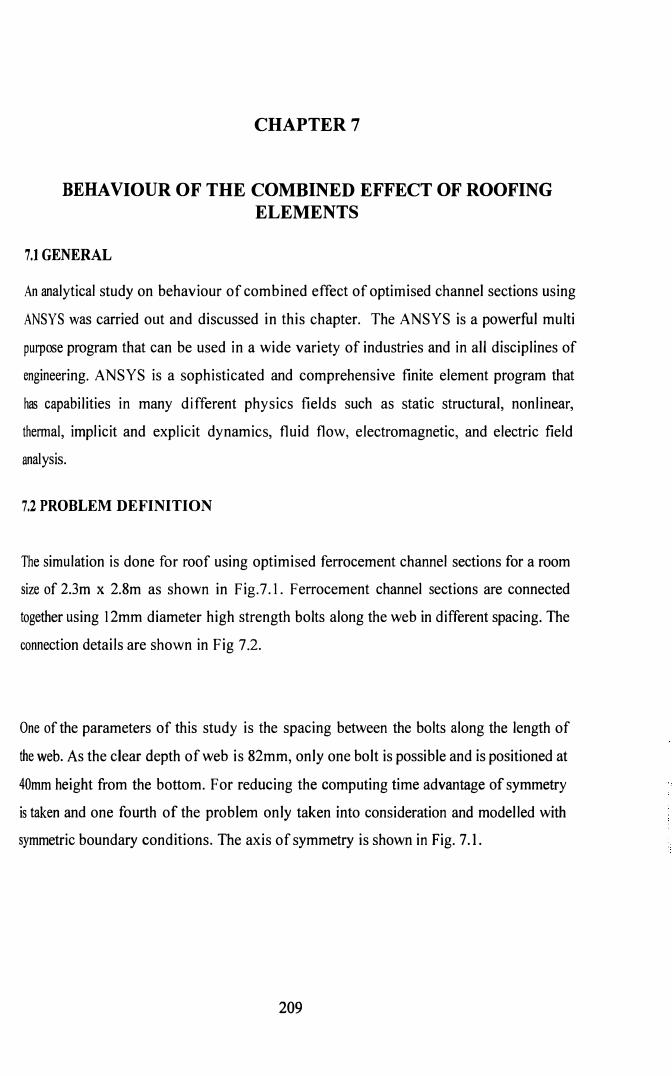
The simulation is done for roof using optimised ferrocement channel sections for a room
size of 2.3m x 2.8m as shown in Fig.7.1. Ferrocement channel sections are connected
together using 12mm diameter high strength bolts along the web in different spacing. The
connection details are shown in Fig 7.2.
One of the parameters of this study is the spacing between the bolts along the length of
the web. As the clear depth of web is 82mm, only one bolt is possible and is positioned at
40mm height from the bottom. For reducing the computing time advantage of symmetry
is taken and one fourth of the problem only taken into consideration and modelled with
symmetric boundary conditions. The axis of symmetry is shown in Fig. 7. I.
209
x
y
::>300 M X 2800 ~M
200
320011UllX
y
I" 2700null
JO~ T' ill
All c1imensions in mm
Fig. 7.1 Plan of a room roof with ferrocement Channel elements
500mm
40mm riH-(All dimensions in mm )
Fig. 7.2 Connection details
210
7.3 DETAILS OF ANALYSIS
The analysis of structure performed in AN SYS 10 was done in following 3 stages,
1. Pre processing
11. Solution
111. Post Processing
7.3.1 PRE PROCESSING
The key points defining the section were first created in the space and area was patched on it.
These areas are meshed and are extruded along the required direction to get the volume. Two
types of elements have been used for modelling the section. Shell 93 for creating area mesh
and 30 20 node brick element (solid95) to create volume meshing.
7.3.1.1 Element Input
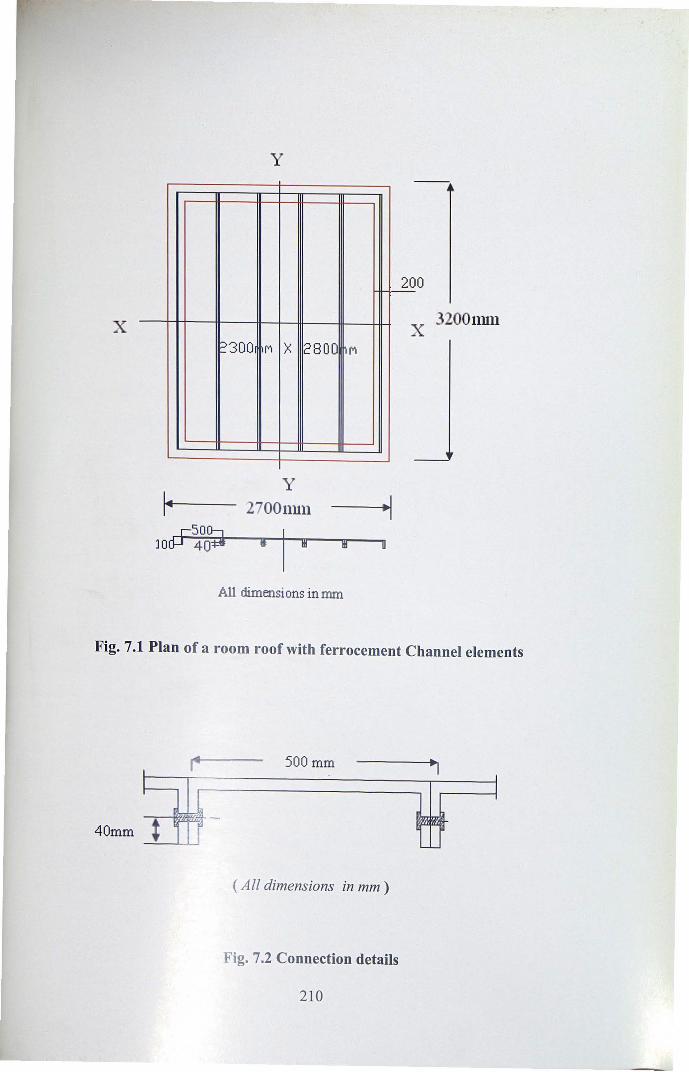
Brick elements, SOLID 95 were used in the three dimensional modelling of channel and bolts.
The element is defined by 20 nodes each having three degrees of freedom per node,
translations in the nodal x, y, and z directions. The element may have any spatial orientation. It
can tolerate irregular shapes without as much loss of accuracy. SOLID95 elements have
compatible displacement shapes and are well suited to model curved boundaries. The
geometry, node locations, and the coordinate system for this element are shown in Fig. 7.3.
The contact surfaces including the areas anticipated to be contact were defined and paired
using CONTA174 and TARGEl70. It has the same geometric characteristics as the solid
element face with which it is connected. CONT A 174 is used to represent contact and sliding
between 3-D "target" surfaces and a deformable surface, defined by this element. This eleml.!nt
is located on the surfaces of 3-D solid elements with mid side nodes. It has the same geometric
characteristics as the solid element face with which it is connected
211
~M'N'O'P'U'V'W'X
Y A.SZ
- - KlSI ~~T R"
Q J
TetrahedralOplial
M,N,a,p.U,vW,XI A
Y • ZT • - - K.-r L
RQ J
Pyramid Oplial
M~Xa.p.wy U N AS
• ZI - T K,L,S
Q RJ
Prism Oplioo
Fig. 7.3 3D 20 Node Brick Element SOLID 95
Contact occurs when the element surface penetrates one of the target segment elements
on a specified target surface. The element is defmed by eight nodes (the underlying solid
element has mid side nodes). The CONTAl74 element is shown in Fig.7.4. TARGE170
is used to represent various 3-D "target" surfaces for the associated contact elements.
Associa ed Target Surfaces
Fig. 7.4 Contact Element-CONTA 174
The contact elements themselves overlay the solid elements describing the boundary of a
deformable body and are potentially in contact with the target surface, defined by
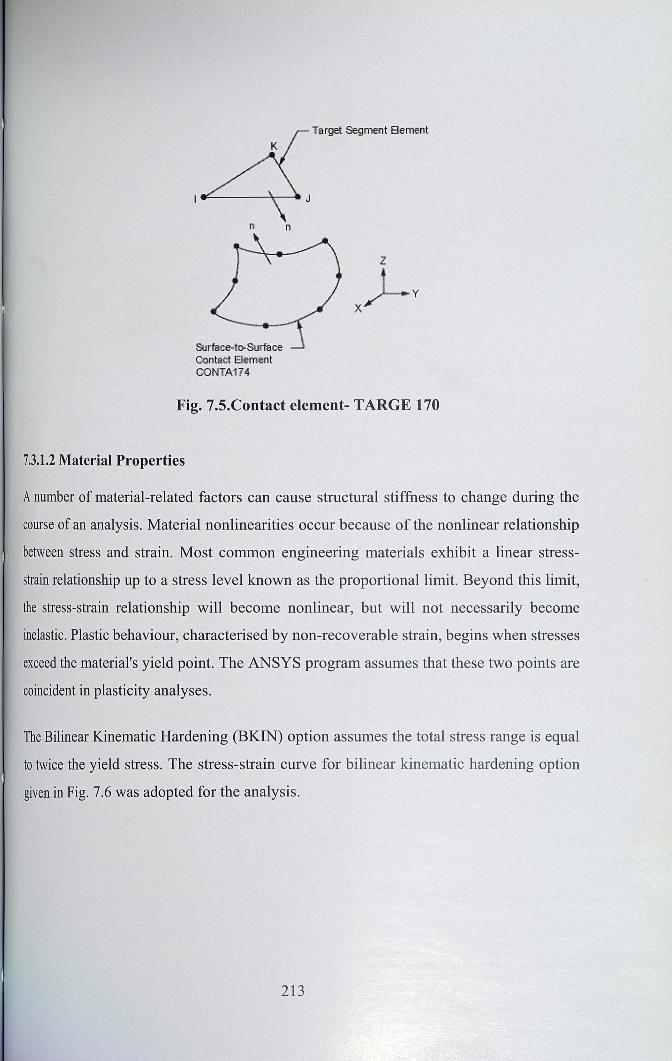
TARGEl70. The geometry ofTARGE170 is shown in Fig. 7.5.
212
Target segment Element
n n
z
,LvX
SUrfaee-to-SlJrfaceOontact ElementCONTA174
Fig. 7.S.Contact element- TARGE 170
7.3.1.2 Material Properties
Anumber of material-related factors can cause structural stiffness to change during the
course of an analysis. Material nonlinearities occur because of the nonlinear relationship
between stress and strain. Most common engineering materials exhibit a linear stress
strain relationship up to a stress level known as the proportional limit. Beyond this limit,
the stress-strain relationship will become nonlinear, but will not necessarily become
inelastic. Plastic behaviour, characterised by non-recoverable strain, begins when stresses
exceed the material's yield point. The ANSYS program assumes that these two points are
coincident in plasticity analyses.
The Bilinear Kinematic Hardening (BKIN) option assumes the total stress range is equal
to twice the yield stress. The stress-strain curve for bilinear kinematic hardening option
given in Fig. 7.6 was adopted for the analysis.
213

T---f'-------,f-----tr- Sh"llin fi
Fig. 7.6. Bilinear kinematic stress-strain curve
For ferrocement the yield stress was taken as 2.7 N/mm2 and tangent modulus as 116
N/mm2• For the high strength bolts yield stress of 640 N/mm2
, ultimate stress of 800
N/mm2, and 12% elongation were adopted as per IS 1367 (Part 3), (2002). The modulus
of elasticity of steel was taken as 2x 10⁵ N/mm2 (IS 456, 2000) and for ferrocement is
32420 N/mm2•
7.3.1.3 Boundary conditions
Boundary condition was defined by arresting displacement in X, Y & Z directions. On the
axis symmetry sides symmetric boundary conditions were applied (Faella et a1. 1998).
7.3.1.4 Load Application
Load was defined as area pressure of intensity 2.5kN/mm2• Load is applied in 7 load
steps. A load step is a set of loads applied over a given time span. Sub steps are time
points within a load step at which intermediate solutions are calculated. The difference in
time between two successive sub steps can be called a time step or time increment. In a
nonlinear static or steady-state analysis, sub steps are used to apply the loads gradually so
that an accurate solution can be obtained.
7.3.2 SOLUTION
Here we define the analysis type, load step, time etc. the stored data was subjected to
static analysis which forms the processing stage. Each load step is processed and
214
convergence was checked. The sparse direct solver is the default solver for all analyses.
The sparse direct solver is based on a direct elimination of equations.
7.3.3 POST PROCESSING
Post processor is the section where the results of analysis through graphic displays and
tabular listing were reviewed. Two postprocessors are available for reviewing the results,
POST1, the general post processor, and POST26, the time-history postprocessor. Post
processing results includes deformed shape, contour plots for displacements and stresses
etc.
7.4 STEPS INVOLVED
The various steps for finite element modelling and analysis are as follows. The detailed
input data is shown in Appendix B.
};,, Invoking ANSYSlO
};,, Pre processor
• Element data
• Material data
• Geometry creation
• Contact manager
• Loads
};,, Solution
};,, General post process
7.5 MODELLING OF SECTIONS
The following phases of work have been carried out to study the behaviour of single
element and the combined effect of number of individual elements (Faella et al. 1998).
1. Modelling of single optimised channel section
2. Simply placing all the channel elements in position without bolt connection for a
room size of 2.3m X 2.8m.
3. Four models were created by varying the number of bolts from 4 to 10 with an
increment of 2.
215
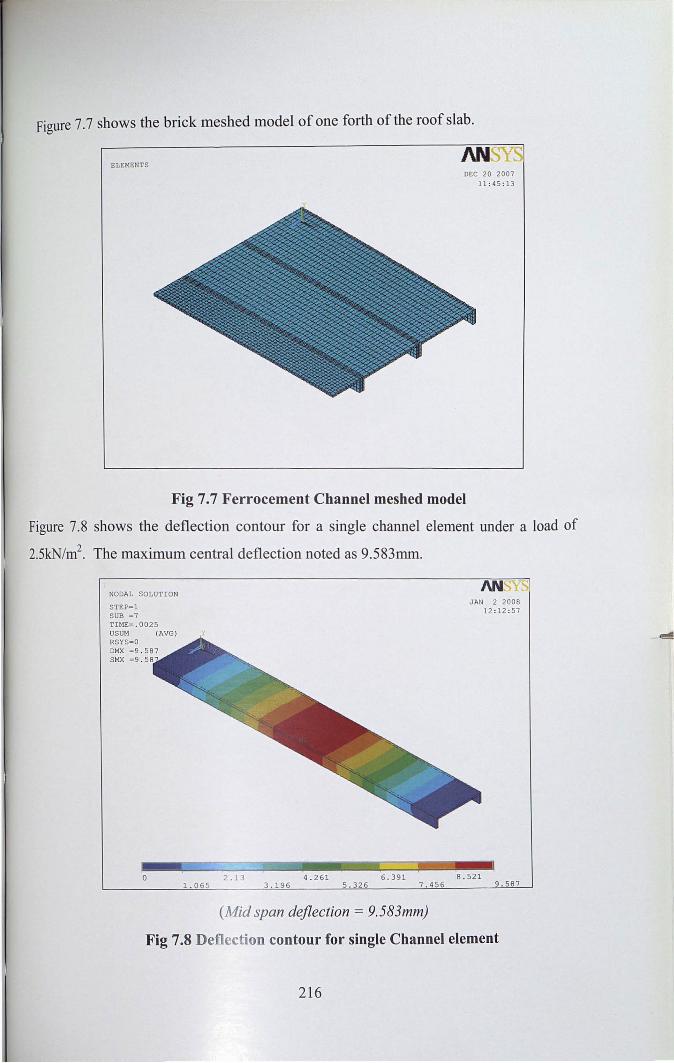
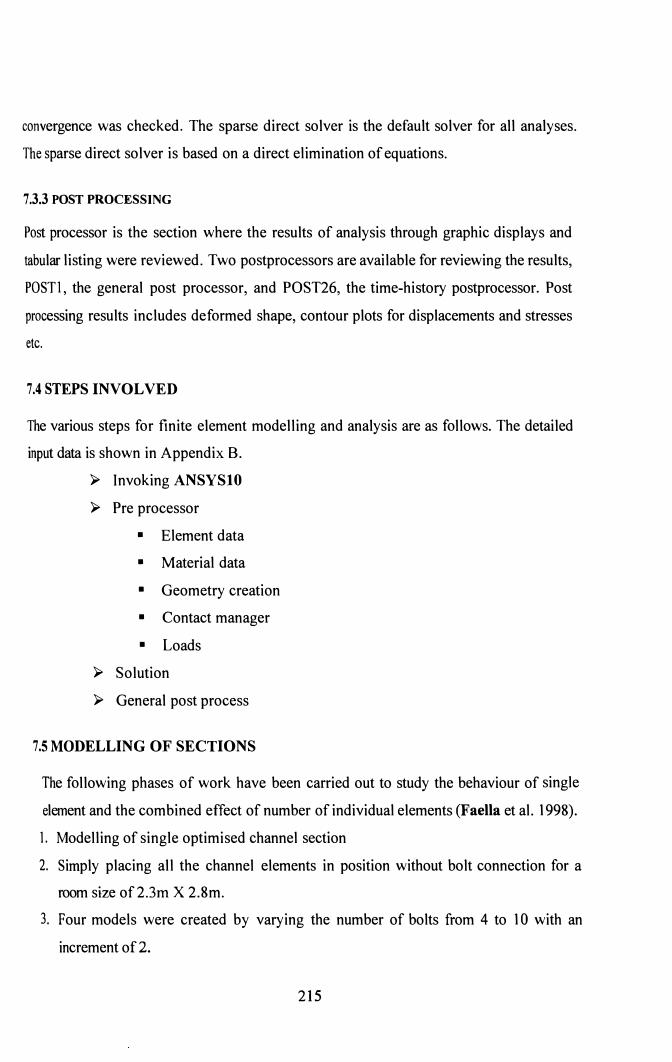
Figure 7.7 shows the brick meshed model of one forth of the roof slab.
J\NSYSELEMENTS
DEC 20 20071l,45,13
Fig 7.7 Ferrocement Channel meshed model
Figure 7.8 shows the deflection contour for a single channel element under a load of
2.5kN/m2. The maximum central deflection noted as 9.583mrn.
NODAL SOLUTION
STEP-1SUB -7TIME=.0025USUM (AVG)RSYS-ODMX -9.587SMX -9.58
ANJAN 2 2008
12,12,57
o 2.13 4.261 6.391 8.5211.065 3.196 5.326 7.456 9.587
(Mid span deflection = 9.583mm)
Fig 7.8 Detlection contour for single Channel element
216
7.6 DEFLECTION CONTOURS OF THE COMBINED EFFECT OF OPTIMISED
SECTION
Deflection contours for channel shaped sections subjected to a loading of 2.5 kN/m2
intensity, are shown in Fig. 7.9 to Fig. 7.13.
NODAL SOLUTION
STEP=lSUB =7TIME:.0025USUM IAVGIRSYS=QDMX =9.579SMX =9.579
J\NSYSDEC 18 2007
15:28:18
1.0642.129
3.1934.257
5.3226.386
7.458.515
9.579
(Mid span deflection = 9.579mm)
Fig. 7.9 Deflection contour of slab without bolt
NODAL SOLUTION
STEP-lSUB =7TIME-.0025USUM (AVGIRSYS-ODMX -8.214SMX -8.214
J\Nr V
DEC 31 200715: 10: 30
o 1.825 3.651 5.476 7.301.912682 2.738 4.563 6.389 8.214
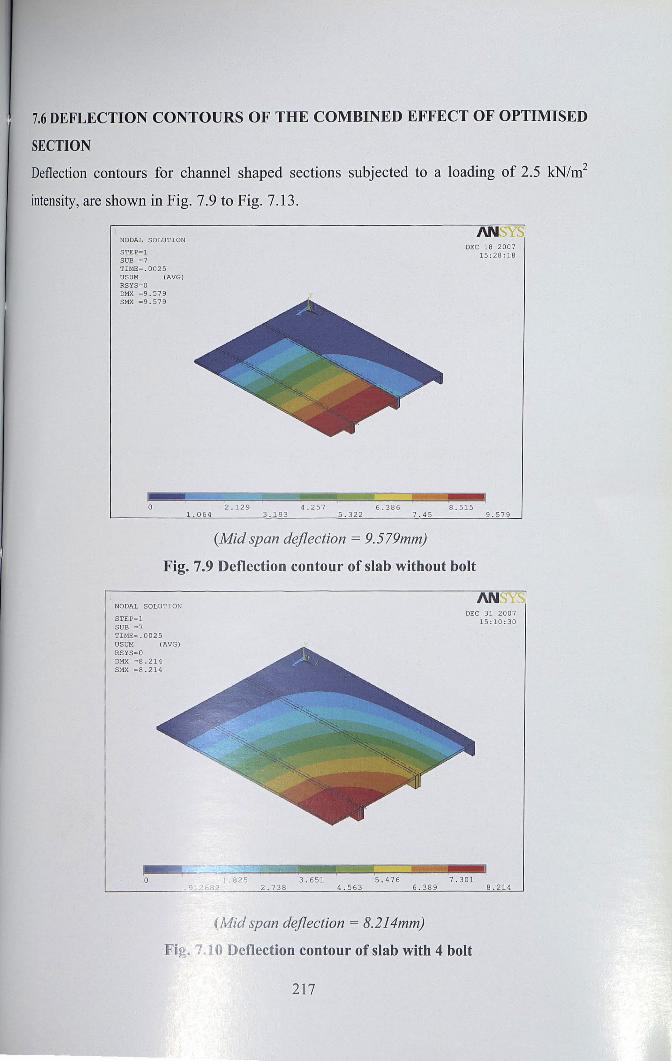
(Mid span deflection = 8.214mm)
Fig. 7.10 Deflection contour of slab with 4 bolt
217
NODAL SOLUTION
STEP~1
SUB =7TIME~.0025
USUMTOPRSYS=ODMX -6.839SMX ~6. 839
o 1. 52.759908 2.28
3.043.8
ANSYSDEC 18 2007
12:06:00
4.559 6.0795.319 6.839
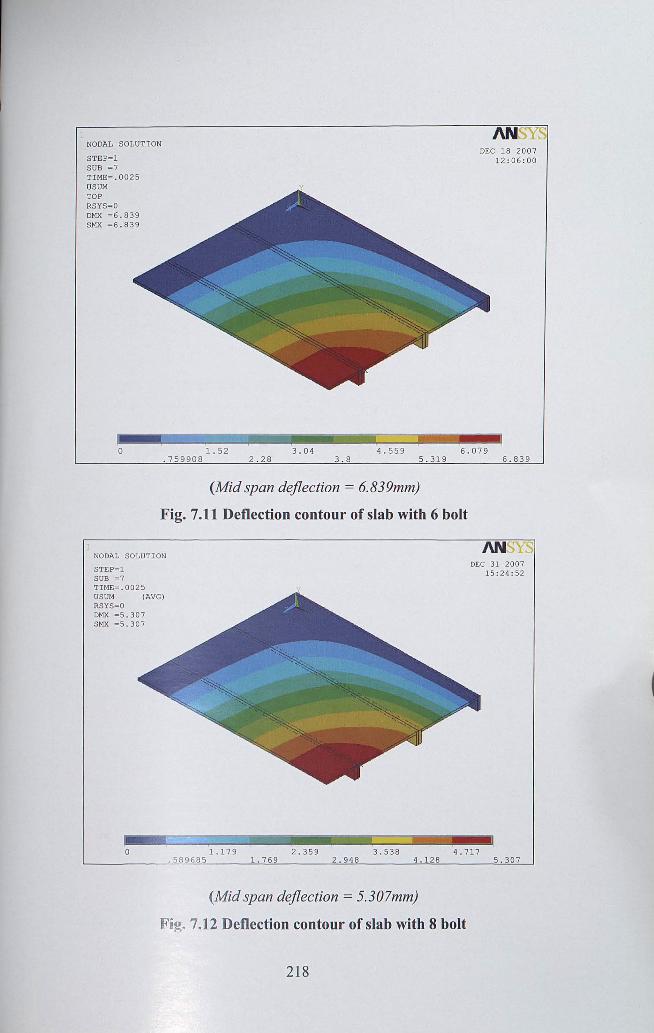
(Mid span deflection = 6.839mm)
Fig. 7.11 Deflection contour of slab with 6 bolt
NODAL SOLUTION
STEP~1
SUB ~7
TIME=.0025USUM (AVG)RSYS=ODMX -5.307SMX ~5.307
J\NSYSDEC 31 2007
15:24:52
o 1.179 2.359 3.538 4.717.589685 1.769 2.948 4.128 5.307
(Mid span deflection = 5.307mm)
Fig. 7.12 Deflection contour of slab with 8 bolt
218
NODAL SOLUTION
STEP=lSUB -7TIME-.0025USUM (AVG)RSYS-ODMX -4.692SMX -4.692
J\NSYSJAN 2 2008
16:20:35
o 1.043 2.085 3.128 4.171.52137 1.564 2.607 3.65 4.692
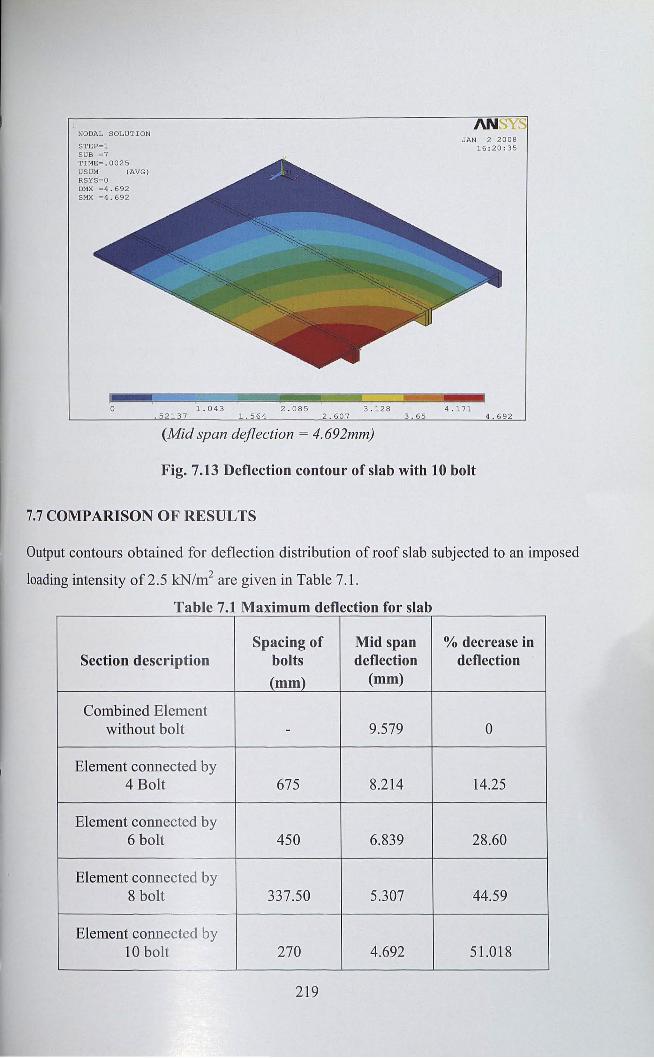
(Mid span deflection = 4.692mm)
Fig. 7.13 Deflection contour of slab with 10 bolt
7.7 COMPARISON OF RESULTS
Output contours obtained for deflection distribution of roof slab subjected to an imposed
loading intensity of 2.5 kN/m2 are given in Table 7.1.
Table 7.1 Maximum deflection for slab
Spacing of Mid span % decrease inSection description bolts deflection deflection
(mm) (mm)
Combined Elementwithout bolt - 9.579 0
Element connected by4 Bolt 675 8.214 14.25
Element connected by6 bolt 450 6.839 28.60
Element connected by8 bolt 337.50 5.307 44.59
Element connected by10 bolt 270 4.692 51.018
219
From Table 7 .1 it may be noted that mid span deflection decreases with increase in
rigidity of the structure due the bolts. This may be due to the combined effect of
individual channels as a single unit.
7.8 SUMMARY AND CONCLUSIONS
The combined effect of ferrocement channel roofing elements with and without bolted
connections along the web of the element was analysed using AN SYS 10. The roofing
elements without bolted connection behaved as single elements and suffered maximum
deflection, on the other hand elements with bolted connection behaved like a single unit
and the maximum deflection for this case was found to be less than the system without
bolt. However the analysis indicate that the optimum number of bolts required for
connecting the channels side by side was found to be 4 bolts with respect to the
maximum allowable deflection criteria as per IS 456, 2000 is (L/250).
220