Embed Size (px)
DESCRIPTION
Chapter 7. Fundamental Analysis. Fundamental Analysis vs. Technical Analysis. Fundamental => Based on economic factors Micro & Macro Technical => Based on mechanical processes Charting most common. Three Steps of Top-Down Fundamental Analysis. - PowerPoint PPT Presentation
Citation preview
Chapter 7
Fundamental Analysis
Fundamental Analysis vs. Technical Analysis
• Fundamental => Based on economic factors– Micro & Macro
• Technical => Based on mechanical processes– Charting most common
Three Steps of Top-DownFundamental Analysis
• Macroeconomic analysis: evaluates current economic environment and its effect on industry and company fundamentals
• Industry analysis: evaluates outlook for particular industries
• Company analysis: evaluates company’s strengths and weaknesses within industry
Business Cycles
• Four phases – Expansion– Peak– Contraction– Trough
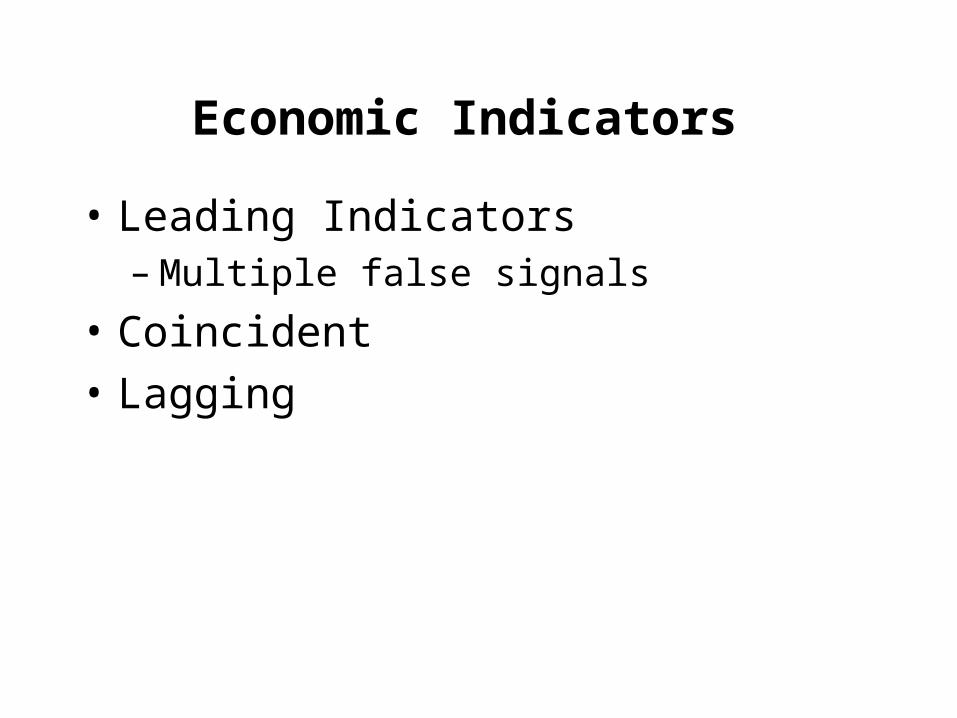
Economic Indicators
• Leading Indicators– Multiple false signals
• Coincident
• Lagging
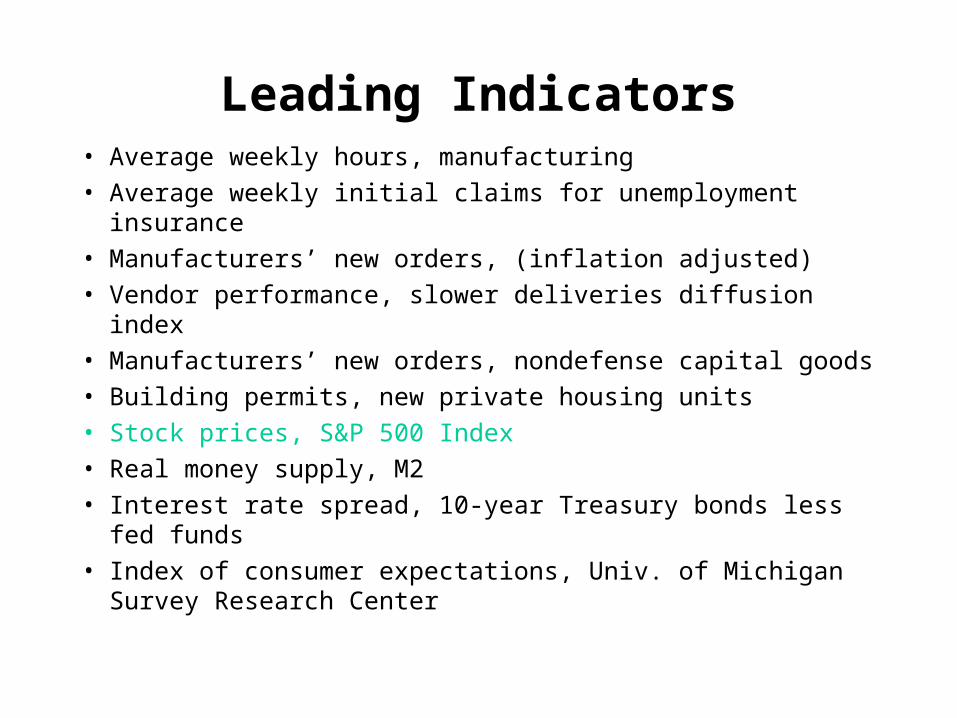
Leading Indicators• Average weekly hours, manufacturing
• Average weekly initial claims for unemployment insurance
• Manufacturers’ new orders, (inflation adjusted)
• Vendor performance, slower deliveries diffusion index
• Manufacturers’ new orders, nondefense capital goods
• Building permits, new private housing units
• Stock prices, S&P 500 Index
• Real money supply, M2
• Interest rate spread, 10-year Treasury bonds less fed funds
• Index of consumer expectations, Univ. of Michigan Survey Research Center
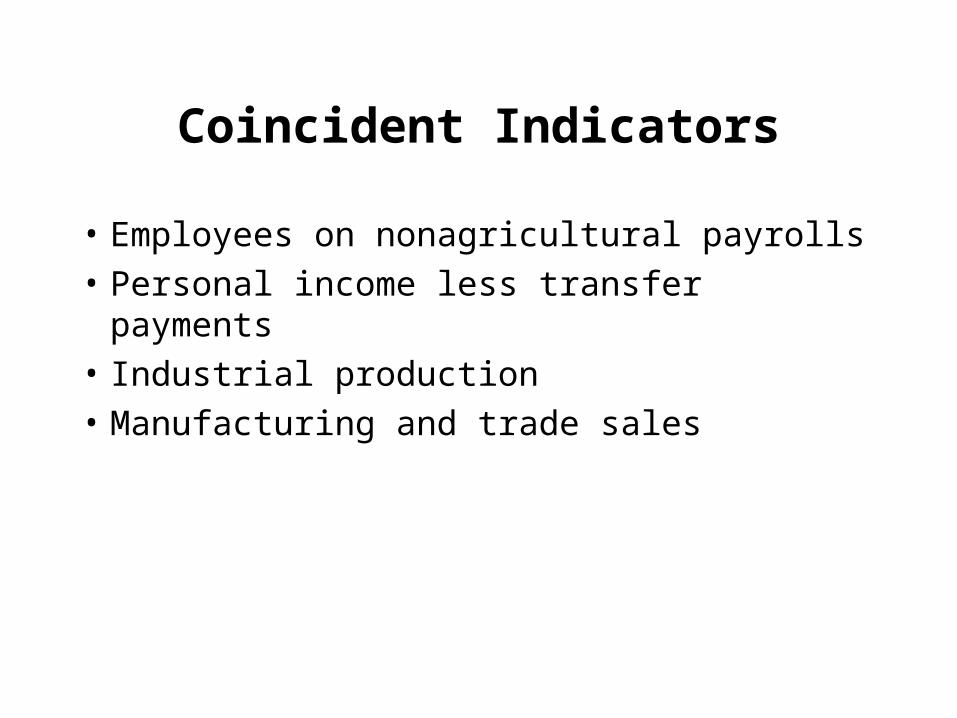
Coincident Indicators
• Employees on nonagricultural payrolls
• Personal income less transfer payments
• Industrial production
• Manufacturing and trade sales
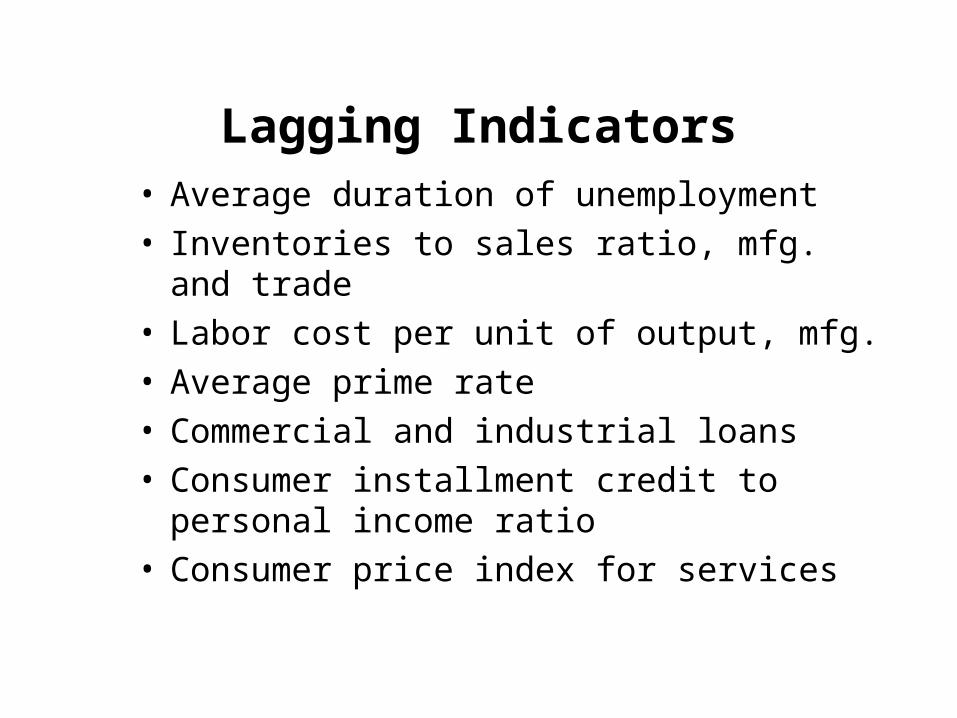
Lagging Indicators• Average duration of unemployment• Inventories to sales ratio, mfg. and trade• Labor cost per unit of output, mfg.• Average prime rate• Commercial and industrial loans• Consumer installment credit to personal
income ratio• Consumer price index for services
Gross Domestic Product (GDP)
• Sum of market values of all final goods and services produced annually in economy of a country
Three Tools of Fiscal Policy
• Adjustment of government’s revenues and expenditures to control economy
• Changes in tax code
• Management of maturity of government’s outstanding debt– referred to as debt management policy
How Fiscal Policy Operates through Government Spending and Taxes
• Increased government spending or decreased tax collections stimulate economy through extra spending by consumers
• Decreased government spending or increased tax collections restrain the economy through reduced spending by consumers
Leakages
• Money absorbed by savings, import purchases, or taxes during each round of stimulatory spending or tax reduction
• Reduces the impact of fiscal policy
Federal Reserve Board (Fed)
• Governing body of Federal Reserve System
• Composed of seven members appointed by President for long and staggered terms
Monetary Policy
• Government policy that utilizes money supply to affect the economy
• Implemented by Fed through control of required reserves and open market operations
Fed’s Principal Policy Tools• Reserve requirement: Increasing (decreasing)
required percentage reduces (raises) amount of money supported by given reserve base.
• Open market operations: Fed purchases (sales) of government securities increase (decrease) bank deposits available to support money supply.
• Discount loans: Increasing (decreasing) discount rate makes banks less (more) willing to borrow funds from Fed to lend to customers
Money Supply
• M1: Sum of all coin, currency (outside bank holdings), and deposits on which check-like instruments may be written– Most common definition.
• M2: M1 plus savings and small time deposits, repurchase agreements, and money market deposit accounts
Reserve Requirement
• Percentage of reserves Fed requires each bank to have on deposit for each increment of demand or time deposits
Open Market Operations
• Federal Reserve transactions (buying and selling) in government bond market intended to influence money supply, interest rates, and economic activity
Discount Rate vs. Fed Funds Rate
Discount rateinterest rate charged by Federal Reserve System on loans to member banks
Federal funds rate interest rate charged between banks in federal funds market
Banks will gravitate toward whichever is cheaper, although don’t like scrutiny of the Fed that comes with its loans
Reserve Requirements
• Required reserves
• Actual reserves
• Excess reserves = Actual – Required
• Increases in reserve requirements may cause undue harm to banking industry
Economic Effect of Deposits and Loans
• Increase in deposits and loans: – Stimulates spending and income– Can increase inflation
• Decrease in deposits and loans: – Restrains spending and income– Can reduce inflation
Greater Stimulation
• More likely if… – Unemployment is far above target– Inflation rate is near its target– Unemployment is increasing– Inflation decreasing– Dollar strong– Trade deficit large– Substantial amounts of capital flowing into U.S.
Greater Restrictiveness
• More likely if… – Unemployment near target– Inflation rate far above target– Unemployment is decreasing– Inflation is increasing– Dollar weak– Trade deficit small or trade surplus– Foreign capital threatening to withdraw from or slow
flow into the U.S.
How MP’s Impact on Interest Rates Affects the Stock Market
• Interest rates affect rate at which stocks’ expected future income streams are discounted.
• As bonds’ yields to maturity change, some investors may switch from stocks to bonds when rates rise and from bonds to stocks when rates fall.
• Interest rates affect borrowing costs for margin investors.
Goals of Monetary & Fiscal Policy
• Price Stability– Inflation– Disinflation– Deflation– Stagflation
• Full Employment
Price Stability
• Absence or low level of inflation or deflation– Prices of specific goods would still fluctuate in
response to market forces (supply and demand changes), but overall level of prices stable
Full Employment
• Unemployment rate thought to be minimum level before inflationary pressures accelerate
• Economists generally consider optimal because a certain percentage of workforce is likely to be looking for better jobs at any point in time
• Opinions on level have varied over time from about 4 percent to 6 percent.
Unemployment Rate
• Percentage of workforce actually out of work and actively seeking employment
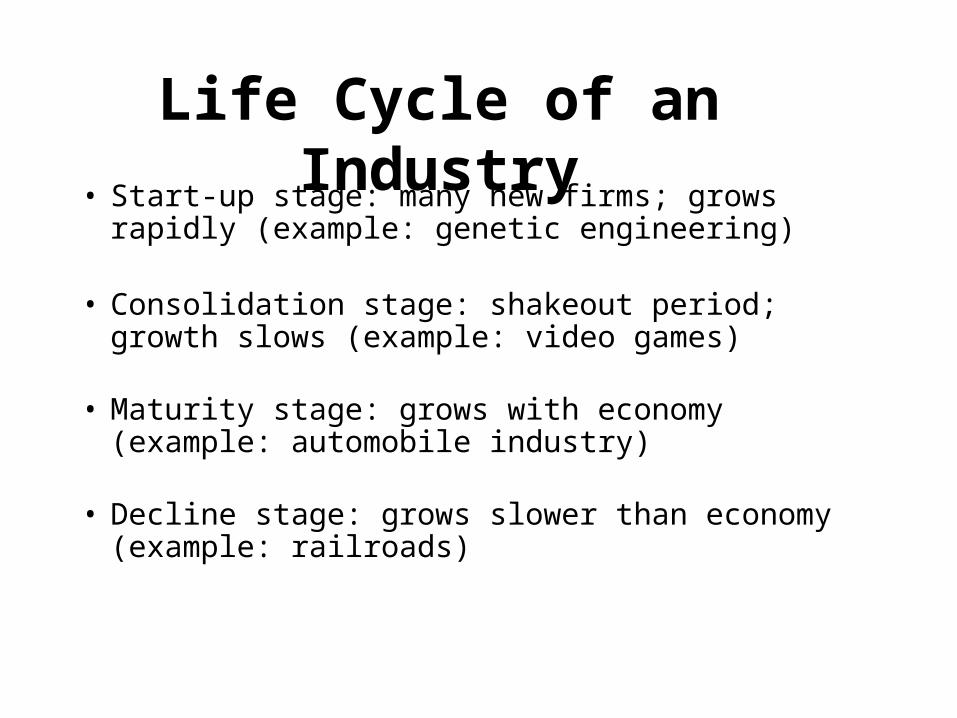
Life Cycle of an Industry• Start-up stage: many new firms; grows rapidly (example:
genetic engineering)
• Consolidation stage: shakeout period; growth slows (example: video games)
• Maturity stage: grows with economy (example: automobile industry)
• Decline stage: grows slower than economy (example: railroads)
Cyclical Industry
• Industry in which sales tend to move with the business cycle
• Consumer durables are a classic example
Non-Cyclical Industry
• Industry that involves a product people purchase regardless of the level of economic activity
• Food is a classic example
Company Analysis
• Competitive Position
• Management Quality
• Financial Soundness– Financial Ratios
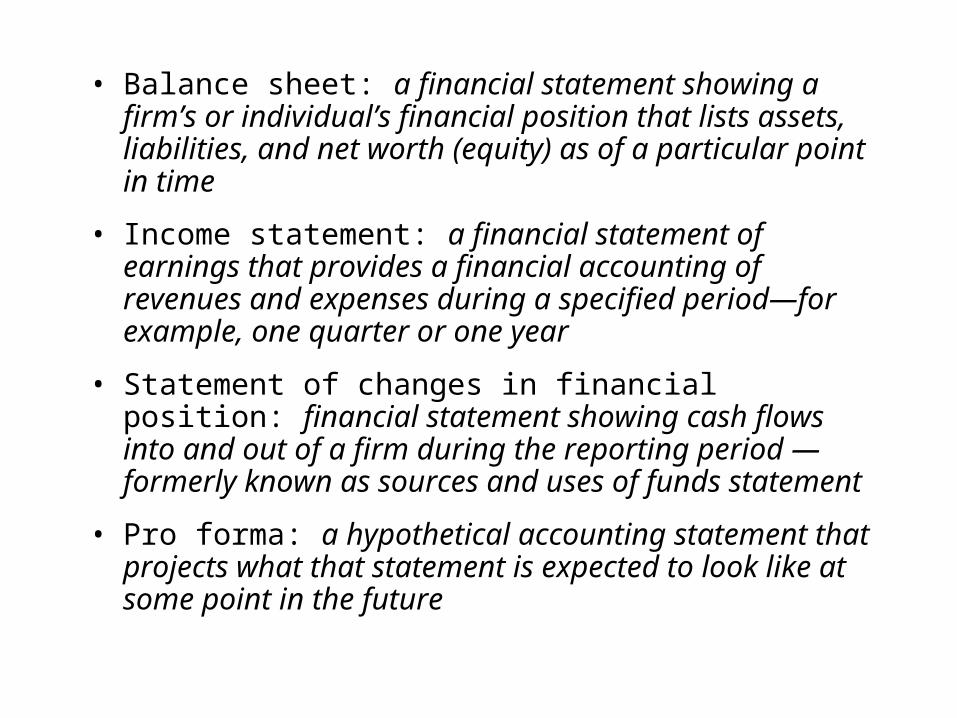
• Balance sheet: a financial statement showing a firm’s or individual’s financial position that lists assets, liabilities, and net worth (equity) as of a particular point in time
• Income statement: a financial statement of earnings that provides a financial accounting of revenues and expenses during a specified period—for example, one quarter or one year
• Statement of changes in financial position: financial statement showing cash flows into and out of a firm during the reporting period — formerly known as sources and uses of funds statement
• Pro forma: a hypothetical accounting statement that projects what that statement is expected to look like at some point in the future
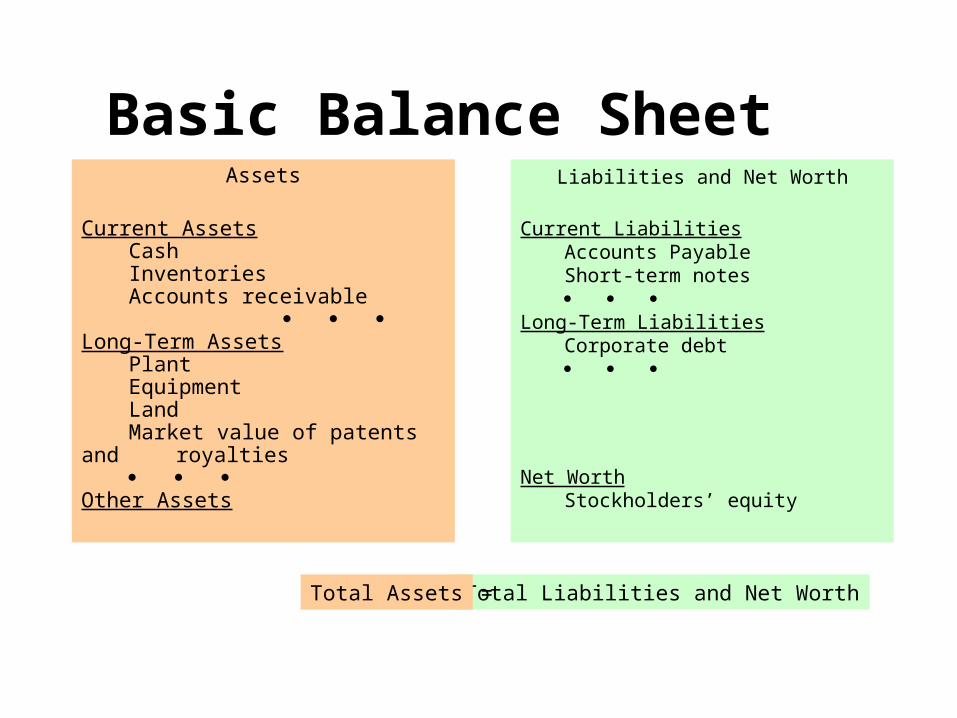
Basic Balance SheetAssets
Current AssetsCashInventoriesAccounts receivable
Long-Term AssetsPlantEquipmentLandMarket value of patents and
royalties
Other Assets
Liabilities and Net Worth
Current LiabilitiesAccounts PayableShort-term notes
Long-Term Liabilities
Corporate debt
Net WorthStockholders’ equity
Total Liabilities and Net WorthTotal Assets =
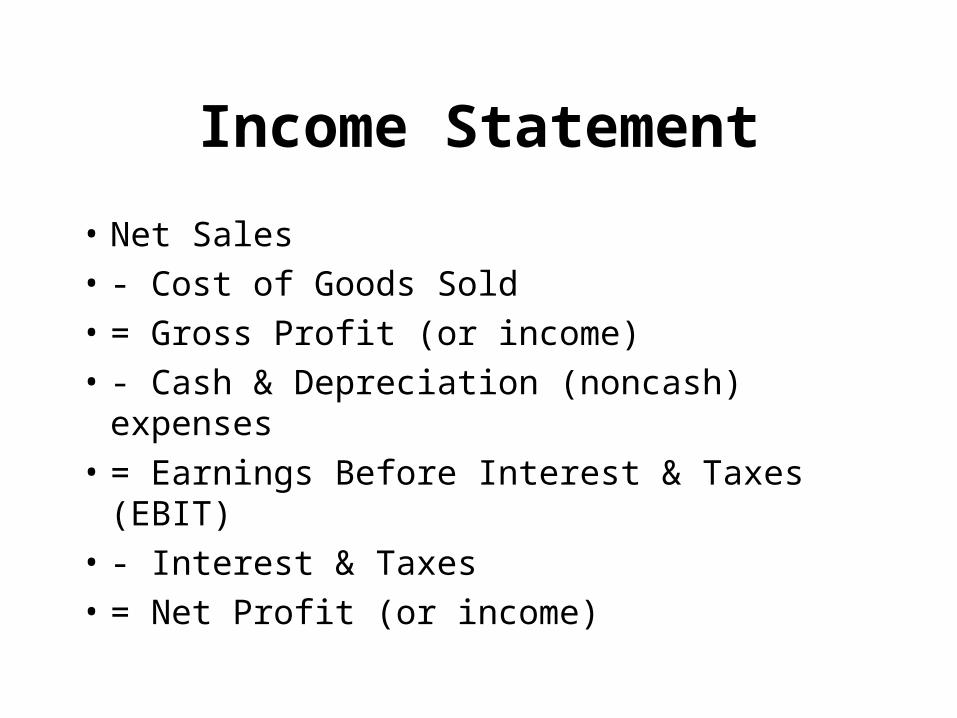
Income Statement
• Net Sales
• - Cost of Goods Sold
• = Gross Profit (or income)
• - Cash & Depreciation (noncash) expenses
• = Earnings Before Interest & Taxes (EBIT)
• - Interest & Taxes
• = Net Profit (or income)
Ratio Analysis
Balance sheet and income statement analysis that utilizes ratios of financial aggregates to assess a company’s financial position, usually by looking for trends in financial ratios, by comparing a company’s financial ratios with the industry average, or both
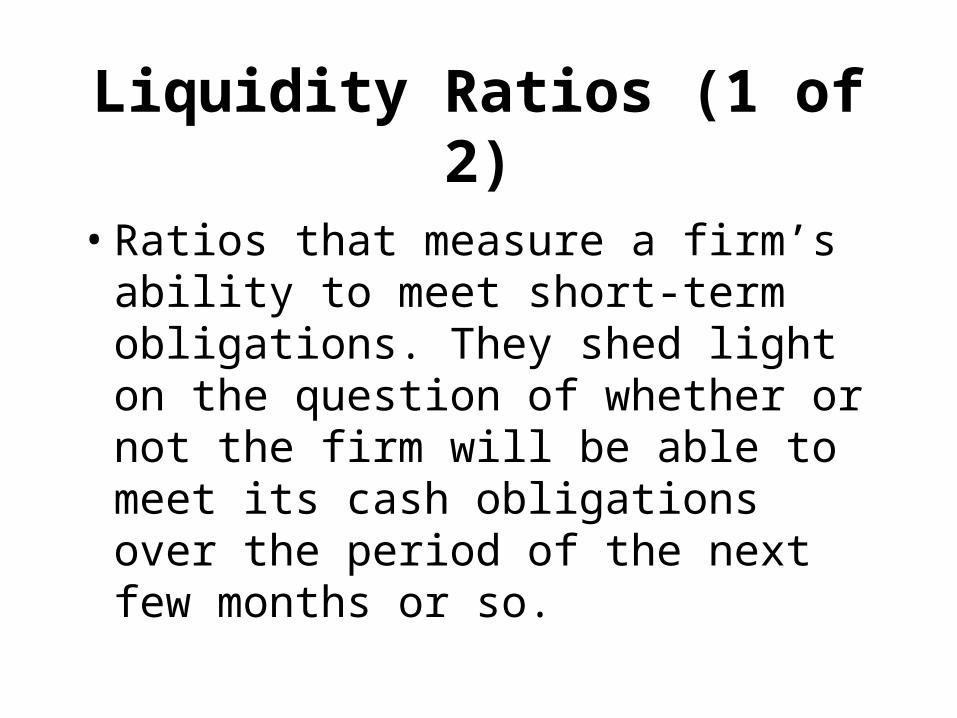
Liquidity Ratios (1 of 2)
• Ratios that measure a firm’s ability to meet short-term obligations. They shed light on the question of whether or not the firm will be able to meet its cash obligations over the period of the next few months or so.
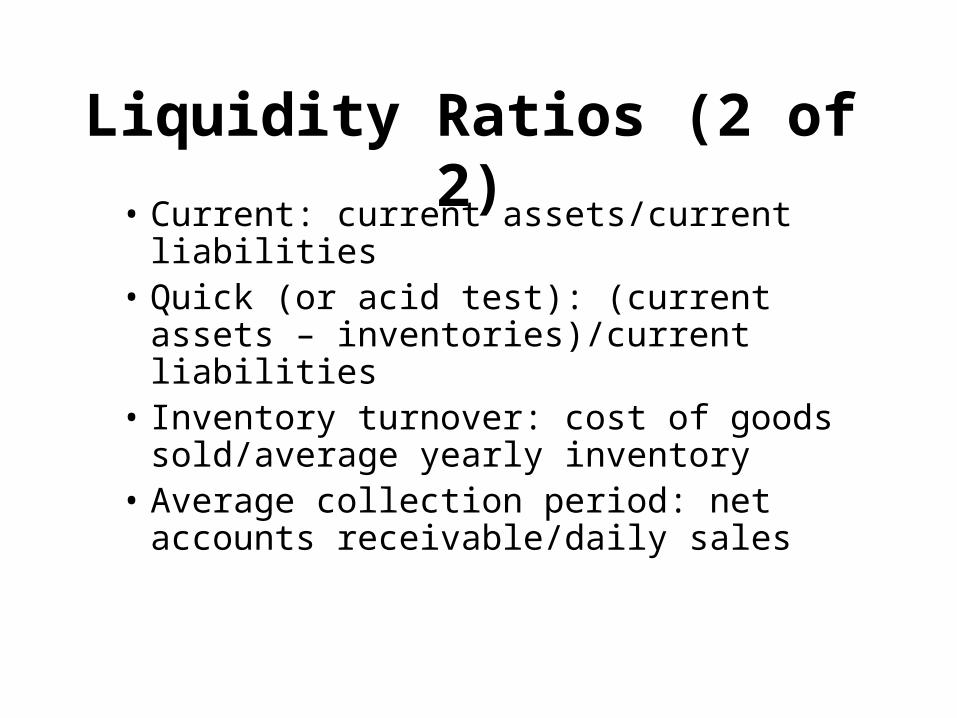
Liquidity Ratios (2 of 2)• Current: current assets/current liabilities• Quick (or acid test): (current assets –
inventories)/current liabilities• Inventory turnover: cost of goods
sold/average yearly inventory• Average collection period: net accounts
receivable/daily sales
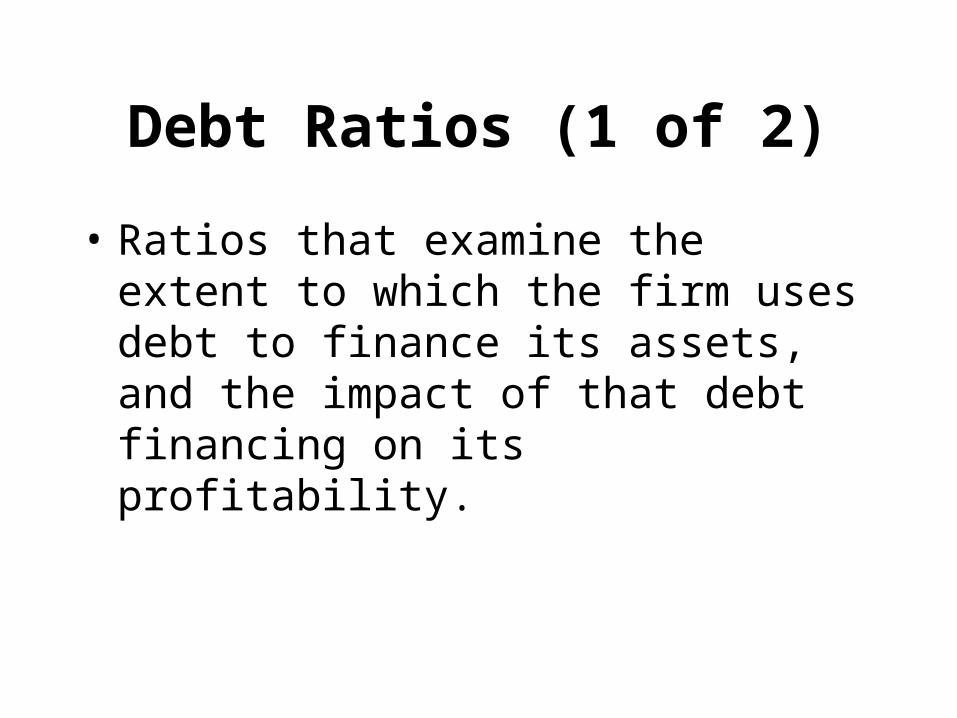
Debt Ratios (1 of 2)
• Ratios that examine the extent to which the firm uses debt to finance its assets, and the impact of that debt financing on its profitability.
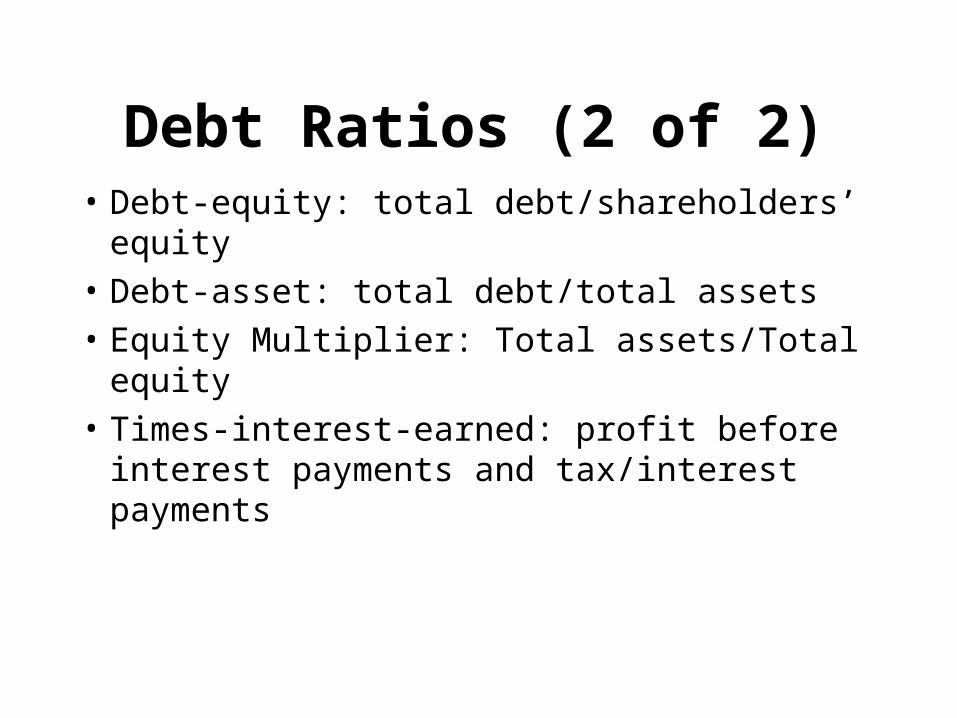
Debt Ratios (2 of 2)• Debt-equity: total debt/shareholders’ equity
• Debt-asset: total debt/total assets
• Equity Multiplier: Total assets/Total equity
• Times-interest-earned: profit before interest payments and tax/interest payments
Profitability Ratios (1 of 2)
• Ratios that look at the profitability or success of the firm, relative to different measures of resources.
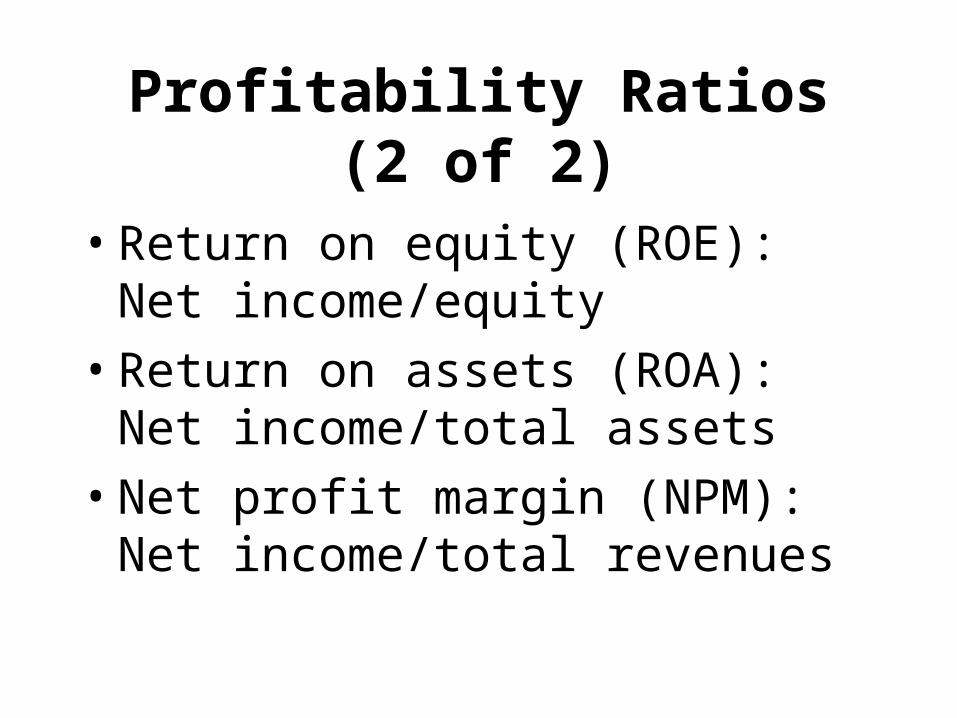
Profitability Ratios (2 of 2)
• Return on equity (ROE): Net income/equity
• Return on assets (ROA): Net income/total assets
• Net profit margin (NPM): Net income/total revenues
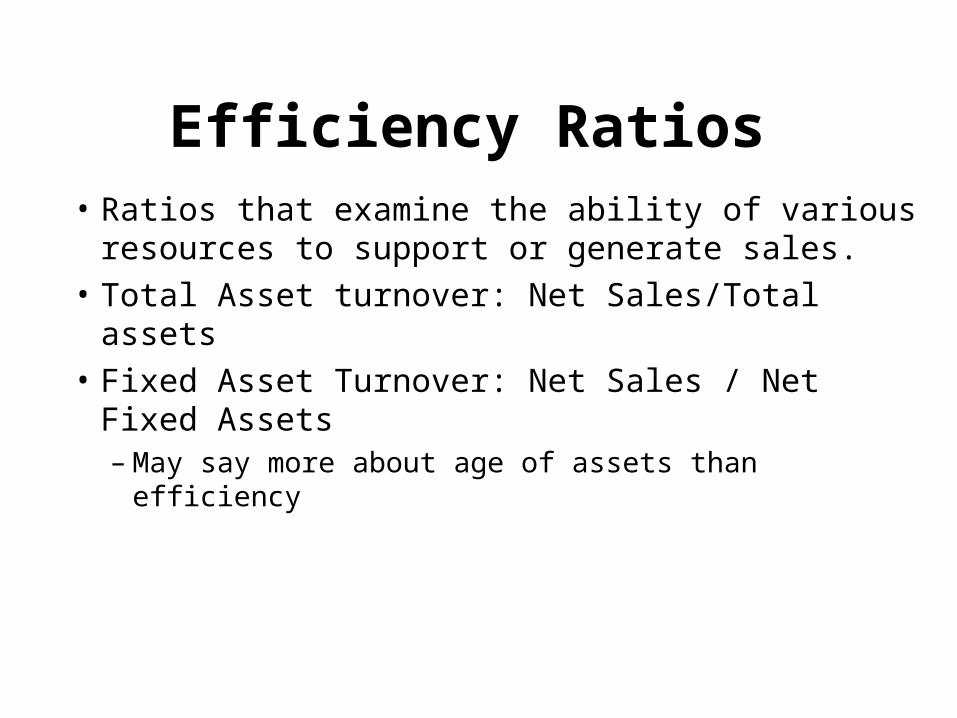
Efficiency Ratios
• Ratios that examine the ability of various resources to support or generate sales.
• Total Asset turnover: Net Sales/Total assets
• Fixed Asset Turnover: Net Sales / Net Fixed Assets – May say more about age of assets than efficiency
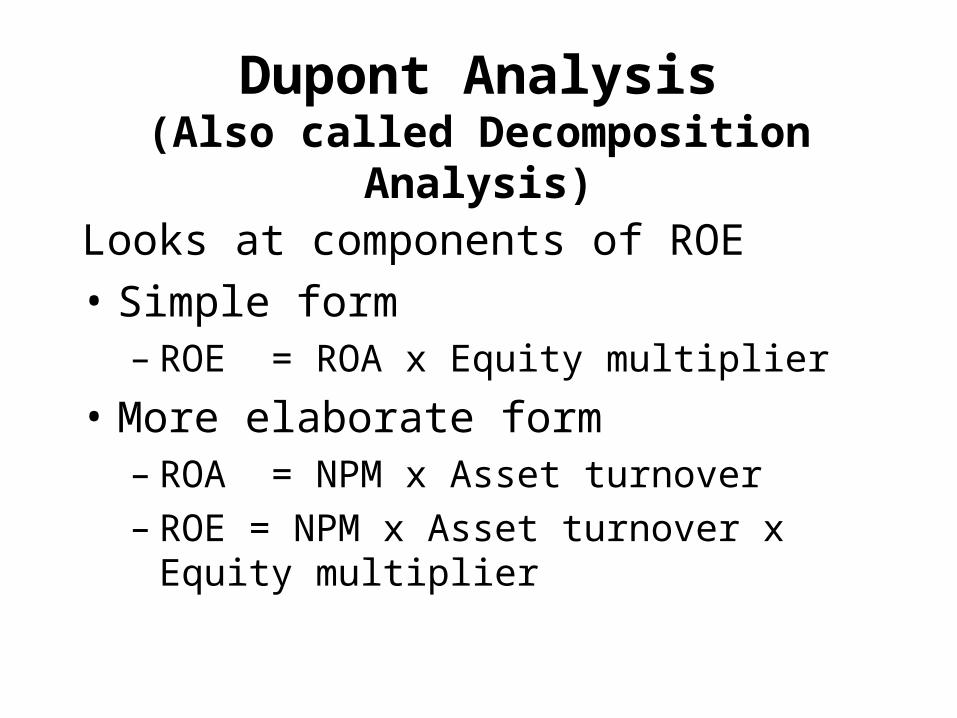
Dupont Analysis(Also called Decomposition Analysis)
Looks at components of ROE
• Simple form– ROE = ROA x Equity multiplier
• More elaborate form– ROA = NPM x Asset turnover – ROE = NPM x Asset turnover x Equity
multiplier

Other Ratios• Earnings per share (EPS): (Net income after taxes –
preferred dividends)/ number of shares• Price-earnings (P/E): Price per share/expected EPS• Dividend yield: Indicated annual dividend/price per share• Dividend payout: Dividends per share/EPS• Cash flow per share: (After-tax profits + depreciation and
other noncash expenses)/number of shares• Book value per share: Net worth attributable to common
shareholders/number of shares
Fundamental Analysis vs. Market Efficiency
• Fundamental analysis critical when dealing with private companies
• Necessary condition for market efficiency of publicly traded companies (although worthless at the margin)
• Earnings surprises major component of performance


![Chapter 7 [Chapter 7]](https://img.pdfslide.us/doc/110x75/61cd5ea79c524527e161fa6d/chapter-7-chapter-7.jpg)