Embed Size (px)
Citation preview

96 Radabaugh, Geiger, and Moyer, editors
Chapter 6 Southwest Florida
Anne Birch, The Nature Conservancy
Eric Milbrandt, Marine Laboratory, Sanibel-Captiva Conservation Foundation
Mark Thompson, Marine Laboratory, Sanibel-Captiva Conservation Foundation
Thomas F. Ries, ESA
Allison Conner, Charlotte Harbor National Estuary Program
Kara R. Radabaugh, Florida Fish and Wildlife Conservation Commission
Description of the region The southwest Florida region includes Charlotte
Harbor, Estero Bay, Rookery Bay, Ten Thousand Is-lands, and the Everglades. The surface water hydrology of southwest Florida has been severely affected by hu-man modifications (e.g., impoundment and channeliza-tion), which have changed the quality, quantity, timing, and distribution of freshwater delivered to coastal wet-lands and estuaries. Before development, the hydrology of the Everglades was tightly linked to a large water-shed that encompassed much of central and southern Florida (Fig. 6.1; Chimney and Goforth 2001, Huber et al. 2006). Water meandered down the Kissimmee River to Lake Okeechobee, where it spilled over the southern edge of the lake into an expansive sawgrass marsh. The sheet of surface water then slowly made its way south, supporting a variety of freshwater marshes in the interi-or and mangroves, salt marshes, and oyster reefs along the coasts. Significant hydrological changes began in 1881, when the Caloosahatchee River was connected to Lake Okeechobee by Hamilton Disston for steam-boat transportation (CHNEP 2013). In the 1950s and 1960s, the U.S. Army Corps of Engineers’ Central and Southern Florida Project made major changes to the watershed in an effort to avert floods and drain wet-lands for agriculture (Chimney and Goforth 2001). The Herbert Hoover Dike prevented water from seeping over the southern edge of Lake Okeechobee, stopping the sheet flow of surface water through the Everglades and instead diverting large amounts of freshwater flow
into constructed channels with outlets in the Caloosa-hatchee and St. Lucie rivers (Fig. 6.2). These hydrolog-ical alterations resulted in markedly lower salinity and increased nutrient and sediment supply in the Caloo-sahatchee and St. Lucie estuaries. Meanwhile, draining and channelization of wetlands increased the severity
Figure 6.1. Historical surface water flow in south Florida. Figure credit: Chris Anderson, based on Chimney and Goforth 2001.

Oyster Integrated Mapping and Monitoring Program Report for the State of Florida 97
and frequency of droughts in other estuaries of the Ev-erglades and Ten Thousand Islands, causing high salin-ity and disrupting the center of abundance of oysters in the major rivers and creeks (Chimney and Goforth 2001, Huber et al. 2006).
Awareness of the extensive environmental damage caused by this alteration of surface water flow prompted the Comprehensive Everglades Restoration Plan (CERP), which the U.S. Congress authorized in 2000. Major com-ponents of CERP include ecological management of
Lake Okeechobee, decreasing channelized freshwater re-leases from the lake, increasing freshwater sheet flow to rehydrate the Everglades, and retaining water in reservoirs for slow release during the dry season (Huber et al. 2006, Volety et al. 2008). CERP also includes projects that focus on improving habitat for oysters, such as removing muck accumulations and providing substrate for oyster estab-lishment (Volety et al. 2008).
Eastern oysters (Crassostrea virginica) are monitored as an indicator species in the Caloosahatchee estuary to
Figure 6.2. Major features impacting the hydrology of the southwest Florida region.

98 Radabaugh, Geiger, and Moyer, editors
gauge the impacts of CERP (Volety and Haynes 2012). Oysters provide a useful indicator of high flows because they are sensitive to prolonged periods of low salinity (be-low 10). Because they are sessile after settlement, they also integrate the impact of varying water quality at a loca-tion from weeks to months or even years, depending on the metric used (CERP 2004, Volety et al. 2014, CHNEP 2019). Oysters additionally provide an indicator of the overall biodiversity of an ecosystem, because biomass, density, and species richness of fish and invertebrates are all greater on oyster reefs than on unvegetated sand or mud bottoms (Tolley and Volety 2005).
Charlotte Harbor Charlotte Harbor is a large, complex estuary bor-
dered by barrier islands and includes the cities of Fort Myers, Cape Coral, Punta Gorda, and North Port. The estuary falls on the boundary between the jurisdictions of the Southwest and South Florida water management districts (SWFWMD and SFWMD, respectively) (Fig. 6.2). It receives freshwater input from the Myakka, Peace, and Caloosahatchee rivers along with many oth-er minor tributaries. Management of the region is facil-itated by the Charlotte Harbor National Estuary Pro-gram, CHNEP, which in 2019 was renamed the Coastal and Heartland National Estuary Partnership, and large areas are protected from development under the Flor-ida Department of Environmental Protection (FDEP) Aquatic Preserve program (Fig. 6.3). The J.N. “Ding” Darling Wildlife Refuge complex, owned and managed by the U.S. Fish and Wildlife Service (USFWS), includes Island Bay, Pine Island Sound, Matlacha Pass, and Calo-osahatchee National Wildlife Refuges (NWRs) and en-compasses a significant area of mangrove islands.
Most oyster reefs in Charlotte Harbor are intertidal, although subtidal reefs are present at depths of at least 1.8 m (6 ft) in the Caloosahatchee River (Boswell et al. 2012). Reefs in open water are common in San Carlos Bay at the mouth of the Caloosahatchee, Matlacha Pass, and Pine Island Sound (Fig. 6.3). Historically, reefs in San Carlos Bay were typically elongated, usually perpendicu-lar to the predominant direction of tidal or river flow, but today they more commonly persist as fringing reefs on low-relief spoil islands. Typical healthy oyster densities are 300–1,500 oysters/m2 (28–139 oysters/ft2) with shell heights of 21–35 mm (0.8–1.4 in). Many of the remaining reefs, however, have large areas with loose, scattered shell or shell fragments and appear to have lost substrate since the widespread development and land-use conversion that began in the late 1960s (Milbrandt, pers. obs.). Many of the reefs are surrounded by shallow sand bottom with
submerged aquatic vegetation (SAV) growing up to the reef edge; the most common species of SAV are turtle-grass (Thalassia testudinum), manateegrass (Syringodium filiforme), and shoalgrass (Halodule wrightii). Larval supply to these oyster reefs may depend on proximity to a healthy reef, but the relationship between hydrodynamics and larval transport remains poorly understood.
In addition to open-water reefs, oysters attach to man-grove prop roots and create fringing reefs along mangrove shorelines. FDEP’s Aquatic Preserve and Buffer Preserve programs have protected much of the mangrove habitat in Charlotte Harbor from development. The shade provided by the canopy and the relatively stable root system cre-ates an excellent place for oysters to thrive. However, set-tlement of oysters on prop roots may be limited because flow restrictions and shallow water may either prevent larvae from reaching the mangrove shorelines or limited water flow may restrict food supply.
While data are limited on the extent of oyster reefs before development, it has been estimated that Charlotte Harbor has lost 90% of its oyster reefs since the 1950s (Boswell et al. 2012, CHNEP 2019). These reefs were lost as a result of mining oyster shell for road construction, unsustainable harvesting rates, changes in surface-water hydrology, excess sedimentation, and direct habitat de-struction due to coastal development. Commercial oyster harvests in Charlotte Harbor peaked in the 1960s (Fig. 6.4), and by the early 1970s much of Charlotte Harbor was closed to commercial oyster harvest due to pollution and declining oyster populations (Taylor 1974). Following a resurgence in the 1980s, oysters were not harvested com-mercially in Charlotte Harbor from 1992 through 2010. Landings resumed in 2011 and increased to 2.1 metric tons (4,666 pounds) in 2016. The impact of this resurgent commercial fishery on the resilience of remaining oyster reefs is a concern.
Southwest Florida contains five shellfish harvesting ar-eas. Four are found in Charlotte Harbor and one is in the Ten Thousand Islands (Fig. 6.5; FDACS 2017). Shellfish are also harvested recreationally in the greater Charlotte Harbor region (Boswell et al. 2012). Removal of oysters for use as chum is largely unregulated in practice and does not adhere to shellfish harvesting areas.
Eastern oysters prefer a salinity range of 14–28, al-though they can survive brief exposure to salinity ranging from 0 to 42 (Shumway 1996, Volety et al. 2008, Vander-Kooy 2012). Oysters in the Caloosahatchee River Estuary must cope with the stress of freshwater releases from Lake Okeechobee that result in rapid and extended declines in salinity. Juvenile oysters are particularly susceptible to fresh water, and salinity <5 can result in 95% juvenile

Oyster Integrated Mapping and Monitoring Program Report for the State of Florida 99
Figure 6.3. Greater Charlotte Harbor mapped oyster extent, aquatic preserves, and national wildlife refuges. Oyster mapping sources: FWC and SFWMD 1999 (made from 1999 aerial photographs), Volety and Savarese 2004, and SWFWMD 2016 (from 2016 photographs).

100 Radabaugh, Geiger, and Moyer, editors
mortality (Volety et al. 2003). The combination of low salinity and high flow in summer hinders larval recruit-ment in the Caloosahatchee (Volety et al. 2003, Volety et al. 2008). Oysters in San Carlos Bay, Pine Island Sound, and associated waters also must endure long periods of high salinity during periods of low river flow.
The CHNEP Oyster Habitat Restoration Plan (Bo-swell et al. 2012) was funded by The Nature Conser-vancy (TNC) and developed by the CHNEP Technical Advisory Committee as well as the oyster experts and stakeholders that made up the Southwest Florida Oys-ter Working Group. The purpose of the plan was to
establish oyster restoration goals, methods, and part-nerships in the region. While a 1999 mapping effort documented only 100 ha (247 ac) of oysters in the es-tuary (Avineon 2004), the restoration plan determined that the CHNEP study area should ideally support 400–2,400 ha (1,000–6,000 ac) of oyster reefs (Boswell et al. 2012). The plan also included an oyster restoration suitability model, which identified locations within the estuary that ranged from least to most optimal for oys-ters based on five key restoration factors: local seagrass persistence, aquaculture lease areas, boat channels, ba-thymetry, and salinity (Boswell et al. 2012). To advance
Figure 6.4. Commercial oyster landings in southwest Florida. Oyster landing data before 1986 were collected under a voluntary reporting system. Data source: FWC 2018 and summary of Florida commercial marine fish landings (see Appendix A).
Figure 6.5. Shellfish harvesting areas in southwest Florida. Source: FDACS 2017.

Oyster Integrated Mapping and Monitoring Program Report for the State of Florida 101
oyster restoration in the Charlotte Harbor region and throughout the state, TNC facilitated a statewide team of stakeholders in the development of a new FDEP general permit specifically for low-profile oyster resto-ration efforts. The permit was approved by the state in 2013 and is the only state permit designed specifically for oyster restoration.
Estero Bay South of Charlotte Harbor, Estero Bay is also lined
by barrier islands and receives freshwater flow from many small rivers and creeks (Figs. 6.3 and 6.6). Much of the shoreline was protected from development and has been preserved as Estero Bay Preserve State Park, although there is extensive development on the barrier islands and uplands surrounding the bay. A large net-work of oyster reefs is present in northern Estero Bay, and smaller reefs are found in the southern part of this system (FDEP 2014; Fig. 6.6). The reefs in Estero Bay are subject to modified timing and delivery of freshwa-ter flow, but to a lesser extent than the Caloosahatchee River.
The irregular shape of the coastline and mangrove is-lands in Estero Bay are a result of oyster reef formation and accretion of sediments in the early to middle Holo-cene (Savarese et al. 2004a). The sedimentation, along with shell growth and recruitment of young oysters, re-sults in high rates of accretion and provides substrate for settlement of red mangroves (Rhizophora mangle). These mangroves eventually mature into mangrove islands, but evidence of past oyster reefs remains in the underlying stratigraphy (Savarese et al. 2004a).
Naples BayHistorically, Naples Bay received the majority of its
freshwater flow from rainfall-derived sheet flow and from small natural tributaries: Gordon River, Rock Creek, and Haldeman Creek. The watershed’s drainage area was ap-proximately 25 km2 (10 mi2) before it was developed and comprised mostly mesic and hydric flatwoods (Woithe and Brandt-Williams 2006). Mangroves dominated the shoreline of this shallow estuary, and the bay once thrived with oyster reefs, seagrass beds, and numerous fish spe-cies (Simpson et al. 1979).
Extensive development, watershed alterations, and dredge-and-fill activities since the 1950s transformed Naples Bay (Fig. 6.7) into a highly urbanized estuary (Laakkonen 2014). Residential development led to an increase in hardened shorelines in the 1950s and 1960s (Schmid et al. 2006). Navigation canals lined with sea-
walls and bulkheads replaced more than 70% of the mangrove shoreline. The bay has lost 90% of its seagrass beds and 80% of its oyster reefs (Fig. 6.8; Schmid et al. 2006). Today subtidal oyster reefs are present on sandy substrates in the northern part of the bay and fringing reefs are found in the southern part of the bay. Seismic profiling in Naples Bay revealed few buried oyster reefs, indicating that most of the historical reef extent was lost to dredging rather than sedimentation (Savarese et al. 2006). Today, Naples Bay remains a challenging envi-ronment for oysters due to water quality issues, muddy substrates, and suspended sediments, which can smoth-er reefs (Savarese et al. 2006).
The natural tributaries of Naples Bay have been se-verely altered by urbanization and the addition of nu-merous canals, significantly changing the hydrology and disrupting the timing and magnitude of freshwater flow to the estuary. The construction of canal systems in residential areas has increased the perimeter of the bay by 53% and the water surface area by 23% (Schmid et al. 2006). Land use in the watershed is a mosaic of resi-dential developments, industrial areas, and agricultural lands, which have increased the pollutant load to the bay (Woithe and Brandt-Williams 2006). Surface water that once traveled as a sheet flow through wetlands is now rapidly conveyed to Naples Bay via stormwater pipes and surface canals, resulting in degraded water quali-ty including increased nutrients, sediments, and metals (CSF 2011).
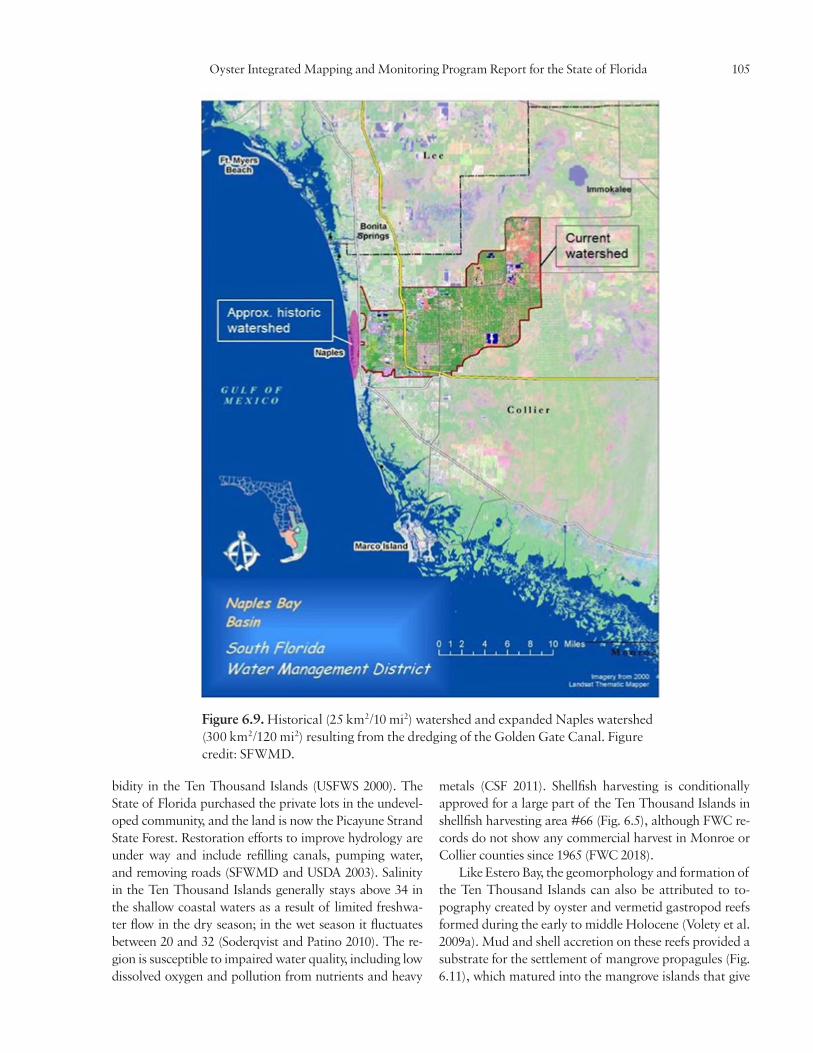
The construction of the Golden Gate Canal (Fig. 6.7) in the 1960s to drain the Northern Golden Gate Estates increased the size of the Naples Bay watershed from ap-proximately 25 km2 (10 mi2) to more than 300 km2 (120 mi2), drastically increasing rainy season freshwater flow into Naples Bay (Fig. 6.9; Woithe and Brandt-Williams 2006, CSF 2011). Average annual discharge from this weir-controlled canal is 7 m3/sec (250 cfs), with flows ex-hibiting high seasonal variability ranging from 0 m3/sec (0 cfs) in the dry season to 40 m3/sec (1,400 cfs) in the wet season (CSF 2011). In the dry season (November–May), salinity is relatively uniform from Gordon Pass through the Gordon River. In the wet season (June–October), freshwater flow from the Golden Gate Canal causes severe stratification of the water column, which lowers benthic dissolved oxygen, inhibits vertical mixing, and decreases water clarity (Woithe and Brandt-Williams 2006). In ad-dition, these large wet-season freshwater influxes greatly reduce salinity in the bay. When combined with the other stressors, this results in harmful impacts to the aquatic biota, including declines in oyster populations (Simpson et al. 1979).

102 Radabaugh, Geiger, and Moyer, editors
Figure 6.6. Map of historical known areas of oyster habitat and current (2012–2016) mapped oyster habitat in Estero Bay. Figure source: Rebecca Flynn, FDEP Estero Bay Aquatic Preserve.

Oyster Integrated Mapping and Monitoring Program Report for the State of Florida 103
Rookery Bay and the Ten Thousand Islands Rookery Bay and the Ten Thousand Islands (Fig. 6.10)
are considerably less developed than the Naples and Char-lotte Harbor watersheds. Apart from Marco Island, much of the watershed and coastal waters are protected from
development by Rookery Bay National Estuarine Research Reserve (RBNERR), Rookery Bay Aquatic Preserve, Cape Romano–Ten Thousand Islands Aquatic Preserve, Ten Thousand Islands National Wildlife Refuge, Collier Seminole State Park, Picayune Strand State Forest, and
Figure 6.7. Mapped oyster extent within Naples Bay. Oyster mapping sources: City of Naples 2005 (made from 2005 sonar data) and Scheda and RBNERR 2015 (from 2014 aerial photography).

104 Radabaugh, Geiger, and Moyer, editors
Figure 6.8. Coastline comparison between 1953 and 2003, with the approximate historical and present-day oyster and seagrass coverage. Figure source: Schmid et al. 2006.
Fakahatchee Strand State Preserve. Although much of the natural mangrove coastline remains intact, the watershed has been historically affected by widespread dredge-and-fill operations that drained large tracts of land for devel-opment and an increasing demand for fresh water by the growing population of southwest Florida. As a result, the
timing and volume of fresh water entering the estuary has been altered (Scheda and RBNERR 2015). North of the Ten Thousand Islands, canals were dug to drain the failed planned community of the Southern Golden Gate Estates. These canals connect to the Faka Union Canal (Fig. 6.10), delivering large amounts of fresh water and increasing tur-
Oyster Integrated Mapping and Monitoring Program Report for the State of Florida 105
bidity in the Ten Thousand Islands (USFWS 2000). The State of Florida purchased the private lots in the undevel-oped community, and the land is now the Picayune Strand State Forest. Restoration efforts to improve hydrology are under way and include refilling canals, pumping water, and removing roads (SFWMD and USDA 2003). Salinity in the Ten Thousand Islands generally stays above 34 in the shallow coastal waters as a result of limited freshwa-ter flow in the dry season; in the wet season it fluctuates between 20 and 32 (Soderqvist and Patino 2010). The re-gion is susceptible to impaired water quality, including low dissolved oxygen and pollution from nutrients and heavy
metals (CSF 2011). Shellfish harvesting is conditionally approved for a large part of the Ten Thousand Islands in shellfish harvesting area #66 (Fig. 6.5), although FWC re-cords do not show any commercial harvest in Monroe or Collier counties since 1965 (FWC 2018).
Like Estero Bay, the geomorphology and formation of the Ten Thousand Islands can also be attributed to to-pography created by oyster and vermetid gastropod reefs formed during the early to middle Holocene (Volety et al. 2009a). Mud and shell accretion on these reefs provided a substrate for the settlement of mangrove propagules (Fig. 6.11), which matured into the mangrove islands that give
Figure 6.9. Historical (25 km2/10 mi2) watershed and expanded Naples watershed (300 km2/120 mi2) resulting from the dredging of the Golden Gate Canal. Figure credit: SFWMD.

106 Radabaugh, Geiger, and Moyer, editors
the Ten Thousand Islands its name (Volety et al. 2009a). A layer of oyster shell hash, a remnant of past oyster reefs, is common in subtidal stratigraphy in the area (Volety et al. 2009a, FDEP 2012).
Everglades and Florida BayHistorically, sheet flow and groundwater flow made
salinity favorable for oyster growth along the coast of the Everglades (Volety et al. 2009a). With reduced sheet flow, however, oysters are now restricted to brackish riv-er mouths, inland bays, and channels (Fig. 6.12; Volety et al. 2009a). Mapping data are limited for much of Ever-glades National Park and may underestimate oyster ex-tent. Limited oyster beds have been observed in the Taylor Creek and Shark River Slough systems, but since salinity is so dependent upon the timing and volume of upstream freshwater flows, their presence is highly variable (Penny Hall, pers. comm.).
Florida Bay is a broad, shallow bay south of the Ev-erglades (Fig. 6.12). Some oysters are found in brackish waters on prop roots of mangroves bordering Florida Bay (Goodman et al. 1999), but these mangrove-root
oysters are difficult to detect via remote imagery and so have not been mapped. Florida Bay itself does not sup-port extensive oyster reefs and experiences widely vari-able water quality, including warm temperatures and hypersaline conditions as a result of reduced freshwater flow and evaporation (Fourqurean and Robblee 1999).
Threats to oysters in southwest Florida
•Altered hydrology: Oysters located in concentrated freshwater outflows such as the Caloosahatchee River Estuary or the Faka Union Canal must cope with very low salinity (<10) during the rainy season, which re-sult in increased mortality and decreased reproduction (La Peyre et al. 2003, Volety et al. 2008). High nutri-ents in urban runoff and freshwater releases from Lake Okeechobee support algal blooms that smother oyster beds, cause hypoxia, and may release biotoxins (Volety et al. 2014). Most oysters in southwest Florida, includ-ing those near freshwater outflows, must also cope with low freshwater flow and high salinity, which increases rates of disease and predation (Volety et al. 2003, Volety
Figure 6.10. Oyster extent in Rookery Bay and Ten Thousand Islands. Oyster mapping sources: NWI 1999 (made from 1999 aerial photography), City of Naples 2005 (from 2005 sonar data), Volety et al. 2009a (from 2007 photography), and Scheda and RBNERR 2015 (from 2014 photography).

Oyster Integrated Mapping and Monitoring Program Report for the State of Florida 107
et al. 2008). The consequences can be seen in the Ever-glades, where the range of oysters has shifted inland to follow lower salinity regimes (Volety et al. 2009a).
• Sedimentation: Several regions in Charlotte Harbor and Naples Bay must cope with excessive sedimenta-tion as a result of runoff and altered hydrology. Fine sediment can interfere with filter feeding, cause decom-position-induced hypoxia, and accumulate as muck substrates that are unsuitable for oyster settlement (Vo-lety et al. 2008). Frequent resuspension of sediments can occur due to boat wakes and waves intersecting with seawalls along the Caloosahatchee.
•Habitat loss: Large areas of oyster reef in Charlotte Harbor, Naples, and Marco Island were destroyed as a result of shell mining, commercial fishing, and dredge-and-fill construction (Boswell et al. 2012, Volety et al. 2014). Mangroves, and thus mangrove-root-oyster hab-itat, were also lost to coastal development.
•Disease: Perkinsus marinus (dermo) infections have been found in 65–95% of oysters in southwest Flori-da (Volety et al. 2009a, Volety et al. 2014). Although infection is common, infection intensity (as gauged on the scale developed by Mackin 1962) is often relatively low as warm summer temperatures are counteracted by the low salinity of the rainy season (La Peyre et al. 2003, Volety et al. 2008). Areas that do not receive high freshwater flow in the summer rainy season are more vulnerable to infection (Volety et al. 2009a).
• Invasive species: The Asian green mussel, Perna viridis, was first found in Charlotte Harbor in 2000 and in Estero Bay in 2002 (FDEP 2014). These mussels have no natural predators in Florida, reach sexual maturity quickly at an age of 2–3 months, and are tolerant of a wide range of salinity, so they can outcompete na-tive bivalves. The Charlotte Harbor Aquatic Preserves have been monitoring green mussels since 2009 (FDEP 2017). Efforts to combat these invasive mussels include targeted removal efforts and educating the public on in-vasive species (FDEP 2014).
•Climate change and sea-level rise: Altered precipita-tion patterns, increasing temperatures, rising sea level, and ocean acidification all pose threats to oysters (Mill-er et al. 2009, Hoegh-Gulberg and Bruno 2010, Rodri-guez et al. 2014), but their effect on oyster populations
Figure 6.11. Red mangrove (Rhizophora mangle) propa-gules take root after settling on an intertidal oyster reef in the Ten Thousand Islands. Photo credit: Ryan P. Moyer.
Figure 6.12. Oyster extent in the Everglades and Florida Bay. Oyster mapping sources: NWI 1999 (made from 1999 aerial photography), Volety et al. 2009a (from 2007 photography), and Scheda and RBNERR 2015 (from 2014 photography).

108 Radabaugh, Geiger, and Moyer, editors
in southwest Florida is uncertain, particularly when the many other anthropogenic impacts in the region are considered. This is a complex topic that requires fur-ther investigation and substantive review.
•Harvesting: Commercial harvesting in southwest Flori-da is not as extensive as it is in other coastal areas of the state, but Lee and Charlotte counties have experienced extensive shell mining and widely variable harvest in-tensity. The impact of the recent resurgence in commer-cial harvesting on severely reduced oyster populations needs to be assessed and managed.
Oyster reef mapping and monitoring effortsThe compilation of data used to create the oyster
maps in this report is available for download at http://geodata.myfwc.com/datasets/oyster-beds-in-florida.
CHNEP and TNC volunteer oyster habitat monitoring
The CHNEP volunteer oyster habitat monitoring program is intended to enable the collection of meaningful long-term monitoring data from oyster habitat restoration sites by citizen scientists (CHNEP 2017). The CHNEP Oyster Habitat Restoration Plan (Boswell et al. 2012) provides monitoring protocols that can be used by all partner organizations in the Charlotte Harbor region and elsewhere. The handbook is available at http://www.chnep.wateratlas.usf.edu/upload/documents/Final_Volunteer-Coordinator-Manual-1517-with-Appendices.pdf.
The program was developed through hands-on expe-rience gained working with volunteers to assist in moni-toring TNC’s Trabue Harborwalk Oyster Habitat Resto-ration Pilot Project in Punta Gorda. The protocols were vetted through both a scientific steering committee and a volunteer steering committee to ensure that the protocols were appropriate for volunteers and are also in line with those in the Oyster Habitat Restoration Monitoring and Assessment Handbook (Baggett et al. 2014). Results are therefore comparable to oyster habitat restoration proj-ects in other regions.
By recruiting and training volunteers to conduct the majority of the monitoring using scientifically vetted pro-tocols this program will:
•Enable long-term collection of monitoring data at a lower cost.
•Reduce the staff time needed to complete monitoring.
• Provide a source of leverage for grant funding through volunteer hours.
• Increase community support for habitat restoration projects through community engagement and steward-ship of natural resources.
•Enhance understanding in the community about oyster habitat degradation and restoration and the ecosystem benefits of restoration.
• Provide meaningful volunteer opportunities for com-munity members.
The Trabue Harborwalk Oyster Habitat Restoration Pilot Project includes nine pilot reefs—three each of bagged fossilized shell, loose fossilized shell surrounded by oyster bags, and oyster mats made with recycled shells. TNC is collaborating with Charlotte Harbor Aquatic Preserves, the CHNEP Volunteer Oyster Habitat Mon-itoring Program, Friends of the FDEP, and the Florida Fish and Wildlife Conservation Commission (FWC) to monitor these pilot reefs (Geselbracht 2016). Monitoring includes a focus on oyster recruitment, macroinvertebrate populations, bird presence, and use of the reefs by small-tooth sawfish (Pristis pectinata). The first of three years of planned postconstruction monitoring (2016) demon-strated that the reefs created a thriving community of oysters and other invertebrates. As of April 2017, 1,300 volunteers and citizen scientists had provided a total of 2,950 hours toward this restoration project, including material assembly, deployment, and monitoring (Gesel-bracht et al. 2017). The second annual postconstruction monitoring of the project was completed in November 2017. Monitoring reports and data for this project may be downloaded from http://chnep.wateratlas.usf.edu/oyster-habitat-restoration/.
Charlotte Harbor National Estuary Program Volunteer Tidal Shoreline Survey/Mapping
The CHNEP completed volunteer tidal shoreline surveys in 2007, 2010, and 2013 (CHNEP 2013). These surveys documented the condition of the estuary by as-sessing various characteristics of mangroves as well as gathering data on oyster presence or absence, invasive vegetation, and shoreline hardening. In 2013, 318 km (198 mi) of shoreline accessible by vessel were surveyed (80% of the shoreline length that had been identified for the survey); oysters were present along 18% of the sur-veyed shoreline. Oysters in the accessible areas tended to be located on the shorelines having the highest estuarine salinity and not along the banks of the rivers with lower salinity. The CHNEP plans to complete another survey in 2019. Survey results are available at http://www.chnep.wateratlas.usf.edu/shoreline-survey/.

Oyster Integrated Mapping and Monitoring Program Report for the State of Florida 109
Charlotte Harbor National Estuary Program mapping efforts
Several mapping studies have been conducted in this region (Harris et al. 1983, Avineon 2004, Photo Science 2007), but they are limited in scope, have used different methods, and the accuracy of results is not consistent. Comprehensive mapping of subtidal and intertidal oys-ter habitat is needed, as is condition analysis of reefs to inform restoration and management decisions. The Char-lotte Harbor Oyster Restoration Plan provides a good summary of the past mapping efforts in the Charlotte Harbor estuary (Boswell et al. 2012).
Sanibel–Captiva Conservation Foundation (SCCF)The SCCF Marine Laboratory has constructed or
restored numerous oyster reefs from the mouth of the Caloosahatchee River to bayous west of Sanibel Island. All of its projects have included long-term monitoring of the restoration sites and adjacent reference sites. Monitoring metrics include density, size frequency, reef area, and reef height, plus ancillary measures including monthly settlement in Tarpon Bay, San Carlos Bay, and Matlacha Pass.
Comprehensive Everglades Restoration Program oyster monitoring
CERP conducts monitoring of oyster health and water quality on Florida’s southeast and southwest coasts. Mon-itored locations on the Gulf coast include the Caloosa-hatchee River Estuary, San Carlos Bay, and the Ten Thou-sand Islands (Volety et al. 2008, 2009b, Volety and Haynes 2012, Volety et al. 2014). Florida Gulf Coast University (FGCU) led the first monitoring efforts on the Gulf Coast, while the FWC did so on the Atlantic coast, using a sim-ilar methodology (Boswell et al. 2012). In 2017, FWC as-sumed monitoring responsibilities in the Caloosahatchee River. Monitored parameters include water quality, spat recruitment, reproductive histology, dermo prevalence and intensity, recruitment, density, and juvenile oyster growth (Volety and Haynes 2012, Volety et al. 2014).
Oil spill impact studyLoren Coen and Ed Proffitt of Florida Atlantic Uni-
versity led a study on the impacts of the Deepwater Horizon oil spill on oyster reefs in Florida Gulf estuaries. Goals for this study include assessing oyster conditions, with components focusing on survival, growth, genetic diversity, and the concentration of polycyclic aromatic
hydrocarbons in oyster tissues. More information may be found at http://research.gulfresearchinitiative.org/research-awards/projects/?pid=51.
Southwest Florida Water Management District mapping
The SWFWMD has conducted seagrass mapping every two years since 1988 using a modified version of the Florida Land Use and Cover Classification System (FLUCCS; FDOT 1999) for coastal areas in the district, including northern Charlotte Harbor. Subtidal habitats are mapped using natural-color aerial photography col-lected in winter at a scale of 1:24,000. Mapped habitats include tidal flats, beaches, patchy seagrass, and continu-ous seagrass. In 2014, the oyster bar (FLUCCS 6540) clas-sification was added. The most recent effort was complet-ed in 2016 (SWFWMD 2016).
Charlotte Harbor benthic habitat mapping and biodiversity efforts
Mote Marine Laboratory and CHNEP completed a mapping and biodiversity survey of benthic habitats in 10 basins of greater Charlotte Harbor (CHNEP and MML 2007). Surveyed habitats included mangroves, sandbars, mud flats, salt marsh, oyster reefs, and seagrass beds. More than 370 invertebrate taxa were identified from more than 44,000 organisms collected (CHNEP and MML 2007). The study also examined the impact of hab-itat and salinity on biodiversity.
Molluscan bioindicators of the tidal Myakka River and inshore waters of Venice
Mote Marine Laboratory conducted a survey of im-portant mollusk species in the lower Myakka River and Dona and Roberts bays and their tributaries (Estevez 2005). Data were collected on density, shell size, and de-gree of shell weathering for living and dead oysters. Oys-ters were much more abundant in Dona and Roberts bays than in the Myakka River. Oyster shells were found in the Myakka River, but all shells were dead and highly weath-ered, indicating that the shells were old (Estevez 2005).
U.S. Army Corps of Engineers benthic habitat mapping
Dial Cordy and Associates was contracted by the U.S. Army Corps of Engineers to map benthic substrate in the Caloosahatchee River Estuary, St. Lucie Estuary, Loxa-

110 Radabaugh, Geiger, and Moyer, editors
hatchee Estuary, and Lake Worth Lagoon (Dial Cordy and Associates Inc. 2011). Resulting maps included bot-tom type (seagrass, oyster bed, shell, muck, etc.). Maps were created through the interpretation of high-resolution aerial photography as well as side-scan sonar. Substrates were verified with ground truthing, and the densities of living oysters were quantified on mapped oyster reefs.
Estero Bay Aquatic Preserve oyster mapping and monitoring
The Estero Bay Aquatic Preserve (EBAP) oyster map-ping and monitoring program began in the winter of 2012. The original goal of the project was to map every oyster reef in Estero Bay Aquatic Preserve and compare reef extent to aerial photographs from the 1950s and 2000s. The focus has shifted toward assessing the health of a subset of oyster reefs in the bay (Stephanie Erickson, pers. comm.). Mapping and monitoring have typically been completed from October through March to take ad-vantage of the low winter tides, but on a few occasions have been done in summer. In winter 2012–2013, 67 reefs were mapped and data were collected on reef status (nat-ural live reef, natural live shell, natural nonliving, restored live reef, restored live shell, restored nonliving), presence of oysters, the perimeter of the intertidal oyster reef, pres-ence of surrounding seagrass species, presence of green mussels, substrate, and water depth.
Since 2013, more parameters have been added to the protocol, including presence of mangroves and tide stage. In addition, each reef is surveyed using a transect and randomly placed quadrats. Data include the transect heading, type of oyster reef (patch, fringing, or string), reef length, shell height, reef height, percent cover (live oyster, oyster shell, sediment, or other), and presence of any other organisms. Several 0.25-m2 quadrats are used to measure oyster density (including spat), size frequency distribution, and recruitment. Finally, water quality read-ings including temperature, salinity, dissolved oxygen, pH, and turbidity are collected near each reef. EBAP staff are developing a new long-term monitoring strategy for oyster health in Estero Bay that will comprise aerial map-ping and annual monitoring of a handful of representa-tive oyster reefs throughout the bay.
Naples Bay mappingSavarese et al. (2004b and 2006) conducted sub-
strate and subsurface mapping in Naples Bay and the Ten Thousand Islands. Substrate maps delineated oyster reefs using side-scan sonar (City of Naples 2005). Sub-
surface acoustic profiles were produced using shallow seismic chirp profiling, which could identify the pres-ence of buried oyster reefs (Saverese et al. 2006). The effort also identified suitable locations for oyster reef restoration. GIS data are available at http://g.naplesgov.com/cityofnaplesgis/data.html.
Schmid et al. (2006) detailed the historical develop-ment and loss of estuarine habitat in Naples Bay. Histor-ical and current maps of seagrass, oyster, and mangrove habitats were created in this effort. Benthic habitat maps were created using 1999 digital orthoquads, and sediment and biotic characteristics were verified with field sampling (Schmid et al. 2006).
Additionally, a master’s thesis titled Effects of salinity and other stressors on eastern oyster (Crassostrea virgi-nica) health and a determination of restoration potential in Naples Bay, Florida includes maps of historical oyster bed coverage, 2014 coverage, and restoration strategies for Naples Bay (Laakkonen 2014).
Rookery Bay National Estuarine Research Reserve (RBNERR) mapping
In 2014, RBNERR assessed estuarine conditions in Henderson Creek and the surrounding drainage basin. Scientists from Scheda Ecological Associates were hired to perform a literature review and analysis of available historical aerial imagery to assess the feasibility of docu-menting anthropogenic changes in estuarine habitats over time. This process included review of habitats (SAV, oys-ter beds, and hard bottom) based on visual signatures in aerial photographs. Aerial photography had never been taken specifically to identify submerged aquatic resourc-es (seagrass or oysters) in the Rookery Bay Estuary. The project team acquired high-definition, geo-referenced ae-rial photography to provide baseline data that could be used in evaluating changes in the natural communities of Rookery Bay and the Ten Thousand Islands area in re-sponse to freshwater inflow alterations. Maps were cre-ated for SAV, seagrass, hard bottom, and oyster habitat (Scheda and RBNERR 2015).
National Wetlands Inventory (NWI) mappingFor more than 30 years, NWI generated and updated
highly detailed wetland and intertidal habitat maps fol-lowing the Cowardin et al. (1979) classification scheme. Estuarine intertidal mollusk reefs (coded as E2RF2) were mapped in Chokoloskee Bay using imagery from 1999 (NWI 1999). NWI maps are available at https://www.fws.gov/wetlands/index.html.

Oyster Integrated Mapping and Monitoring Program Report for the State of Florida 111
Ten Thousand Islands and the Everglades An extensive geomorphologic study of the Ten Thou-
sand Islands and the coastal Everglades was conducted to determine past and present oyster distribution (Volety et al. 2009a). Data products include maps of oyster extent, including those on reefs and mangrove roots, and infor-mation on oyster presence in the geologic record through stratigraphy. Mapping was based on digital orthophoto quarter quads (DOQQs); geographic information system (GIS) data layers of the mapping product include a confi-dence category that compares features visible on DOQQs to mapped and ground-truthed habitats. Monitoring parameters included oyster condition index, dermo prev-alence and intensity, spat recruitment, size, survival and density (Volety et al. 2009a).
NOAA Mussel Watch The National Oceanic and Atmospheric Adminis-
tration (NOAA) National Status and Trends Program has monitored pollutants in bivalves through the Mussel Watch program across the coastal United States from 1986 to present. Monitoring locations in this region include Bird Island in Charlotte Harbor, Naples Bay, Henderson Creek in Rookery Bay, Faka Union Bay in the Everglades, and Flamingo and Joe Bay in Florida Bay (Kimbrough et al. 2008). High levels of mercury were found in oysters at these locations, and high levels of copper were found in Naples Bay. Many oysters in Florida have high copper con-centrations as a result of the use of copper in fungicides, algaecides, and antifouling paints (Kimbrough et al. 2008).
Recommendations for management, mapping, and monitoring
•CERP efforts to moderate freshwater flow are key to maintaining brackish salinity and are crucial for oyster survival. More frequent water sampling, such as sam-pling with autonomous instruments, is needed to cap-ture data on freshwater pulses and their impact on oys-ters (CHNEP 2019).
•Compared with more urbanized areas of Florida, oyster mapping and monitoring are notably lacking for many regions of Everglades National Park. Oyster distribution in the region should be documented before completion of major improvements to U.S. 41 that will improve surface water flow. The Shark River Slough and Taylor Creek areas should be monitored after construction to assess whether the changes have improved conditions for oyster development (Penny Hall, pers. comm.).
•To gauge progress toward the goal of 400–2,400 ha (1,000–6,000 ac) of oyster habitat in Charlotte Harbor, the CHNEP Oyster Habitat Restoration Plan recom-mends mapping oyster habitats by type and implement-ing and monitoring oyster restoration efforts through-out the estuary by 2020 (Boswell et al. 2012).
•Continue efforts to determine patterns of oyster distribu-tion before European settlement using historical records and sedimentary coring techniques (Boswell et al. 2012).
• Improve mechanistic understanding of reef-forming and reef-eroding processes (i.e., improve shell budget calculations).
• Improve understanding of how larval supply and trans-port among oyster reefs is impacted by river flow.
• Improve ecosystem service estimates (e.g., habitat provi-sion, wave attenuation, water filtration, food-web con-tributions) for reef-forming and mangrove-root oysters.
• Improve estimates of predation and disease, especially as they relate to droughts.
•Assess whether recent increases in regional oyster har-vests are sustainable.
Works citedAvineon. 2004. Analysis of submerged aquatic vegetation,
intertidal unvegetated, saltwater marsh, mangrove, oyster, freshwater wetland and native upland habitats within the greater Charlotte Harbor watershed. CH-NEP FY03 Technical Project final map and database.
Baggett, LP, Powers SP, Brumbaugh R, Coen LD, et al. 2014. Oyster habitat restoration monitoring and assessment handbook. Arlington, VA: The Nature Conservancy. Available from http://www.oyster-restoration.org/wp-content/uploads/2014/01/Oyster-Habitat-Restoration-Monitoring-and-Assessment-Handbook.pdf.
Boswell JG, Ott JA, Birch A, Cobb D. 2012. Charlotte Harbor National Estuary Program oyster habitat restoration plan. Fort Myers, FL: Charlotte Harbor National Estuary Program. http://www.polk.wateratlas.usf.edu/upload/documents/CHNEP-Oyster-Rest-Plan-No-Appends-Final-2012-12-17.pdf, accessed April 2017.
CERP (Comprehensive Everglades Restoration Plan). 2004. CERP monitoring and assessment plan: part 1. Monitoring and supporting research. Restoration Coordination and Verification (RECOVER). Accessed from: http://141.232.10.32/pm/recover/recover_map_2004.aspx, accessed April 2017.

112 Radabaugh, Geiger, and Moyer, editors
Chimney MJ, Goforth G. 2001. Environmental impacts to the Everglades ecosystem: a historical perspective and restoration strategies. Water Science and Technology 44:93–100.
CHNEP and MML (Charlotte Harbor National Estuary Program and Mote Marine Laboratory). 2007. Benthic invertebrate species richness & diversity at different habitats in the greater Charlotte Harbor system. Fort Myers, FL: CHNEP. Available from http://www.chnep.wateratlas.usf.edu/upload/documents/BenthicBiodiversityReport.pdf.
CHNEP (Charlotte Harbor National Estuary Program). 2013. 2013 Volunteer tidal shoreline survey. Technical report 13-2. Fort Myers, FL: CHNEP. Available from http://www.chnep.wateratlas.usf.edu/upload/documents/CHNEP-2013-Volunteer-Shoreline-Survey-FINAL.pdf.
CHNEP (Charlotte Harbor National Estuary Program). 2017. CHNEP volunteer oyster habitat monitoring program. Punta Gorda, FL: CHNEP. Available from http://www.chnep.wateratlas.usf.edu/upload/documents/Final_Volunteer-Coordinator-Manual-1517-with-Appendices.pdf.
CHNEP (Coastal and Heartland National Estuary Part-nership). 2019. 2019 comprehensive conserv ation and management plan for the CHNEP area in central and southwest Florida. Available from https://www.chnep.org/the-plan-that-guides-us, accessed August 2019.
City of Naples. 2005. Oyster reefs GIS data. Naples, FL. Available from http://g.naplesgov.com/cityofnaplesgis/data.html, accessed June 2017.
Cowardin LM, Carter V, Golet FC, Laroe ET. 1979. Classification of wetlands and deepwater habitats of the United States. FWS/OBS-79/31. Jamestown, ND: U.S. Fish and Wildlife Service. Available from https://www.fws.gov/wetlands/Documents/Classification-of-Wetlands-and-Deepwater-Habitats-of-the-United-States.pdf.
CSF (Conservancy of Southwest Florida). 2011. Estuaries report card. Naples, FL. Available from http://www.conservancy.org/document.doc?id=379, accessed April 2017.
Dial Cordy and Associates Inc. 2011. Benthic habitat mapping and substrate characterization in the north-ern estuaries, Florida. Prepared by Dial Cordy and Associates Inc. Washington, DC: U.S. Army Corps of Engineers.
Estevez ED. 2005. Molluscan bio-indicators of the tidal Myakka River and inshore waters of Venice Florida. Prepared by Mote Marine Laboratory for Sarasota County. Sarasota, FL: Mote Marine Laboratory.
Technical Report No. 99. Available from http://www.sarasota.wateratlas.usf.edu/upload/documents/Mote_Myakka_DARB_molluskreportfinal.pdf.
Evans JT, Wessel RA, Duke LD. 2017. The Caloosa ha-tch ee conundrum. Water Resources Impact 19:27–29.
FDACS (Florida Department of Agriculture and Consumer Services). 2017. Shellfish harvest area classification. Available from http://www.freshfromflorida.com/Business-Services/Aquaculture/Shellfish-Harvesting-Area-Classification/Shellfish-Harvesting-Area-Maps, accessed August 2017.
FDEP (Florida Department of Environmental Protection). 2012. Rookery Bay National Estuarine Research Reserve management plan, January 2012–December 2017. Tallahassee, FL. Available from https://coast.noaa.gov/data/docs/nerrs/Reserves_RKB_MgmtPlan.pdf.
FDEP (Florida Department of Environmental Protection). 2014. Estero Bay Aquatic Preserve management plan. Tallahassee, FL. Available from http://publicfiles.dep.state.fl.us/cama/plans/aquatic/Estero-Bay-AP-Management-Plan.pdf.
FDEP (Florida Department of Environmental Protection). 2017. Charlotte Harbor Aquatic Preserves management plan. Tallahassee, FL. Available from http://publicfiles.dep.state.fl.us/CAMA/plans/aquatic/Charlotte-Harbor-AP-Management-Plan.pdf.
FDOT (Florida Department of Transportation). 1999. Florida land use, cover and forms classification system, 3rd edition. State Topographic Bureau, Thematic Mapping Section. Available from https://fdotwww.blob.core.windows.net/sitefinity/docs/default-source/content/geospatial/documentsandpubs/fluccmanual1999.pdf.
Fourqurean JW, Robblee MB. 1999. Florida Bay: a history of recent ecological changes. Coastal and Estuarine Research Federation 22:345–357.
FWC (Florida Fish and Wildlife Conservation Commission). 2017. Commercial fisheries landings in Florida. Available from http://myfwc.com/research/saltwater/fishstats/commercial-fisheries/landings-in-florida/, accessed August 2017.
FWC and SFWMD (Florida Fish and Wildlife Conservation Commission and South Florida Water Management District). 1999. Benthic habitats of Estero Bay area, Florida 1999 Geoform. https://catalog.data.gov/dataset/benthic-habitats-of-estero-bay-area-florida-1999-geoform, accessed June 2017.
Geselbracht L, Graves A, Birch A. 2017. Trabue Harborwalk Oyster Habitat Restoration Project:

Oyster Integrated Mapping and Monitoring Program Report for the State of Florida 113
overview and one-year monitoring results. The Nature Conservancy. Available from http://chnep.wateratlas.usf.edu/upload/documents/Trabue%20Oyster%20Project_Report__FINAL_9-20-17.pdf.
Geselbracht LL. 2016. Monitoring plan for created oyster reef at Trabue Harborwalk, city of Punta Gorda, Florida. October 2016 revision. The Nature Conservancy.
Goodman LR, Lewis MA, Macauley JM, Smith R Jr, Moore JC. 1999. Preliminary survey of chemical contaminants in water, sediment, and aquatic biota at selected sites in northeastern Florida Bay and canal C-111. Gulf of Mexico Science 17:1–6.
Harris BA, Haddad KD, Steidinger KA, Huff JA. 1983. Assessment of fisheries habitat: Charlotte Harbor and Lake Worth, Florida. St. Petersburg, FL: Florida Department of Natural Resources. Final Report. Available from https://fgcu.digital.flvc.org/islandora/object/fgcu%3A27188, accessed January 2018.
Hoegh-Guldberg O, Bruno JF. 2010. The impact of climate change on the world’s marine ecosystems. Science 328:1523–1528.
Huber WC, Bedford BL, Blum LK, Boesch DF, et al. 2006. Progress toward restoring the Everglades: the first biennial review. Washington, D.C: National Research Council. The National Academies Press. Available from https://www.nap.edu/read/11754/chapter/16#235, accessed April 2017.
Kimbrough KL, Johnson WE, Lauenstein GG, Christensen JD, Apeti DA. 2008. An assessment of two decades of contaminant monitoring in the nation’s coastal zone. Silver Spring, MD. NOAA Technical Memorandum NOS NCCOS 74. Available from https://coastalscience.noaa.gov/data_reports/an-assessment-of-two-decades-of-contaminant-monitoring-in-the-nations-coastal-zone/, accessed September 2018.
Laakkonen, KS. 2014. Effects of salinity and other stressors on eastern oyster (Crassostrea virginica) health and a determination of restoration potential in Naples Bay, Florida [master’s thesis]. Fort Myers, FL: Florida Gulf Coast University. Available from https://fgcu.digital.flvc.org/islandora/object/fgcu%3A27276/datastream/OBJ/view/EFFECTS_OF_SALINITY_AND_OTHER_STRESSORS_ON_EASTERN_OYSTER__CRASSOSTREA_VIRGINICA__HEALTH_AND_A_DETERMINATION_OF_RESTORATION_POTENTIAL_IN_NAPLES_BAY__FLORIDA_.pdf, accessed June 2017
La Peyre MK, Nickens AD, Volety AK, Tolley GS, La Peyre JF. 2003. Environmental significance of freshets
in reducing Perkinsus marinus infection in eastern oysters Crassostrea virginica: potential management applications. Marine Ecology Progress Series 248:165–176.
Mackin JG. 1962. Oyster diseases caused by Dermocystidium marinum and other microorganisms in Louisiana. University of Texas, Publications of the Institute of Marine Science 7:132–229.
Miller AW, Reynolds AC, Sobrino C, Riedel GF. 2009. Shellfish face uncertain future in high CO2 world: influence of acidification on oyster larvae calcification and growth in estuaries. PLOS ONE 4(5):e5661.
NWI (National Wetlands Inventory). 1999. NWI surface waters and wetlands mapper. Available from https://www.fws.gov/wetlands/data/Mapper.html, accessed June 2017.
Photo Science. 2007. Historic coastal Charlotte Harbor benthic habitat map. Charlotte Harbor National Estuary Program, FY06 Technical Project final map and database.
Rodriguez AB, Fodrie FJ, Ridge JT, Lindquist NL, et al. 2014. Oyster reefs can outpace sea-level rise. Nature Climate Change 4:493–497.
Savarese M, Loh AN, Trefry JH. 2004a. Environmental and hydrologic history of Estero Bay: implications for watershed management and restoration. Fort Myers, FL: Florida Gulf Coast University and Florida Institute of Technology, submitted to the South Florida Water Management District. Available from https://my.sfwmd.gov/portal/page/portal/pg_grp_sfwmd_sfer/portlet_prevreport/2006_sfer/volume1/appendices/v1_app_12-5.pdf.
Savarese M, Dellapenna T, Volety A. 2004b. Preliminary study of the sedimentary surface and subsurface of Naples Bay and the Ten Thousand Islands using acoustic geophysical techniques. West Palm Beach, FL: South Florida Water Management District. Available from https://www.sfwmd.gov/sites/default/files/documents/chirp%20study%20substratemapfinalreport_1.pdf.
Savarese M, Fielder B, Dellapenna T. 2006. Substrate and subsurface mapping of Naples Bay using geophysical techniques: implications for oyster reef restoration. West Palm Beach, FL: South Florida Water Management District. Available from https://www.sfwmd.gov/sites/default/files/documents/naplessubstratefinalreport0706.pdf and https://www.sfwmd.gov/sites/default/files/documents/naplesbaysubstratereportfigs.pdf.
Scheda Ecological Associates Inc. 2015. Rookery Bay watershed engineering research project. Rookery

114 Radabaugh, Geiger, and Moyer, editors
Bay, FL: Rookery Bay National Estuarine Research Reserve. Task 3.6.3 – final report and map. Available from https://rookerybay.org/images/learn/research-rm/RestoreRB_docs/7-Benthic.habitat.map.Task3.6.3FinalReport.pdf.
Schmid JR, Worley K, Addison DS, Zimmerman AR, Van Eaton A. 2006. Naples Bay past and present: a chronology of disturbance to an estuary. Fort Myers, FL: South Florida Water Management District. Final Report to the city of Naples. Available from https://www.sfwmd.gov/sites/default/files/documents/coswf_uf%20naplesbayfinalreport_feb2006.pdf.
SFWMD and USDA (South Florida Water Management District and U.S. Department of Agriculture). 2003. Southern Golden Gate Estates watershed planning assistance cooperative study. Naples, FL: South Florida Water Management District. Final Report. Available from https://www.sfwmd.gov/sites/default/files/documents/sgg_wpa_coop_stdy_oct_2003.pdf.
Shumway SE. 1996. Natural environmental factors. Kennedy VS, Newell RIE, Eble AF, editors. In: The eastern oyster: Crassostrea virginica. College Park, MD: Maryland Sea Grant College. p. 467–513.
Simpson B, Aaron R, Betz J, Hicks D, et al. 1979. The Naples Bay study. Naples, FL: The Collier County Conservancy.
Soderqvist LE, Patino E. 2010. Seasonal and spatial distribution of freshwater flow and salinity in the Ten Thousand Islands Estuary, Florida, 2007–2009. Reston, VA: U.S. Geological Survey. Data Series 501. Available from https://pubs.usgs.gov/ds/501/pdf/ds501_report.pdf.
SWFWMD (Southwest Florida Water Management District). 2016. Seagrass in 2016. GIS, maps and survey: shapefile library. West Palm Beach, FL: Southwest Florida Water Management District. Available from https://data-swfwmd.opendata.arcgis.com/, accessed April 2017.
Taylor JL. 1974. The Charlotte Harbor estuarine system. Florida Scientist 37:205–216.
Tolley SG, Volety AK. 2005. The role of oysters in habitat use of oyster reefs by resident fishes and decapod crustaceans. Journal of Shellfish Research 24:1007–1012.
USFWS (U.S. Fish and Wildlife Service). 2000. Ten Thousand Islands National Wildlife Refuge comprehensive conservation plan. Washington, DC: U.S. Fish and Wildlife Service. Available from https://catalog.data.gov/dataset/ten-thousand-islands-national-wildlife-refuge-comprehensive-conservation-plan, accessed April 2017.
VanderKooy S (ed.). 2012. The oyster fishery of the Gulf of Mexico, United States: a regional management plan – 2012 revision. Ocean Springs, MS: Gulf States Marine Fisheries Commission. Publication No. 202. Available from https://www.gsmfc.org/publications/GSMFC%20Number%20202.pdf.
Volety A, Arnold W, Barnes T, Sime P. 2008. American Oysters. Doren R, editor. In: Indicators for restoration: South Florida ecosystem restoration report to the south Florida ecosystem restoration task force from the science coordination group 2006. Miami, FL: p. 99–112. Available from https://evergladesrestoration.gov/content/documents/system_wide_ecological_indicators/2006_system_wide_ecological_indicators.pdf.
Volety AK, Haynes L. 2012. Oyster monitoring in the Caloosahatchee River and Estuary. Florida Gulf Coast University. West Palm Beach, FL: South Florida Water Management District. Annual report 2012. Available from https://141.232.10.32/pm/ssr_2014/docs/cre_oysters_2012.pdf.
Volety AK, Haynes L, Goodman P, Gorman P. 2014. Ecological condition and value of oyster reefs of the southwest Florida shelf ecosystem. Ecological Indicators 44:108–119.
Volety A, Savarese M. 2004. GIS oyster reef mapping in the Caloosahatchee River and Estero Bay. West Palm Beach, FL: South Florida Water Management District. Technical report.
Volety AK, Savarese M, Hoye B, Loh AN. 2009a. Landscape pattern: present and past distribution of oysters in south Florida coastal complex (Whitewater Bay/Oyster Bay/Shark to Robert’s Rivers). Florida Gulf Coast University. West Palm Beach, FL: South Florida Water Management District. Available from https://www.researchgate.net/publication/234025368_Landscape_Pattern_Present_and_Past_Distribution_of_Oysters_in_South_Florida_Coastal_Complex_Whitewater_BayOyster_BayShark_to_Robert’s_Rivers, accessed April 2017.
Volety AK, Savarese M, Tolley SG, Arnold WS, et al. 2009b. Eastern oysters (Crassostrea virginica) as an indicator for restoration of Everglades ecosystems. Ecological Indicators 9:S120–S136.
Volety AK, Tolley SG, Winstead J. 2003. Investigations into effects of seasonal and water quality parameters on oysters (Crassostrea virginica) and associated fish populations in the Caloosahatchee Estuary. West Palm Beach, FL: South Florida Water Management District. Interpretive report (Award #C 12412-A 1).

Oyster Integrated Mapping and Monitoring Program Report for the State of Florida 115
Woithe DC Inc., Brandt-Williams S. 2006. Naples Bay surface water improvement & management plan reconnaissance report. West Palm Beach, FL: South Florida Water Management District. Available from https://www.sfwmd.gov/sites/default/files/documents/naplesbayreconfinal_2006.pdf.
General references and additional regional informationCharlotte Harbor Water Atlas
http://www.chnep.wateratlas.usf.edu/ Charlotte Harbor National Estuary Program
http://www.chnep.org/ Conservancy of Southwest Florida
http://www.conservancy.org/ Comprehensive Everglades Restoration Program
http://evergladesrestoration.gov/ Everglades National Park
http://www.nps.gov/ever/index.htm Florida Coastal Everglades Long Term Ecological
Research Network: http://fcelter.fiu.edu/ Southwest Florida Regional Planning Council
http://www.swfrpc.org/
South Florida coastal salinity status http://publicfiles.dep.state.fl.us/owp/SalinityReports/SalinityUpdate.html
South Florida Water Management District http://www.sfwmd.gov/
Southwest Florida Water Management District http://www.swfwmd.state.fl.us/
Regional contacts Anne Birch, The Nature Conservancy, [email protected]
Melynda Brown, FDEP Florida Coastal Office, [email protected]
Stephanie Erickson, FDEP Florida Coastal Office, [email protected]
Lesli Haynes, Marine Resources Division, [email protected]
Eric Milbrandt, Marine Laboratory, Sanibel-Captiva Conservation Foundation, [email protected]
Thomas Ries, ESA, [email protected]