Embed Size (px)
Citation preview
Chapter 6 – Part 4 Chapter 6 – Part 4
Process Capability
Meaning of Process CapabilityMeaning of Process Capability
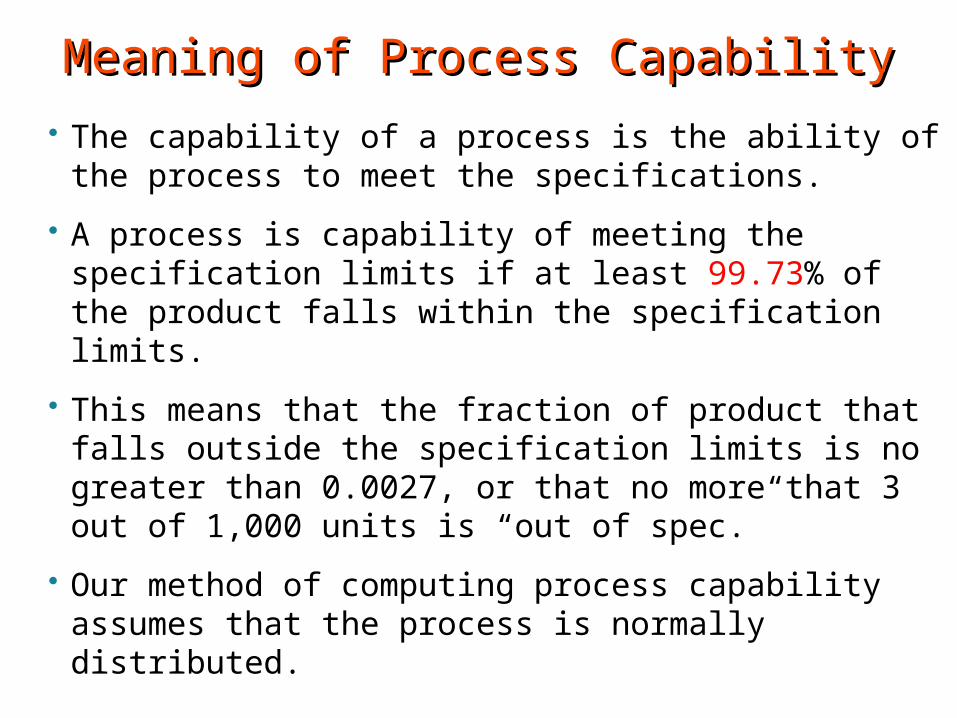
The capability of a process is the ability of the process to meet the specifications.
A process is capability of meeting the specification limits if at least 99.73% of the product falls within the specification limits.
This means that the fraction of product that falls outside the specification limits is no greater than 0.0027, or that no more that 3 out of 1,000 units is “out of spec.”
Our method of computing process capability assumes that the process is normally distributed.
Control Limits vs. Spec. LimitsControl Limits vs. Spec. Limits
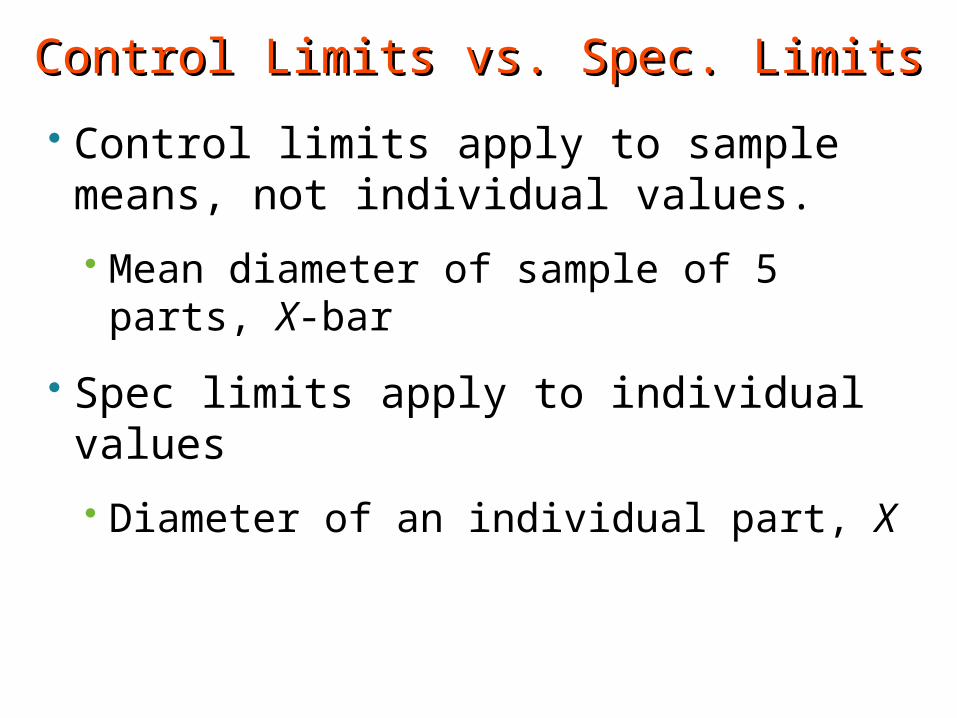
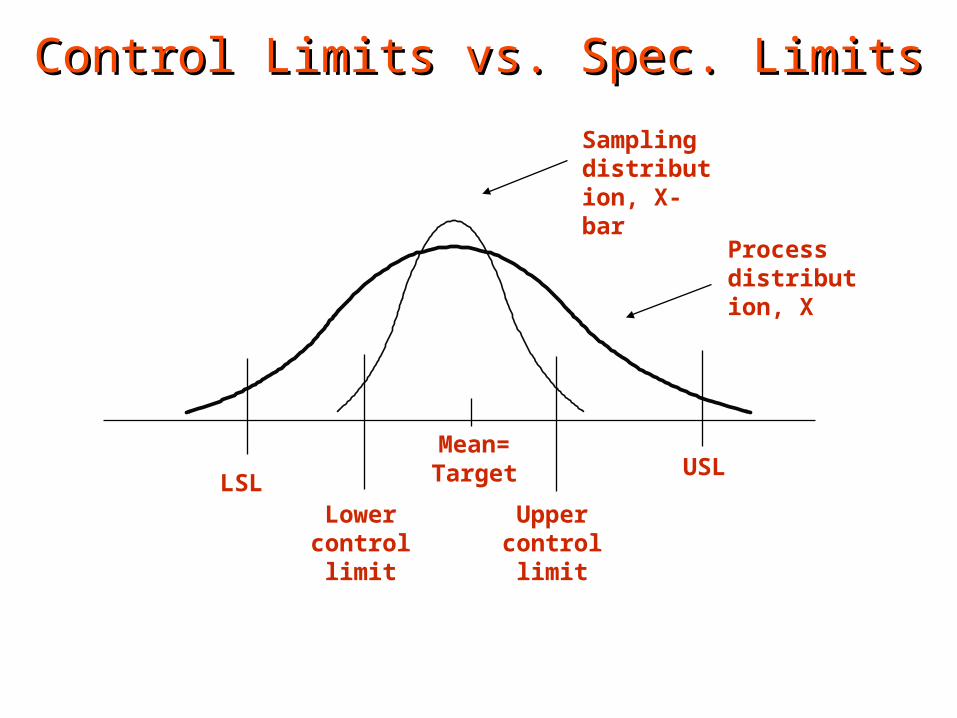
Control limits apply to sample means, not individual values.
Mean diameter of sample of 5 parts, X-bar
Spec limits apply to individual values
Diameter of an individual part, X
Control Limits vs. Spec. LimitsControl Limits vs. Spec. Limits
Samplingdistribution, X-bar
Processdistribution, X
Mean=Target
Lowercontrol
limit
Uppercontrol
limit
LSLUSL
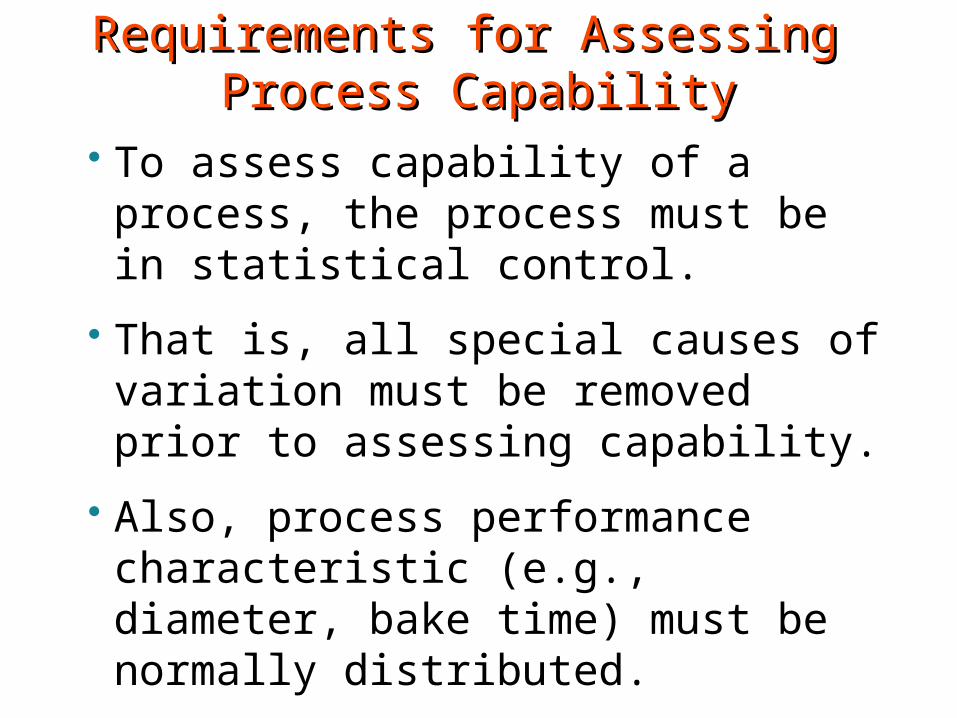
To assess capability of a process, the process must be in statistical control.
That is, all special causes of variation must be removed prior to assessing capability.
Also, process performance characteristic (e.g., diameter, bake time) must be normally distributed.
Requirements for Assessing Requirements for Assessing Process CapabilityProcess Capability
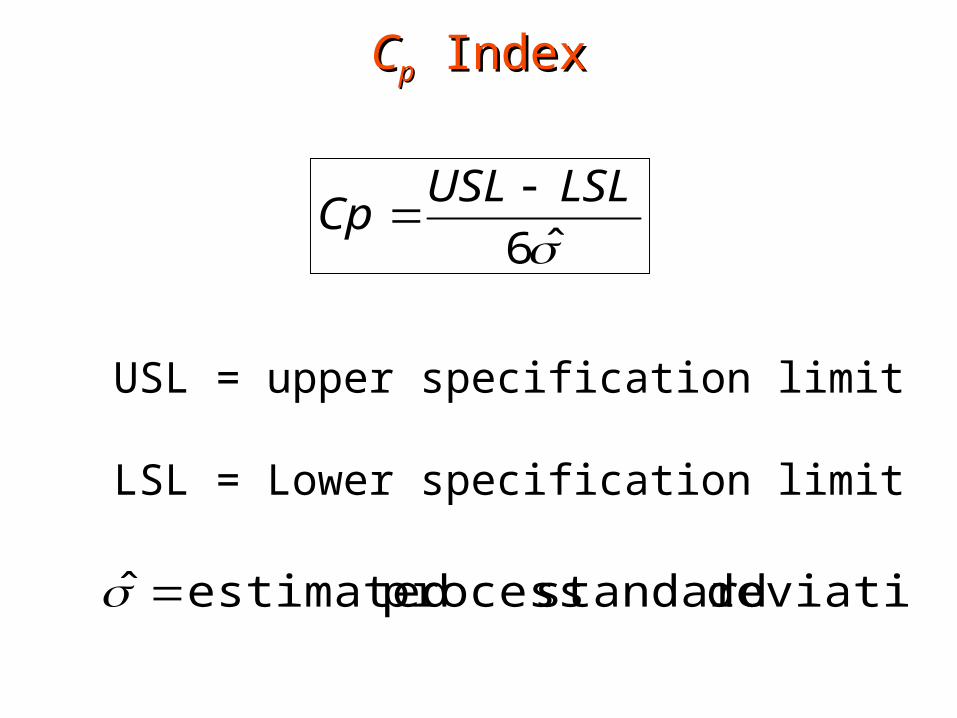
CCpp Index Index
6
LSLUSLCp
deviation standard process estimatedˆ
USL = upper specification limit
LSL = Lower specification limit
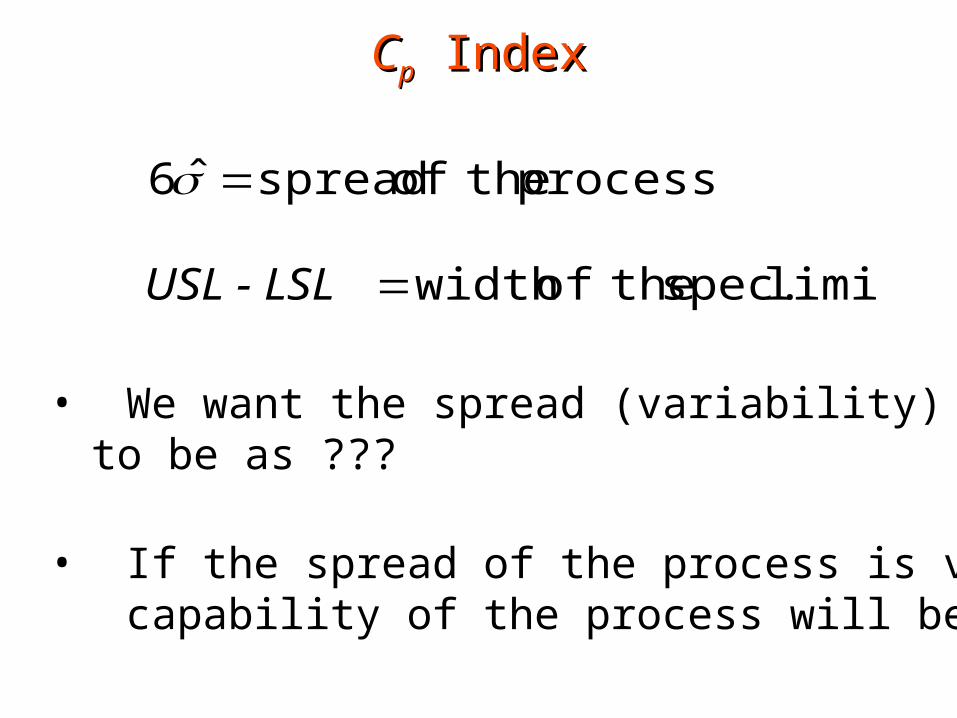
CCpp Index Index
limits spec. theofwidth
process theof spreadˆ6
USL - LSL
• We want the spread (variability) of the process to be as ???
• If the spread of the process is very ????, the capability of the process will be very ????
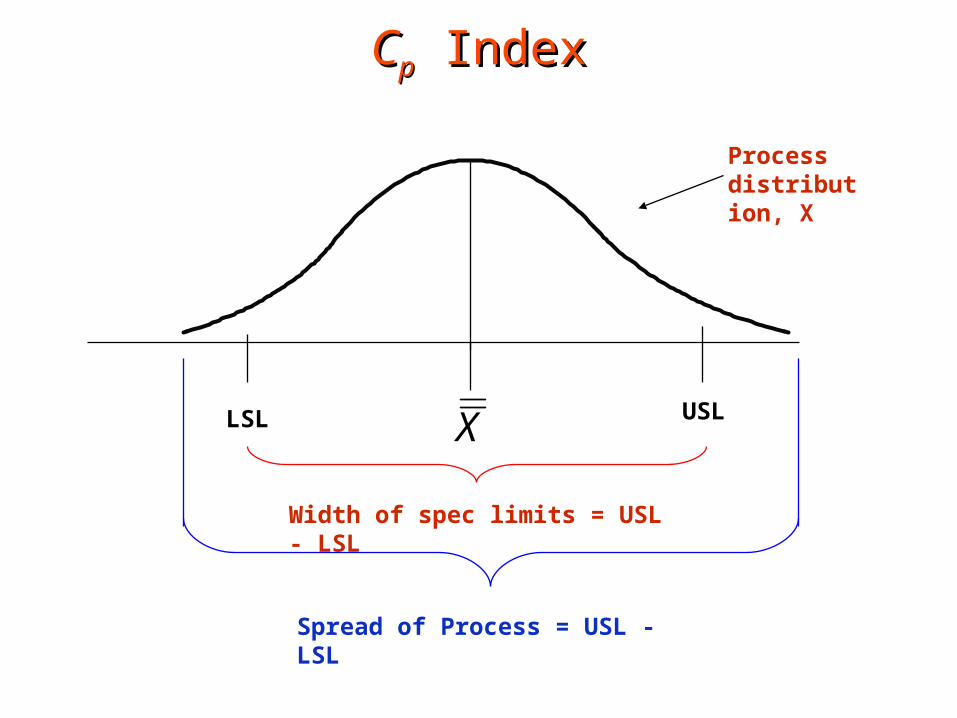
CCpp Index Index
Processdistribution, X
LSL USLX
Width of spec limits = USL - LSL
Spread of Process = USL - LSL
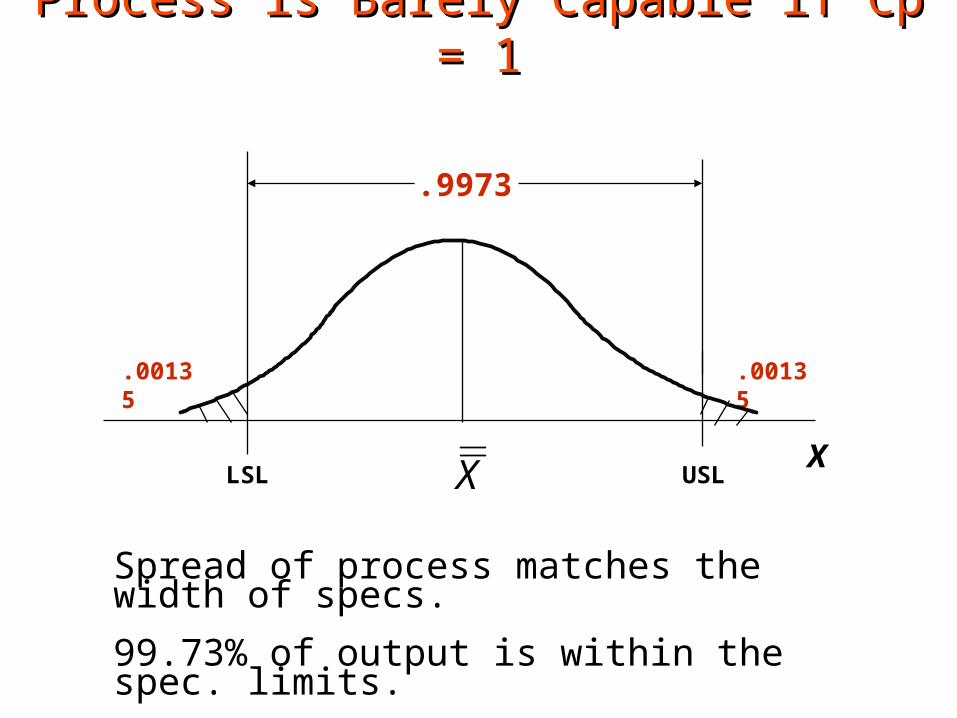
Process is Barely Capable if Cp = 1Process is Barely Capable if Cp = 1
X
.00135 .00135
LSL USL
.9973
X
Spread of process matches the width of specs. 99.73% of output is within the spec. limits.
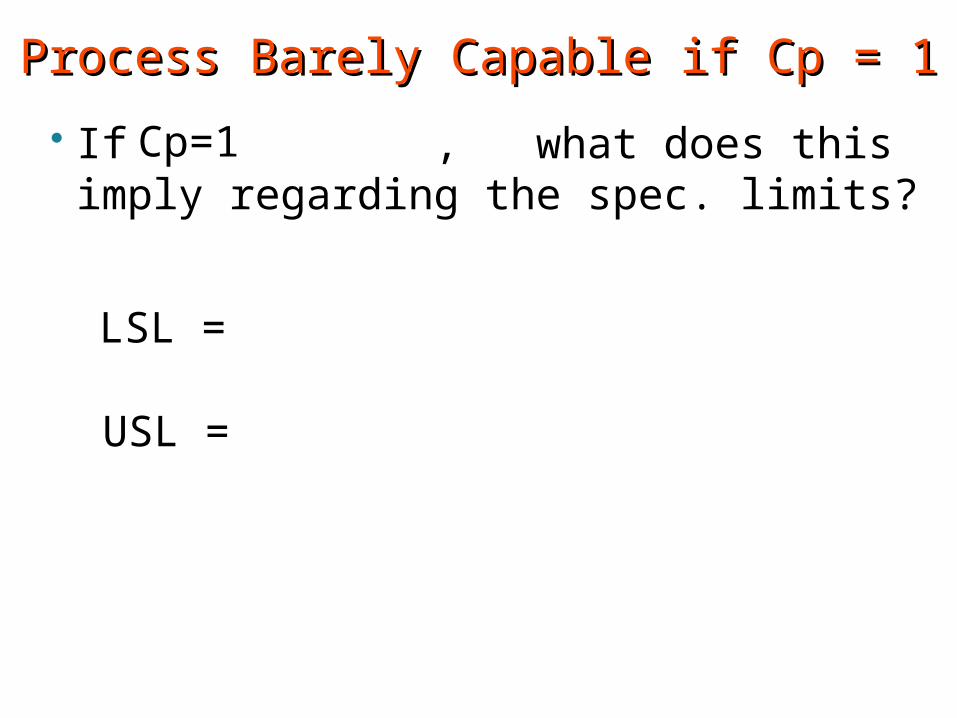
Process Barely Capable if Cp = 1Process Barely Capable if Cp = 1
If , what does this imply regarding the spec. limits?
Cp=1
LSL =
USL =
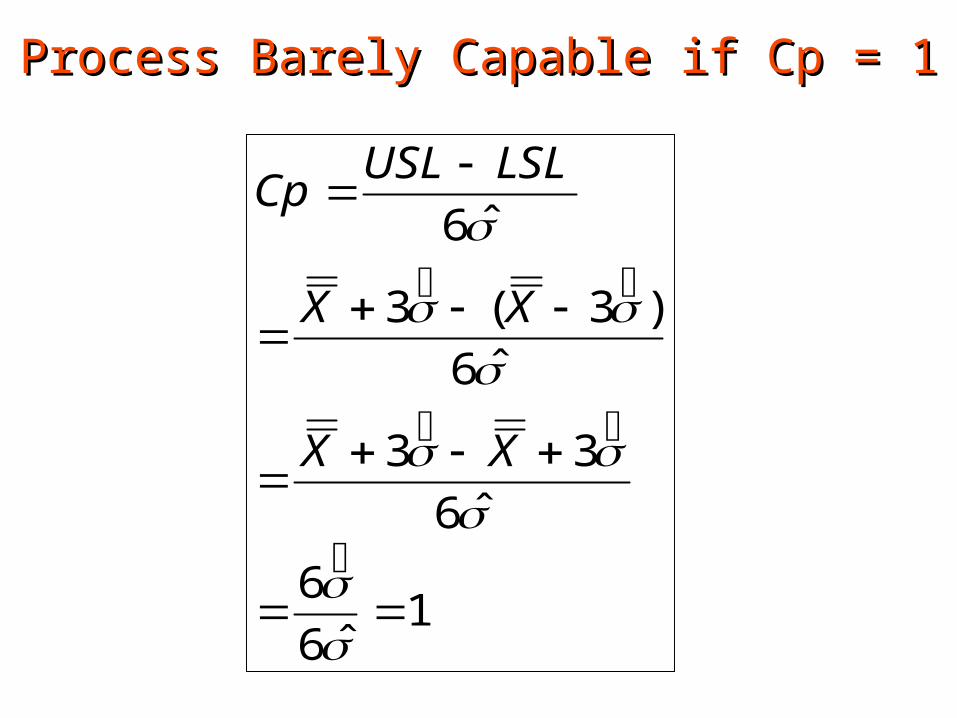
1ˆ6
6
ˆ6
33
ˆ6
)3(3
ˆ6
XX
XX
LSLUSLCp
Process Barely Capable if Cp = 1Process Barely Capable if Cp = 1
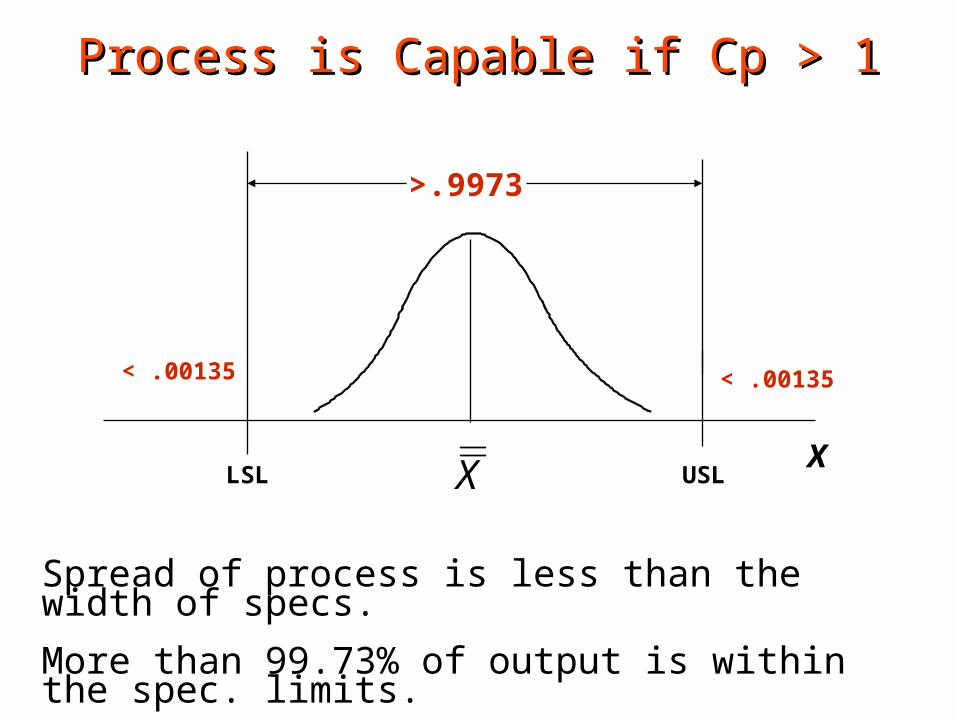
Process is Capable if Cp > 1Process is Capable if Cp > 1
X
< .00135 < .00135
LSL USL
>.9973
X
Spread of process is less than the width of specs. More than 99.73% of output is within the spec. limits.
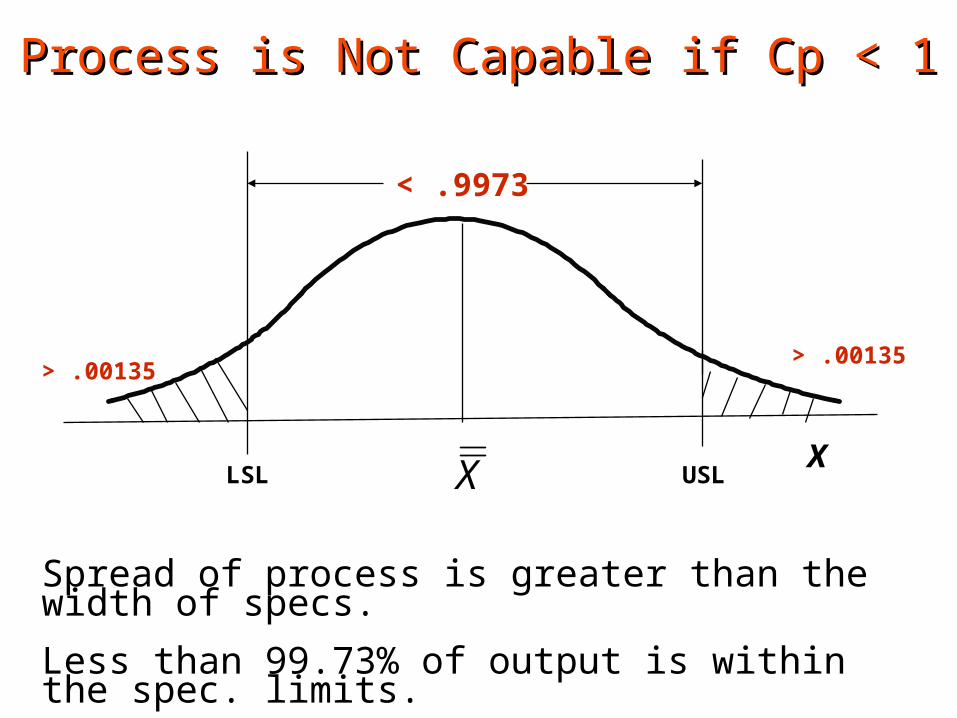
Process is Not Capable if Cp < 1Process is Not Capable if Cp < 1
X
> .00135> .00135
LSL USL
< .9973
X
Spread of process is greater than the width of specs. Less than 99.73% of output is within the spec. limits.
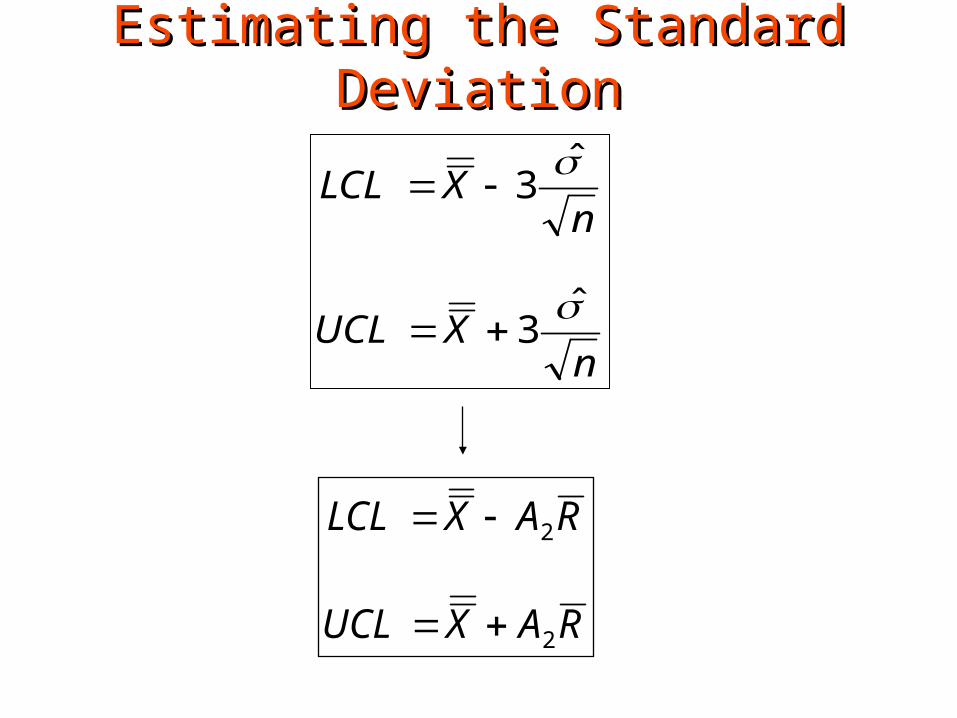
nXUCL
nXLCL
ˆ3
ˆ3
RAXUCL
RAXLCL
2
2
Estimating the Standard DeviationEstimating the Standard Deviation
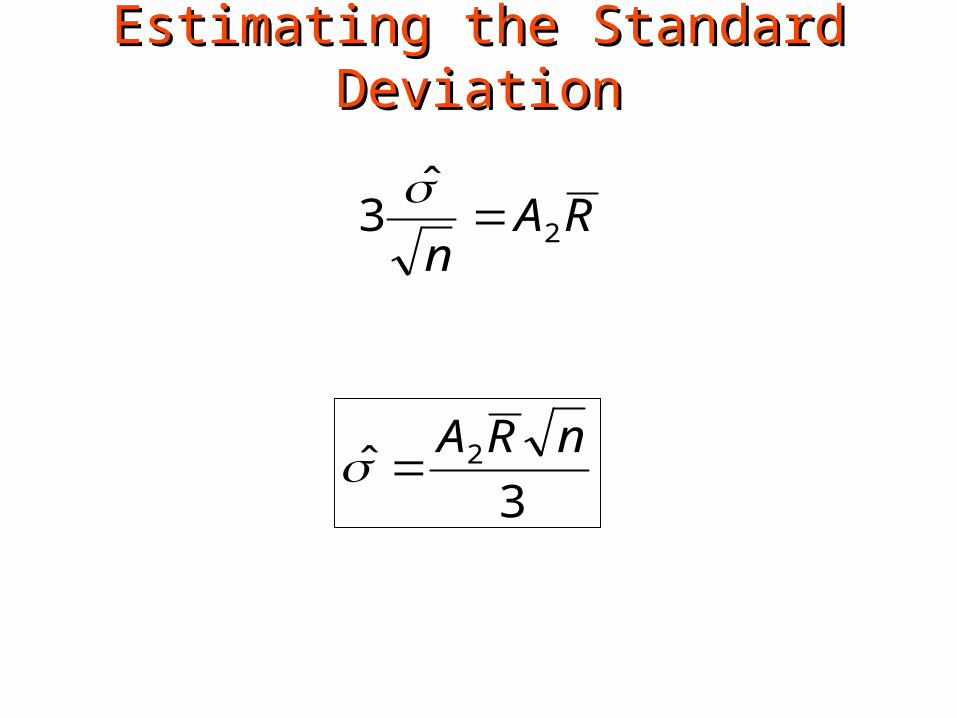
RAn
2
ˆ3
3ˆ 2 nRA
Estimating the Standard DeviationEstimating the Standard Deviation
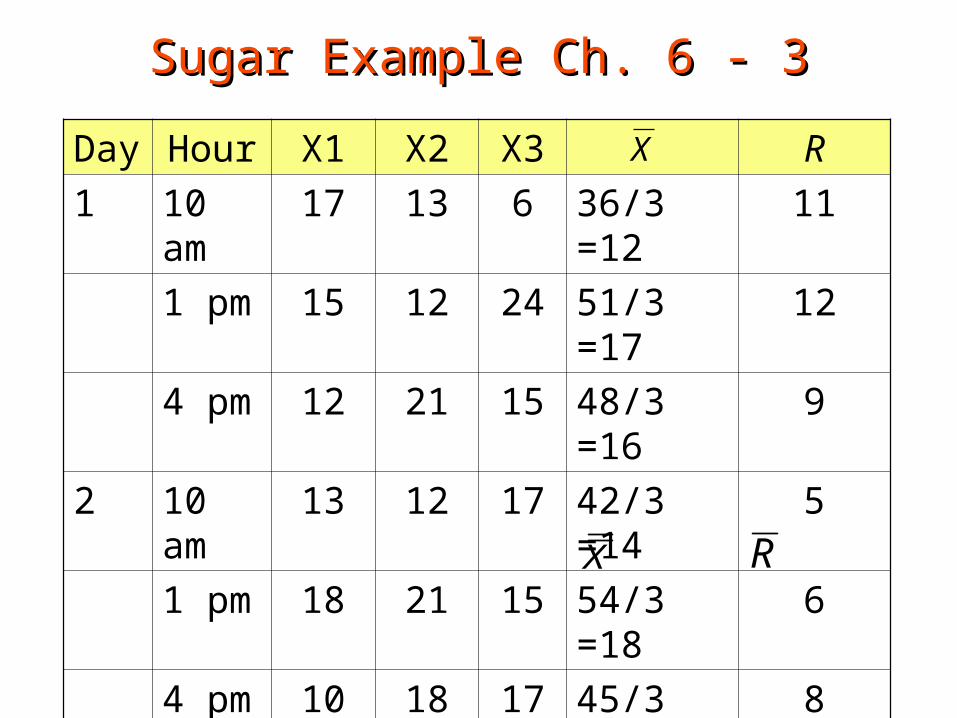
Day Hour X1 X2 X3 R
1 10 am 17 13 6 36/3 =12 11
1 pm 15 12 24 51/3 =17 12
4 pm 12 21 15 48/3 =16 9
2 10 am 13 12 17 42/3 =14 5
1 pm 18 21 15 54/3 =18 6
4 pm 10 18 17 45/3 =15 8
= 92/6
= 15.33
= 51/6
= 8.5
Sugar Example Ch. 6 - 3Sugar Example Ch. 6 - 3
X R
X
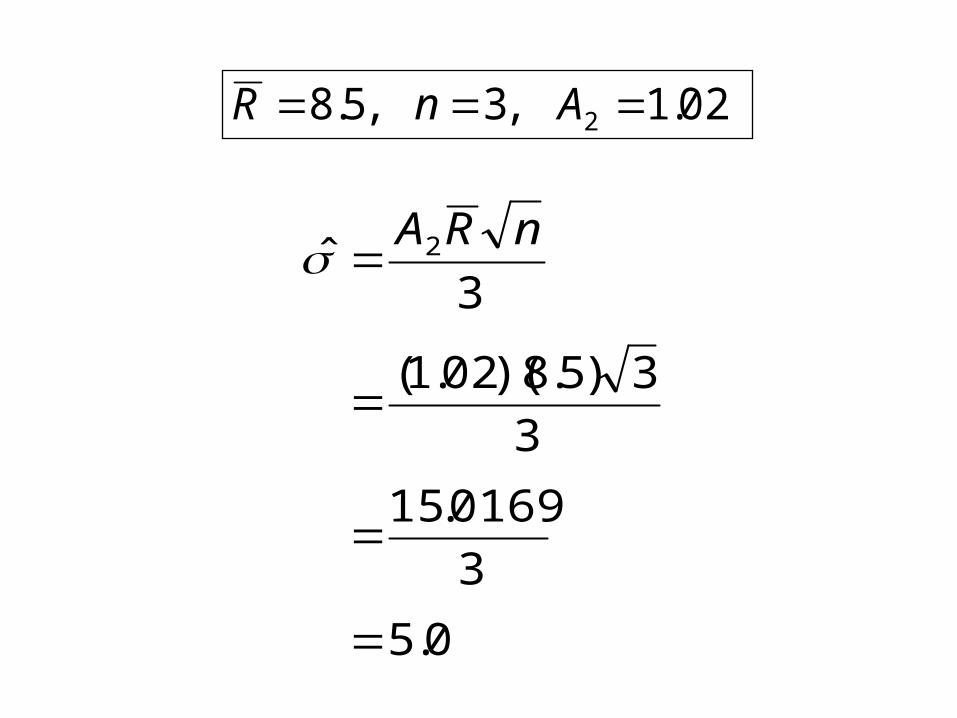
0.5
3
0169.15
3
3)5.8)(02.1(
3ˆ 2
nRA
02.1,3,5.8 2 AnR
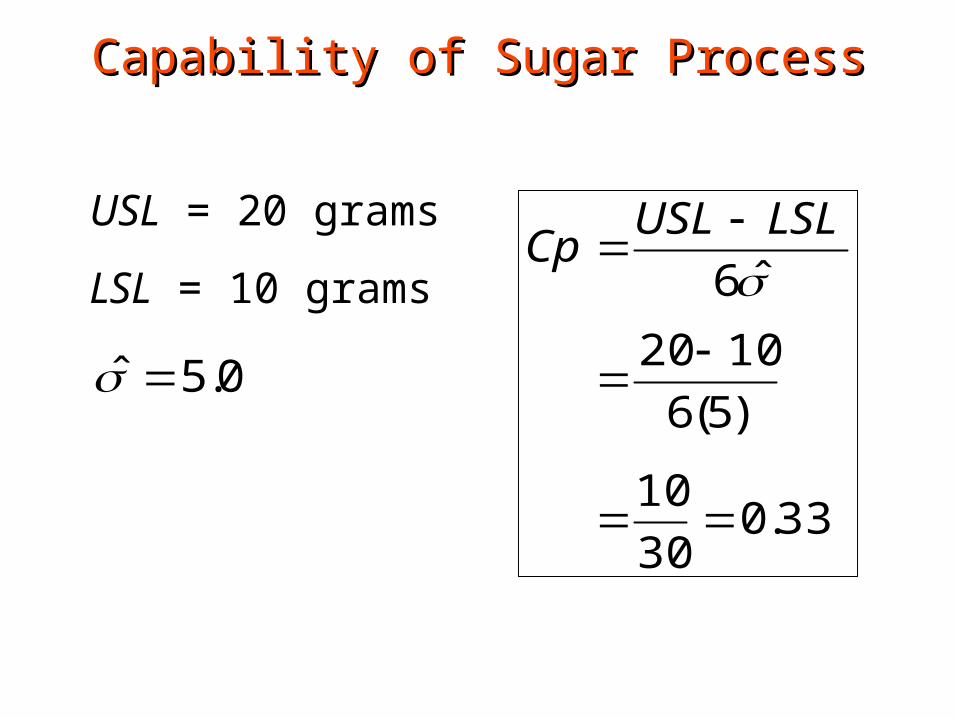
Capability of Sugar ProcessCapability of Sugar Process
33.030
10
)5(6
1020
ˆ6
LSLUSL
CpUSL = 20 grams
LSL = 10 grams
0.5ˆ
Capability of Sugar ProcessCapability of Sugar Process
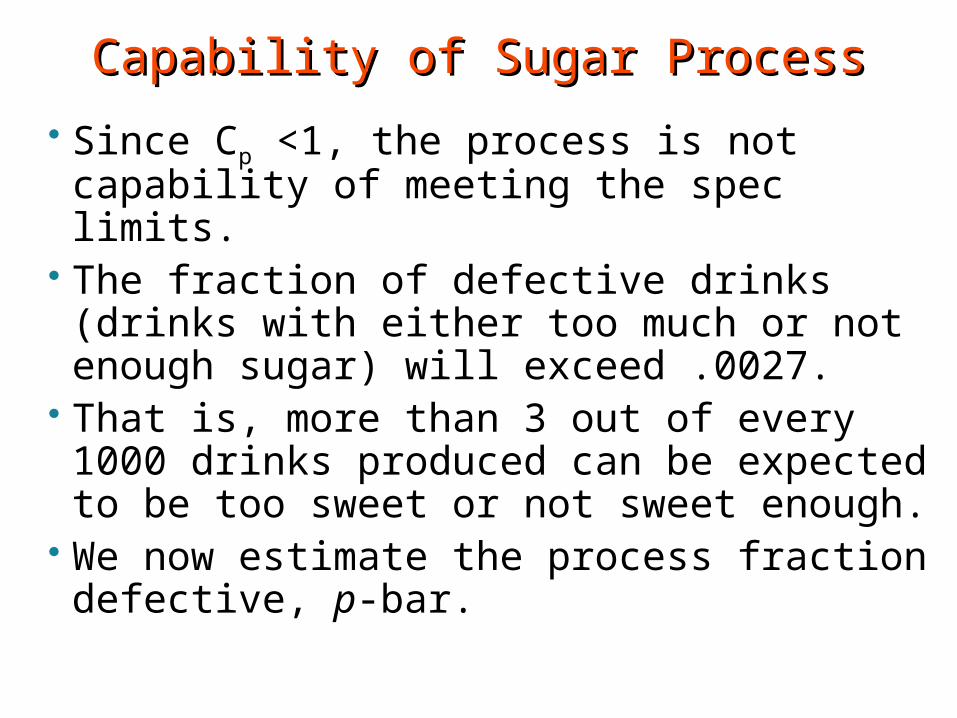
Since Cp <1, the process is not capability of meeting the spec limits.
The fraction of defective drinks (drinks with either too much or not enough sugar) will exceed .0027.
That is, more than 3 out of every 1000 drinks produced can be expected to be too sweet or not sweet enough.
We now estimate the process fraction defective, p-bar.
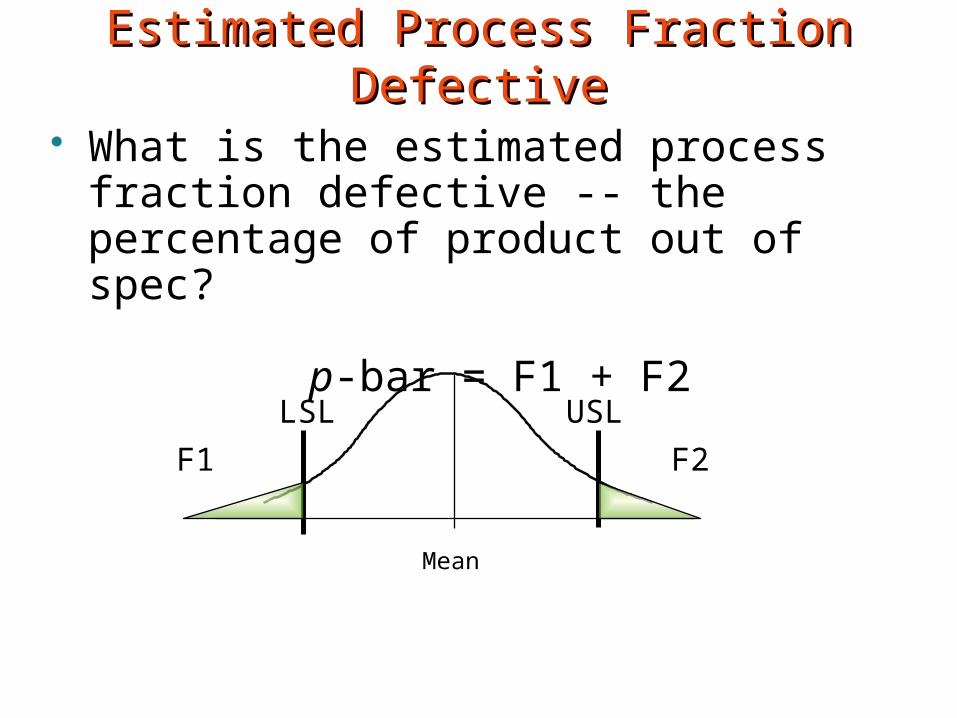
Estimated Process Fraction DefectiveEstimated Process Fraction Defective
What is the estimated process fraction defective -- the percentage of product out of spec?
p-bar = F1 + F2
Mean
LSL USL
F2F1
Estimated Process Fraction DefectiveEstimated Process Fraction Defective
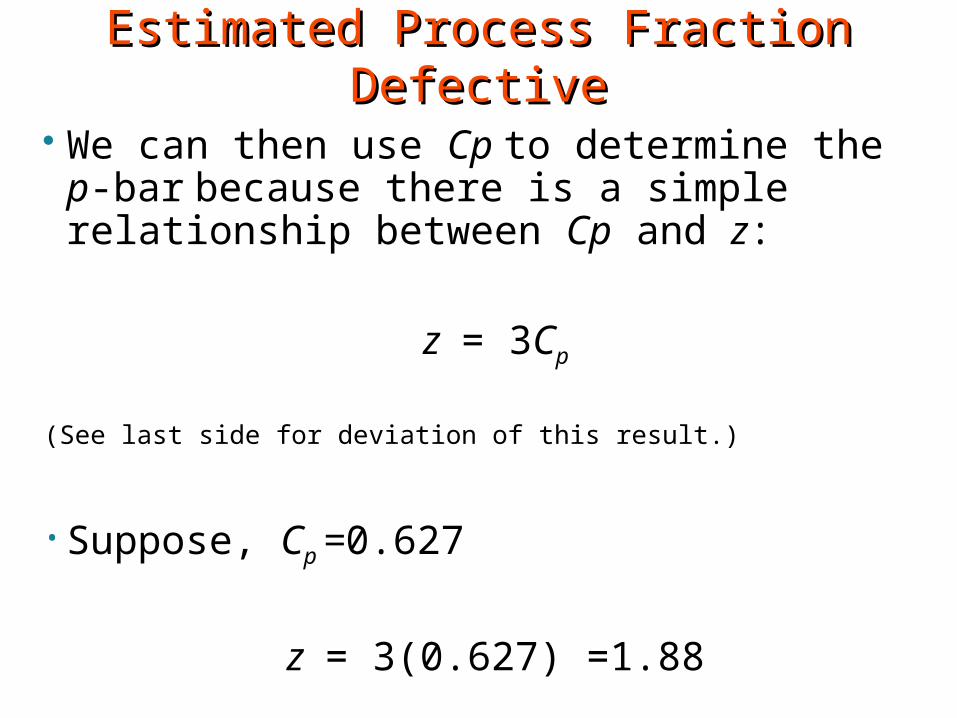
We can then use Cp to determine the p-bar because there is a simple relationship between Cp and z:
z = 3Cp
(See last side for deviation of this result.)
• Suppose, Cp =0.627
z = 3(0.627) =1.88
Estimated Process Fraction DefectiveEstimated Process Fraction Defective
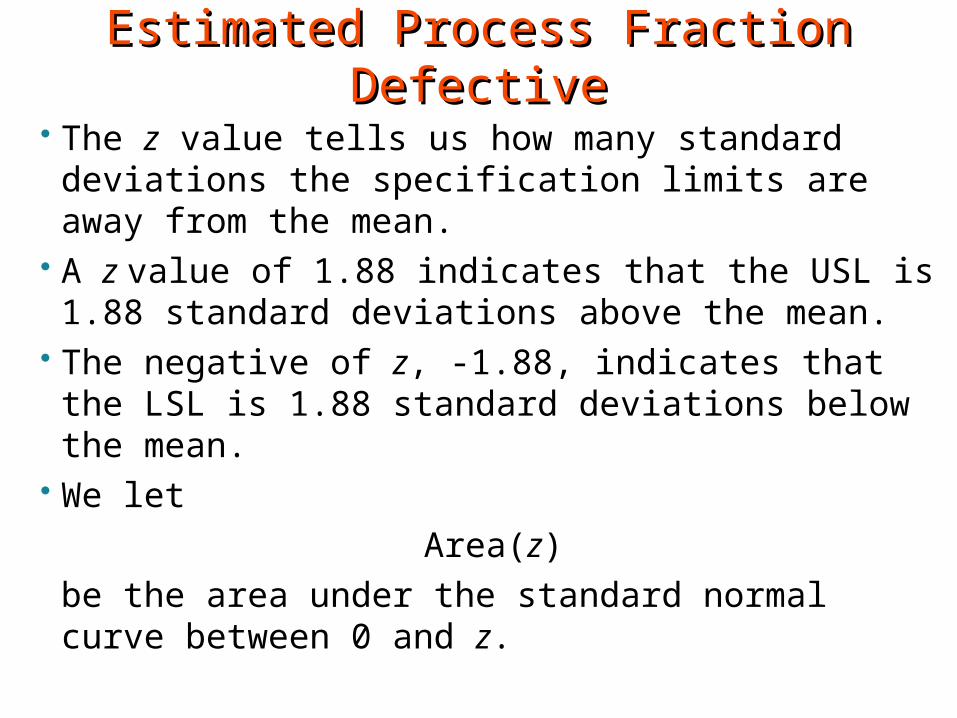
The z value tells us how many standard deviations the specification limits are away from the mean.
A z value of 1.88 indicates that the USL is 1.88 standard deviations above the mean.
The negative of z, -1.88, indicates that the LSL is 1.88 standard deviations below the mean.
We let
Area(z)
be the area under the standard normal curve between 0 and z.
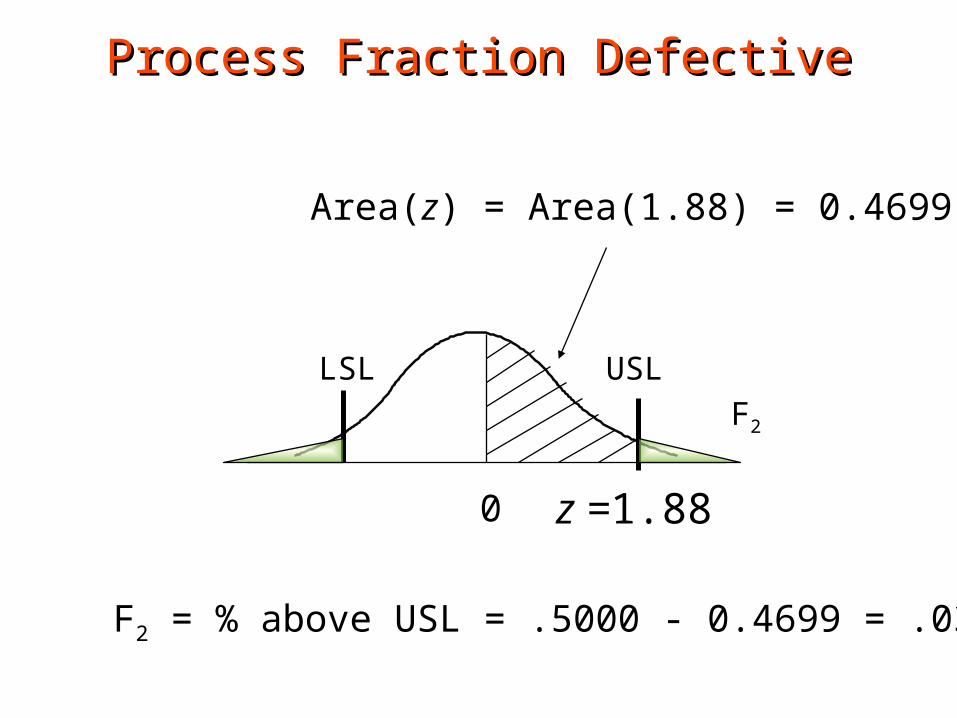
Process Fraction DefectiveProcess Fraction Defective
LSL USL
z =1.88
Area(z) = Area(1.88) = 0.4699
0
F2 = % above USL = .5000 - 0.4699 = .0301
F2
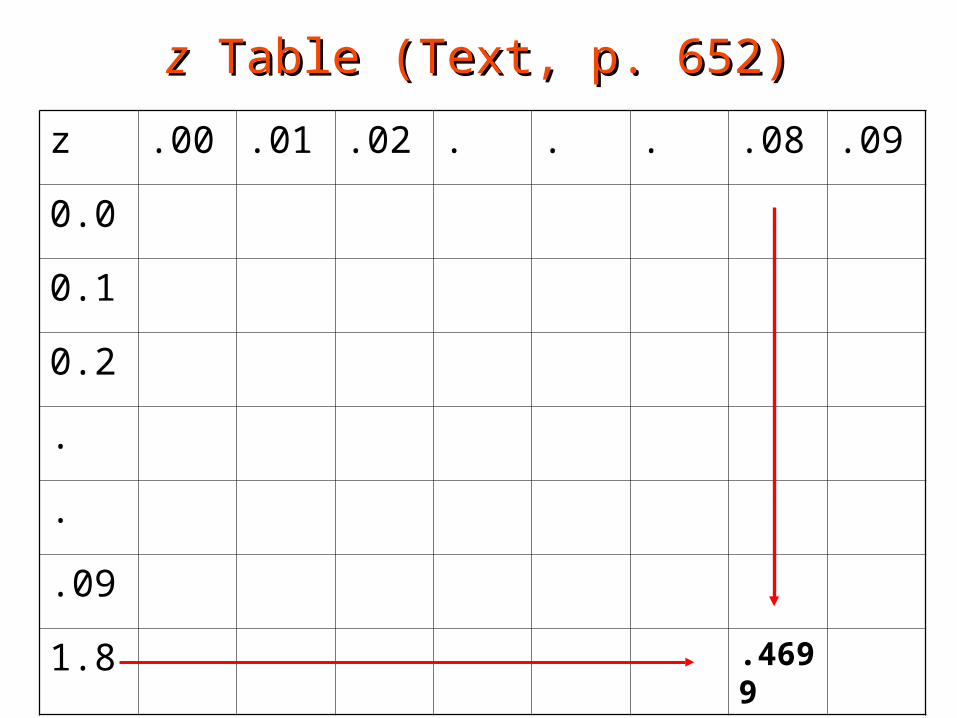
zz Table (Text, p. 652) Table (Text, p. 652)
z .00 .01 .02 . . . .08 .09
0.0
0.1
0.2
.
.
.09
1.8 .4699
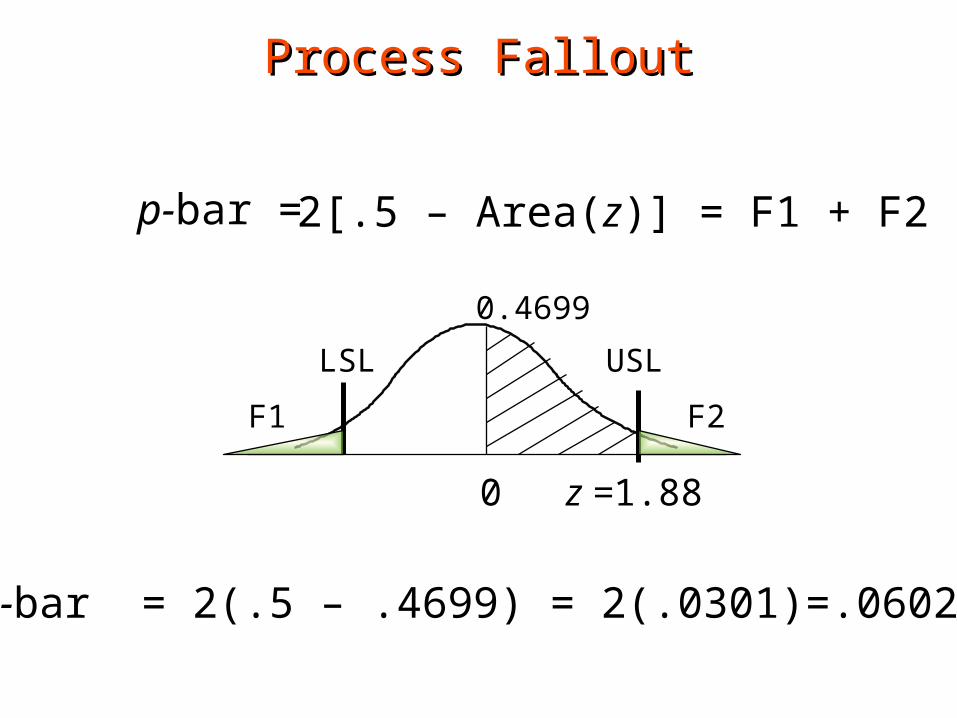
Process FalloutProcess Fallout
LSL USL
F2F1
0
p-bar =
p-bar = 2(.5 – .4699) = 2(.0301)=.0602
z =1.88
2[.5 – Area(z)] = F1 + F2
0.4699
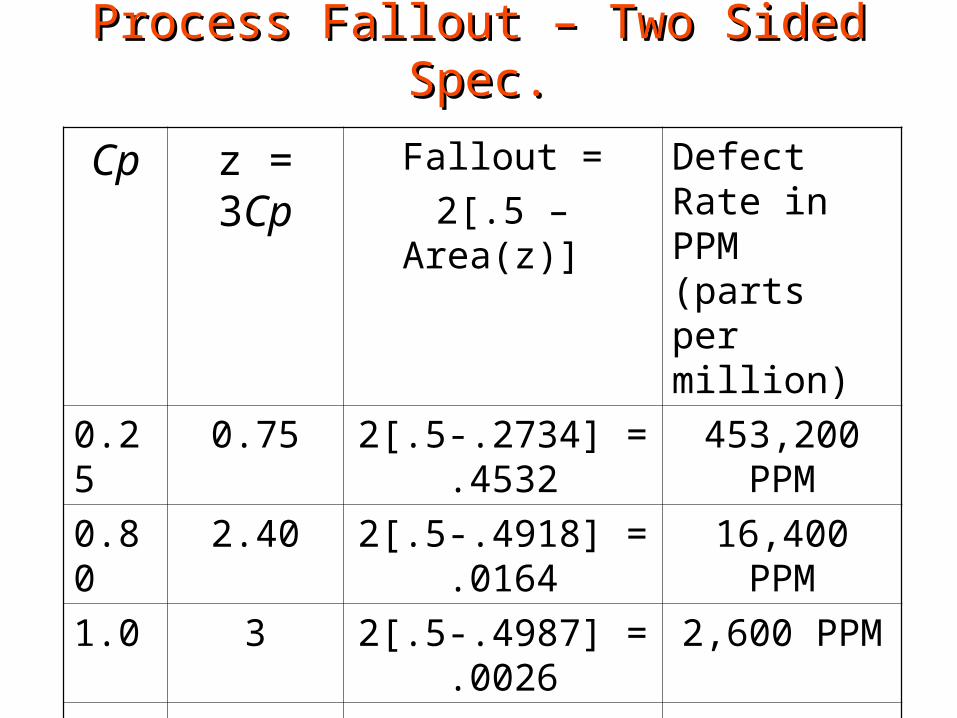
Process Fallout – Two Sided Spec.Process Fallout – Two Sided Spec.
Cp z = 3Cp Fallout =
2[.5 – Area(z)]
Defect Rate in PPM (parts per million)
0.25 0.75 2[.5-.2734] = .4532 453,200 PPM
0.80 2.40 2[.5-.4918] = .0164 16,400 PPM
1.0 3 2[.5-.4987] = .0026 2,600 PPM
1.5 -4.5
From Excel
2[Area(-z)]=
2[.0000034] =.0000068
7 PPM
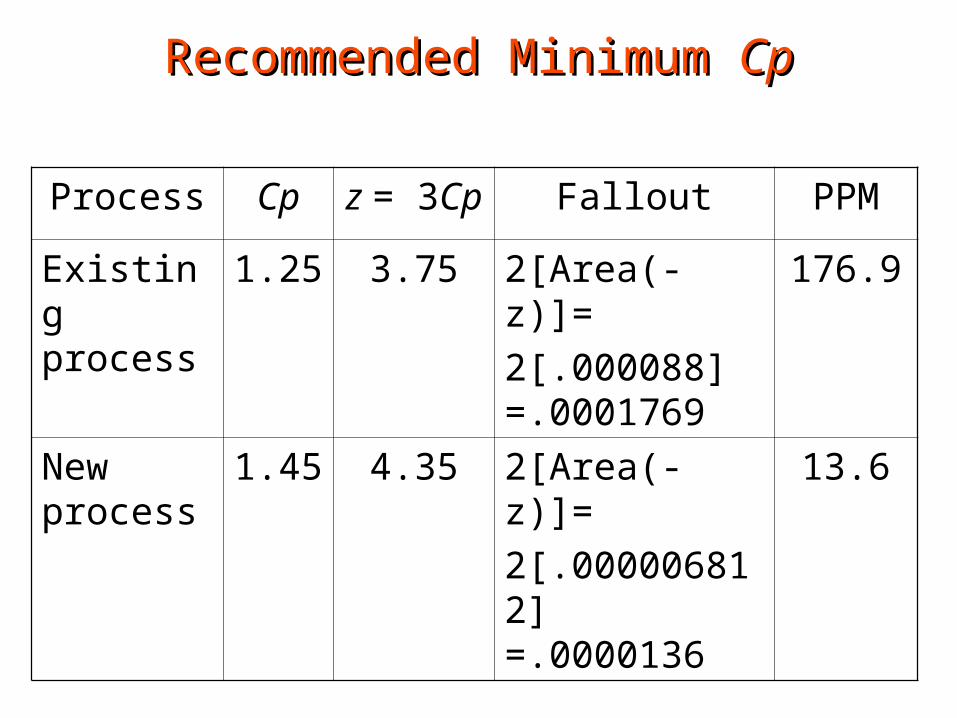
Recommended Minimum Recommended Minimum CpCp
Process Cp z = 3Cp Fallout PPM
Existing process
1.25 3.75 2[Area(-z)]=
2[.000088] =.0001769
176.9
New process
1.45 4.35 2[Area(-z)]=
2[.000006812] =.0000136
13.6
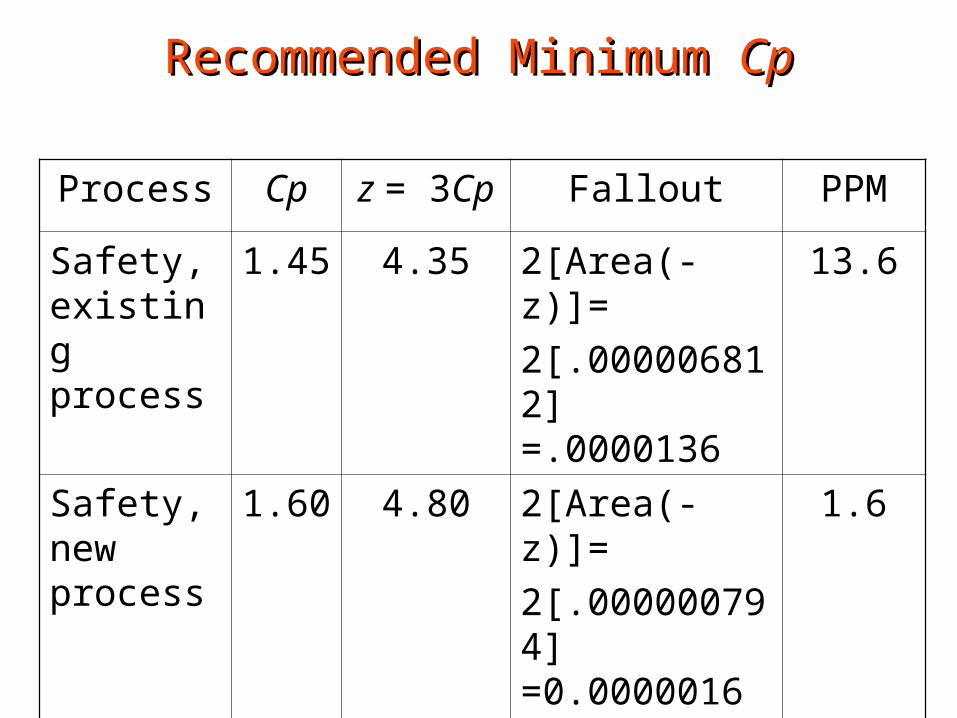
Process Cp z = 3Cp Fallout PPM
Safety, existing process
1.45 4.35 2[Area(-z)]=
2[.000006812] =.0000136
13.6
Safety, new process
1.60 4.80 2[Area(-z)]=
2[.000000794] =0.0000016
1.6
Recommended Minimum Recommended Minimum CpCp
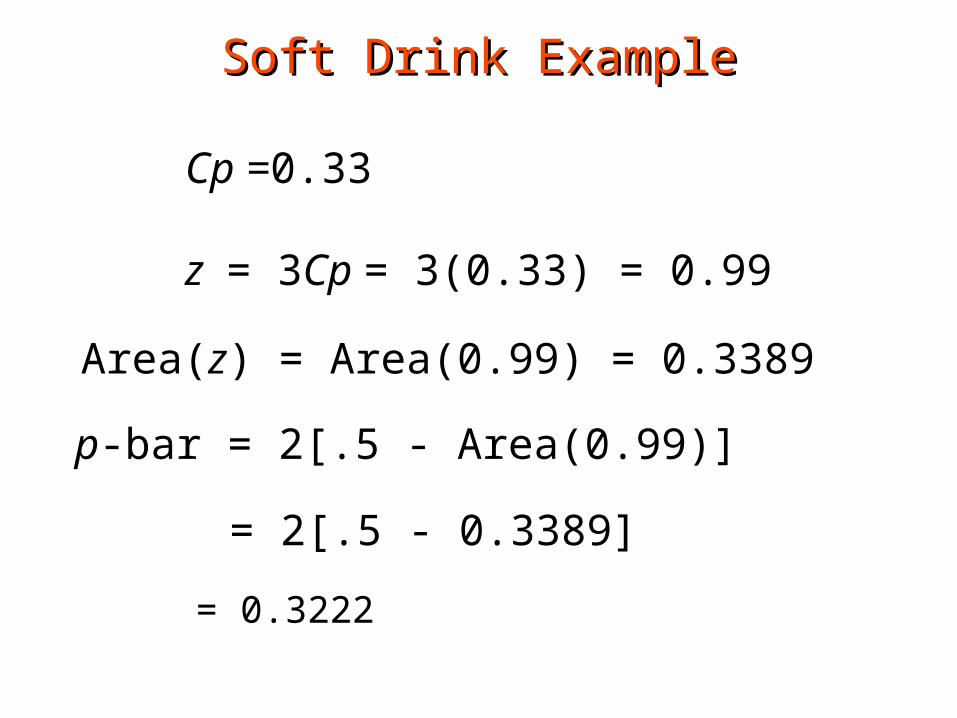
Soft Drink ExampleSoft Drink Example
Area(z) = Area(0.99) = 0.3389
Cp =0.33
z = 3Cp = 3(0.33) = 0.99
p-bar = 2[.5 - Area(0.99)]
= 2[.5 - 0.3389]
= 0.3222
Capability Index Based on TargetCapability Index Based on Target
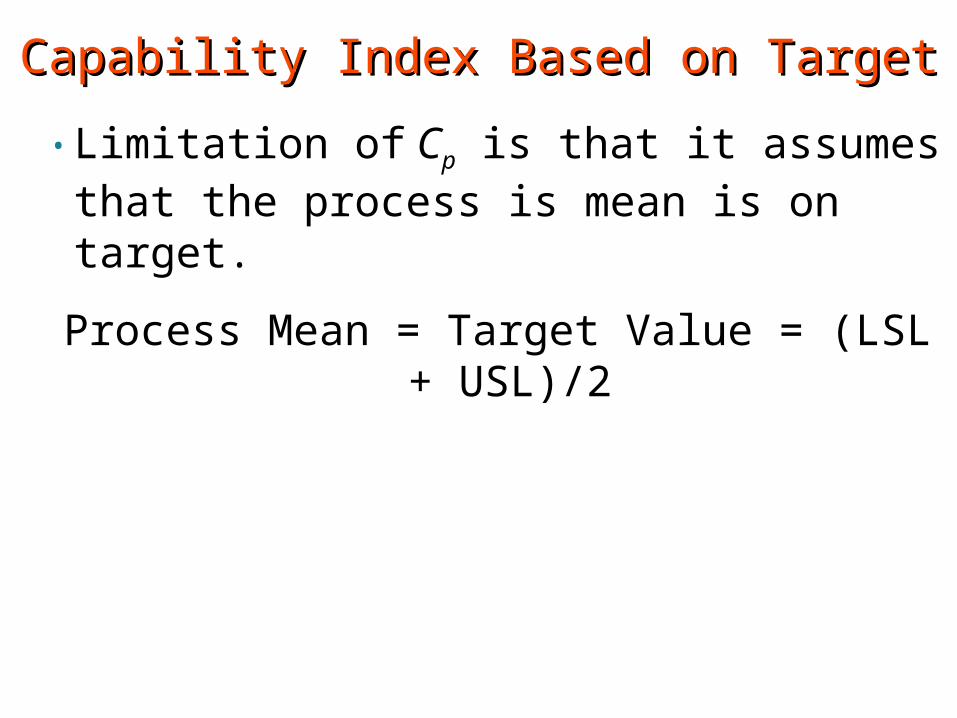
• Limitation of Cp is that it assumes that the process is mean is on target.
Process Mean = Target Value = (LSL + USL)/2
CCT T Capability IndexCapability Index
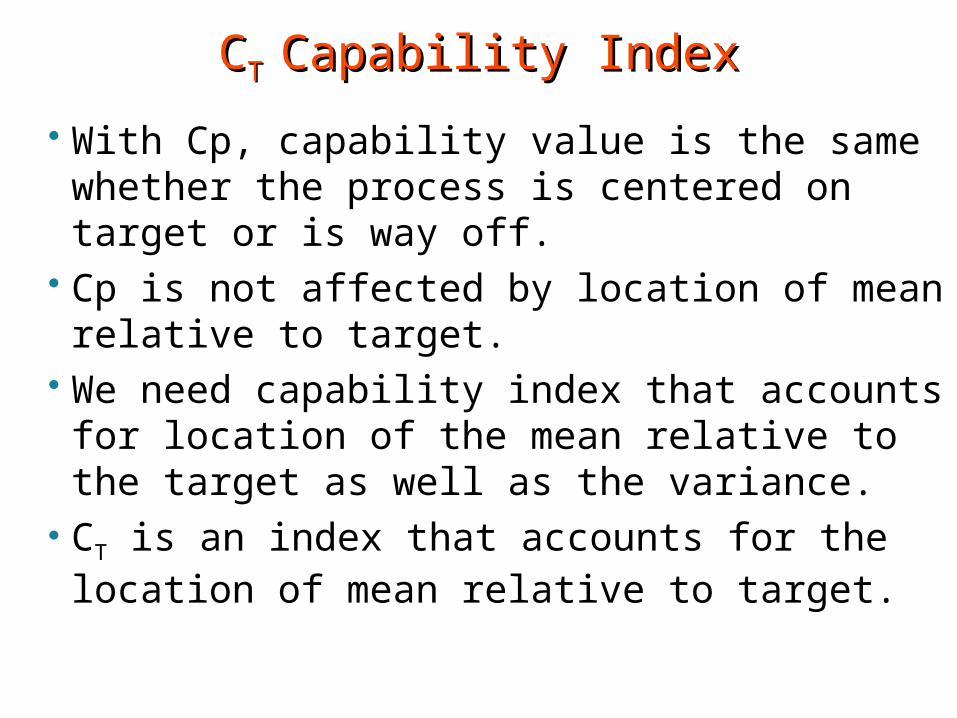
With Cp, capability value is the same whether the process is centered on target or is way off.
Cp is not affected by location of mean relative to target.
We need capability index that accounts for location of the mean relative to the target as well as the variance.
CT is an index that accounts for the location of mean relative to target.
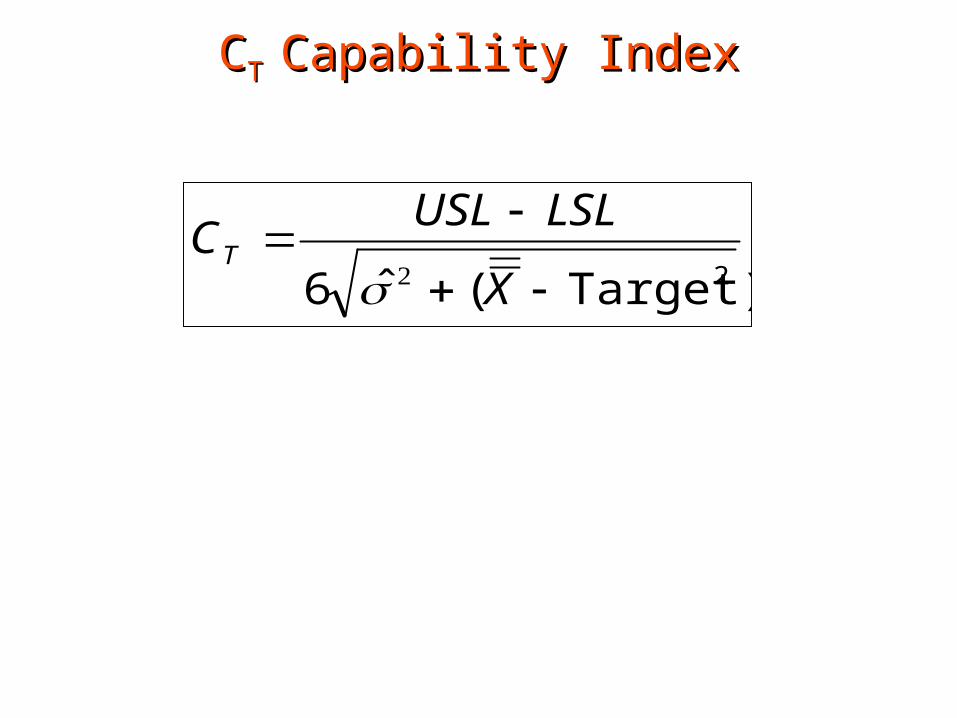
2Target)(ˆ6
X
LSLUSLCT
CCT T Capability IndexCapability Index
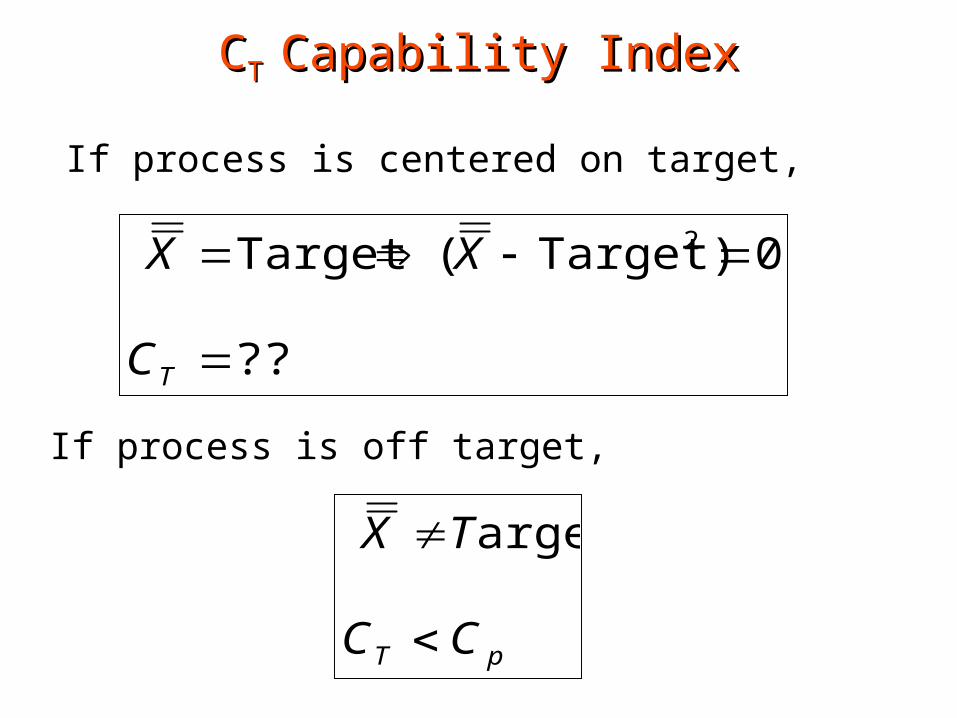
??
0Target)(Target 2
TC
XX
If process is centered on target,
CCT T Capability IndexCapability Index
If process is off target,
pT CC
TX
arget
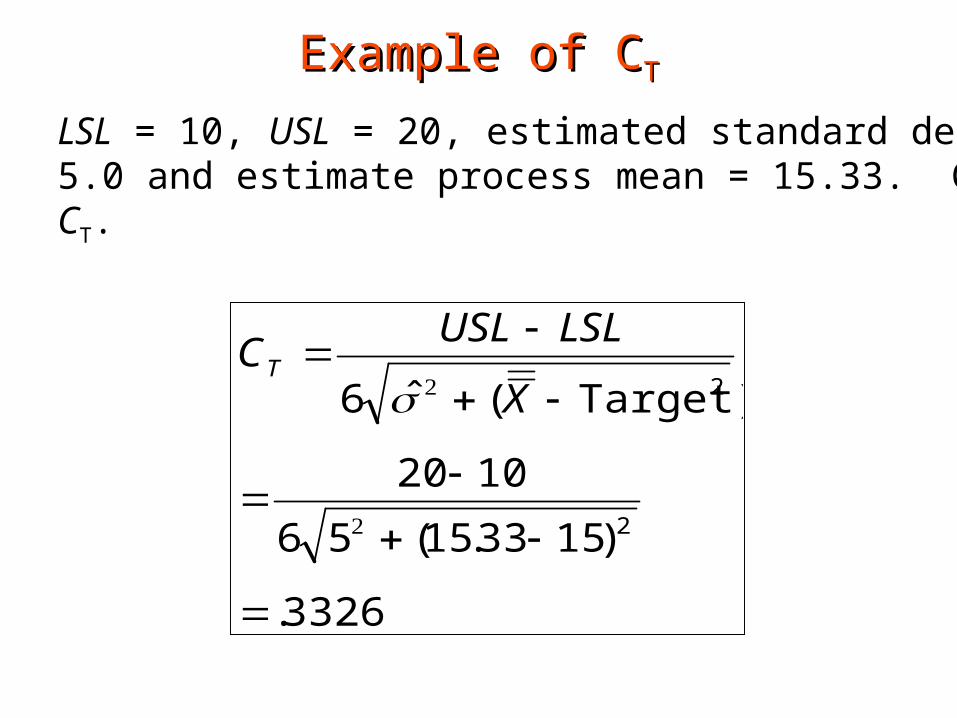
3326.
)1533.15(56
1020
Target)(ˆ6
2
2
X
LSLUSLCT
LSL = 10, USL = 20, estimated standard deviation =5.0 and estimate process mean = 15.33. ComputeCT.
Example of CExample of CTT
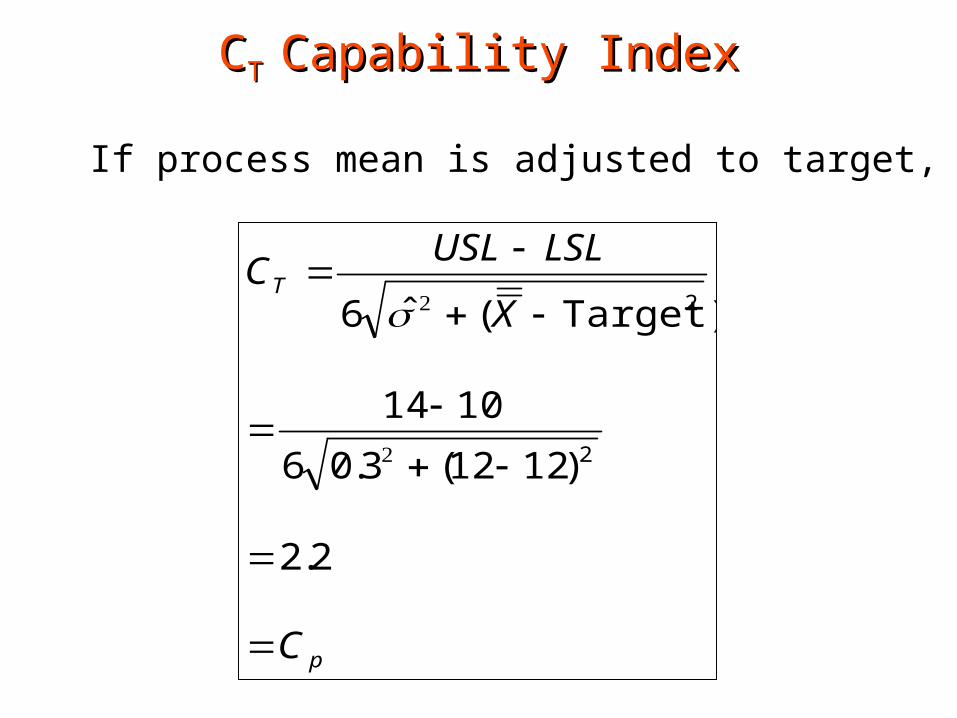
p
T
C
X
LSLUSLC
2.2
)1212(3.06
1014
Target)(ˆ6
2
2
If process mean is adjusted to target,
CCT T Capability IndexCapability Index
CCT T Capability IndexCapability Index
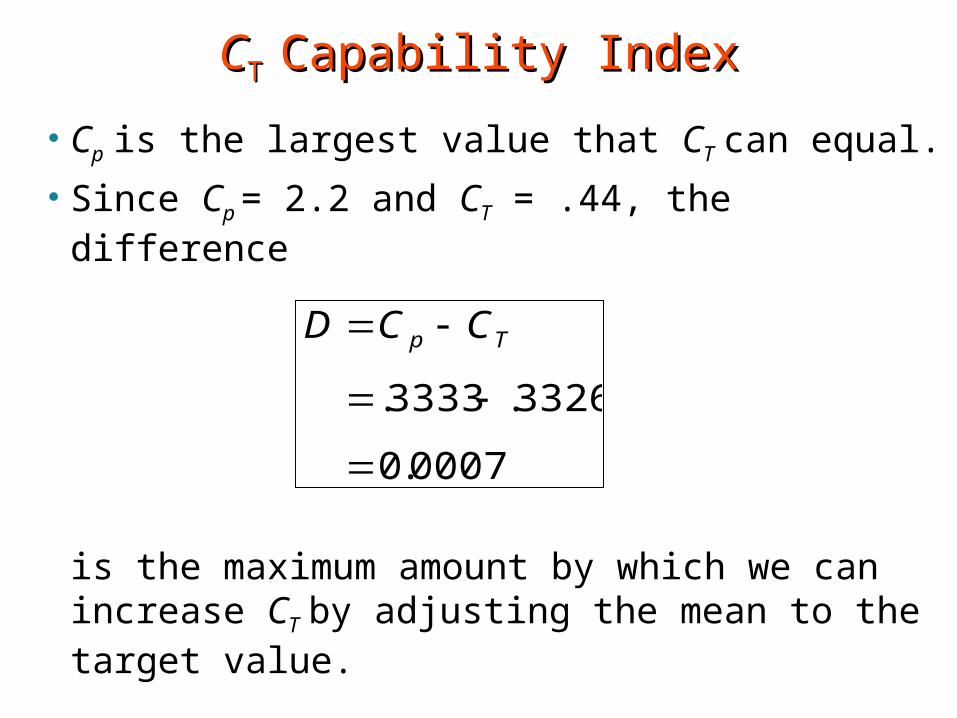
Cp is the largest value that CT can equal.
Since Cp = 2.2 and CT = .44, the difference
is the maximum amount by which we can increase CT by adjusting the mean to the target value.
0007.0
3326.3333.
Tp CCD
Conclusion?Conclusion?
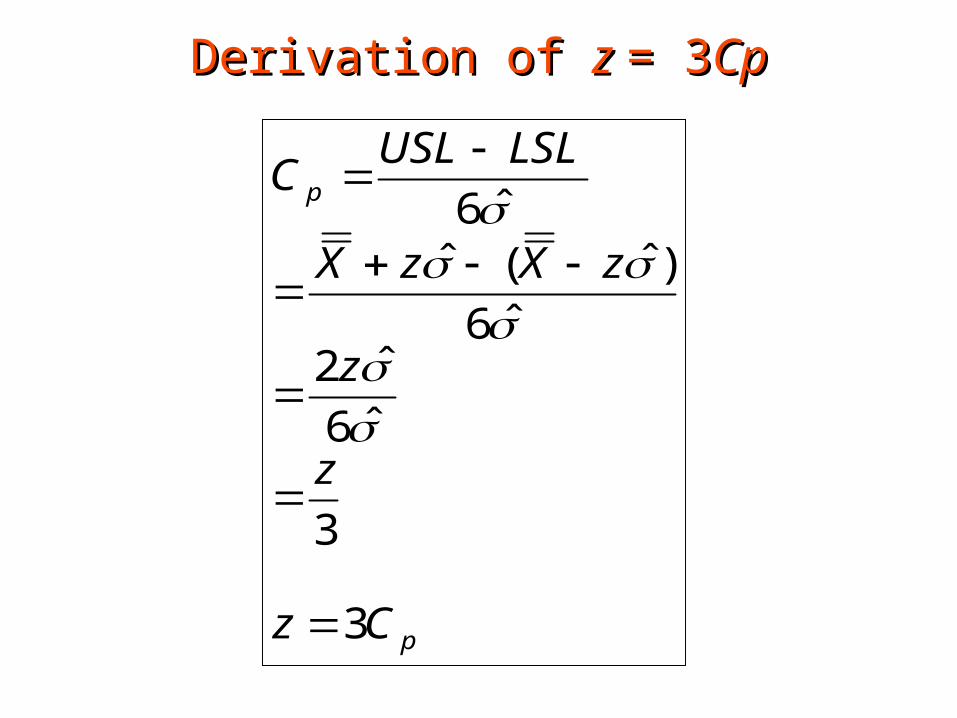
p
p
Cz
z
z
zXzX
LSLUSLC
3
3
ˆ6
ˆ2ˆ6
)ˆ(ˆˆ6
Derivation of Derivation of z z = 3= 3CpCp