Embed Size (px)
Citation preview
111
Chapter 6
Determining endocrine disruptors from water by
concentration and derivatization in PDMS
multichannel traps
6.1. Our approach
The PDMS MCT consists of an open tubular assembly, making it suitable for the concentration of
analytes directly from water, without the need for prior filtration. The PDMS MCT has already been
utilized to concentrate PAHs from water [63, 67]. Since the analytes had no functional groups
which could interfere with the chromatography, no additional sample preparation was required
other than the removal of water from the trap before thermal desorption into the GC-MS [63, 67]. In
order to extend the range of compounds amenable to PDMS MCT sampling, we decided to extract
analytes that would require derivatization before analysis by GC-MS.
As described in chapter 1, there is a need to analyse ultra trace endocrine disruptors from water.
Due to their extremely lipophyllic nature, estrogens and alkylphenols should, in theory, partition
into PDMS MCT traps very easily. However, they possess hydroxyl functional groups, which
require derivatization not only to improve the chromatography but also, perhaps simultaneously, to
improve the detection properties of these analytes.
It is understood that, due to their lipophilicity, that the estrogens and alkylphenols are more likely to
be adsorbed to particulates, sediments and sludge present in water sources. For example, literature
indicates that approximately 50-75% of NP is adsorbed on sediment, implying only 25-50% is
present in the water [9]. In addition estrogens may also occur as their glucuronide or sulphate
conjugates resulting from human excretion [24, 58], the conjugates are not biologically active but
are reconverted to free steroids by bacteria in the environment [276]. Thus the estrogens are largely
deconjugated in water systems. The scope of this study did not include the investigation of the total
content of these analytes in the water source, but to demonstrate the concentration of the free
analytes in water in the PDMS MCT.
Chapter 6 – Determining endocrine disruptors from water
112
Ideally, for sampling, the PDMS MCT should be located where it can concentrate the analytes
directly from the source, e.g. in a river. Following concentration the trap can be returned to the lab
for further treatment without loss/change of the sample. Once in the lab, water can be removed from
the trap and the derivatization reaction can be performed in situ, followed by thermal desorption and
GC/MS analysis.
The first step in this study was to select a suitable derivatization reagent for the analytes and to
determine how well the reaction would proceed within the PDMS matrix. Then the completeness of
transfer of the derivatives from the trap (i.e. complete thermal desorption) to the column was
verified. Once this was known, extraction efficiency of the analytes into the PDMS could be
investigated. The steps were carried out in this order since it was impossible to analyse the
extracted-underivatized analytes by comparison as their chromatographic performance deteriorates
rapidly even when starting with a new GC column. Once concentration and derivatization have
been demonstrated, the PDMS MCT could be applied to the analysis of real samples.
Table 6.1 lists the structures of the analytes to be determined in our study.
6.2. Derivatization
6.2.1. Initial derivatization reactions involving the estrogens
BSTFA leads the way as the derivatization reagent of choice for the conversion of hydroxyl groups
on estrogens and alkylphenols [1-3, 21, 23-25, 243], (see chapter 3 page 63). However, it has been
demonstrated that unless the ratio of BSTFA/ 1% TMCS/ pyridine, is not carefully regulated, the β-
ethinylestradiol (EE2) derivative readily converts to the estrone (E1) derivative which is often being
analysed simultaneously [244, 245].
It was therefore decided to rather perform an acylation reaction to convert the EDCs. This has the
added advantage that anhydrous conditions are not required (see chapter 3). According to the results
obtained by L. Dehennin et al. [246], shown in table 6.2, a maximum electron capture detector
(ECD) response is obtained when the hydroxyl group on testosterone is substituted to form the
heptafluorobutyrl (HFB) ester, followed closely by the pentafluorobenzoyl- (PFB) and
pentafluorophenyl- (PFP) esters [246]. (See chapter 3 page 60, for derivatization reagents which
yield these derivatives).
Chapter 6 – Determining endocrine disruptors from water
113
OH
H
H
H
CH3OH
OH
H
H
H
CH3O
OH C OH
CH3
CH3
CH2 C OH
CH3
CH3
C
CH3
CH3
CH3
OHH19C9
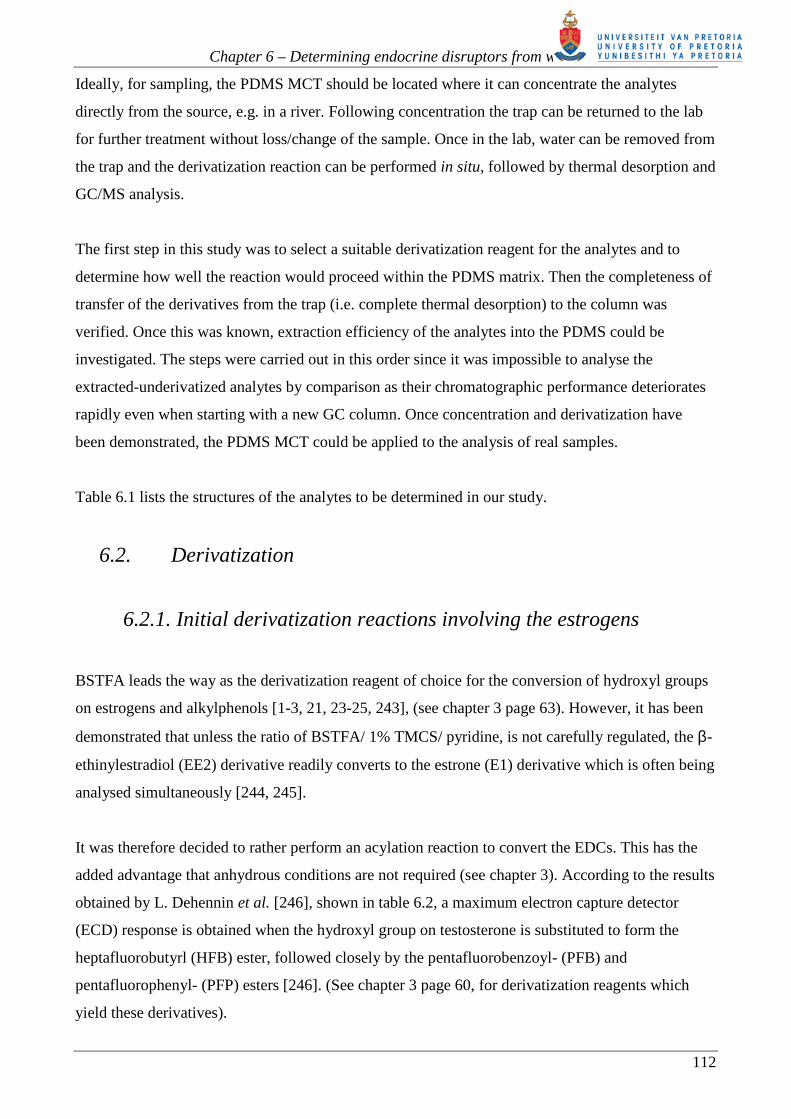
Table 6.1 Endocrine disrupting compounds to be analysed by concentration and
derivatization in the PDMS MCT.
Compound name: Compound structure: Molecular Formula:
Molecular Mass:
Abbreviation
17β-estradiol
C18H24O2 272 E2
estrone
C18H22O2 270 E1
estriol
C18H24O3 288 E3
17α-
ethinylestradiol
C20H24O2 296 EE2
17β -testosterone
C19H28O2 288 T
tert-octylphenol
C14H22O 206 TOP
4-n-nonylphenol
C15H24O 220 NP
bisphenol-A
C15H16O2 228 BPA
OH
H
H
H
CH3OH
OH
OH
H
H
H
CH3OH
C CH
O
H
H
H
CH3OH
CH3
Chapter 6 – Determining endocrine disruptors from water
114
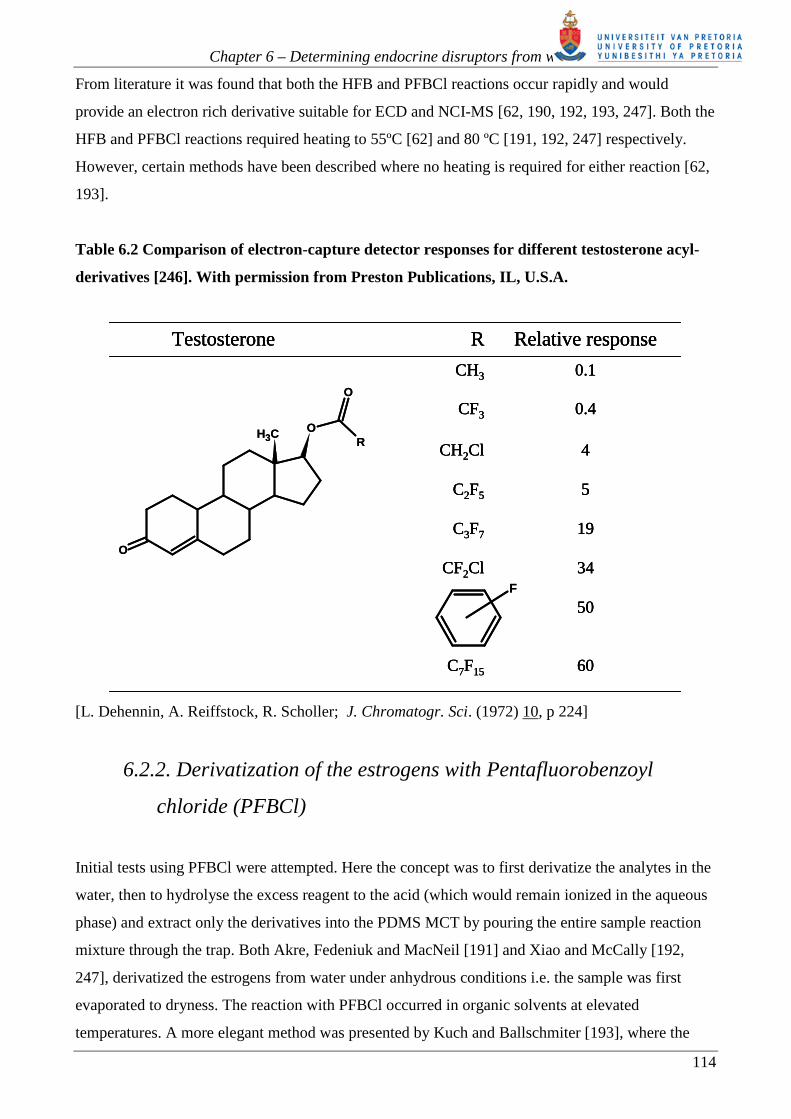
From literature it was found that both the HFB and PFBCl reactions occur rapidly and would
provide an electron rich derivative suitable for ECD and NCI-MS [62, 190, 192, 193, 247]. Both the
HFB and PFBCl reactions required heating to 55ºC [62] and 80 ºC [191, 192, 247] respectively.
However, certain methods have been described where no heating is required for either reaction [62,
193].
Table 6.2 Comparison of electron-capture detector responses for different testosterone acyl-
derivatives [246]. With permission from Preston Publications, IL, U.S.A.
50
60C7F15
34CF2Cl
19C3F7
5C2F5
4CH2Cl
0.4CF3
0.1CH3
Relative responseRTestosterone
O
OCH3
O
R
F
50
60C7F15
34CF2Cl
19C3F7
5C2F5
4CH2Cl
0.4CF3
0.1CH3
Relative responseRTestosterone
50
60C7F15
34CF2Cl
19C3F7
5C2F5
4CH2Cl
0.4CF3
0.1CH3
Relative responseRTestosterone
O
OCH3
O
R
F
[L. Dehennin, A. Reiffstock, R. Scholler; J. Chromatogr. Sci. (1972) 10, p 224]
6.2.2. Derivatization of the estrogens with Pentafluorobenzoyl
chloride (PFBCl)
Initial tests using PFBCl were attempted. Here the concept was to first derivatize the analytes in the
water, then to hydrolyse the excess reagent to the acid (which would remain ionized in the aqueous
phase) and extract only the derivatives into the PDMS MCT by pouring the entire sample reaction
mixture through the trap. Both Akre, Fedeniuk and MacNeil [191] and Xiao and McCally [192,
247], derivatized the estrogens from water under anhydrous conditions i.e. the sample was first
evaporated to dryness. The reaction with PFBCl occurred in organic solvents at elevated
temperatures. A more elegant method was presented by Kuch and Ballschmiter [193], where the
Chapter 6 – Determining endocrine disruptors from water
115
reaction between PFBCl and the estrogens occur in water. The derivatives that form immediately, at
room temperature, are extracted into hexane [193]. Excess PFBCl remains in the aqueous phase
[193]. The latter reaction seemed appropriate for our PDMS MCT experiment. Identical steps could
be followed until the final extraction step where the hexane (non-polar solvent) would be replaced
by the PDMS MCT (“non-polar” solvent).
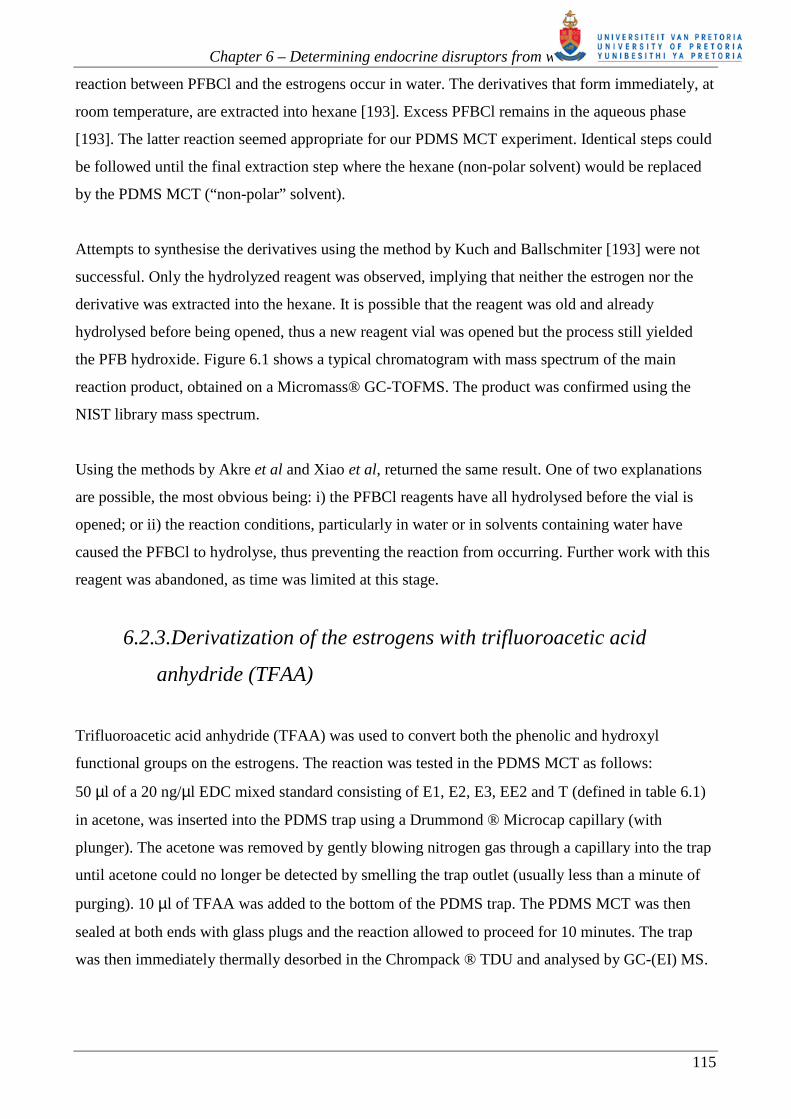
Attempts to synthesise the derivatives using the method by Kuch and Ballschmiter [193] were not
successful. Only the hydrolyzed reagent was observed, implying that neither the estrogen nor the
derivative was extracted into the hexane. It is possible that the reagent was old and already
hydrolysed before being opened, thus a new reagent vial was opened but the process still yielded
the PFB hydroxide. Figure 6.1 shows a typical chromatogram with mass spectrum of the main
reaction product, obtained on a Micromass® GC-TOFMS. The product was confirmed using the
NIST library mass spectrum.
Using the methods by Akre et al and Xiao et al, returned the same result. One of two explanations
are possible, the most obvious being: i) the PFBCl reagents have all hydrolysed before the vial is
opened; or ii) the reaction conditions, particularly in water or in solvents containing water have
caused the PFBCl to hydrolyse, thus preventing the reaction from occurring. Further work with this
reagent was abandoned, as time was limited at this stage.
6.2.3.Derivatization of the estrogens with trifluoroacetic acid
anhydride (TFAA)
Trifluoroacetic acid anhydride (TFAA) was used to convert both the phenolic and hydroxyl
functional groups on the estrogens. The reaction was tested in the PDMS MCT as follows:
50 µl of a 20 ng/µl EDC mixed standard consisting of E1, E2, E3, EE2 and T (defined in table 6.1)
in acetone, was inserted into the PDMS trap using a Drummond ® Microcap capillary (with
plunger). The acetone was removed by gently blowing nitrogen gas through a capillary into the trap
until acetone could no longer be detected by smelling the trap outlet (usually less than a minute of
purging). 10 µl of TFAA was added to the bottom of the PDMS trap. The PDMS MCT was then
sealed at both ends with glass plugs and the reaction allowed to proceed for 10 minutes. The trap
was then immediately thermally desorbed in the Chrompack ® TDU and analysed by GC-(EI) MS.
Chapter 6 – Determining endocrine disruptors from water
116
F
F
F
F
F
O OH
O
Pentafluorobenzoylhydroxide Mr = 212 g/ mol
(rep lib ) Benzoic acid , pentafluoro-20 30 40 50 60 70 80 90 100 110 120 130 140 150 160 170 180 190 200 210 220
0
50
100
31
36
45
48
55
6069
74
77
79
82
86
93
99
110113
117
129
137
148
156
164
167
173184
192
195
212
F
F
F
F
F
OH
O
The instrument conditions were as follows:
Splitless desorption at 280ºC for 20 min with a desorb flow of 100 ml/ min, inject at 280ºC for 5
minutes. The GC oven was held at 40ºC for 1 min then ramped at 5º/min to 280ºC and held for 10
min, then ramped again at 20º/min to 300ºC and held for 5 min. A solvent delay of 28 min was set
on the MS to avoid the detector being damaged by the excess volatile TFAA entering the MS. A
scan range of 40 – 600 amu was used.
Figure 6.1. Gas chromatogram and time-of-flight mass spectrum of PFBCl hydrolysis product
obtained when performing the method introduced by Kuch and Ballschmiter [193].
Chapter 6 – Determining endocrine disruptors from water
117
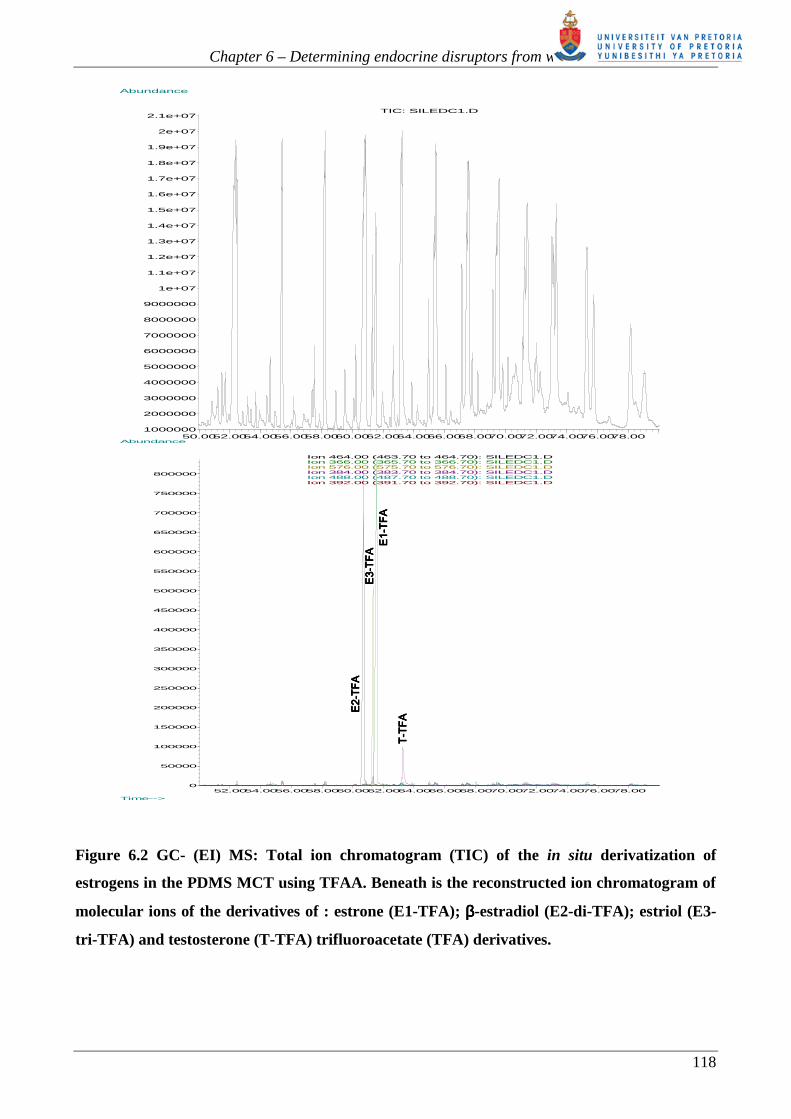
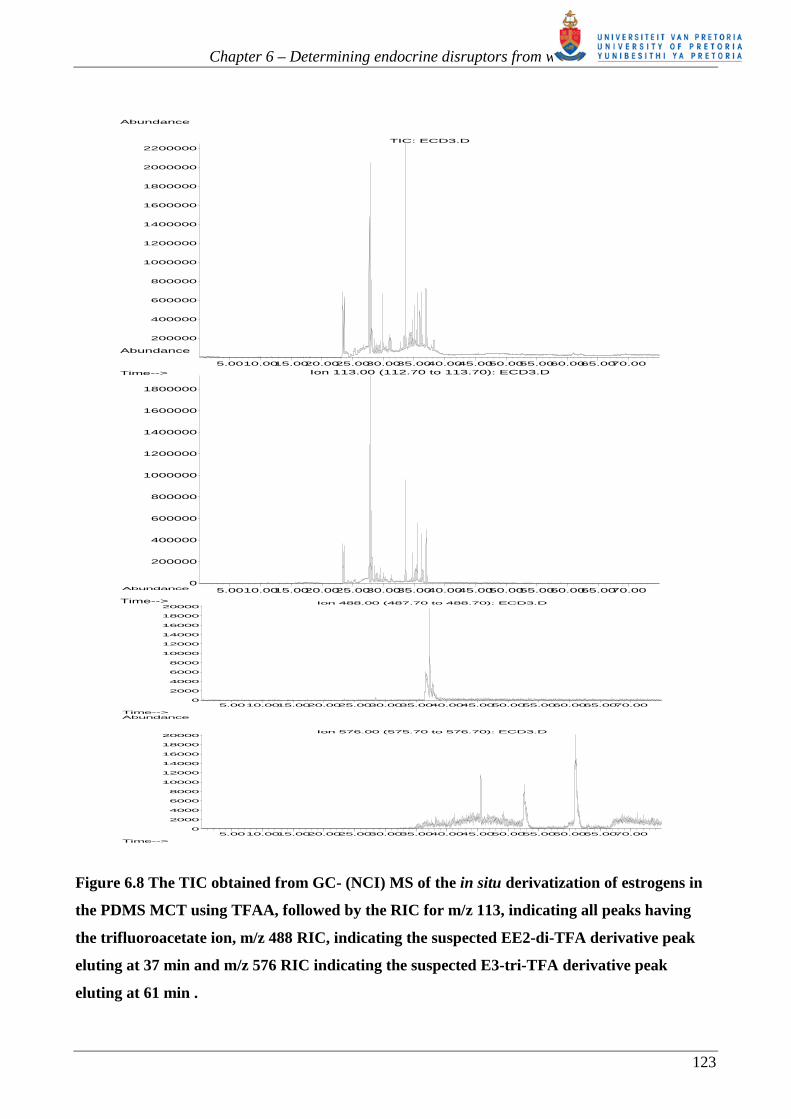
Figure 6.2 shows the total ion chromatogram (TIC) obtained for this experiment. The TIC for the
desorbed PDMS MCT trap shows extremely overloaded and jagged-edged PDMS thermal
degradation peaks reflecting the excess TFAA reagent and very high thermal desorption
temperature used. It should be noted that the chromatogram using NCI-MS (shown in figure 6.8
below) is significantly cleaner since the PDMS degradation peaks are selectively removed because
of poor ionization with the NCI technique.
The reconstructed ion chromatogram (RIC) of the molecular ions of each derivative observed is
shown beneath the TIC in figure 6.2. The RIC gives a good indication of how the selectivity of the
MS improves when moving to Selected Ion Monitoring (SIM) – where the PDMS thermal
degradation peaks are absent.
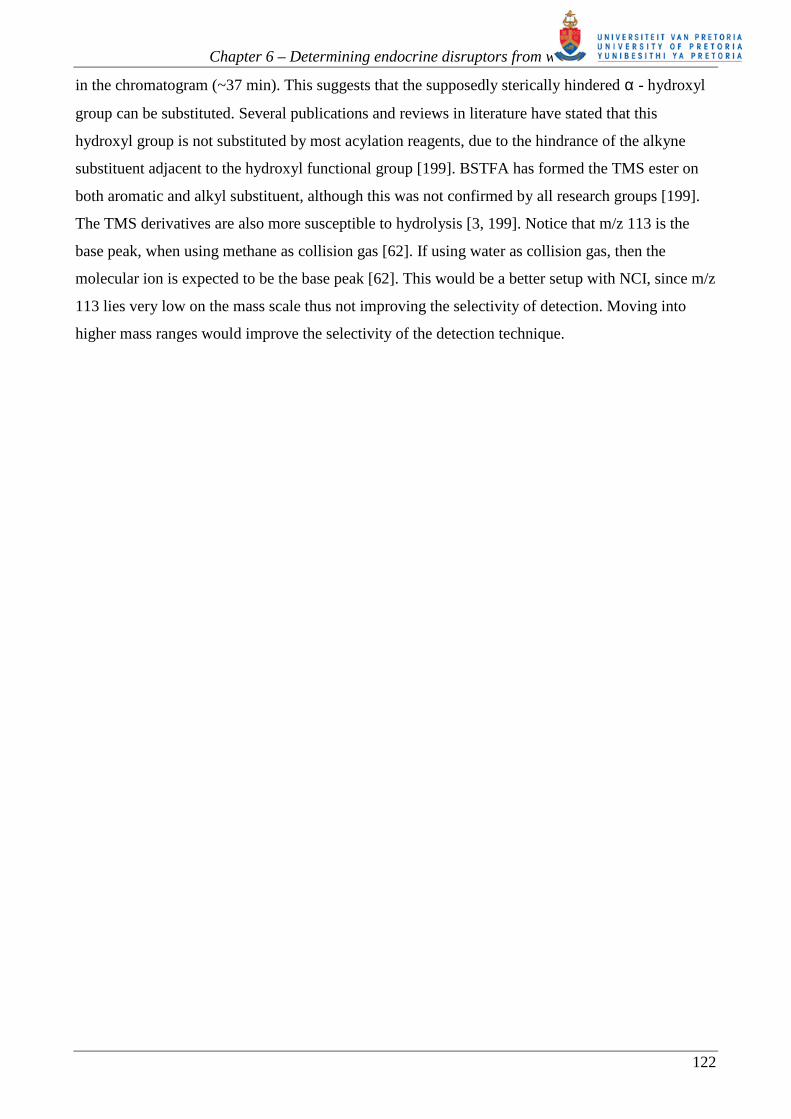
Figures 6.3 to 6.6 show the EI mass spectra obtained for the E2, E1, E3 and T – TFA derivatives
each with an abundant molecular ion. Both hydroxyl and phenol groups were substituted to form the
TFA ester. The presence of the TFA moiety in each derivative is confirmed by m/z 69 (-CF3). Out
of interest, another peak not shown on the RIC is the enol tautomer of testosterone that is doubly
substituted with TFA. Figure 6.7 shows the mass spectrum of the disubstituted derivative together
with the keto-enol tautomerism occurring with testosterone. The disubstituted E2 TFA derivative
and the T derivative mass spectra agree with the corresponding mass spectra provided by Lerch and
Zinn [62]. Mass spectra for most of the estrogen-TFA derivatives were not available in the NIST or
Wiley libraries. Neither the mono-(M+ m/z 392) nor the di-TFA(M+ m/z 488) derivative of EE2
was observed, figure 6.2. The EE2-di-TFA derivative was expected to elute between the E1-TFA
and T-TFA derivatives [62].
Chapter 6 – Determining endocrine disruptors from water
118
Figure 6.2 GC- (EI) MS: Total ion chromatogram (TIC) of the in situ derivatization of
estrogens in the PDMS MCT using TFAA. Beneath is the reconstructed ion chromatogram of
molecular ions of the derivatives of : estrone (E1-TFA); ββββ-estradiol (E2-di-TFA); estriol (E3-
tri-TFA) and testosterone (T-TFA) trifluoroacetate (TFA) derivatives.
50.0052.0054.0056.0058.0060.0062.0064.0066.0068.0070.0072.0074.0076.0078.001000000
2000000
3000000
4000000
5000000
6000000
7000000
8000000
9000000
1e+07
1.1e+07
1.2e+07
1.3e+07
1.4e+07
1.5e+07
1.6e+07
1.7e+07
1.8e+07
1.9e+07
2e+07
2.1e+07
Time-->
Abundance
TIC: SILEDC1.D
52.0054.0056.0058.0060.0062.0064.0066.0068.0070.0072.0074.0076.0078.000
50000
100000
150000
200000
250000
300000
350000
400000
450000
500000
550000
600000
650000
700000
750000
800000
Time-->
Abundance
Ion 464.00 (463.70 to 464.70): SILEDC1.DIon 366.00 (365.70 to 366.70): SILEDC1.DIon 576.00 (575.70 to 576.70): SILEDC1.DIon 384.00 (383.70 to 384.70): SILEDC1.DIon 488.00 (487.70 to 488.70): SILEDC1.DIon 392.00 (391.70 to 392.70): SILEDC1.D
E2E2 E2E2-- -- T
FATFA
TFA
TFA
E3E3 E3E3-- -- T
FATFA
TFA
TFA
E1E1 E1E1-- -- T
FATFA
TFA
TFA
TT TT -- --TF
ATF
ATF
ATF
A
Chapter 6 – Determining endocrine disruptors from water
119
Figure 6.3 Electron impact mass spectrum of the estrone-trifluoroacetate (E1-TFA)
derivative. Molecular ion (M+) m/z 366, (-CF3) m/z 69.
Figure 6.4 Electron impact mass spectrum of the 17ββββ-estradiol-trifluoroacetate (E2-di-TFA)
derivative. Molecular ion (M+) m/z 464, (-CF3) m/z 69.
50 100 150 200 250 300 350 400 450 500 550 6000
50000
100000
150000
200000
250000
300000
350000
400000
450000
500000
550000
600000
650000
m/z-->
Abundance
Average of 60.666 to 60.723 min.: SILEDC1.D (-)464
69
115309
256141
351
229
41
281165 429203
378403 535489 561 593
O
O
H
H
H
CH3O
O
CF3
F3C
50 100 150 200 250 300 350 400 450 500 550 6000
50000
100000
150000
200000
250000
300000
350000
400000
450000
500000
550000
600000
650000
m/z-->
Abundance
Average of 61.492 to 61.562 min.: SILEDC1.D (-)366
322
69115
256141 295
221
41
165197
401429 503461 576535
O
O
H
H
H
CH3O
F3C

Chapter 6 – Determining endocrine disruptors from water
120
Figure 6.5 Electron impact mass spectrum of the estriol-trifluoroacetate (E3-tri-TFA)
derivative. Molecular ion (M+) m/z 576, (-CF3) m/z 69.
Figure 6.6 Electron impact mass spectrum of the testosterone-trifluoroacetate (T-TFA)
derivative. Molecular ion (M+) m/z 384, (-CF3) m/z 69.
50 100 150 200 250 300 350 400 450 500 550 6000
20000
40000
60000
80000
100000
120000
140000
160000
180000
200000
220000
240000
260000
280000
300000
320000
340000
360000
380000
m/z-->
Abundance
Average of 61.225 to 61.333 min.: SILEDC1.D (-)69
576
115
235
141
34944 165 309268 463
193
376548406 517438 489
O
F3C O
H
H
H
CH3O
O
O
CF3
O
F3C
50 100 150 200 250 300 350 400 450 500 550 6000
5000
10000
15000
20000
25000
30000
35000
40000
45000
50000
55000
60000
65000
70000
m/z-->
Abundance
Scan 5549 (63.354 min): SILEDC1.D (-)342
69124
299
384
9341
225185
159253
479415445 534 595561504
O
H
H
H
CH3O
CH3
O
CF3
Chapter 6 – Determining endocrine disruptors from water
121
Figure 6.7 Electron impact mass spectrum of the testosterone-ditrifluoroacetate (T-di-TFA)
derivative. Molecular ion (M+) m/z 480, (-CF3) m/z 69. Beneath the mass spectrum is a sketch
of the equilibrium between the ketone and enol tautomers of testosterone.
The estrogen TFA derivatives were again synthesised on the trap as described earlier. The trap was
then immediately thermally desorbed in the Chrompack ® TDU and analysed by GC-(NCI) MS.
Figure 6.8 shows the TIC obtained by GC (NCI) MS. Beneath the TIC is the RIC of m/z 113, which
corresponds to the mass of the trifluoroacetate ion -CF3CO2-. It appears that several more TFA
derivatives are detected by NCI-MS. Most of these chromatographic peaks only have a base mass
peak of m/z 113 with no other ion information available to identify them. Peaks having other ions in
addition to m/z 113 are m/z 488 and m/z 576 as shown in the subsequent RICs and figure 6.9
below.
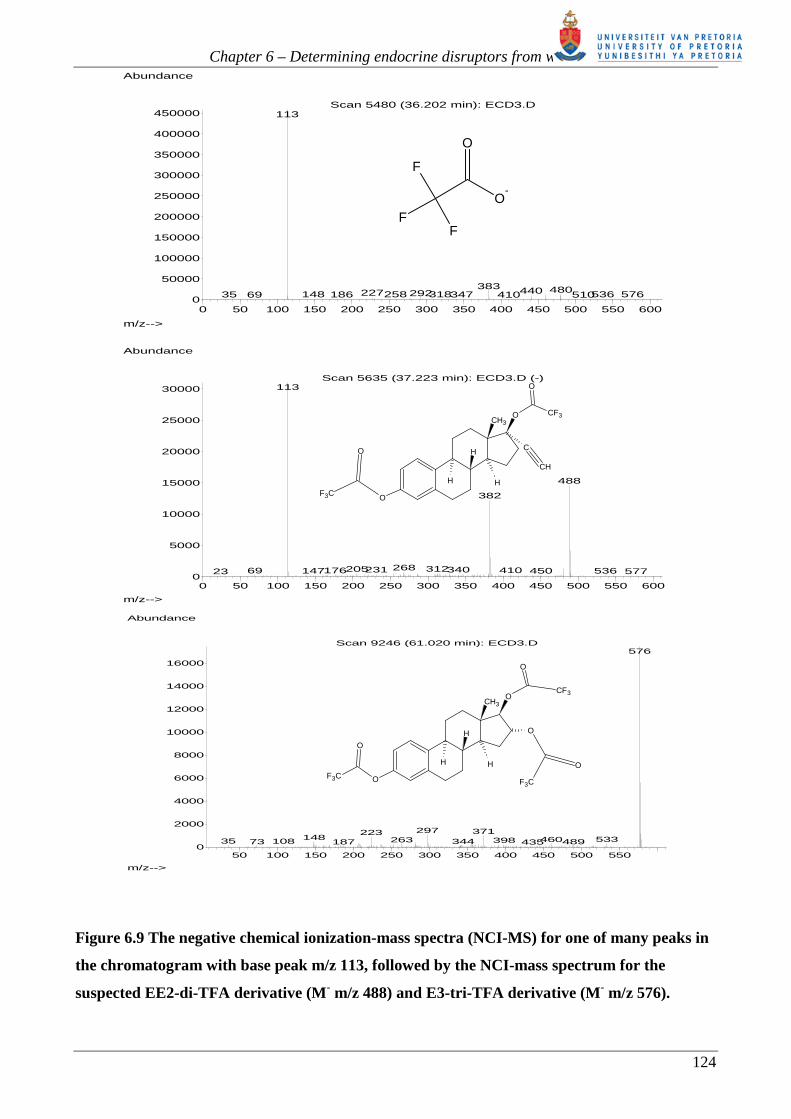
Figure 6.9 shows the NCI-Mass Spectra for one of many peaks in the chromatogram with base peak
m/z 113, followed by the NCI-mass spectrum for the suspected EE2-TFA derivative and E3-TFA
derivative. At the elution time for E3-TFA (~61 min), the molecular ion m/z 576 appears. This is
unusual for NCI using methane gas, where (M-1) is expected. It is suspected that EE2-TFA (not
present in EI-MS) with a base peak of m/z 488 and fragment ion m/z 113 is observed much earlier
50 100 150 200 250 300 350 400 450 500 550 6000
10000
20000
30000
40000
50000
60000
70000
80000
90000
100000
110000
120000
130000
140000
150000
160000
170000
180000
190000
200000
210000
m/z-->
Abundance
Average of 69.773 to 69.837 min.: SILEDC1.D (-)368
43
14510581 213
299255
171 327 480424451396 559516 584
CH3 O
CH3 H
H H
O
O
CF3
O
F3C
OH
OH
CH3 H
H H
CH3
O
OHCH3
HCH3
HH
Chapter 6 – Determining endocrine disruptors from water
122
in the chromatogram (~37 min). This suggests that the supposedly sterically hindered α - hydroxyl
group can be substituted. Several publications and reviews in literature have stated that this
hydroxyl group is not substituted by most acylation reagents, due to the hindrance of the alkyne
substituent adjacent to the hydroxyl functional group [199]. BSTFA has formed the TMS ester on
both aromatic and alkyl substituent, although this was not confirmed by all research groups [199].
The TMS derivatives are also more susceptible to hydrolysis [3, 199]. Notice that m/z 113 is the
base peak, when using methane as collision gas [62]. If using water as collision gas, then the
molecular ion is expected to be the base peak [62]. This would be a better setup with NCI, since m/z
113 lies very low on the mass scale thus not improving the selectivity of detection. Moving into
higher mass ranges would improve the selectivity of the detection technique.
Chapter 6 – Determining endocrine disruptors from water
123
Figure 6.8 The TIC obtained from GC- (NCI) MS of the in situ derivatization of estrogens in
the PDMS MCT using TFAA, followed by the RIC for m/z 113, indicating all peaks having
the trifluoroacetate ion, m/z 488 RIC, indicating the suspected EE2-di-TFA derivative peak
eluting at 37 min and m/z 576 RIC indicating the suspected E3-tri-TFA derivative peak
eluting at 61 min .
5.0010.0015.0020.0025.0030.0035.0040.0045.0050.0055.0060.0065.0070.000
2000
4000
6000
8000
10000
12000
14000
16000
18000
20000
Time-->
Abundance
Ion 488.00 (487.70 to 488.70): ECD3.D
5.0010.0015.0020.0025.0030.0035.0040.0045.0050.0055.0060.0065.0070.000
2000
4000
6000
8000
10000
12000
14000
16000
18000
20000
Time-->
Abundance
Ion 576.00 (575.70 to 576.70): ECD3.D
5.0010.0015.0020.0025.0030.0035.0040.0045.0050.0055.0060.0065.0070.00
200000
400000
600000
800000
1000000
1200000
1400000
1600000
1800000
2000000
2200000
Time-->
Abundance
TIC: ECD3.D
5.0010.0015.0020.0025.0030.0035.0040.0045.0050.0055.0060.0065.0070.000
200000
400000
600000
800000
1000000
1200000
1400000
1600000
1800000
Time-->
Abundance
Ion 113.00 (112.70 to 113.70): ECD3.D
Chapter 6 – Determining endocrine disruptors from water
124
Figure 6.9 The negative chemical ionization-mass spectra (NCI-MS) for one of many peaks in
the chromatogram with base peak m/z 113, followed by the NCI-mass spectrum for the
suspected EE2-di-TFA derivative (M- m/z 488) and E3-tri-TFA derivative (M- m/z 576).
0 50 100 150 200 250 300 350 400 450 500 550 6000
50000
100000
150000
200000
250000
300000
350000
400000
450000
m/z-->
Abundance
Scan 5480 (36.202 min): ECD3.D113
383 480440227 292258 576318148 53634735 18669 410 510
50 100 150 200 250 300 350 400 450 500 5500
2000
4000
6000
8000
10000
12000
14000
16000
m/z-->
Abundance
Scan 9246 (61.020 min): ECD3.D576
297 371223148 533460263 39835 108 344 48973 187 435
0 50 100 150 200 250 300 350 400 450 500 550 6000
5000
10000
15000
20000
25000
30000
m/z-->
Abundance
Scan 5635 (37.223 min): ECD3.D (-)113
488
382
268 312205231 340 41017669 450 536147 57723
F
FF
O
O-
O
F3C O
H
H
H
CH3O
O
O
CF3
O
F3C
CF3
O
F3C O
H
H
H
CH3O
C
CH
O

Chapter 6 – Determining endocrine disruptors from water
125
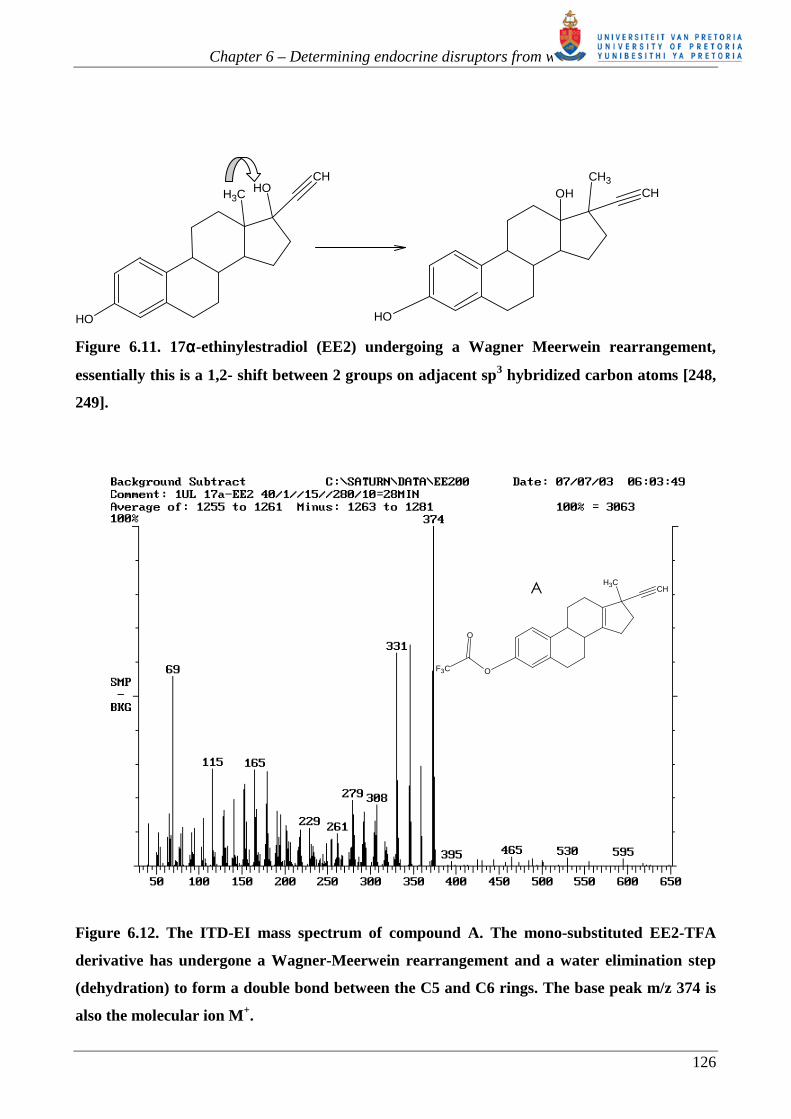
Further investigation of the EE2-di-TFA derivative was performed on the GC-ITD (the instrument
available at the time of the study). Here 1 µl of an 8 µg/µl EE2 standard in acetone was placed in an
empty glass tube. 1 µl of TFAA was added; the glass tube was sealed with glass caps and allowed
to react for 10 min. The tube was then immediately thermally desorbed in the Chrompack ® TDU
and analysed by GC- (ITD) MS. The instrument conditions were as follows:
Splitless desorption at 280ºC for 10 min with a desorb flow of 100 ml/ min, inject at 280ºC for 1
minute. The GC oven was held at 40ºC for 1 min then ramped at 15º/min to 280ºC and held for 10
min. A solvent delay of 16 min was set on the MS to avoid the detector being damaged by the
excess volatile TFAA entering the MS. A scan range of 40 – 600 amu was used.
The chromatogram obtained showed the presence of 5 major compounds present for the reaction of
TFAA with EE2, figure 6.10. The reaction between TFAA and EE2 occurs in the absence of a basic
catalyst resulting in extremely acidic reaction conditions. Under these conditions Wagner-Meerwein
rearrangements [248, 249], figure 6.11, and dehydration reactions can occur. Figures 6.12 to 6.16
show the different derivatives of EE2-TFA formed under acidic conditions (in the presence of
excess TFAA).
Figure 6.10 The GC- (ITD) MS chromatogram obtained for the reaction of EE2 with TFAA in
a glass tube. 5 major compounds, labelled A, B, C, D and E were identified for the derivative.
A
B
C
D E
Chapter 6 – Determining endocrine disruptors from water
126
Figure 6.11. 17αααα-ethinylestradiol (EE2) undergoing a Wagner Meerwein rearrangement,
essentially this is a 1,2- shift between 2 groups on adjacent sp3 hybridized carbon atoms [248,
249].
Figure 6.12. The ITD-EI mass spectrum of compound A. The mono-substituted EE2-TFA
derivative has undergone a Wagner-Meerwein rearrangement and a water elimination step
(dehydration) to form a double bond between the C5 and C6 rings. The base peak m/z 374 is
also the molecular ion M+.
OH
OHCH
CH3
OH
CH3CHOH
O
CH3 CH
O
F3C
A
Chapter 6 – Determining endocrine disruptors from water
127
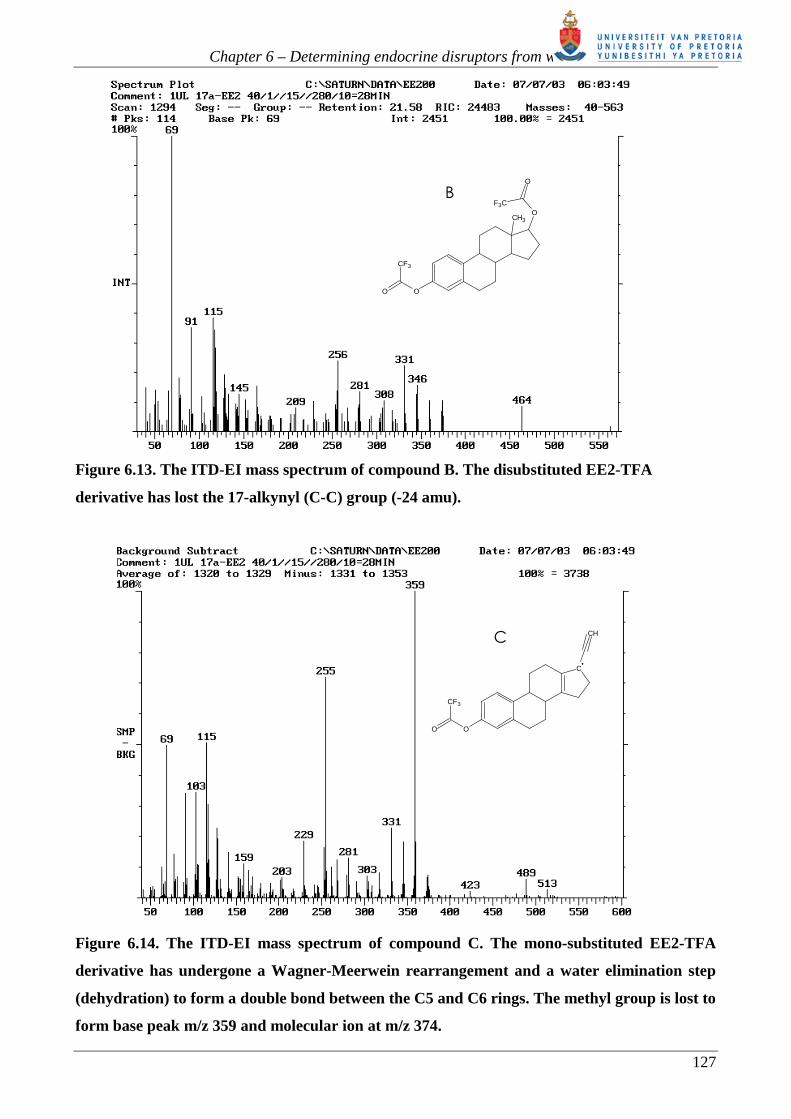
Figure 6.13. The ITD-EI mass spectrum of compound B. The disubstituted EE2-TFA
derivative has lost the 17-alkynyl (C-C) group (-24 amu).
Figure 6.14. The ITD-EI mass spectrum of compound C. The mono-substituted EE2-TFA
derivative has undergone a Wagner-Meerwein rearrangement and a water elimination step
(dehydration) to form a double bond between the C5 and C6 rings. The methyl group is lost to
form base peak m/z 359 and molecular ion at m/z 374.
O
OCH3
O
O
F3C
CF3
B
C
O
CH
O
CF3
C
Chapter 6 – Determining endocrine disruptors from water
128
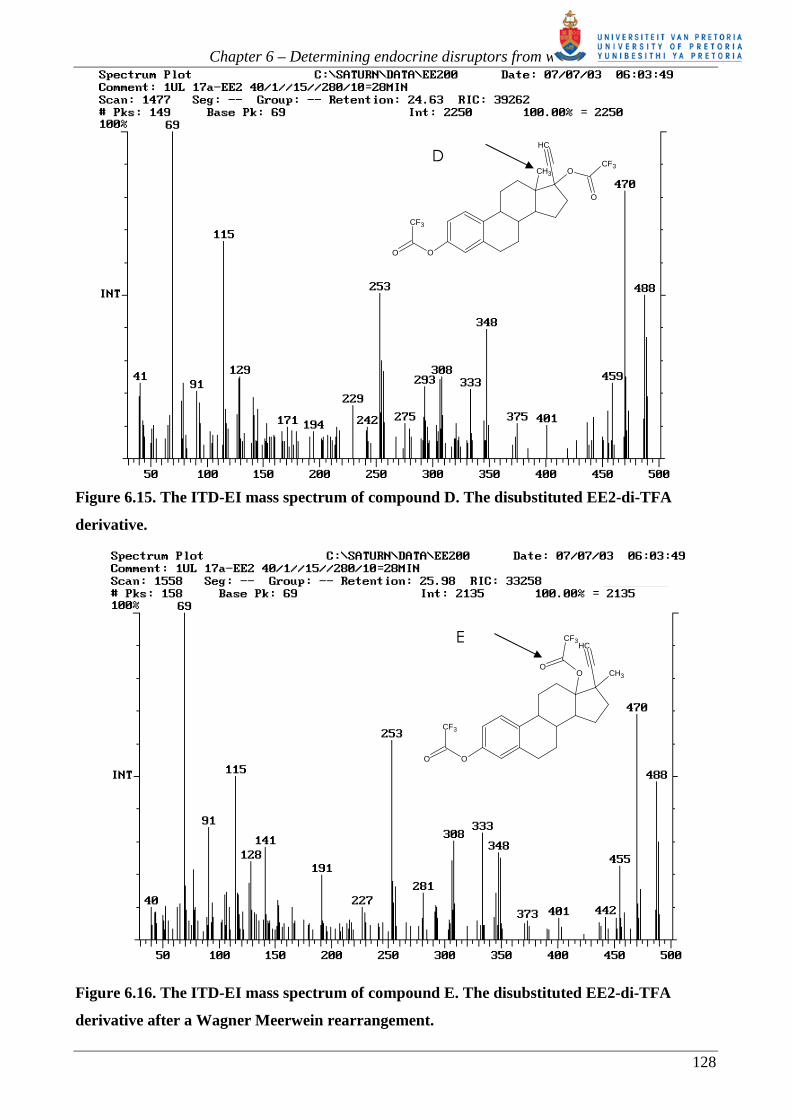
Figure 6.15. The ITD-EI mass spectrum of compound D. The disubstituted EE2-di-TFA
derivative.
Figure 6.16. The ITD-EI mass spectrum of compound E. The disubstituted EE2-di-TFA
derivative after a Wagner Meerwein rearrangement.
O
O
CH
CH3
O
O
CF3
CF3
D
O
CH3
CH
O
CF3
O
CF3
O
E
Chapter 6 – Determining endocrine disruptors from water
129
6.2.4. Dual derivatization of the estrogens with PFBCl and TFAA
In view of the poor results obtained with the PFBCl and TFAA applied separately, as a last resort
we decided to combine the reagents. In literature, dual derivatizations are performed to convert
functional groups of different reactivity resulting from steric hindrance, as is the case for the
hydroxyl group on EE2, which is hindered by the 17-alkynyl group [181].
A simple reaction in a vial with the 20 ng/ µl EDC standard in acetone, 5 µl TFAA and 5 µl PFBCl
was performed. 1 µl of this reaction mixture was injected with a split into the GC- (EI) MS on full
scan, with a solvent delay. Figure 6.17 shows the RIC of m/z 195 corresponding to the
pentafluorophenyl carbonyl moiety. Although not shown here, the TIC looks similar to the RIC.
Figures 6.18 to 6.20 show the 3 derivatives that formed successfully from the dual derivatization;
unfortunately 17α-ethinylestradiol (EE2) was not among them. They are estrone (E1), estriol (E2)
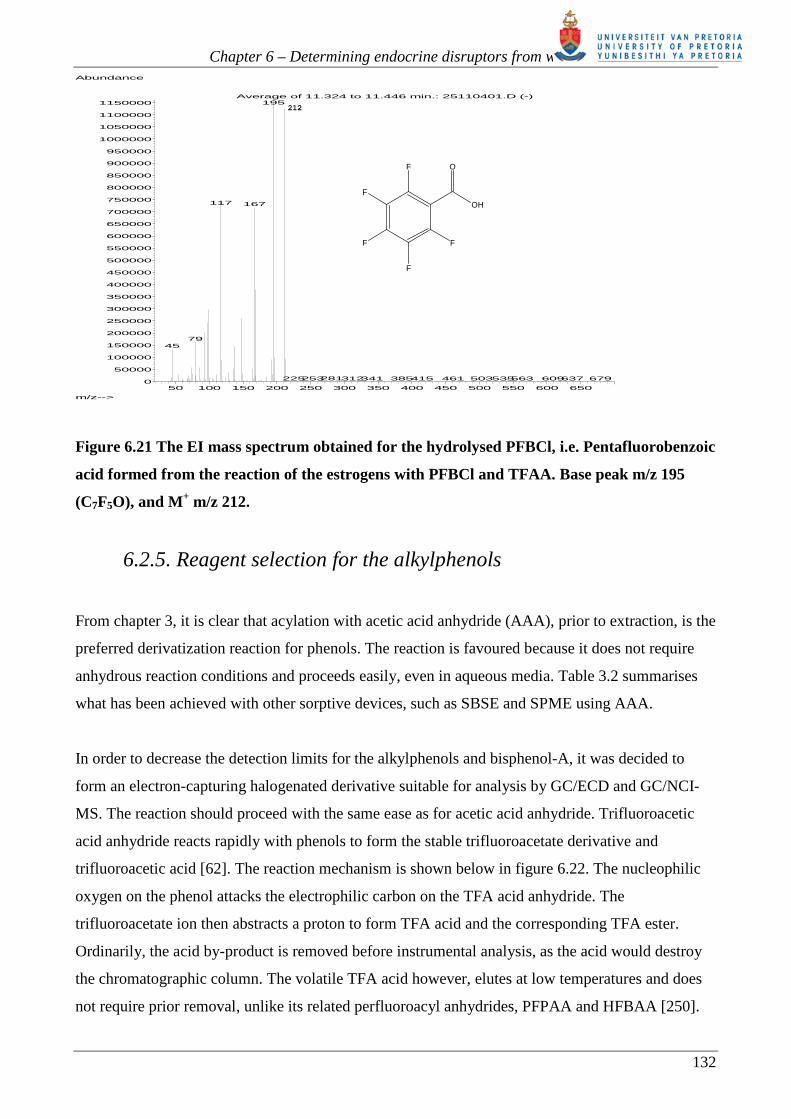
and estradiol (E3). It is important to note that the hydrolysed PFBCl (PFBOH) is also present
(figure 6.21), as are the derivatives. The presence of both m/z 195 and m/z 69 in the mass spectra of
the derivatives indicate that both the PFB and TFA moieties are present. The PFBCl reagent does in
fact react with the estrogens. It would appear that it is not entirely hydrolysed in the reagent vial.
Further investigation into the methodology required for synthesizing the PFB estrogen derivatives is
needed. It remains the model route to follow for the detection of estrogens.
Due to time constraints and the fact that suitable derivatives of the estrogens (with either TFAA or
PFBCl) were not achieved, this work was discontinued. The estrogen-TFA derivatives did not yield
EE2-TFA on the PDMS MCT either at room temperature or during thermal desorption. The EE2-
TFA derivative formed in the glass tube resulted in four products instead of one. The method used
for the reaction of PFBCl with the estrogens was not successful. Further work was carried out using
the alkylphenols only.

Chapter 6 – Determining endocrine disruptors from water
130
Figure 6.17 The GC- (EI) MS Reconstructed ion chromatogram (RIC) of m/z 195
corresponding to the pentafluorophenyl carbonyl moiety, for the dual derivatization of
estrogens with PFBCl and TFAA.
Figure 6.18 The EI mass spectrum obtained for the derivative formed from the reaction of
estrone (E1) with PFBCl and TFAA. Base peak m/z 195 (C7F5O) and M+ m/z 464.
10.00 15.00 20.00 25.00 30.00 35.000
10000
20000
30000
40000
50000
60000
70000
80000
90000
100000
110000
120000
130000
140000
150000
160000
170000
Time-->
Abundance
Ion 195.00 (194.70 to 195.70): 25110401.D
F
F
F
F
F
C
O
50 100 150 200 250 300 350 400 450 500 550 600 6500
5000
10000
15000
20000
25000
30000
35000
40000
45000
50000
55000
60000
65000
70000
75000
80000
85000
90000
95000
100000
105000
m/z-->
Abundance
Average of 31.890 to 31.955 min.: 25110401.D (-)195
464
167407
117 354
25355327
281225 43689 503536 577 637606 680
O
O
H
H
H
CH3O
F
F
F
F
F
Chapter 6 – Determining endocrine disruptors from water
131
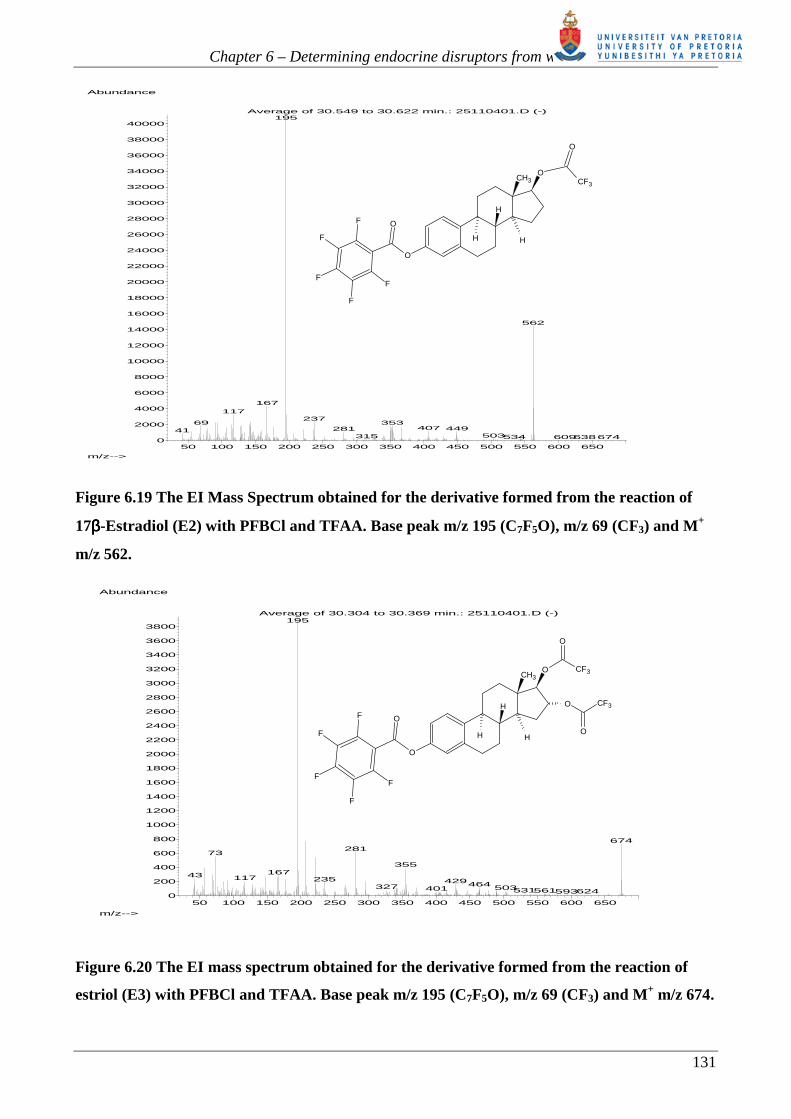
Figure 6.19 The EI Mass Spectrum obtained for the derivative formed from the reaction of
17ββββ-Estradiol (E2) with PFBCl and TFAA. Base peak m/z 195 (C7F5O), m/z 69 (CF3) and M+
m/z 562.
Figure 6.20 The EI mass spectrum obtained for the derivative formed from the reaction of
estriol (E3) with PFBCl and TFAA. Base peak m/z 195 (C7F5O), m/z 69 (CF3) and M+ m/z 674.
50 100 150 200 250 300 350 400 450 500 550 600 6500
2000
4000
6000
8000
10000
12000
14000
16000
18000
20000
22000
24000
26000
28000
30000
32000
34000
36000
38000
40000
m/z-->
Abundance
Average of 30.549 to 30.622 min.: 25110401.D (-)195
562
167
117237
69 353407 44928141
503315 534 609638674
O
O
H
H
H
CH3O
F
F
F
F
F
O
CF3
50 100 150 200 250 300 350 400 450 500 550 600 6500
200
400
600
800
1000
1200
1400
1600
1800
2000
2200
2400
2600
2800
3000
3200
3400
3600
3800
m/z-->
Abundance
Average of 30.304 to 30.369 min.: 25110401.D (-)195
674281
73
35516743 117 235 429464327 503401 531561 624593
O
O
H
H
H
CH3O
OF
F
F
F
F
O
CF3
O
CF3
Chapter 6 – Determining endocrine disruptors from water
132
Figure 6.21 The EI mass spectrum obtained for the hydrolysed PFBCl, i.e. Pentafluorobenzoic
acid formed from the reaction of the estrogens with PFBCl and TFAA. Base peak m/z 195
(C7F5O), and M+ m/z 212.
6.2.5. Reagent selection for the alkylphenols
From chapter 3, it is clear that acylation with acetic acid anhydride (AAA), prior to extraction, is the
preferred derivatization reaction for phenols. The reaction is favoured because it does not require
anhydrous reaction conditions and proceeds easily, even in aqueous media. Table 3.2 summarises
what has been achieved with other sorptive devices, such as SBSE and SPME using AAA.
In order to decrease the detection limits for the alkylphenols and bisphenol-A, it was decided to
form an electron-capturing halogenated derivative suitable for analysis by GC/ECD and GC/NCI-
MS. The reaction should proceed with the same ease as for acetic acid anhydride. Trifluoroacetic
acid anhydride reacts rapidly with phenols to form the stable trifluoroacetate derivative and
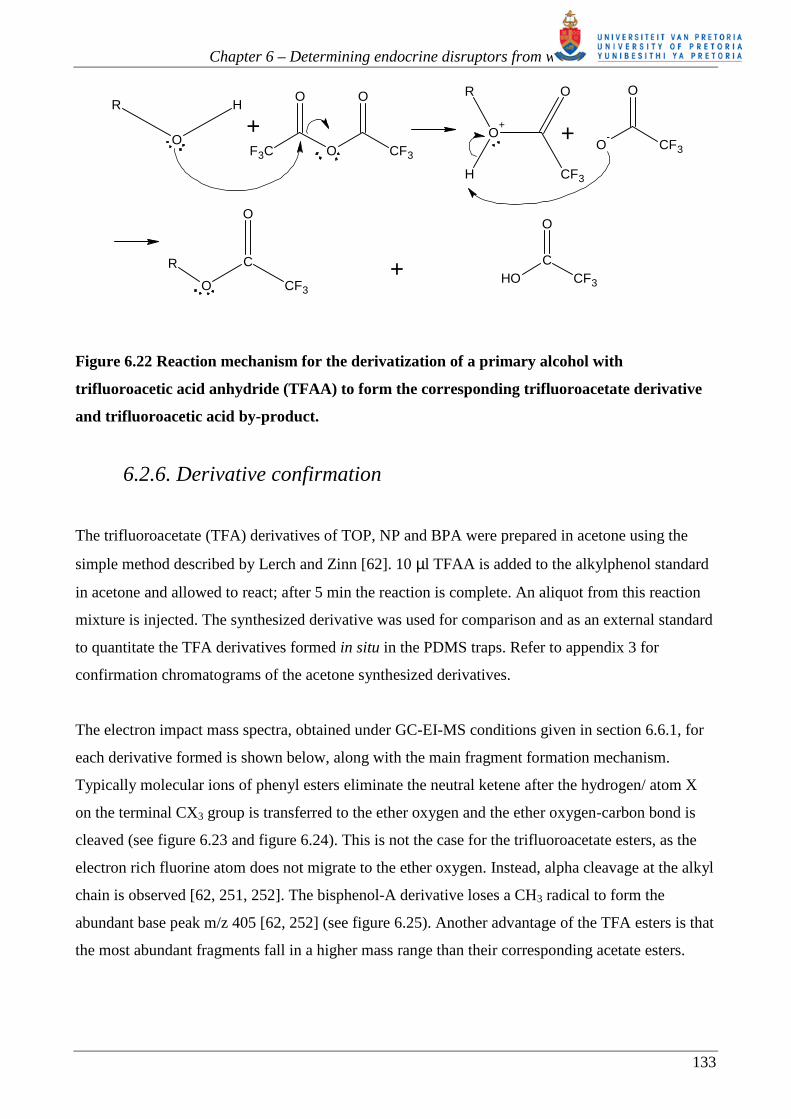
trifluoroacetic acid [62]. The reaction mechanism is shown below in figure 6.22. The nucleophilic
oxygen on the phenol attacks the electrophilic carbon on the TFA acid anhydride. The
trifluoroacetate ion then abstracts a proton to form TFA acid and the corresponding TFA ester.
Ordinarily, the acid by-product is removed before instrumental analysis, as the acid would destroy
the chromatographic column. The volatile TFA acid however, elutes at low temperatures and does
not require prior removal, unlike its related perfluoroacyl anhydrides, PFPAA and HFBAA [250].
50 100 150 200 250 300 350 400 450 500 550 600 6500
50000
100000
150000
200000
250000
300000
350000
400000
450000
500000
550000
600000
650000
700000
750000
800000
850000
900000
950000
1000000
1050000
1100000
1150000
m/z-->
Abundance
Average of 11.324 to 11.446 min.: 25110401.D (-)195
117 167
7945
281 341 415253 312225 503385 461 535563 609 679637
212
F
F
F
F
F
O
OH
Chapter 6 – Determining endocrine disruptors from water
133
Figure 6.22 Reaction mechanism for the derivatization of a primary alcohol with
trifluoroacetic acid anhydride (TFAA) to form the corresponding trifluoroacetate derivative
and trifluoroacetic acid by-product.
6.2.6. Derivative confirmation
The trifluoroacetate (TFA) derivatives of TOP, NP and BPA were prepared in acetone using the
simple method described by Lerch and Zinn [62]. 10 µl TFAA is added to the alkylphenol standard
in acetone and allowed to react; after 5 min the reaction is complete. An aliquot from this reaction
mixture is injected. The synthesized derivative was used for comparison and as an external standard
to quantitate the TFA derivatives formed in situ in the PDMS traps. Refer to appendix 3 for
confirmation chromatograms of the acetone synthesized derivatives.
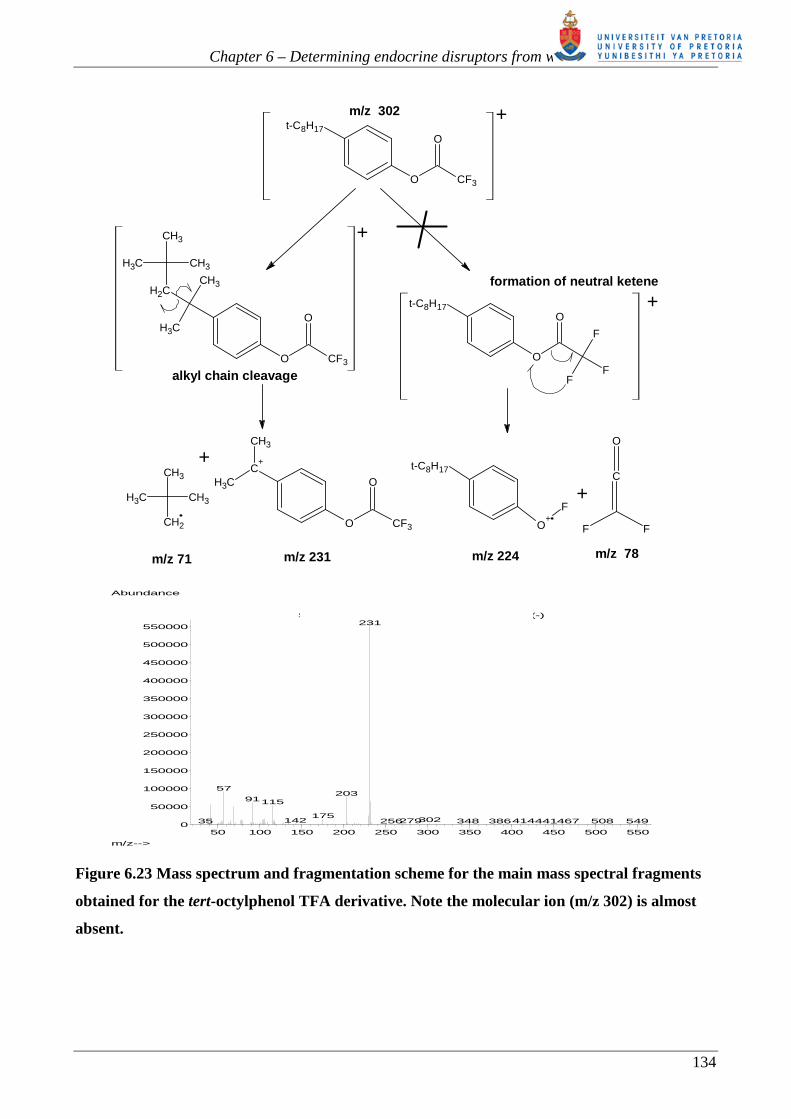
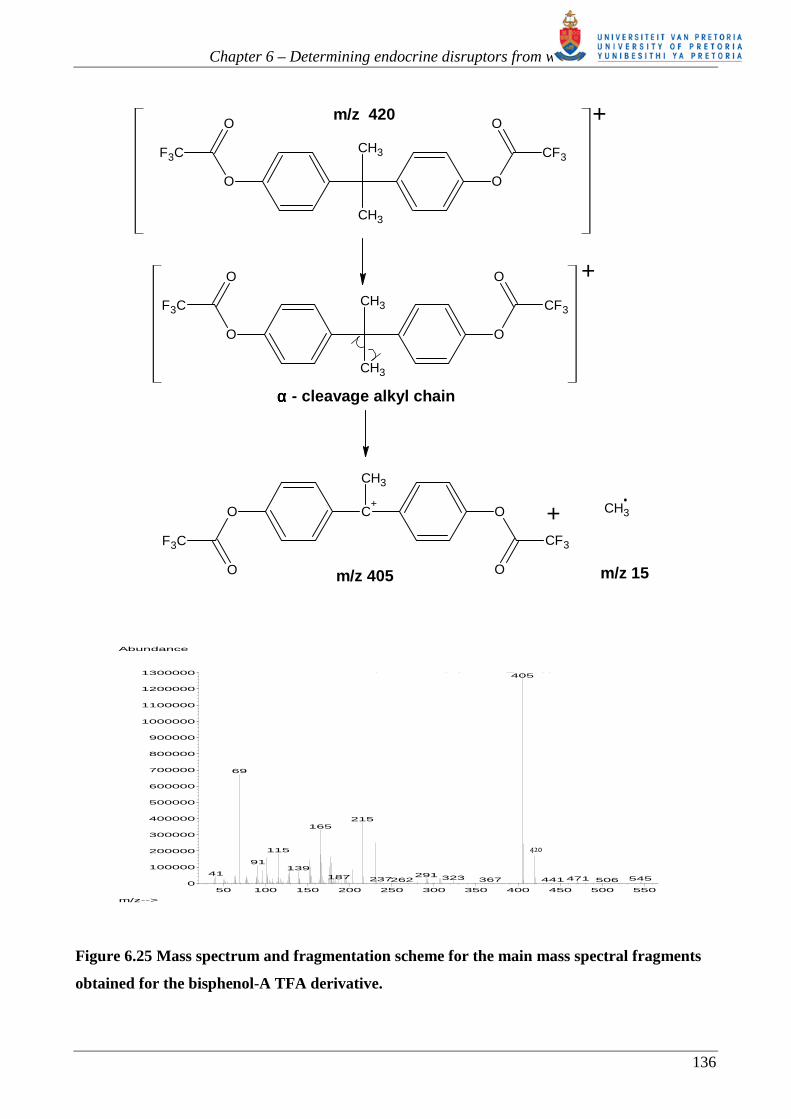
The electron impact mass spectra, obtained under GC-EI-MS conditions given in section 6.6.1, for
each derivative formed is shown below, along with the main fragment formation mechanism.
Typically molecular ions of phenyl esters eliminate the neutral ketene after the hydrogen/ atom X
on the terminal CX3 group is transferred to the ether oxygen and the ether oxygen-carbon bond is
cleaved (see figure 6.23 and figure 6.24). This is not the case for the trifluoroacetate esters, as the
electron rich fluorine atom does not migrate to the ether oxygen. Instead, alpha cleavage at the alkyl
chain is observed [62, 251, 252]. The bisphenol-A derivative loses a CH3 radical to form the
abundant base peak m/z 405 [62, 252] (see figure 6.25). Another advantage of the TFA esters is that
the most abundant fragments fall in a higher mass range than their corresponding acetate esters.
O
R H
O
O O
CF3F3C
+O
-
O
CF3
O+
R
H
O
CF3
+
OHC
O
CF3O
R C
O
CF3
+
Chapter 6 – Determining endocrine disruptors from water
134
Figure 6.23 Mass spectrum and fragmentation scheme for the main mass spectral fragments
obtained for the tert-octylphenol TFA derivative. Note the molecular ion (m/z 302) is almost
absent.
50 100 150 200 250 300 350 400 450 500 5500
50000
100000
150000
200000
250000
300000
350000
400000
450000
500000
550000
m/z-->
Abundance
Scan 1027 (31.799 min): pdms04_2.D (-)231
57203
91115
175302142 414279 467 508256 549386 44134835
m/z 302
O
O
CF3
t-C8H17
t-C8H17
O
O
FF
F
t-C8H17
O+
F
C
O
F F
+
O
O
CF3
CH3
CH3CH2
CH3
CH3
CH3
alkyl chain cleavage
formation of neutral ketene
m/z 224 m/z 78
O
O
CF3
C+
CH3
CH3
m/z 231
+
CH3 CH3
CH3
CH2
m/z 71
+
+
+

Chapter 6 – Determining endocrine disruptors from water
135
Figure 6.24 Mass spectrum and fragmentation scheme for the main mass spectral fragments
obtained for the 4-n-nonylphenol TFA derivative.
O
O
CF3
H19C9
H19C9
O
O
FF
F
H19C9
O+
F
C
O
F F
+
O
O
CF3
C
H17C8
HH
O
O
CF3
CH2+
+ C8H17+
m/z 203 m/z 113
m/z 316
αααα - cleavage alkyl chain
formation of neutral ketene
m/z 238 m/z 78
+
+
+
•
50 100 150 200 250 300 350 400 450 500 5500
50000
100000
150000
200000
250000
300000
350000
400000
450000
500000
550000
600000
m/z-->
Abundance
Scan 1390 (35.943 min): pdms04_2.D (-)203
3166943 91 175
115231145 259286 477 534436 500404363
Chapter 6 – Determining endocrine disruptors from water
136
Figure 6.25 Mass spectrum and fragmentation scheme for the main mass spectral fragments
obtained for the bisphenol-A TFA derivative.
50 100 150 200 250 300 350 400 450 500 5500
100000
200000
300000
400000
500000
600000
700000
800000
900000
1000000
1100000
1200000
1300000
m/z-->
Abundance
Scan 1647 (38.877 min): pdms05_2.D (-)405
69
215165
115
91139
41 291187 323 545471237 441367262 506
CH3
O O
CH3
O
F3C
O
CF3
CH3
CH3
O
O
CF3
O
O
F3C
m/z 420
αααα - cleavage alkyl chain
C+
CH3
O O
O
F3C
O
CF3
+ CH3
m/z 405 m/z 15
+
+
420
Chapter 6 – Determining endocrine disruptors from water
137
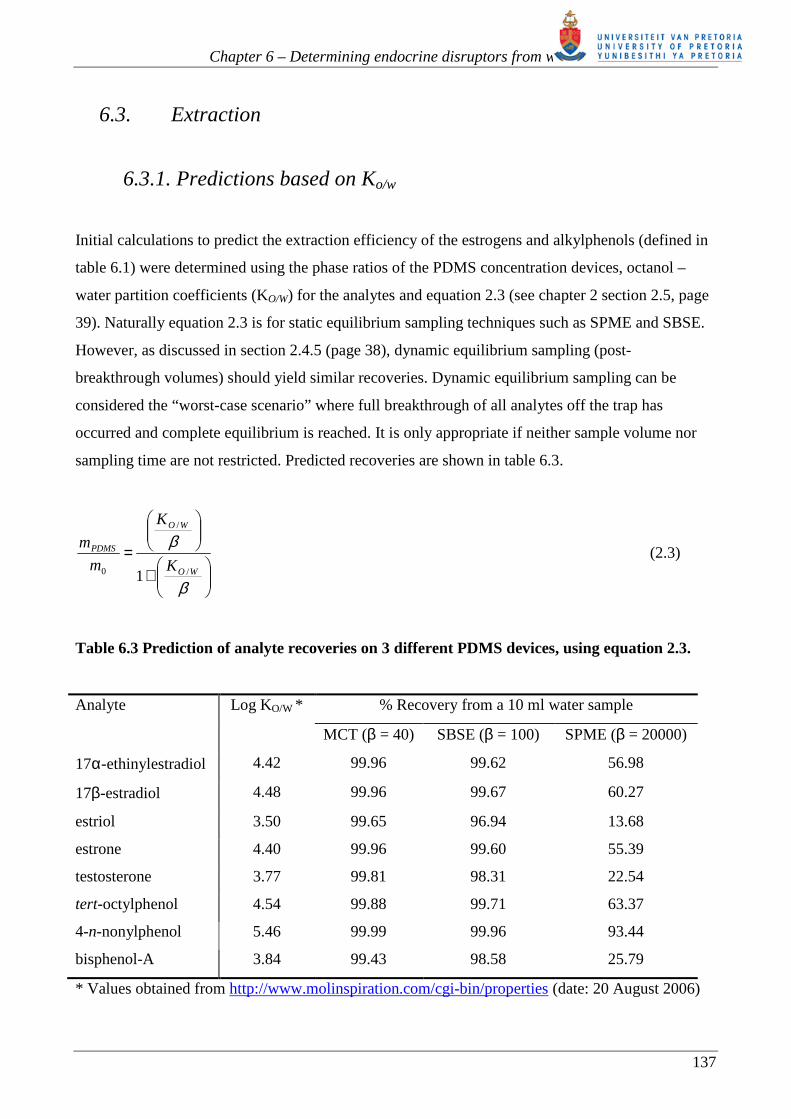
6.3. Extraction
6.3.1. Predictions based on Ko/w
Initial calculations to predict the extraction efficiency of the estrogens and alkylphenols (defined in
table 6.1) were determined using the phase ratios of the PDMS concentration devices, octanol –
water partition coefficients (KO/W) for the analytes and equation 2.3 (see chapter 2 section 2.5, page
39). Naturally equation 2.3 is for static equilibrium sampling techniques such as SPME and SBSE.
However, as discussed in section 2.4.5 (page 38), dynamic equilibrium sampling (post-
breakthrough volumes) should yield similar recoveries. Dynamic equilibrium sampling can be
considered the “worst-case scenario” where full breakthrough of all analytes off the trap has
occurred and complete equilibrium is reached. It is only appropriate if neither sample volume nor
sampling time are not restricted. Predicted recoveries are shown in table 6.3.
+
=
β
β
WO
WO
PDMS
K
K
m
m
/
/
0 1
(2.3)
Table 6.3 Prediction of analyte recoveries on 3 different PDMS devices, using equation 2.3.
Analyte Log KO/W * % Recovery from a 10 ml water sample
MCT (β = 40) SBSE (β = 100) SPME (β = 20000)
17α-ethinylestradiol 4.42 99.96 99.62 56.98
17β-estradiol 4.48 99.96 99.67 60.27
estriol 3.50 99.65 96.94 13.68
estrone 4.40 99.96 99.60 55.39
testosterone 3.77 99.81 98.31 22.54
tert-octylphenol 4.54 99.88 99.71 63.37
4-n-nonylphenol 5.46 99.99 99.96 93.44
bisphenol-A 3.84 99.43 98.58 25.79
* Values obtained from http://www.molinspiration.com/cgi-bin/properties (date: 20 August 2006)
Chapter 6 – Determining endocrine disruptors from water
138
Based on the values presented in table 6.3, it is expected that the analytes will partition very well
into the PDMS MCT, without requiring derivatization prior to extraction. Since we did not intend to
perform dynamic equilibrium sampling, as this will require extended sampling periods of time,
typical retention volumes that could be expected for these analytes on the PDMS MCT by dynamic
breakthrough sampling were calculated. This was achieved using Baltussen’s equations for aqueous
phase dynamic sampling (section 2.4.4 page 37) in determining retention volumes (equation 2.20)
and breakthrough volumes (equation 2.21) for a trap.
+=β
WOr
KVV /
0 1 (2.20)
2/1
2
603.4360.59025.0
−
++=NN
VV rb (2.21)
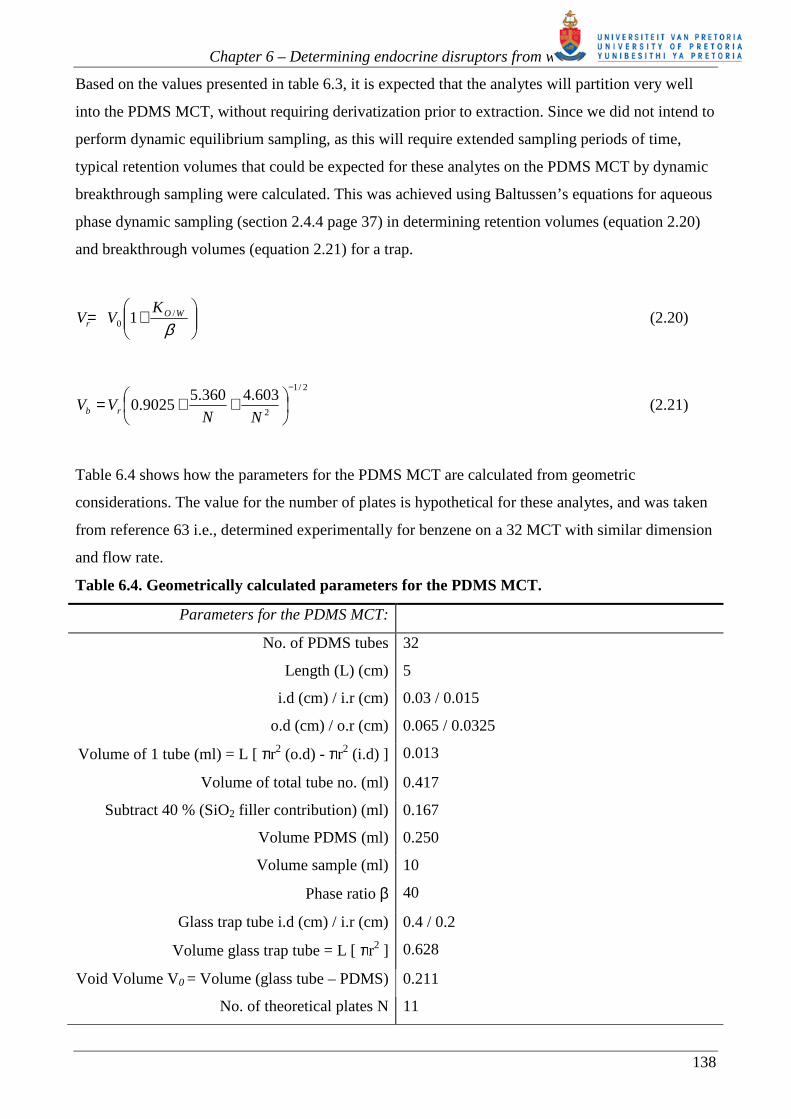
Table 6.4 shows how the parameters for the PDMS MCT are calculated from geometric
considerations. The value for the number of plates is hypothetical for these analytes, and was taken
from reference 63 i.e., determined experimentally for benzene on a 32 MCT with similar dimension
and flow rate.
Table 6.4. Geometrically calculated parameters for the PDMS MCT.
Parameters for the PDMS MCT:
No. of PDMS tubes 32
Length (L) (cm) 5
i.d (cm) / i.r (cm) 0.03 / 0.015
o.d (cm) / o.r (cm) 0.065 / 0.0325
Volume of 1 tube (ml) = L [ πr2 (o.d) - πr2 (i.d) ] 0.013
Volume of total tube no. (ml) 0.417
Subtract 40 % (SiO2 filler contribution) (ml) 0.167
Volume PDMS (ml) 0.250
Volume sample (ml) 10
Phase ratio β 40
Glass trap tube i.d (cm) / i.r (cm) 0.4 / 0.2
Volume glass trap tube = L [ πr2 ] 0.628
Void Volume V0 = Volume (glass tube – PDMS) 0.211
No. of theoretical plates N 11
Chapter 6 – Determining endocrine disruptors from water
139
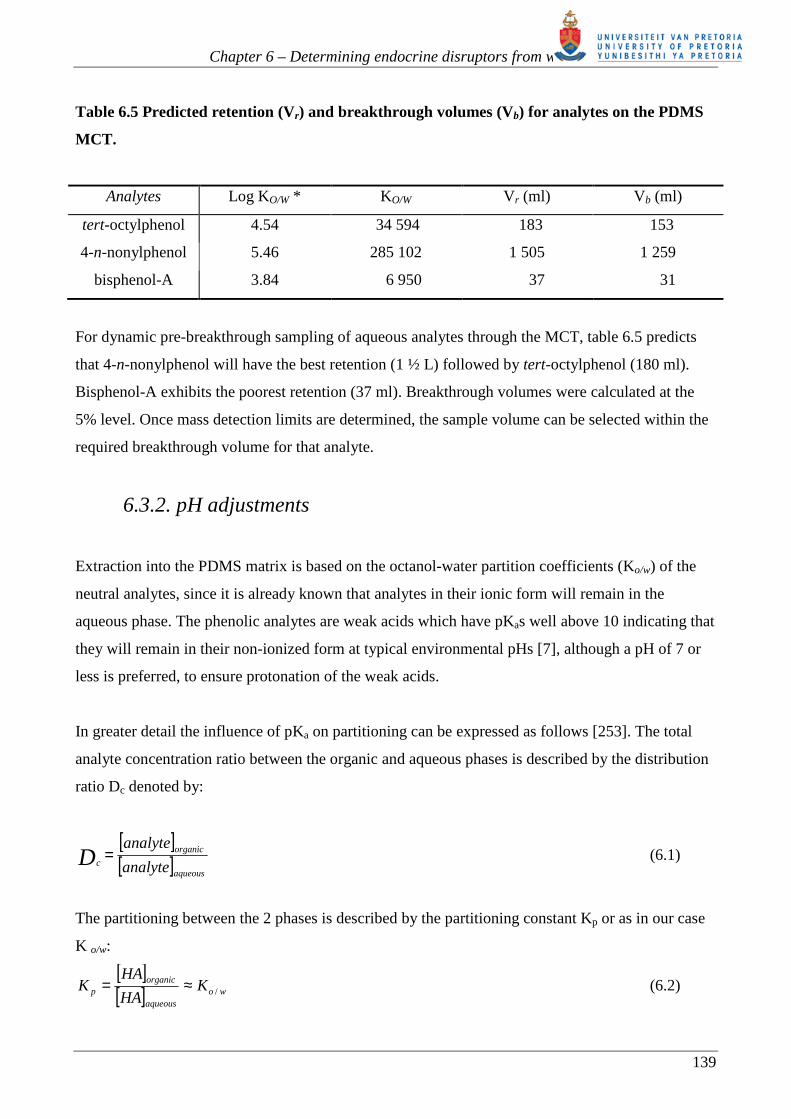
Table 6.5 Predicted retention (Vr) and breakthrough volumes (Vb) for analytes on the PDMS
MCT.
Analytes Log KO/W * KO/W Vr (ml) Vb (ml)
tert-octylphenol 4.54 34 594 183 153
4-n-nonylphenol 5.46 285 102 1 505 1 259
bisphenol-A 3.84 6 950 37 31
For dynamic pre-breakthrough sampling of aqueous analytes through the MCT, table 6.5 predicts
that 4-n-nonylphenol will have the best retention (1 ½ L) followed by tert-octylphenol (180 ml).
Bisphenol-A exhibits the poorest retention (37 ml). Breakthrough volumes were calculated at the
5% level. Once mass detection limits are determined, the sample volume can be selected within the
required breakthrough volume for that analyte.
6.3.2. pH adjustments
Extraction into the PDMS matrix is based on the octanol-water partition coefficients (Ko/w) of the
neutral analytes, since it is already known that analytes in their ionic form will remain in the
aqueous phase. The phenolic analytes are weak acids which have pKas well above 10 indicating that
they will remain in their non-ionized form at typical environmental pHs [7], although a pH of 7 or
less is preferred, to ensure protonation of the weak acids.
In greater detail the influence of pKa on partitioning can be expressed as follows [253]. The total
analyte concentration ratio between the organic and aqueous phases is described by the distribution
ratio Dc denoted by:
[ ][ ]aqueous
organic
c analyte
analyteD = (6.1)
The partitioning between the 2 phases is described by the partitioning constant Kp or as in our case
K o/w:
[ ][ ] wo
aqueous
organicp K
HA
HAK /≈= (6.2)
Chapter 6 – Determining endocrine disruptors from water
140
The acid dissociation constant Ka describes the dissociation of an acid in water (aqueous phase):
[ ] [ ][ ]aqueous
aqueousaqueousa HA
AHK
−+
= (6.3)
Assuming that ions are not soluble in the organic phase, Dc can be rewritten to give:
[ ][ ] [ ]aqueousaqueous
organicc AHA
HAD −+
= (6.4)
The total concentration of analyte in the aqueous phase is the amount of acid plus the amount of
acid that dissociates.
Equation 6.2, 6.3 and 6.4 are combined to yield the following:
[ ][ ] [ ]
[ ]aqueous
organic
p
a
p
organic
organicc
H
HA
K
K
K
HAHA
D
++= (6.5)
Equation 6.5 simplifies to:
[ ][ ] aaqueous
aqueouspc KH
HKD
+= +
+
(6.6)
If K a is much larger than [H+] then:
[ ]a
aqueouspc K
HKD
+
= (6.7)
And if [H+] is much larger than Ka then:
pc KD = (6.8)
The pH of all aqueous samples analysed was determined using universal pH paper. The pH of all
samples was in the range of 5-6, including the MilliQ water blanks. No pH adjustments were
therefore necessary. The ionization of these analytes analysed from water are depicted in table 6.6,
along with their associated pKa values [254]. The estrogens are not shown in this table, but their
pKa’s are also above 10 [21] as well. For these conditions the acid remains largely non-ionized
(from equation 6.3):

Chapter 6 – Determining endocrine disruptors from water
141
[ ][ ] [ ]
46
10
101010 −
−
−
+
−
===aqueous
a
aqueous
aqueous
H
K
HA
A
In addition, the distribution coefficient for a pKa of 10 and pH of 6 (Ka = 10-10 and [H+] = 10-6; [H+]
>>Ka) amounts to Ko/w (equation 6.8) as described by equation 6.2.
Table 6.6 Structure of the alkylphenols and bisphenol-A as they ionize in aqueous medium
plus their associated ionization constants at 25ºC [7, 254].
Analyte ionization in water pKa Ka
OH
t-C8H17
+ H O
H
O-
t-C8H17
+H
O+
H
H
tert-octylphenol
10.25 5.62 x 10⁻¹¹
OH
H19C9
+ H O
H
O-
H19C9
+H
O+
H
H
4-n-nonylphenol
10.28 5.25 x 10⁻¹¹
OH
OH
+ H O
H
O-
O-
2 +H
O+
H
H
2
bisphenol-A
9.5
11.3
3.16 x 10⁻¹⁰
5.01 x 10⁻¹²
Chapter 6 – Determining endocrine disruptors from water
142
6.4. Quantitative Thermal Desorption
6.4.1. Optimising desorption conditions
Several experiments were performed to determine the conditions under which the derivatives
would be completely transferred to the GC column i.e. when desorption is complete. As
described in chapter 2, the MCT can be compared to a chromatographic column having a PDMS
stationary phase. Compounds will elute off the MCT in the same order as compounds elute off a
non-polar (PDMS stationary phase) GC column.
Based on previous work in my MSc thesis [61], concerning thermal desorption optimisation, it is
convenient to optimise conditions using the alkane that elutes after the analyte of interest.
Nonadecane (C19) is the alkane eluting immediately after the BPA-TFA derivative on a PDMS
phase GC column. However, several alkanes with increasing boiling points (hence elution
temperatures) were used, since this would be useful for future applications. Little additional
effort was required to include them. The alkanes selected were C16, C20, C24 and C28. These
were placed at the top of the PDMS MCT using a 5 µL syringe. As desorption flow is from the
top to the bottom of the trap, once the alkanes are completely desorbed it is evident that any
compound that elutes before that specific alkane on a PDMS phase GC column, has also been
completely desorbed from the PDMS MCT. Traps were analysed using the Gerstel ® TDS-CIS
HP GC-FID instruments.
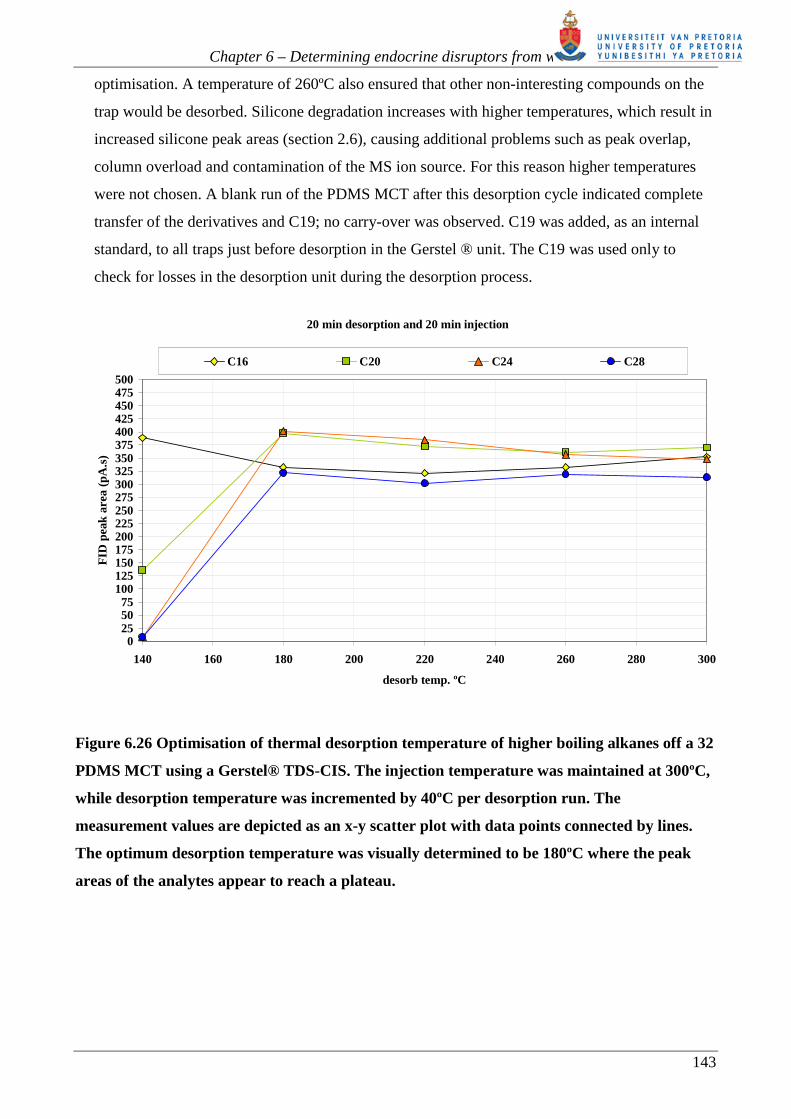
Figure 6.26 shows a graph of the various alkane FID peak areas versus desorption temperature,
for TDS desorption time of 20 minutes, desorption flow rate of 100 ml/min, and CIS injection
time of 20 min at 300ºC, with a reduced injection flow rate of 5 ml/min. The capillary column
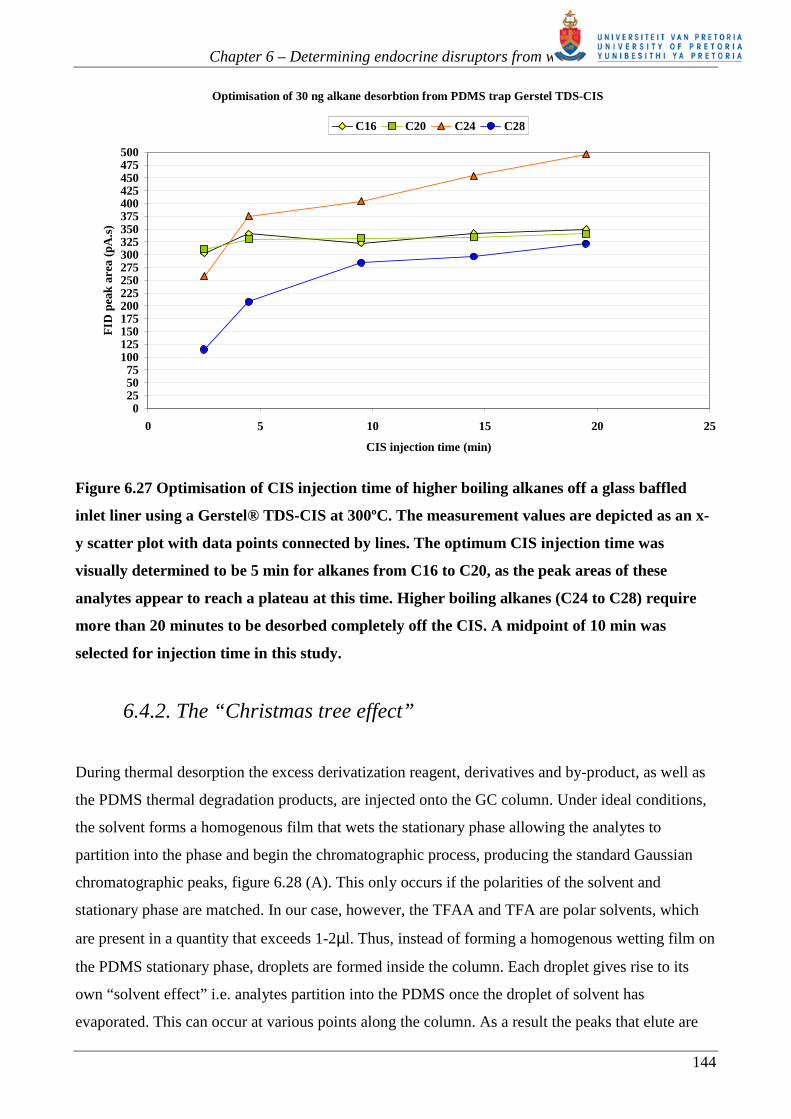
limits the CIS injection flow rate. Figure 6.27 shows that more than 10 minutes are required to
desorb the alkanes from the CIS at 300ºC, as a result of the lower flow rate available for this
process. As shown in figure 6.26 all the alkanes have reached a maximum peak area from 180ºC
onwards. It can be concluded that they have all been completely transferred from the PDMS trap.
A temperature of 260ºC was chosen for the desorption process, as it was later learned that
desorption flow rates greater than 50 ml/min through a glass baffled inlet liner may cause
incomplete trapping in the CIS. This is half the flow rate used during desorption temperature
Chapter 6 – Determining endocrine disruptors from water
143
optimisation. A temperature of 260ºC also ensured that other non-interesting compounds on the
trap would be desorbed. Silicone degradation increases with higher temperatures, which result in
increased silicone peak areas (section 2.6), causing additional problems such as peak overlap,
column overload and contamination of the MS ion source. For this reason higher temperatures
were not chosen. A blank run of the PDMS MCT after this desorption cycle indicated complete
transfer of the derivatives and C19; no carry-over was observed. C19 was added, as an internal
standard, to all traps just before desorption in the Gerstel ® unit. The C19 was used only to
check for losses in the desorption unit during the desorption process.
20 min desorption and 20 min injection
0255075
100125150175200225250275300325350375400425450475500
140 160 180 200 220 240 260 280 300
desorb temp. ºC
FID
pea
k ar
ea (
pA.s
)
C16 C20 C24 C28
Figure 6.26 Optimisation of thermal desorption temperature of higher boiling alkanes off a 32
PDMS MCT using a Gerstel® TDS-CIS. The injection temperature was maintained at 300ºC,
while desorption temperature was incremented by 40ºC per desorption run. The
measurement values are depicted as an x-y scatter plot with data points connected by lines.
The optimum desorption temperature was visually determined to be 180ºC where the peak
areas of the analytes appear to reach a plateau.
Chapter 6 – Determining endocrine disruptors from water
144
Optimisation of 30 ng alkane desorbtion from PDMS trap Gerstel TDS-CIS
0255075
100125150175200225250275300325350375400425450475500
0 5 10 15 20 25
CIS injection time (min)
FID
pea
k ar
ea (
pA.s
)
C16 C20 C24 C28
Figure 6.27 Optimisation of CIS injection time of higher boiling alkanes off a glass baffled
inlet liner using a Gerstel® TDS-CIS at 300ºC. The measurement values are depicted as an x-
y scatter plot with data points connected by lines. The optimum CIS injection time was
visually determined to be 5 min for alkanes from C16 to C20, as the peak areas of these
analytes appear to reach a plateau at this time. Higher boiling alkanes (C24 to C28) require
more than 20 minutes to be desorbed completely off the CIS. A midpoint of 10 min was
selected for injection time in this study.
6.4.2. The “Christmas tree effect”
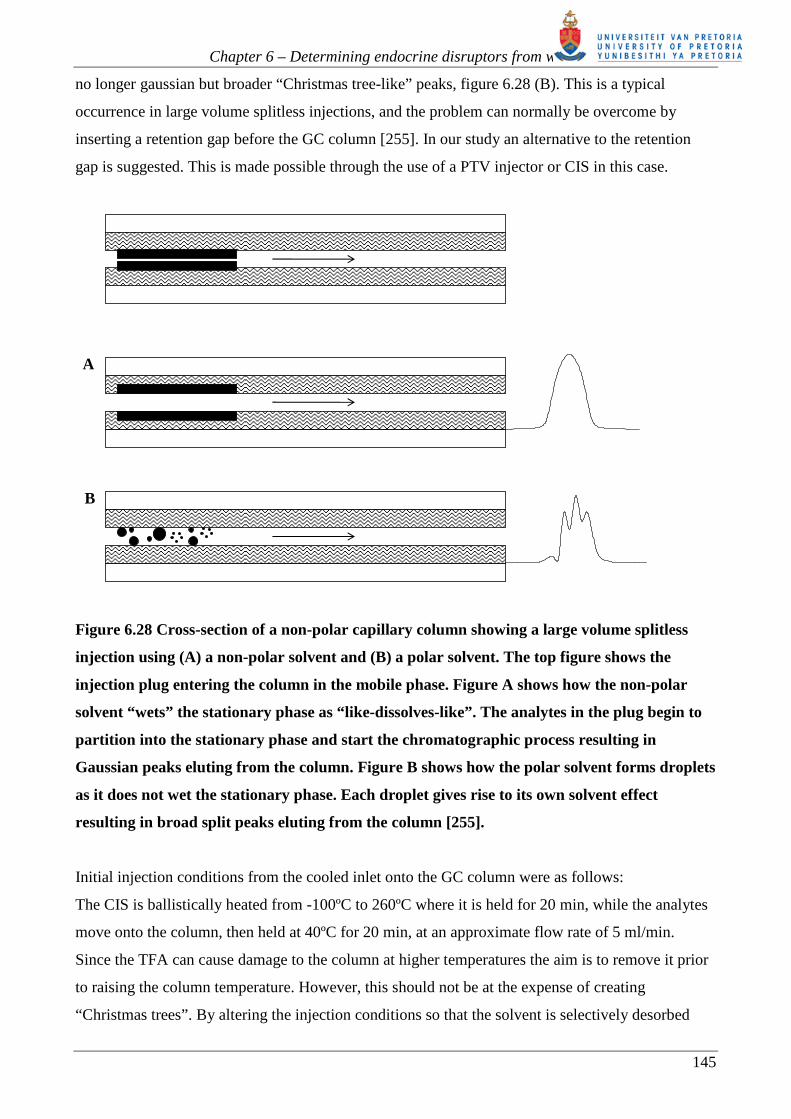
During thermal desorption the excess derivatization reagent, derivatives and by-product, as well as
the PDMS thermal degradation products, are injected onto the GC column. Under ideal conditions,
the solvent forms a homogenous film that wets the stationary phase allowing the analytes to
partition into the phase and begin the chromatographic process, producing the standard Gaussian
chromatographic peaks, figure 6.28 (A). This only occurs if the polarities of the solvent and
stationary phase are matched. In our case, however, the TFAA and TFA are polar solvents, which
are present in a quantity that exceeds 1-2µl. Thus, instead of forming a homogenous wetting film on
the PDMS stationary phase, droplets are formed inside the column. Each droplet gives rise to its
own “solvent effect” i.e. analytes partition into the PDMS once the droplet of solvent has
evaporated. This can occur at various points along the column. As a result the peaks that elute are
Chapter 6 – Determining endocrine disruptors from water
145
no longer gaussian but broader “Christmas tree-like” peaks, figure 6.28 (B). This is a typical
occurrence in large volume splitless injections, and the problem can normally be overcome by
inserting a retention gap before the GC column [255]. In our study an alternative to the retention
gap is suggested. This is made possible through the use of a PTV injector or CIS in this case.
A
B
Figure 6.28 Cross-section of a non-polar capillary column showing a large volume splitless
injection using (A) a non-polar solvent and (B) a polar solvent. The top figure shows the
injection plug entering the column in the mobile phase. Figure A shows how the non-polar
solvent “wets” the stationary phase as “like-dissolves-like”. The analytes in the plug begin to
partition into the stationary phase and start the chromatographic process resulting in
Gaussian peaks eluting from the column. Figure B shows how the polar solvent forms droplets
as it does not wet the stationary phase. Each droplet gives rise to its own solvent effect
resulting in broad split peaks eluting from the column [255].
Initial injection conditions from the cooled inlet onto the GC column were as follows:
The CIS is ballistically heated from -100ºC to 260ºC where it is held for 20 min, while the analytes
move onto the column, then held at 40ºC for 20 min, at an approximate flow rate of 5 ml/min.
Since the TFA can cause damage to the column at higher temperatures the aim is to remove it prior
to raising the column temperature. However, this should not be at the expense of creating
“Christmas trees”. By altering the injection conditions so that the solvent is selectively desorbed
Chapter 6 – Determining endocrine disruptors from water
146
(based on boiling point) from the CIS prior to desorption of the analytes, it is possible to remove the
excess TFA such that the “Christmas tree” effect is avoided.
The CIS desorption conditions were altered as follows:
The CIS was heated from -100ºC to 35ºC, where it was maintained for 10 min. During this period,
the TFA moved off the CIS onto the column. However, since the column was maintained at 40ºC
for 20 min, the “solvent” could not recondense, but moved straight through the column unretained.
At this point the CIS was heated to 260ºC and held for 10 min, while the analytes were focussed
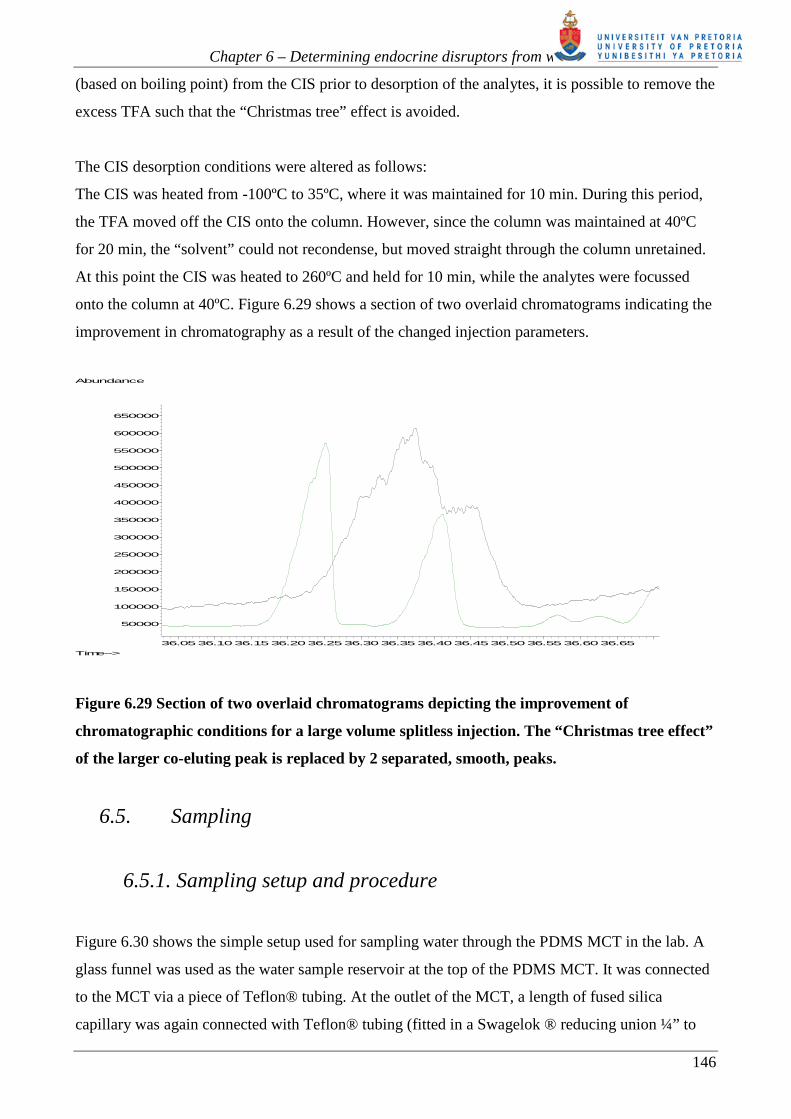
onto the column at 40ºC. Figure 6.29 shows a section of two overlaid chromatograms indicating the
improvement in chromatography as a result of the changed injection parameters.
Figure 6.29 Section of two overlaid chromatograms depicting the improvement of
chromatographic conditions for a large volume splitless injection. The “Christmas tree effect”
of the larger co-eluting peak is replaced by 2 separated, smooth, peaks.
6.5. Sampling
6.5.1. Sampling setup and procedure
Figure 6.30 shows the simple setup used for sampling water through the PDMS MCT in the lab. A
glass funnel was used as the water sample reservoir at the top of the PDMS MCT. It was connected
to the MCT via a piece of Teflon® tubing. At the outlet of the MCT, a length of fused silica
capillary was again connected with Teflon® tubing (fitted in a Swagelok ® reducing union ¼” to
36.0536.1036.15 36.2036.2536.30 36.35 36.4036.4536.50 36.55 36.6036.65
50000
100000
150000
200000
250000
300000
350000
400000
450000
500000
550000
600000
650000
Time-->
Abundance
Signal: 14APR001.D\FID1A.CHSignal: 14APR003.D\FID1A.CH
Chapter 6 – Determining endocrine disruptors from water
147
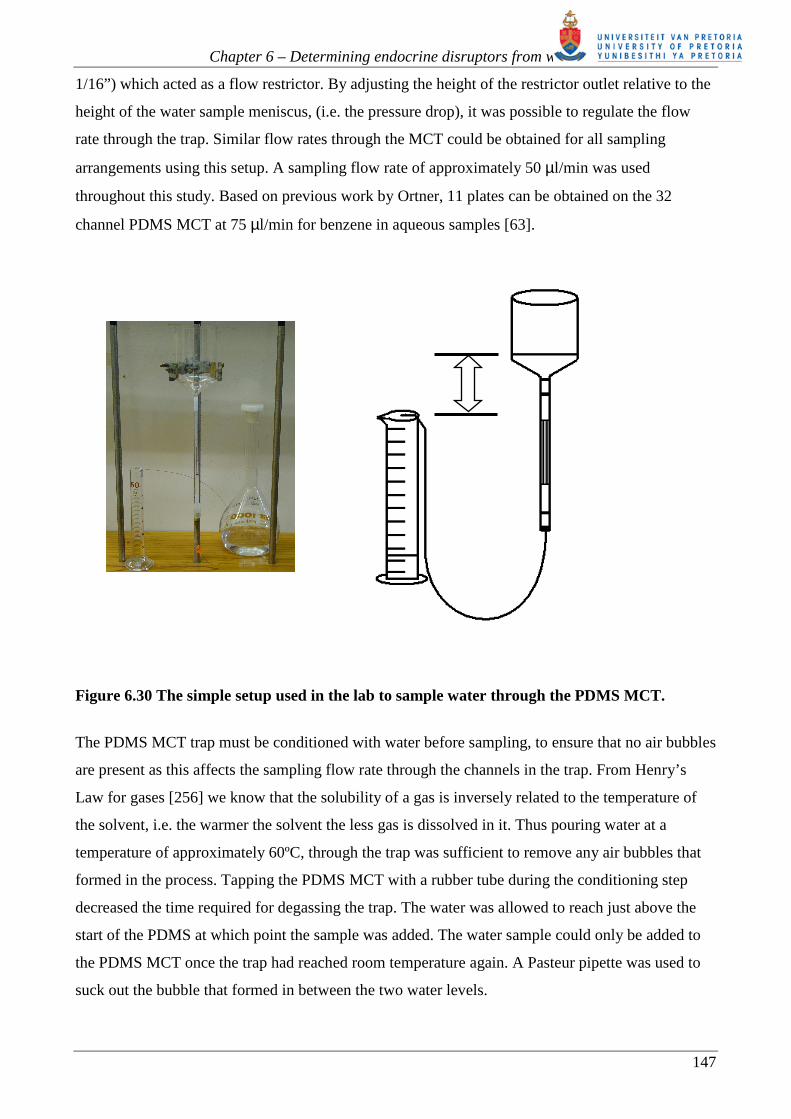
1/16”) which acted as a flow restrictor. By adjusting the height of the restrictor outlet relative to the
height of the water sample meniscus, (i.e. the pressure drop), it was possible to regulate the flow
rate through the trap. Similar flow rates through the MCT could be obtained for all sampling
arrangements using this setup. A sampling flow rate of approximately 50 µl/min was used
throughout this study. Based on previous work by Ortner, 11 plates can be obtained on the 32
channel PDMS MCT at 75 µl/min for benzene in aqueous samples [63].
Figure 6.30 The simple setup used in the lab to sample water through the PDMS MCT.
The PDMS MCT trap must be conditioned with water before sampling, to ensure that no air bubbles
are present as this affects the sampling flow rate through the channels in the trap. From Henry’s
Law for gases [256] we know that the solubility of a gas is inversely related to the temperature of
the solvent, i.e. the warmer the solvent the less gas is dissolved in it. Thus pouring water at a
temperature of approximately 60ºC, through the trap was sufficient to remove any air bubbles that
formed in the process. Tapping the PDMS MCT with a rubber tube during the conditioning step
decreased the time required for degassing the trap. The water was allowed to reach just above the
start of the PDMS at which point the sample was added. The water sample could only be added to
the PDMS MCT once the trap had reached room temperature again. A Pasteur pipette was used to
suck out the bubble that formed in between the two water levels.
Chapter 6 – Determining endocrine disruptors from water
148
The risk of losing analytes through adsorption onto active sites on the glassware was possible at this
stage. It was assumed that the amount of time that the sample spent in the sampling funnel was
short enough such that adsorption would not occur. Usually an organic modifier such as methanol
could be added to the sample to prevent adsorption from occurring [47].
6.6. Experimental
6.6.1. Instrumentation
The analyses were performed on an Agilent 6890 GC system equipped with an FID or a 5973 Mass
Selective Detector (Agilent Technologies, Palo Alto, CA, U.S.A) coupled to a Gerstel TDS-CIS4
thermal desorption unit (Gerstel, Mülheim an der Ruhr, Germany). An empty glass-baffled inlet
liner was fitted in the CIS4; liquid nitrogen was used as the cryogen.
The thermal desorption conditions were as follows:
Desorption temperature 260ºC; desorption time 20 min; helium desorption flow rate 50 ml/min
(solvent vent mode); transfer line temperature 280ºC.
The cold inlet conditions were as follows:
CIS trap temperature during thermal desorption -100ºC; inject splitless for 10 min; 1st heating rate
10ºC/s, initial injection temperature 35ºC hold time 5 min, 2nd heating rate 10ºC/s, final injection
temperature 280ºC hold time 5 min.
The GC oven was fitted with an HP-5 capillary column (30 m length, 0.25 mm i.d. and 0.25 µm
film thickness). The oven was programmed as follows: 40ºC (hold for 10 min during the splitless
injection) to 160ºC at a rate of 12ºC/min (hold 3 min) and to 220ºC at a rate of 12ºC/min. The oven
was then heated to 300ºC (hold for 2 min). Helium was used as carrier gas with an average linear
velocity of 40 cm/s. The FID temperature was set to 300ºC. The GC-MSD transfer line was set to
280ºC.
The MSD was programmed either for total ion scan from 40-500 amu or for SIM: m/z 231, 203,
245, 216, 405, 420, the 3 most abundant ions for each derivative.

Chapter 6 – Determining endocrine disruptors from water
149
6.6.2. Reagents and Materials
Trifluoroacetic acid anhydride (TFAA) was obtained from Supelco (Bellefonte, U.S.A.), 4-tert-
octylphenol (TOP) from Aldrich (Steinheim, Germany), 4-n-nonylphenol (NP) from Riedel-de
Haën (Steinheim, Germany) and bisphenol A (BPA) from Fluka (Steinheim, Germany). Medical
grade PDMS tubing was obtained from Sil-Tech technical products (Georgia, USA). The method
adopted for preparing PDMS MCTs is described in the literature [65].
6.6.3. Extraction Efficiency
2 ml MilliQ water was spiked with 1 µl of a 40 ng/µl solution of alkylphenols and bisphenol-A in
methanol. The water was sampled by pouring it through a funnel connected to the PDMS trap with
Teflon® tubing. The flow through the trap was regulated using a capillary restrictor connected at
the PDMS trap outlet. The sampling flow rate was set at approximately 50 µl/min. After sampling,
residual water was removed by physically tapping it out, then purging (1 minute) with a fast stream
(approximately 1 L/min) of hydrogen gas introduced through a capillary. The traps were then
plugged with silica gel to remove any further water vapour before derivatization. The silica gel was
baked in an oven at 100ºC when not in use. The plugs were prepared using glass tubes of the same
dimension as the PDMS MCT. Each tube has one side sealed off. The silica gel is packed into the
tube which is then pressed onto the PDMS trap using a tightly fitting Teflon® sleeve. The silica gel
does not come into physical contact with the PDMS. No signs of contamination originating from
this operation was observed in the resulting chromatograms. Recoveries were compared to a 40 ng
standard in acetone, placed on the PDMS trap, reacted and desorbed.
This extraction efficiency experiment was repeated twice. The first series of extractions was
performed using a set of traps prepared from the same batch of silicone. The extracted analytes
from this first set of traps were analysed by GC-FID. The second series of extractions was
performed using a set of traps prepared from a different batch of silicone to the first series. The
extracted analytes from these traps were analysed by GC-MS (using reconstructed ions).
Chapter 6 – Determining endocrine disruptors from water
150
6.6.4. Reaction efficiency
The optimum reagent volume was determined by placing 1 µl of a 40 ng/µl alkylphenol standard in
acetone onto the PDMS and allowing the acetone to evaporate. Different volumes ranging from 2 µl
to 10 µl of TFAA was added using a 10 µl syringe. The trap was capped on both ends with glass
plugs for 10 minutes.
The reaction efficiency was tested by placing 1 µl of a 40 ng/µl alkylphenol standard in acetone
onto the PDMS and allowing it to evaporate. 5 µl TFAA was added using a 10 µl syringe. The trap
was capped on both ends with glass plugs for the duration of the reaction. This experiment was
repeated for different reaction times. Structures of the derivatives were confirmed by EI mass
spectrometry (figure 6.23 – 6.25) [62]. The derivative masses were obtained by comparison to the
synthesized derivatives in acetone (refer to section 6.2.6).
6.6.5. Reaction Calibration Curves
Calibration curves for the derivatives were obtained after the in situ reaction with the standards of
the target analytes. The underivatized alkylphenols were prepared in acetone in concentrations
ranging from 5 to 80 ng/µl. 1 µl of the standard mixture was placed on the trap and allowed to
evaporate. 5 µl TFAA was added to the trap and allowed to react for 10 minutes. The trap was then
thermally desorbed. The quantity of derivative formed was determined by comparison with the
synthesized derivatives in acetone (refer to section 6.2.6).
6.7. Results and Discussion
6.7.1. Extraction efficiency
The extraction efficiencies, obtained on different PDMS MCTs (made from 2 different PDMS
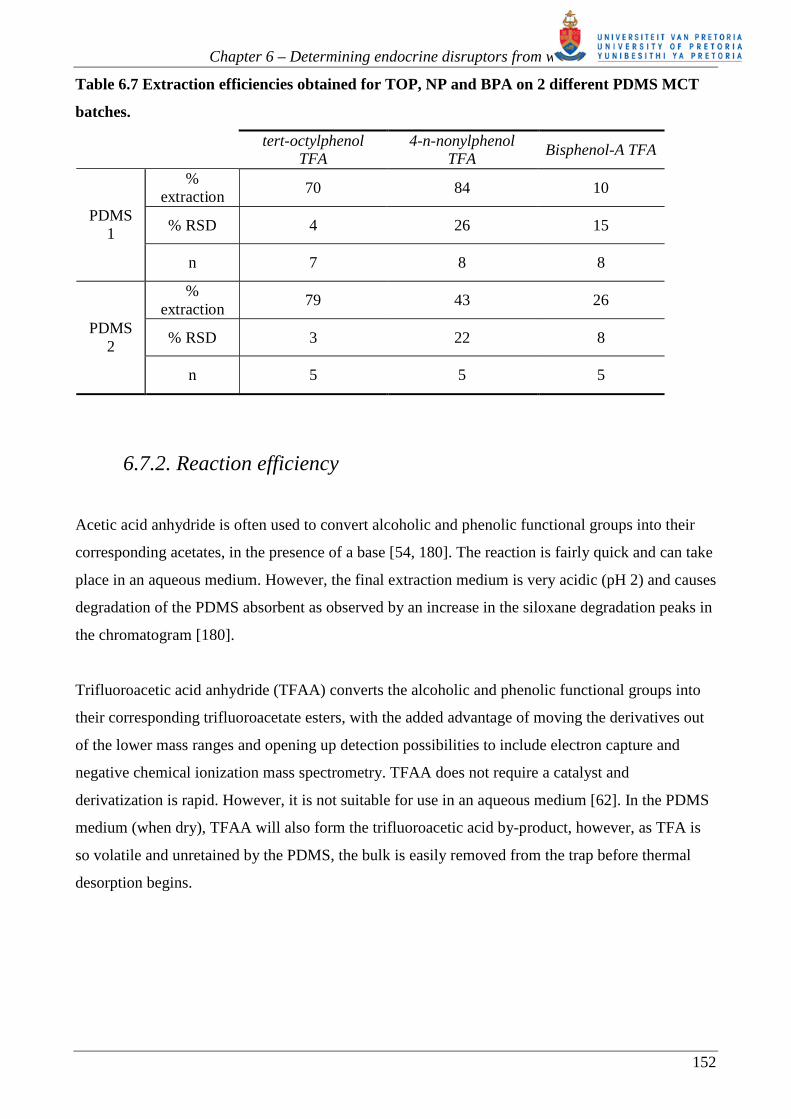
batches), are summarized in table 6.7. The tert-octylphenol (TOP) displays good recoveries (~70-
79%) on both trap batches with similar extraction efficiencies. On the first PDMS batch
nonylphenol (NP) was 80% extracted. However, the second PDMS batch only extracted half that
amount. In both cases the variation was large. Bisphenol-A (BPA), was poorly extracted (between
Chapter 6 – Determining endocrine disruptors from water
151
10-26%) on both PDMS batches. The poor extraction confirmed previous work performed by
Nakamura et al. [54] using SBSE. The results of a two-tailed t-test (P=0.05) indicated that the
means of the results of the 2 batches for each analyte differ significantly. The significance test can
be found in appendix 4.
Extraction of analytes into PDMS can loosely be predicted by the octanol-water partition coefficient
of the analyte. Typically, high extraction efficiencies are obtained for compounds with large
octanol-water partition coefficients [257, 258]. BPA, despite having a relatively large octanol-water
partition coefficient, does not partition well into PDMS. Extraction only improves once hydroxyl
groups have been derivatized. Although designed to operate under dynamic pre-breakthrough
sampling conditions (100% extraction expected) i.e. a 5 ml water sample is less than the calculated
breakthrough volumes of any of the analytes, shown in table 6.5, extraction efficiencies are even
less than those expected for dynamic equilibrium sampling conditions shown in table 6.3. Further
work is required to investigate the reason for the low extraction efficiency observed.
In addition, table 6.7 indicates a poor reproducibility between different batches of PDMS tubing,
which will require further investigation. This can be due to differences in the PDMS polymer
material or to particulates in the trap. It is unlikely that particulates larger than 0.45 µm are present
in the filtered MilliQ water. Other particulates may arise from dust in the laboratory.
As noted in section 6.7.2 below, the reaction efficiency data indicates that constant derivatization
efficiency can be expected. We therefore assume that it too does not contribute to the observed
variation. A reconstructed ion chromatogram of the raw alkylphenols’ most abundant ions m/z 135
and 213 from the extraction analyses does not indicate the presence of unreacted TOP or NP, see
appendix 3. As for BPA, the chromatographic run was stopped before the unreacted analyte could
be detected. However, as discussed below, we would expect to see BPA since it does not convert
efficiently.
Chapter 6 – Determining endocrine disruptors from water
152
Table 6.7 Extraction efficiencies obtained for TOP, NP and BPA on 2 different PDMS MCT
batches.
tert-octylphenol
TFA 4-n-nonylphenol
TFA Bisphenol-A TFA
% extraction
70 84 10
% RSD 4 26 15 PDMS
1
n 7 8 8
% extraction
79 43 26
% RSD 3 22 8 PDMS
2
n 5 5 5
6.7.2. Reaction efficiency
Acetic acid anhydride is often used to convert alcoholic and phenolic functional groups into their
corresponding acetates, in the presence of a base [54, 180]. The reaction is fairly quick and can take
place in an aqueous medium. However, the final extraction medium is very acidic (pH 2) and causes
degradation of the PDMS absorbent as observed by an increase in the siloxane degradation peaks in
the chromatogram [180].
Trifluoroacetic acid anhydride (TFAA) converts the alcoholic and phenolic functional groups into
their corresponding trifluoroacetate esters, with the added advantage of moving the derivatives out
of the lower mass ranges and opening up detection possibilities to include electron capture and
negative chemical ionization mass spectrometry. TFAA does not require a catalyst and
derivatization is rapid. However, it is not suitable for use in an aqueous medium [62]. In the PDMS
medium (when dry), TFAA will also form the trifluoroacetic acid by-product, however, as TFA is
so volatile and unretained by the PDMS, the bulk is easily removed from the trap before thermal
desorption begins.
Chapter 6 – Determining endocrine disruptors from water
153
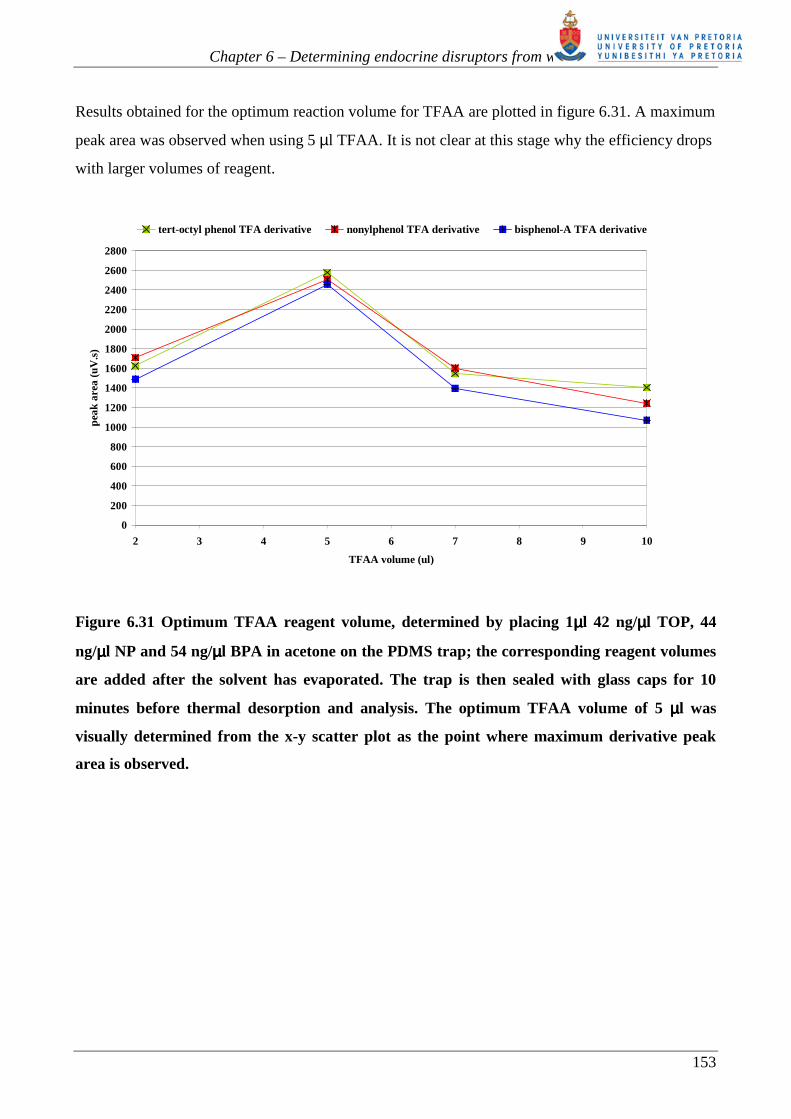
Results obtained for the optimum reaction volume for TFAA are plotted in figure 6.31. A maximum
peak area was observed when using 5 µl TFAA. It is not clear at this stage why the efficiency drops
with larger volumes of reagent.
0
200
400
600
800
1000
1200
1400
1600
1800
2000
2200
2400
2600
2800
2 3 4 5 6 7 8 9 10
TFAA volume (ul)
peak
are
a (u
V.s
)
tert-octyl phenol TFA derivative nonylphenol TFA derivative bisphenol-A TFA derivative
Figure 6.31 Optimum TFAA reagent volume, determined by placing 1µµµµl 42 ng/µµµµl TOP, 44
ng/µµµµl NP and 54 ng/µµµµl BPA in acetone on the PDMS trap; the corresponding reagent volumes
are added after the solvent has evaporated. The trap is then sealed with glass caps for 10
minutes before thermal desorption and analysis. The optimum TFAA volume of 5 µµµµl was
visually determined from the x-y scatter plot as the point where maximum derivative peak
area is observed.
Chapter 6 – Determining endocrine disruptors from water
154
0
5
10
15
20
25
30
35
40
45
50
55
0 5 10 15 20 25 30 35 40
reaction time (min)
mas
s (n
g)
tert-octyl phenol TFA 4-n-nonylphenol TFA bisphenol-A-TFA
ACTUAL MASS OF BISPHENOL-A TFA DERIVATIVE
ACTUAL MASS OF tert-OCTYLPHENOL TFA DERIVATIVE
ACTUAL MASS OF NONYLPHENOL-TFA DERVATIVE
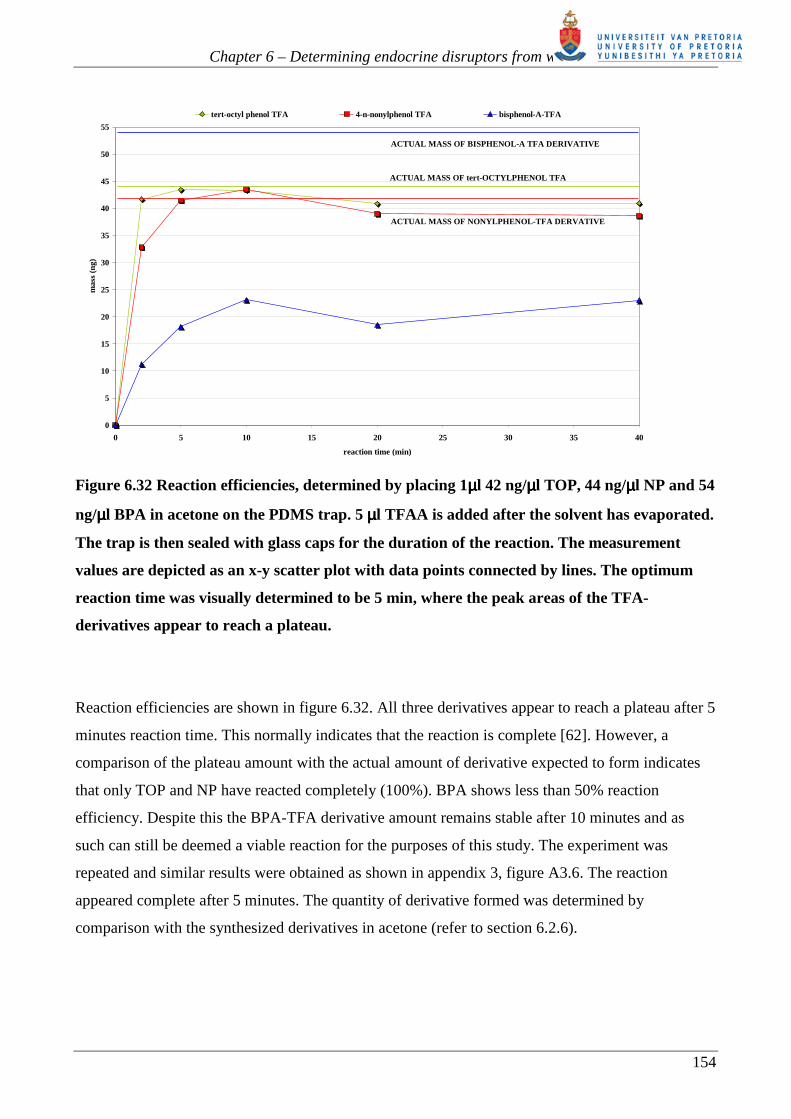
Figure 6.32 Reaction efficiencies, determined by placing 1µµµµl 42 ng/µµµµl TOP, 44 ng/µµµµl NP and 54
ng/µµµµl BPA in acetone on the PDMS trap. 5 µµµµl TFAA is added after the solvent has evaporated.
The trap is then sealed with glass caps for the duration of the reaction. The measurement
values are depicted as an x-y scatter plot with data points connected by lines. The optimum
reaction time was visually determined to be 5 min, where the peak areas of the TFA-
derivatives appear to reach a plateau.
Reaction efficiencies are shown in figure 6.32. All three derivatives appear to reach a plateau after 5
minutes reaction time. This normally indicates that the reaction is complete [62]. However, a
comparison of the plateau amount with the actual amount of derivative expected to form indicates
that only TOP and NP have reacted completely (100%). BPA shows less than 50% reaction
efficiency. Despite this the BPA-TFA derivative amount remains stable after 10 minutes and as
such can still be deemed a viable reaction for the purposes of this study. The experiment was
repeated and similar results were obtained as shown in appendix 3, figure A3.6. The reaction
appeared complete after 5 minutes. The quantity of derivative formed was determined by
comparison with the synthesized derivatives in acetone (refer to section 6.2.6).
Chapter 6 – Determining endocrine disruptors from water
155
6.7.3.Reaction calibration curves
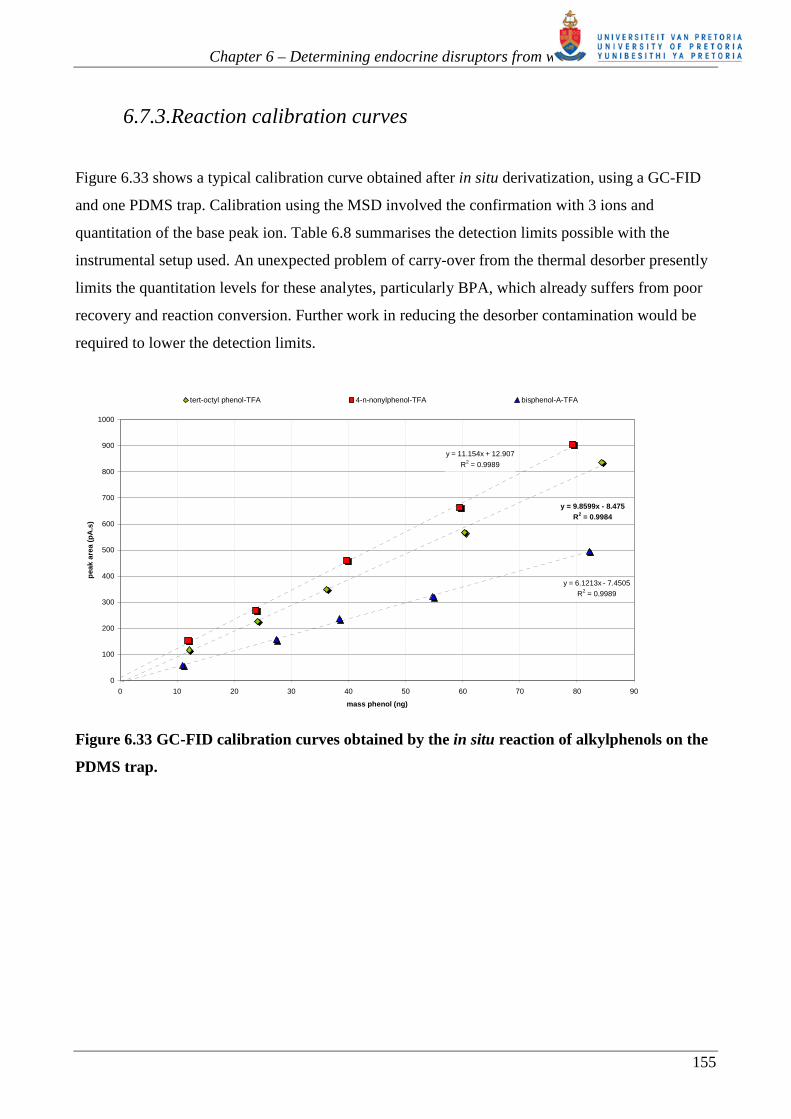
Figure 6.33 shows a typical calibration curve obtained after in situ derivatization, using a GC-FID
and one PDMS trap. Calibration using the MSD involved the confirmation with 3 ions and
quantitation of the base peak ion. Table 6.8 summarises the detection limits possible with the
instrumental setup used. An unexpected problem of carry-over from the thermal desorber presently
limits the quantitation levels for these analytes, particularly BPA, which already suffers from poor
recovery and reaction conversion. Further work in reducing the desorber contamination would be
required to lower the detection limits.
y = 11.154x + 12.907
R2 = 0.9989
y = 9.8599x - 8.475R2 = 0.9984
y = 6.1213x - 7.4505
R2 = 0.9989
0
100
200
300
400
500
600
700
800
900
1000
0 10 20 30 40 50 60 70 80 90
mass phenol (ng)
pea
k ar
ea (
pA
.s)
tert-octyl phenol-TFA 4-n-nonylphenol-TFA bisphenol-A-TFA
Figure 6.33 GC-FID calibration curves obtained by the in situ reaction of alkylphenols on the
PDMS trap.
Chapter 6 – Determining endocrine disruptors from water
156
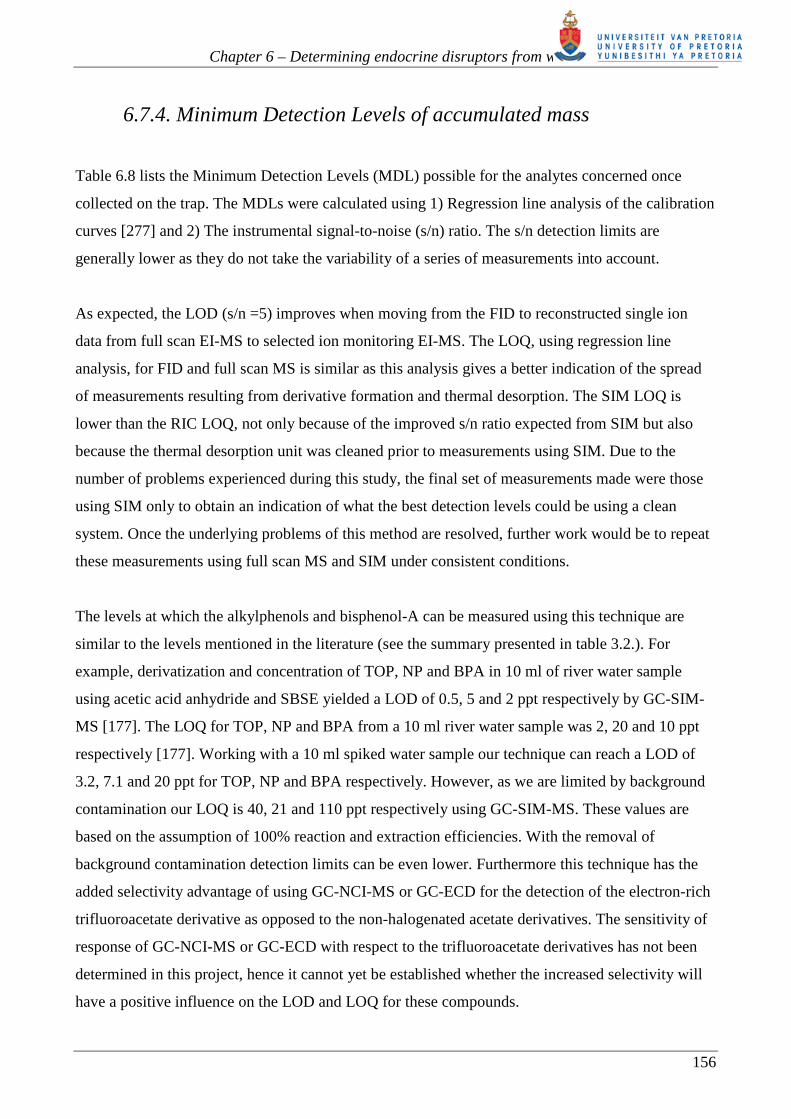
6.7.4. Minimum Detection Levels of accumulated mass
Table 6.8 lists the Minimum Detection Levels (MDL) possible for the analytes concerned once
collected on the trap. The MDLs were calculated using 1) Regression line analysis of the calibration
curves [277] and 2) The instrumental signal-to-noise (s/n) ratio. The s/n detection limits are
generally lower as they do not take the variability of a series of measurements into account.
As expected, the LOD (s/n =5) improves when moving from the FID to reconstructed single ion
data from full scan EI-MS to selected ion monitoring EI-MS. The LOQ, using regression line
analysis, for FID and full scan MS is similar as this analysis gives a better indication of the spread
of measurements resulting from derivative formation and thermal desorption. The SIM LOQ is
lower than the RIC LOQ, not only because of the improved s/n ratio expected from SIM but also
because the thermal desorption unit was cleaned prior to measurements using SIM. Due to the
number of problems experienced during this study, the final set of measurements made were those
using SIM only to obtain an indication of what the best detection levels could be using a clean
system. Once the underlying problems of this method are resolved, further work would be to repeat
these measurements using full scan MS and SIM under consistent conditions.
The levels at which the alkylphenols and bisphenol-A can be measured using this technique are
similar to the levels mentioned in the literature (see the summary presented in table 3.2.). For
example, derivatization and concentration of TOP, NP and BPA in 10 ml of river water sample
using acetic acid anhydride and SBSE yielded a LOD of 0.5, 5 and 2 ppt respectively by GC-SIM-
MS [177]. The LOQ for TOP, NP and BPA from a 10 ml river water sample was 2, 20 and 10 ppt
respectively [177]. Working with a 10 ml spiked water sample our technique can reach a LOD of
3.2, 7.1 and 20 ppt for TOP, NP and BPA respectively. However, as we are limited by background
contamination our LOQ is 40, 21 and 110 ppt respectively using GC-SIM-MS. These values are
based on the assumption of 100% reaction and extraction efficiencies. With the removal of
background contamination detection limits can be even lower. Furthermore this technique has the
added selectivity advantage of using GC-NCI-MS or GC-ECD for the detection of the electron-rich
trifluoroacetate derivative as opposed to the non-halogenated acetate derivatives. The sensitivity of
response of GC-NCI-MS or GC-ECD with respect to the trifluoroacetate derivatives has not been
determined in this project, hence it cannot yet be established whether the increased selectivity will
have a positive influence on the LOD and LOQ for these compounds.
Chapter 6 – Determining endocrine disruptors from water
157
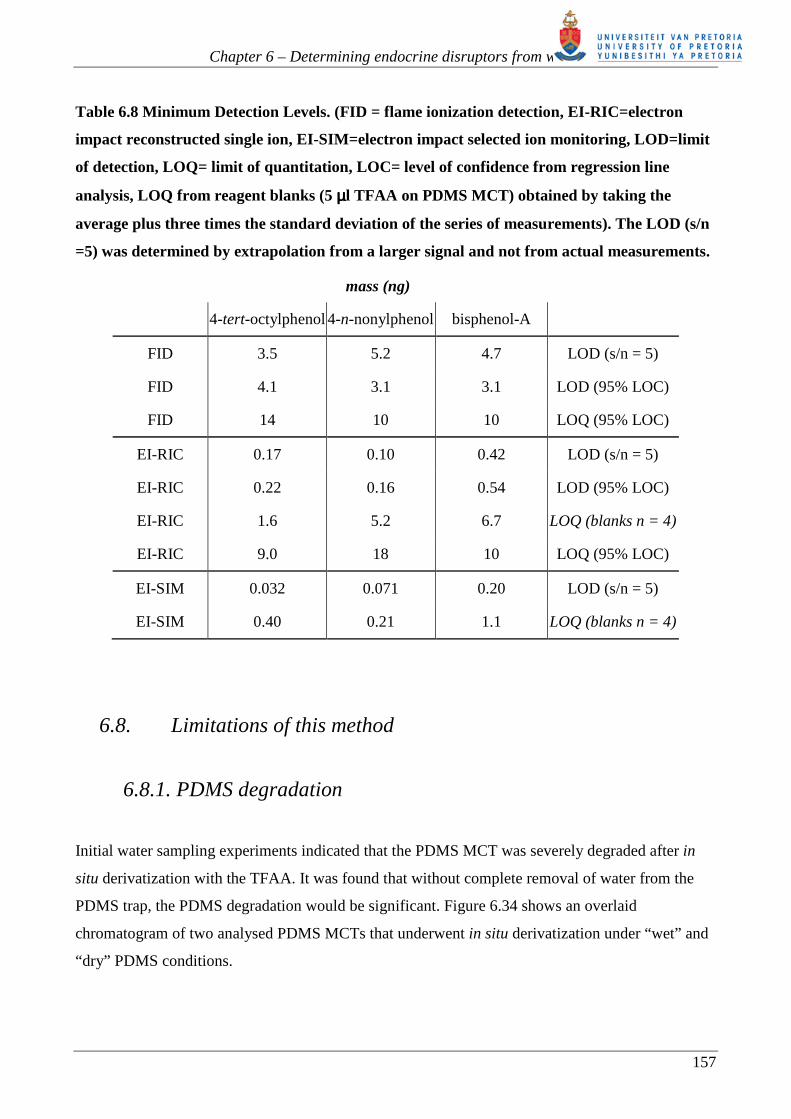
Table 6.8 Minimum Detection Levels. (FID = flame ionization detection, EI-RIC=electron
impact reconstructed single ion, EI-SIM=electron impact selected ion monitoring, LOD=limit
of detection, LOQ= limit of quantitation, LOC= level of confidence from regression line
analysis, LOQ from reagent blanks (5 µµµµl TFAA on PDMS MCT) obtained by taking the
average plus three times the standard deviation of the series of measurements). The LOD (s/n
=5) was determined by extrapolation from a larger signal and not from actual measurements.
mass (ng)
4-tert-octylphenol 4-n-nonylphenol bisphenol-A
FID 3.5 5.2 4.7 LOD (s/n = 5)
FID 4.1 3.1 3.1 LOD (95% LOC)
FID 14 10 10 LOQ (95% LOC)
EI-RIC 0.17 0.10 0.42 LOD (s/n = 5)
EI-RIC 0.22 0.16 0.54 LOD (95% LOC)
EI-RIC 1.6 5.2 6.7 LOQ (blanks n = 4)
EI-RIC 9.0 18 10 LOQ (95% LOC)
EI-SIM 0.032 0.071 0.20 LOD (s/n = 5)
EI-SIM 0.40 0.21 1.1 LOQ (blanks n = 4)
6.8. Limitations of this method
6.8.1. PDMS degradation
Initial water sampling experiments indicated that the PDMS MCT was severely degraded after in
situ derivatization with the TFAA. It was found that without complete removal of water from the
PDMS trap, the PDMS degradation would be significant. Figure 6.34 shows an overlaid
chromatogram of two analysed PDMS MCTs that underwent in situ derivatization under “wet” and
“dry” PDMS conditions.
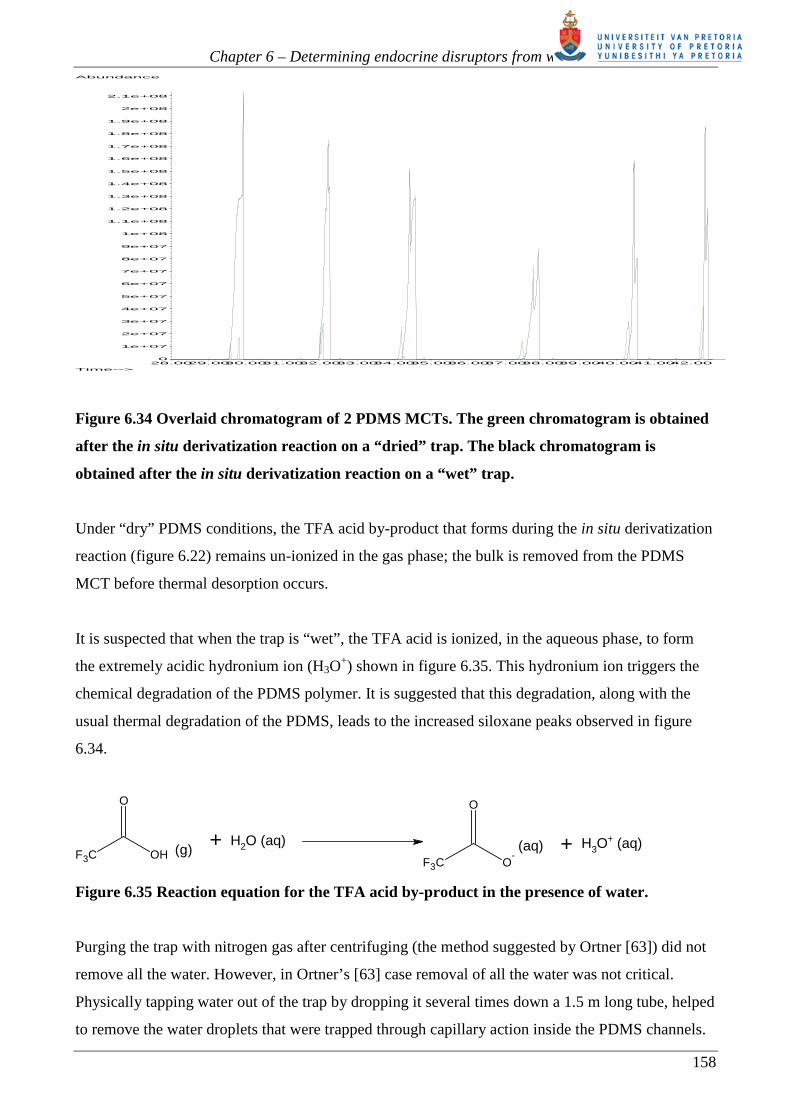
Chapter 6 – Determining endocrine disruptors from water
158
Figure 6.34 Overlaid chromatogram of 2 PDMS MCTs. The green chromatogram is obtained
after the in situ derivatization reaction on a “dried” trap. The black chromatogram is
obtained after the in situ derivatization reaction on a “wet” trap.
Under “dry” PDMS conditions, the TFA acid by-product that forms during the in situ derivatization
reaction (figure 6.22) remains un-ionized in the gas phase; the bulk is removed from the PDMS
MCT before thermal desorption occurs.
It is suspected that when the trap is “wet”, the TFA acid is ionized, in the aqueous phase, to form
the extremely acidic hydronium ion (H3O+) shown in figure 6.35. This hydronium ion triggers the
chemical degradation of the PDMS polymer. It is suggested that this degradation, along with the
usual thermal degradation of the PDMS, leads to the increased siloxane peaks observed in figure
6.34.
O
F3C OH (g) + H2O (aq)
F3C
O
O-
+(aq) H3O+ (aq)
Figure 6.35 Reaction equation for the TFA acid by-product in the presence of water.
Purging the trap with nitrogen gas after centrifuging (the method suggested by Ortner [63]) did not
remove all the water. However, in Ortner’s [63] case removal of all the water was not critical.
Physically tapping water out of the trap by dropping it several times down a 1.5 m long tube, helped
to remove the water droplets that were trapped through capillary action inside the PDMS channels.
28.0029.0030.0031.0032.0033.0034.0035.0036.0037.0038.0039.0040.0041.0042.000
1e+07
2e+07
3e+07
4e+07
5e+07
6e+07
7e+07
8e+07
9e+07
1e+08
1.1e+08
1.2e+08
1.3e+08
1.4e+08
1.5e+08
1.6e+08
1.7e+08
1.8e+08
1.9e+08
2e+08
2.1e+08
Time-->
Abundance
TIC: 08DEC0511.DTIC: 08DEC0515.D (*)
Chapter 6 – Determining endocrine disruptors from water
159
Followed by a 1 min high flow (approximately 1L/min) purge with hydrogen gas, this process
removed most of the water from the trap. See appendix 5 for the trap drying investigation results.
The best results were obtained when the trap was capped with dried silica gel for approximately 2
hours or left overnight. This last step removed any residual vapour caught in the PDMS matrix.
Removal of the residual water vapour could not be determined gravimetrically, see appendix 5. The
only indication that all the water vapour had been removed was through the in situ derivatization in
the PDMS. When the size of the PDMS degradation peaks resulting from a PDMS MCT having
undergone in situ derivatization did not differ much from the PDMS degradation peaks resulting
from a PDMS MCT blank desorption run, we assumed that all the water had been removed. As
discussed in chapter 2 (Section 2.6), the PDMS matrix is not 100% pure PDMS, but contains up to
40% fumed silica (SiO2) as filler. It is possible that the SiO2 holds the residual water vapour in the
PDMS matrix, since it is known that pure PDMS is a hydrophobic polymer.
It should also be noted that analytes, with boiling points in the C16 to C20 range, are not volatile
enough to be removed from the trap during the high-speed gas-purging step at room temperature.
This step should be of concern only when working with analytes that have low retention volumes or
high volatilities.
6.8.2. Desorber contamination
As can be seen in figure 6.36, from the system blank chromatogram obtained from desorption of an
empty glass tube that desorber contamination has occurred as a result of sample carry-over. This
persistent carry-over limits the minimum possible levels of detection for the analytes being
determined, see table 6.8.
After the thermal desorption phase in the Gerstel® desorption unit (see figure 4.3), the tube
desorption chamber is cooled down from 260ºC to the initial temperature of 40ºC, before the CIS is
ramped to desorb the cryogenically trapped analytes from the baffled glass inlet.
It is suspected that sample carry-over occurs inside the TDS tube desorption chamber (see figure
4.3) during this cooling phase. Despite a permanent carrier gas purge flow of 3 ml/min around the
desorption tube, the underivatized analytes and particularly the TFA acid by-product can condense
onto the metal surfaces inside the chamber where they are desorbed during future desorption cycles.
An improvement in background levels was observed when this chamber was cleaned out with
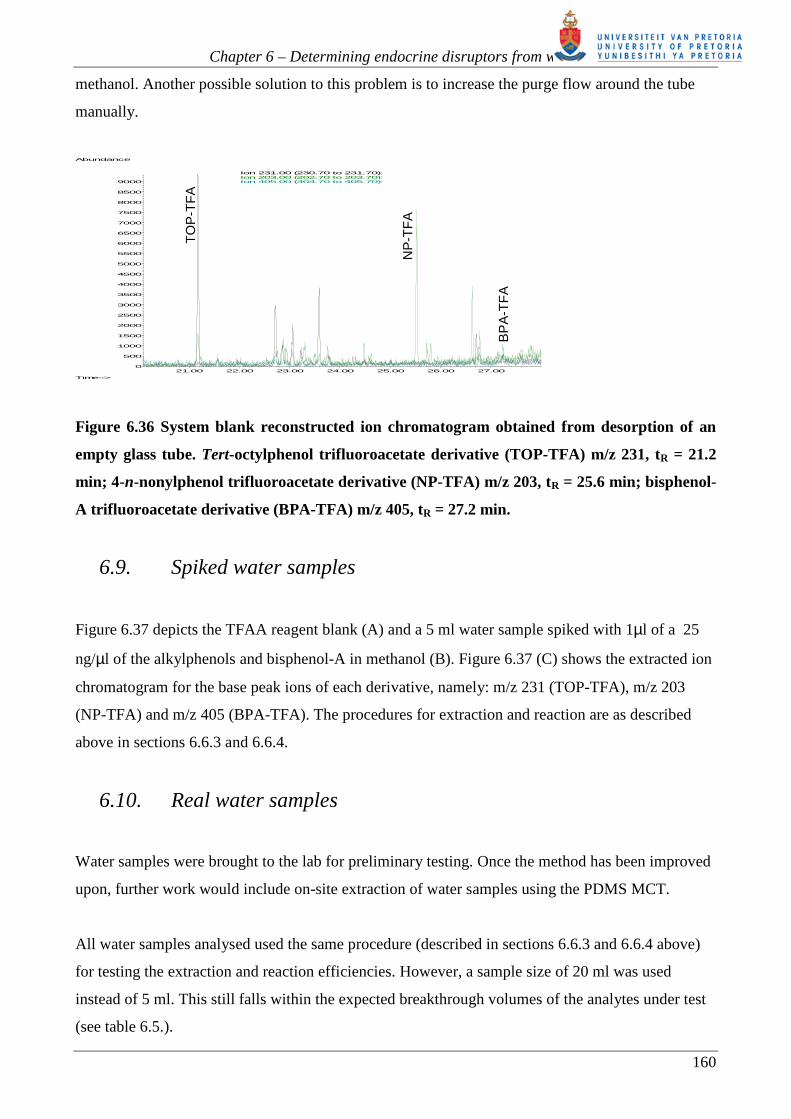
Chapter 6 – Determining endocrine disruptors from water
160
methanol. Another possible solution to this problem is to increase the purge flow around the tube
manually.
Figure 6.36 System blank reconstructed ion chromatogram obtained from desorption of an
empty glass tube. Tert-octylphenol trifluoroacetate derivative (TOP-TFA) m/z 231, tR = 21.2
min; 4-n-nonylphenol trifluoroacetate derivative (NP-TFA) m/z 203, tR = 25.6 min; bisphenol-
A trifluoroacetate derivative (BPA-TFA) m/z 405, tR = 27.2 min.
6.9. Spiked water samples
Figure 6.37 depicts the TFAA reagent blank (A) and a 5 ml water sample spiked with 1µl of a 25
ng/µl of the alkylphenols and bisphenol-A in methanol (B). Figure 6.37 (C) shows the extracted ion
chromatogram for the base peak ions of each derivative, namely: m/z 231 (TOP-TFA), m/z 203
(NP-TFA) and m/z 405 (BPA-TFA). The procedures for extraction and reaction are as described
above in sections 6.6.3 and 6.6.4.
6.10. Real water samples
Water samples were brought to the lab for preliminary testing. Once the method has been improved
upon, further work would include on-site extraction of water samples using the PDMS MCT.
All water samples analysed used the same procedure (described in sections 6.6.3 and 6.6.4 above)
for testing the extraction and reaction efficiencies. However, a sample size of 20 ml was used
instead of 5 ml. This still falls within the expected breakthrough volumes of the analytes under test
(see table 6.5.).
21.00 22.00 23.00 24.00 25.00 26.00 27.000
500
1000
1500
2000
2500
3000
3500
4000
4500
5000
5500
6000
6500
7000
7500
8000
8500
9000
Time-->
Abundance
Ion 231.00 (230.70 to 231.70): 09050604.DIon 203.00 (202.70 to 203.70): 09050604.DIon 405.00 (404.70 to 405.70): 09050604.D
TO
P-T
FA
NP
-TF
A
BP
A-T
FA
Chapter 6 – Determining endocrine disruptors from water
161
The first 5 L sample was taken from the Apies River, downstream from a sewage treatment plant.
The second 5 L sample was taken from the river at the LC de Villiers Sports Centre at the
University of Pretoria. In both cases, the bottle openings were covered with aluminium foil before
sealing with screw-on caps. Upon reaching the lab, methanol (100 ml) was added to the bottle to
prevent adsorption of phenolic compounds on any active glass surfaces. Methanol, often 5 % of the
sample volume, is added to water samples to prevent adsorption of analytes on active glass surfaces
[47, 63, 278]. However, Lee et.al, found that adding methanol to the sample reduced the extraction
yield of 4-nonylphenol using SBSE. As a point of departure, we opted for adding 2% methanol as
modifier to the water sample, as a precautionary measure against larger losses due to adsorption. 20
ml aliquots were taken, using a glass pipette, for PDMS concentration. Both samples were analysed
within 48 hours. The quantitative results are summarised in table 6.9.
Figures 6.38 and 6.40 show the results obtained for 2 aliquots of the Apies river water sample
extracted and derivatized on 2 different PDMS MCTs. Figure 6.39 shows the reagent blank. All 3
figures show the total ion chromatogram, followed by the extracted PDMS degradation peaks (note
the repeatable retention times) and the extracted derivative ions. It is obvious that the reagent blank
is not “blank” since the system is contaminated. What is also of concern is that 2 aliquots analysed
on 2 different traps gave 2 different sets of results. Interestingly, only the amounts determined for
bisphenol-A fall below the limits of quantification (LOQ) (see table 6.9.). Both TOP and NP are
detected in the sample above levels detected in the blank. This can be observed visually by
inspection of the respective peaks on the blank and sample chromatograms and quantitatively by
comparison with external standard calibration curves.
Figures 6.41 and 6.42 present the results obtained for the reagent blank and a 20 ml aliquot of the
second sample taken from the Sports Centre river site. These results were obtained by operating the
mass spectrometer in selected ion mode (SIM) using the base peaks and more abundant ions for
each derivative. Masses 231, 203, 245, 316, 405, 420 were selected for SIM. Once again, only the
quantities obtained for bisphenol-A fall below the LOQ.
Note the LOQ(RIC) values were determined before the TDS was cleaned. The LOQ(SIM) values
are still limited by carry-over but were determined after the TDS was cleaned, hence the lower
value. The process of determining LOQs must be determined under identical conditions once the
continuous sample carry-over problem is resolved. It is not practical to keep cleaning the TDS
chamber after each measurement.
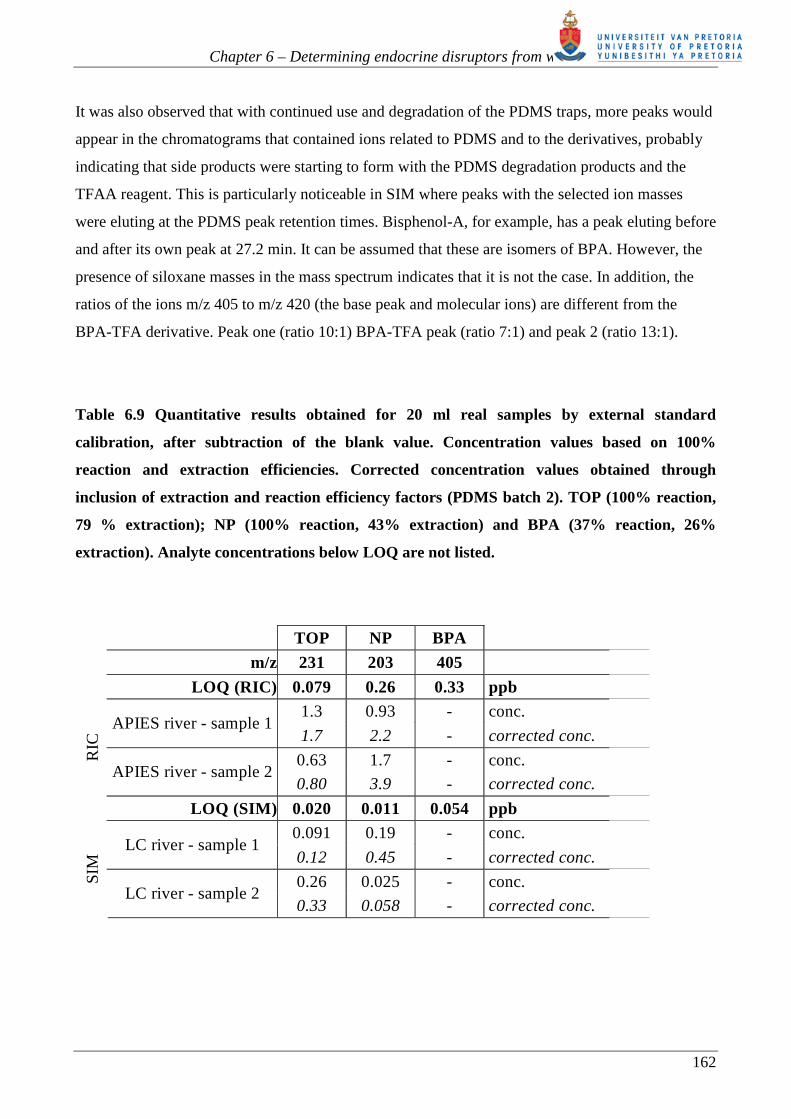
Chapter 6 – Determining endocrine disruptors from water
162
It was also observed that with continued use and degradation of the PDMS traps, more peaks would
appear in the chromatograms that contained ions related to PDMS and to the derivatives, probably
indicating that side products were starting to form with the PDMS degradation products and the
TFAA reagent. This is particularly noticeable in SIM where peaks with the selected ion masses
were eluting at the PDMS peak retention times. Bisphenol-A, for example, has a peak eluting before
and after its own peak at 27.2 min. It can be assumed that these are isomers of BPA. However, the
presence of siloxane masses in the mass spectrum indicates that it is not the case. In addition, the
ratios of the ions m/z 405 to m/z 420 (the base peak and molecular ions) are different from the
BPA-TFA derivative. Peak one (ratio 10:1) BPA-TFA peak (ratio 7:1) and peak 2 (ratio 13:1).
Table 6.9 Quantitative results obtained for 20 ml real samples by external standard
calibration, after subtraction of the blank value. Concentration values based on 100%
reaction and extraction efficiencies. Corrected concentration values obtained through
inclusion of extraction and reaction efficiency factors (PDMS batch 2). TOP (100% reaction,
79 % extraction); NP (100% reaction, 43% extraction) and BPA (37% reaction, 26%
extraction). Analyte concentrations below LOQ are not listed.
TOP NP BPA
m/z 231 203 405
LOQ (RIC) 0.079 0.26 0.33 ppb 1.3 0.93 - conc.
APIES river - sample 1 1.7 2.2 - corrected conc.
0.63 1.7 - conc. RIC
APIES river - sample 2 0.80 3.9 - corrected conc.
LOQ (SIM) 0.020 0.011 0.054 ppb 0.091 0.19 - conc.
LC river - sample 1 0.12 0.45 - corrected conc.
0.26 0.025 - conc. SIM
LC river - sample 2 0.33 0.058 - corrected conc.
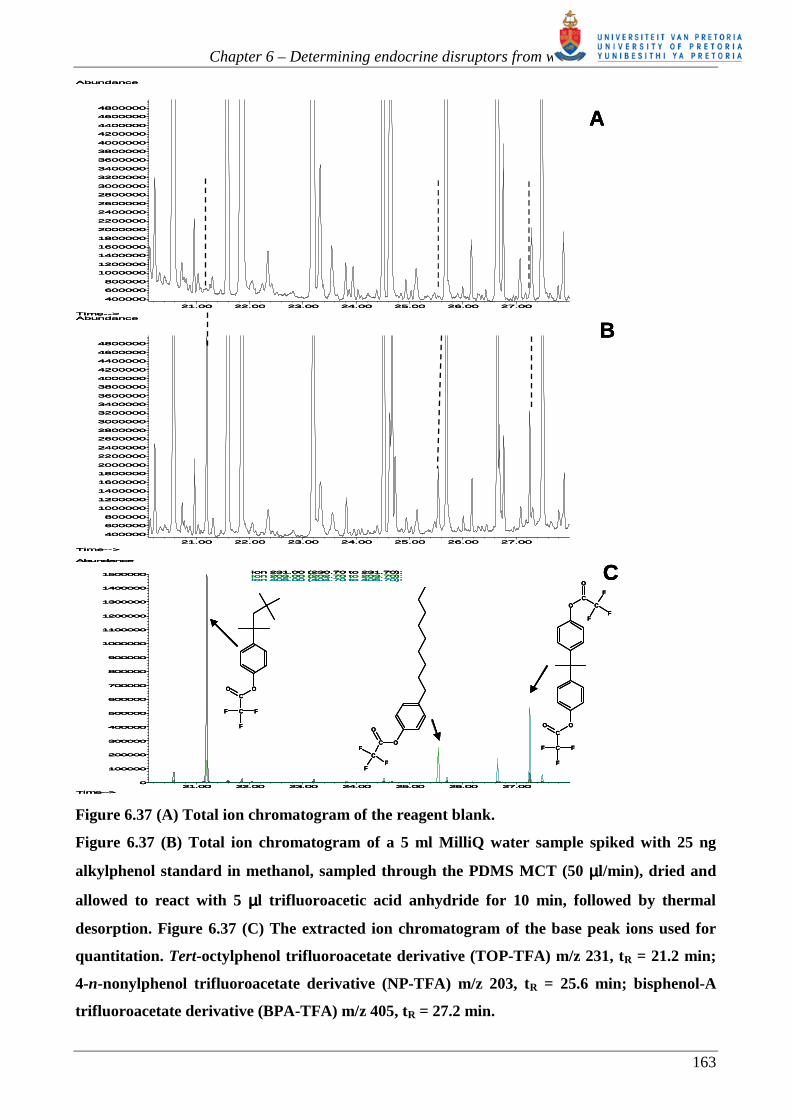
Chapter 6 – Determining endocrine disruptors from water
163
Figure 6.37 (A) Total ion chromatogram of the reagent blank.
Figure 6.37 (B) Total ion chromatogram of a 5 ml MilliQ water sample spiked with 25 ng
alkylphenol standard in methanol, sampled through the PDMS MCT (50 µµµµl/min), dried and
allowed to react with 5 µµµµl trifluoroacetic acid anhydride for 10 min, followed by thermal
desorption. Figure 6.37 (C) The extracted ion chromatogram of the base peak ions used for
quantitation. Tert-octylphenol trifluoroacetate derivative (TOP-TFA) m/z 231, tR = 21.2 min;
4-n-nonylphenol trifluoroacetate derivative (NP-TFA) m/z 203, tR = 25.6 min; bisphenol-A
trifluoroacetate derivative (BPA-TFA) m/z 405, tR = 27.2 min.
21.00 22.00 23.00 24.00 25.00 26.00 27.00
400000
600000
800000
1000000
1200000
1400000
1600000
1800000
2000000
2200000
2400000
2600000
2800000
3000000
3200000
3400000
3600000
3800000
4000000
4200000
4400000
4600000
4800000
Time-->
Abundance
TIC: 08050606.D
A
21.00 22.00 23.00 24.00 25.00 26.00 27.00
400000
600000
800000
1000000
1200000
1400000
1600000
1800000
2000000
2200000
2400000
2600000
2800000
3000000
3200000
3400000
3600000
3800000
4000000
4200000
4400000
4600000
4800000
Time-->
Abundance
TIC: 08050604.D B
21.00 22.00 23.00 24.00 25.00 26.00 27.000
100000
200000
300000
400000
500000
600000
700000
800000
900000
1000000
1100000
1200000
1300000
1400000
1500000
Time-->
Abundance
Ion 231.00 (230.70 to 231.70): 08050604.DIon 203.00 (202.70 to 203.70): 08050604.DIon 405.00 (404.70 to 405.70): 08050604.D C
OC
O
CF
F
F
OC
O
CF
F
F
CO
CF
F
F
O
OC
O
C
F
FF
21.00 22.00 23.00 24.00 25.00 26.00 27.00
400000
600000
800000
1000000
1200000
1400000
1600000
1800000
2000000
2200000
2400000
2600000
2800000
3000000
3200000
3400000
3600000
3800000
4000000
4200000
4400000
4600000
4800000
Time-->
Abundance
TIC: 08050606.D
A
21.00 22.00 23.00 24.00 25.00 26.00 27.00
400000
600000
800000
1000000
1200000
1400000
1600000
1800000
2000000
2200000
2400000
2600000
2800000
3000000
3200000
3400000
3600000
3800000
4000000
4200000
4400000
4600000
4800000
Time-->
Abundance
TIC: 08050606.D
A
21.00 22.00 23.00 24.00 25.00 26.00 27.00
400000
600000
800000
1000000
1200000
1400000
1600000
1800000
2000000
2200000
2400000
2600000
2800000
3000000
3200000
3400000
3600000
3800000
4000000
4200000
4400000
4600000
4800000
Time-->
Abundance
TIC: 08050604.D B
21.00 22.00 23.00 24.00 25.00 26.00 27.00
400000
600000
800000
1000000
1200000
1400000
1600000
1800000
2000000
2200000
2400000
2600000
2800000
3000000
3200000
3400000
3600000
3800000
4000000
4200000
4400000
4600000
4800000
Time-->
Abundance
TIC: 08050604.D B
21.00 22.00 23.00 24.00 25.00 26.00 27.000
100000
200000
300000
400000
500000
600000
700000
800000
900000
1000000
1100000
1200000
1300000
1400000
1500000
Time-->
Abundance
Ion 231.00 (230.70 to 231.70): 08050604.DIon 203.00 (202.70 to 203.70): 08050604.DIon 405.00 (404.70 to 405.70): 08050604.D C
OC
O
CF
F
F
OC
O
CF
F
F
CO
CF
F
F
O
OC
O
C
F
FF
21.00 22.00 23.00 24.00 25.00 26.00 27.000
100000
200000
300000
400000
500000
600000
700000
800000
900000
1000000
1100000
1200000
1300000
1400000
1500000
Time-->
Abundance
Ion 231.00 (230.70 to 231.70): 08050604.DIon 203.00 (202.70 to 203.70): 08050604.DIon 405.00 (404.70 to 405.70): 08050604.D C
21.00 22.00 23.00 24.00 25.00 26.00 27.000
100000
200000
300000
400000
500000
600000
700000
800000
900000
1000000
1100000
1200000
1300000
1400000
1500000
Time-->
Abundance
Ion 231.00 (230.70 to 231.70): 08050604.DIon 203.00 (202.70 to 203.70): 08050604.DIon 405.00 (404.70 to 405.70): 08050604.D C
OC
O
CF
F
F
OC
O
CF
F
F
CO
CF
F
F
O
OC
O
C
F
FF
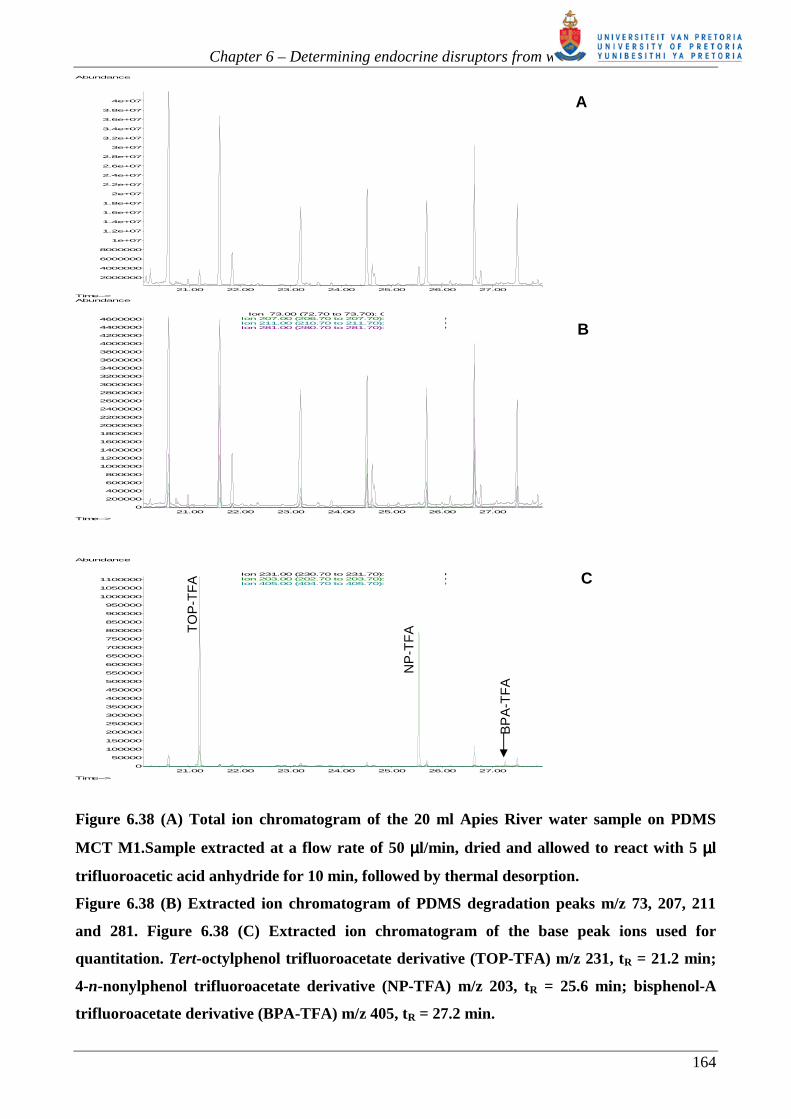
Chapter 6 – Determining endocrine disruptors from water
164
Figure 6.38 (A) Total ion chromatogram of the 20 ml Apies River water sample on PDMS
MCT M1.Sample extracted at a flow rate of 50 µµµµl/min, dried and allowed to react with 5 µµµµl
trifluoroacetic acid anhydride for 10 min, followed by thermal desorption.
Figure 6.38 (B) Extracted ion chromatogram of PDMS degradation peaks m/z 73, 207, 211
and 281. Figure 6.38 (C) Extracted ion chromatogram of the base peak ions used for
quantitation. Tert-octylphenol trifluoroacetate derivative (TOP-TFA) m/z 231, tR = 21.2 min;
4-n-nonylphenol trifluoroacetate derivative (NP-TFA) m/z 203, tR = 25.6 min; bisphenol-A
trifluoroacetate derivative (BPA-TFA) m/z 405, tR = 27.2 min.
21.00 22.00 23.00 24.00 25.00 26.00 27.00
2000000
4000000
6000000
8000000
1e+07
1.2e+07
1.4e+07
1.6e+07
1.8e+07
2e+07
2.2e+07
2.4e+07
2.6e+07
2.8e+07
3e+07
3.2e+07
3.4e+07
3.6e+07
3.8e+07
4e+07
Time-->
Abundance
TIC: 09050601.D
21.00 22.00 23.00 24.00 25.00 26.00 27.000
200000
400000
600000
800000
1000000
1200000
1400000
1600000
1800000
2000000
2200000
2400000
2600000
2800000
3000000
3200000
3400000
3600000
3800000
4000000
4200000
4400000
4600000
Time-->
Abundance
Ion 73.00 (72.70 to 73.70): 09050601.DIon 207.00 (206.70 to 207.70): 09050601.DIon 211.00 (210.70 to 211.70): 09050601.DIon 281.00 (280.70 to 281.70): 09050601.D
21.00 22.00 23.00 24.00 25.00 26.00 27.000
50000
100000
150000
200000
250000
300000
350000
400000
450000
500000
550000
600000
650000
700000
750000
800000
850000
900000
950000
1000000
1050000
1100000
Time-->
Abundance
Ion 231.00 (230.70 to 231.70): 09050601.DIon 203.00 (202.70 to 203.70): 09050601.DIon 405.00 (404.70 to 405.70): 09050601.D
TO
P-T
FA
NP
-TF
A
BP
A-T
FA
A
B
C
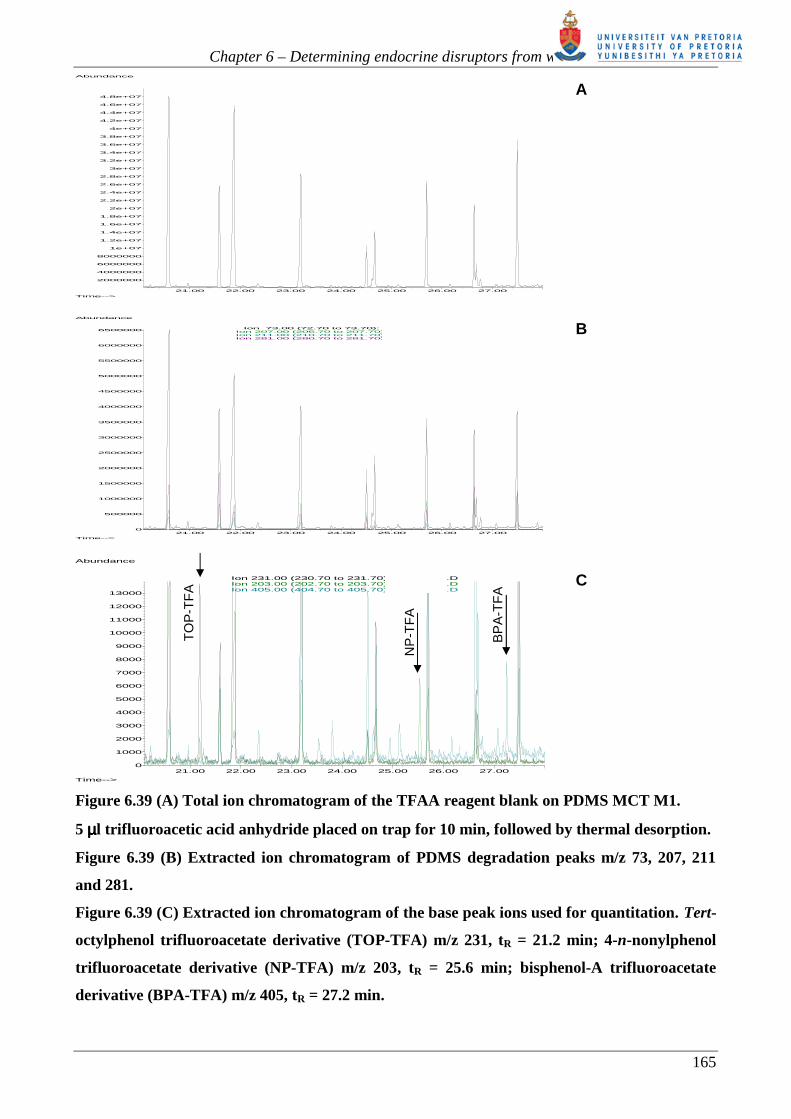
Chapter 6 – Determining endocrine disruptors from water
165
Figure 6.39 (A) Total ion chromatogram of the TFAA reagent blank on PDMS MCT M1.
5 µµµµl trifluoroacetic acid anhydride placed on trap for 10 min, followed by thermal desorption.
Figure 6.39 (B) Extracted ion chromatogram of PDMS degradation peaks m/z 73, 207, 211
and 281.
Figure 6.39 (C) Extracted ion chromatogram of the base peak ions used for quantitation. Tert-
octylphenol trifluoroacetate derivative (TOP-TFA) m/z 231, tR = 21.2 min; 4-n-nonylphenol
trifluoroacetate derivative (NP-TFA) m/z 203, tR = 25.6 min; bisphenol-A trifluoroacetate
derivative (BPA-TFA) m/z 405, tR = 27.2 min.
21.00 22.00 23.00 24.00 25.00 26.00 27.00
2000000
4000000
6000000
8000000
1e+07
1.2e+07
1.4e+07
1.6e+07
1.8e+07
2e+07
2.2e+07
2.4e+07
2.6e+07
2.8e+07
3e+07
3.2e+07
3.4e+07
3.6e+07
3.8e+07
4e+07
4.2e+07
4.4e+07
4.6e+07
4.8e+07
Time-->
Abundance
TIC: 09050602.D
21.00 22.00 23.00 24.00 25.00 26.00 27.000
500000
1000000
1500000
2000000
2500000
3000000
3500000
4000000
4500000
5000000
5500000
6000000
6500000
Time-->
Abundance
Ion 73.00 (72.70 to 73.70): 09050602.DIon 207.00 (206.70 to 207.70): 09050602.DIon 211.00 (210.70 to 211.70): 09050602.DIon 281.00 (280.70 to 281.70): 09050602.D
21.00 22.00 23.00 24.00 25.00 26.00 27.000
1000
2000
3000
4000
5000
6000
7000
8000
9000
10000
11000
12000
13000
Time-->
Abundance
Ion 231.00 (230.70 to 231.70): 09050602.DIon 203.00 (202.70 to 203.70): 09050602.DIon 405.00 (404.70 to 405.70): 09050602.D
A
B
C
TO
P-T
FA
NP
-TF
A
BP
A-T
FA
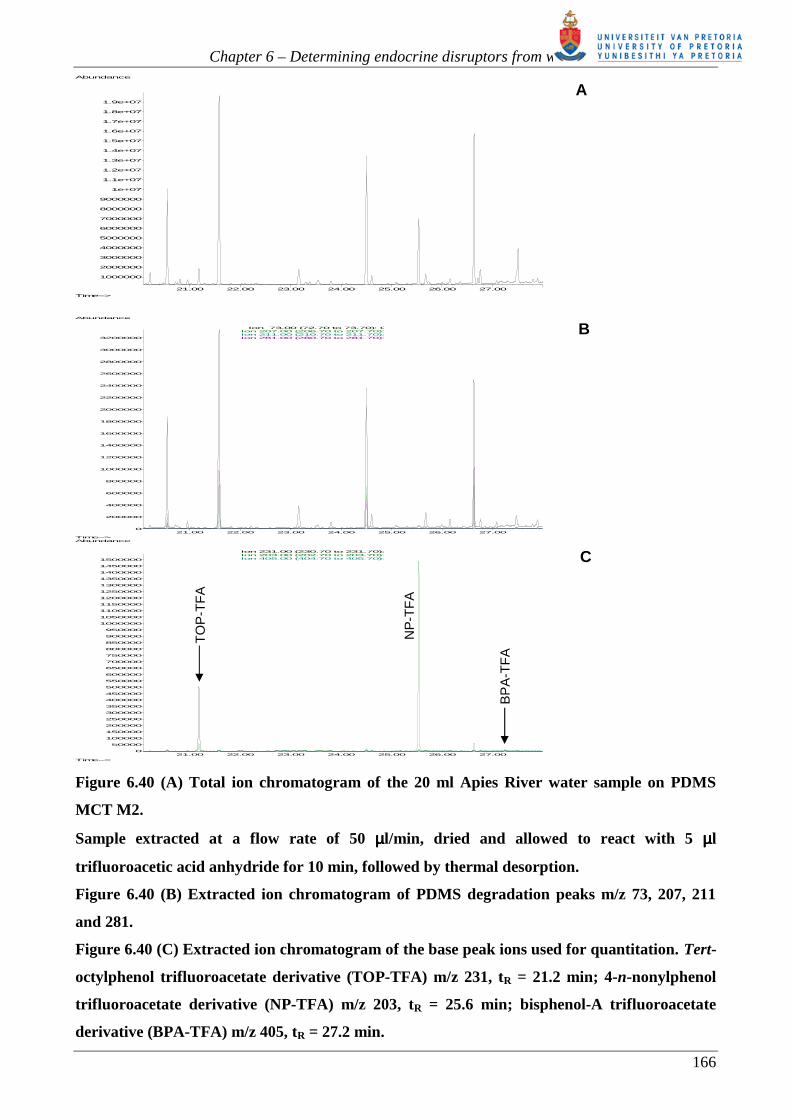
Chapter 6 – Determining endocrine disruptors from water
166
Figure 6.40 (A) Total ion chromatogram of the 20 ml Apies River water sample on PDMS
MCT M2.
Sample extracted at a flow rate of 50 µµµµl/min, dried and allowed to react with 5 µµµµl
trifluoroacetic acid anhydride for 10 min, followed by thermal desorption.
Figure 6.40 (B) Extracted ion chromatogram of PDMS degradation peaks m/z 73, 207, 211
and 281.
Figure 6.40 (C) Extracted ion chromatogram of the base peak ions used for quantitation. Tert-
octylphenol trifluoroacetate derivative (TOP-TFA) m/z 231, tR = 21.2 min; 4-n-nonylphenol
trifluoroacetate derivative (NP-TFA) m/z 203, tR = 25.6 min; bisphenol-A trifluoroacetate
derivative (BPA-TFA) m/z 405, tR = 27.2 min.
21.00 22.00 23.00 24.00 25.00 26.00 27.00
1000000
2000000
3000000
4000000
5000000
6000000
7000000
8000000
9000000
1e+07
1.1e+07
1.2e+07
1.3e+07
1.4e+07
1.5e+07
1.6e+07
1.7e+07
1.8e+07
1.9e+07
Time-->
Abundance
TIC: 09050603.D
21.00 22.00 23.00 24.00 25.00 26.00 27.000
200000
400000
600000
800000
1000000
1200000
1400000
1600000
1800000
2000000
2200000
2400000
2600000
2800000
3000000
3200000
Time-->
Abundance
Ion 73.00 (72.70 to 73.70): 09050603.DIon 207.00 (206.70 to 207.70): 09050603.DIon 211.00 (210.70 to 211.70): 09050603.DIon 281.00 (280.70 to 281.70): 09050603.D
21.00 22.00 23.00 24.00 25.00 26.00 27.000
50000
100000
150000
200000
250000
300000
350000
400000
450000
500000
550000
600000
650000
700000
750000
800000
850000
900000
950000
1000000
1050000
1100000
1150000
1200000
1250000
1300000
1350000
1400000
1450000
1500000
Time-->
Abundance
Ion 231.00 (230.70 to 231.70): 09050603.DIon 203.00 (202.70 to 203.70): 09050603.DIon 405.00 (404.70 to 405.70): 09050603.D
A
B
C
TO
P-T
FA
BP
A-T
FA
NP
-TF
A
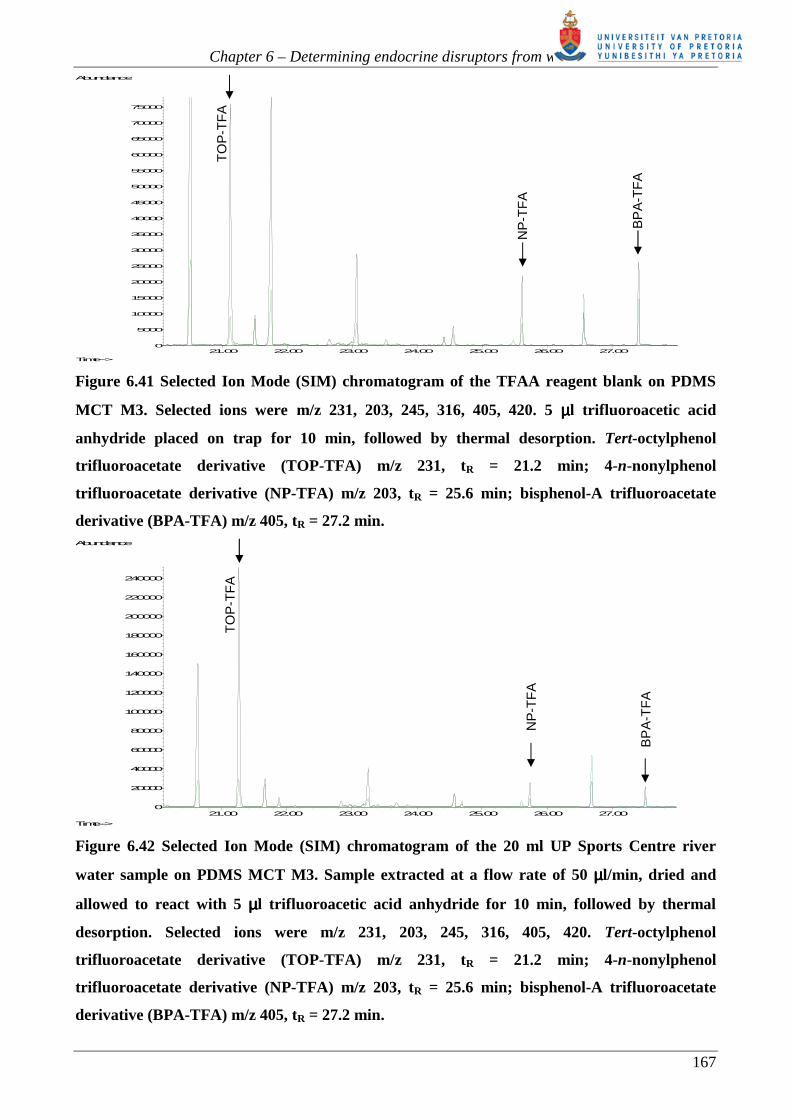
Chapter 6 – Determining endocrine disruptors from water
167
Figure 6.41 Selected Ion Mode (SIM) chromatogram of the TFAA reagent blank on PDMS
MCT M3. Selected ions were m/z 231, 203, 245, 316, 405, 420. 5 µµµµl trifluoroacetic acid
anhydride placed on trap for 10 min, followed by thermal desorption. Tert-octylphenol
trifluoroacetate derivative (TOP-TFA) m/z 231, tR = 21.2 min; 4-n-nonylphenol
trifluoroacetate derivative (NP-TFA) m/z 203, tR = 25.6 min; bisphenol-A trifluoroacetate
derivative (BPA-TFA) m/z 405, tR = 27.2 min.
Figure 6.42 Selected Ion Mode (SIM) chromatogram of the 20 ml UP Sports Centre river
water sample on PDMS MCT M3. Sample extracted at a flow rate of 50 µµµµl/min, dried and
allowed to react with 5 µµµµl trifluoroacetic acid anhydride for 10 min, followed by thermal
desorption. Selected ions were m/z 231, 203, 245, 316, 405, 420. Tert-octylphenol
trifluoroacetate derivative (TOP-TFA) m/z 231, tR = 21.2 min; 4-n-nonylphenol
trifluoroacetate derivative (NP-TFA) m/z 203, tR = 25.6 min; bisphenol-A trifluoroacetate
derivative (BPA-TFA) m/z 405, tR = 27.2 min.
21.00 22.00 23.00 24.00 25.00 26.00 27.000
20000
40000
60000
80000
100000
120000
140000
160000
180000
200000
220000
240000
Time-->
Abundance
Ion 231.00 (230.70 to 231.70): 13050602.DIon 203.00 (202.70 to 203.70): 13050602.DIon 420.00 (419.70 to 420.70): 13050602.D
NP
-TF
A
TO
P-T
FA
BP
A-T
FA
21.00 22.00 23.00 24.00 25.00 26.00 27.000
5000
10000
15000
20000
25000
30000
35000
40000
45000
50000
55000
60000
65000
70000
75000
Time-->
Abundance
Ion 231.00 (230.70 to 231.70): 13050603.DIon 203.00 (202.70 to 203.70): 13050603.DIon 420.00 (419.70 to 420.70): 13050603.D
NP
-TF
A
BP
A-T
FA
TO
P-T
FA
Chapter 6 – Determining endocrine disruptors from water
168
6.11. Conclusion
The multichannel PDMS trap can be used to extract the moderately polar tert-octyl phenol and
nonylphenol directly from water and can serve as a “one-pot” concentration, transport,
derivatization and desorption vessel.
An extraction efficiency of over 70% is obtained for tert-octylphenol. However, extraction of
nonylphenol and bisphenol-A is not as reproducible between different PDMS batches. A deviation
from the expected partitioning of these lipophillic compounds, based on calculations using their
octanol-water partitioning coefficients, is evident. Only ~40% nonylphenol and ~20% bisphenol-A
partitions into the PDMS, while 99% partitioning is expected.
The in situ derivatization reaction, using only 5 µl of trifluoroacetic acid anhydride, is convenient as
it occurs at room temperature in the PDMS trap and is 100% complete within 10 minutes for tert-
octylphenol and nonylphenol. Bisphenol-A demonstrates a modest reaction efficiency of
approximately 37%, however, this appears to be constant over time.
Analyte carry-over from the thermal desorber presently prevents the achievement of further
reduction in detection levels expected when moving from GC-EI-MS to GC-NCI-MS. Despite this,
minimum detectable levels are similar to those achieved in the literature. The limit of quantitation
(determined by the reagent blank) for this technique using GC-SIM-MS are 20, 11 and 54 ppt for
tert-octylphenol, nonylphenol and bisphenol-A respectively.
The ability of the PDMS MCT to concentrate alkylphenols directly from water followed by in situ
derivatization using TFAA, was demonstrated on real samples brought into the laboratory. Both
tert-octylphenol and nonylphenol were detected in all samples at the low ppb level, while
bisphenol-A fell below the level of quantitation. Once background levels are reduced, on-site
sampling with the PDMS MCT would still need to be tested.