Embed Size (px)
Citation preview
Chapter 6 Air Pressure and Winds 6.1 Pressure The difference in pressure between two points on the surface of the earth is responsible for the winds that blow from the higher pressure area to the lower pressure area. These winds in turn transfer heat and moisture from one place on the earth to another. What is pressure and how does it relate to the winds? Pressure is defined as the force acting per unit surface area. We write this mathematically as
p = F
A (6.1)
The unit for pressure is a newton/meter2 in the International System of Units while in the British engineering system the units are lb/in.2, which is sometimes denoted by psi.
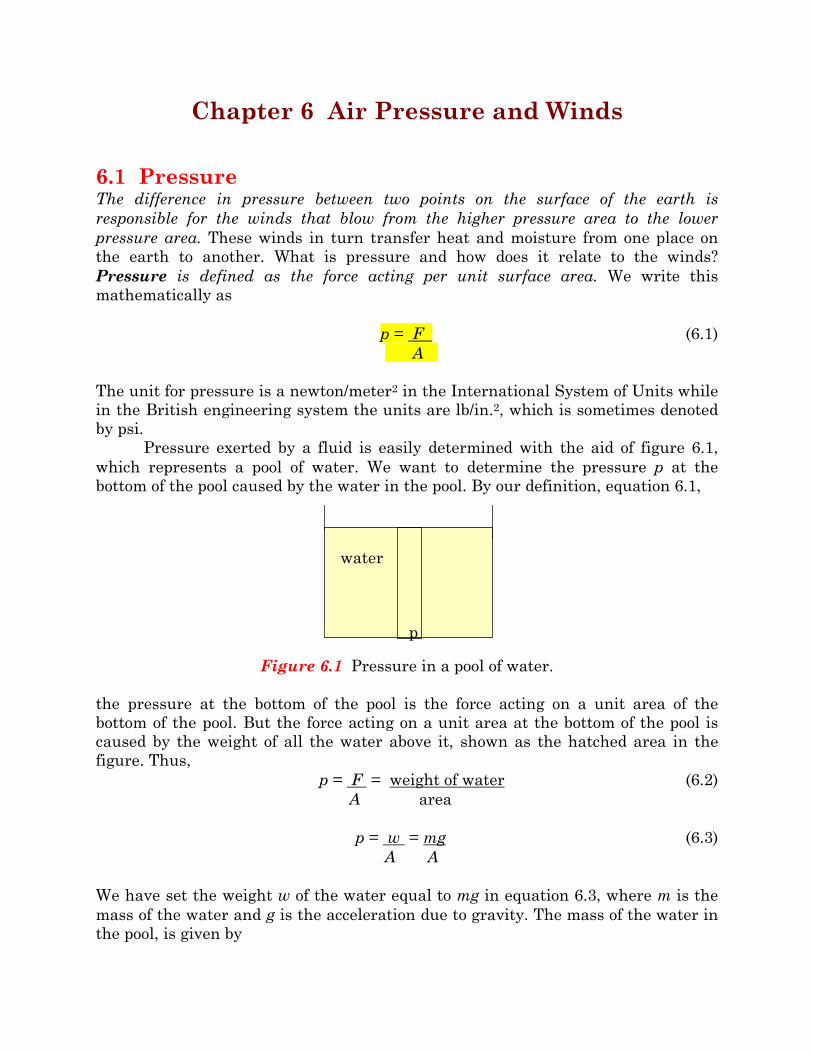
Pressure exerted by a fluid is easily determined with the aid of figure 6.1, which represents a pool of water. We want to determine the pressure p at the bottom of the pool caused by the water in the pool. By our definition, equation 6.1,
Figure 6.1 Pressure in a pool of water.
the pressure at the bottom of the pool is the force acting on a unit area of the bottom of the pool. But the force acting on a unit area at the bottom of the pool is caused by the weight of all the water above it, shown as the hatched area in the figure. Thus,
p = F = weight of water A area
(6.2)
p = w = mg
A A (6.3)
We have set the weight w of the water equal to mg in equation 6.3, where m is the mass of the water and g is the acceleration due to gravity. The mass of the water in the pool, is given by
water
p

Chapter 6 Air Pressure and Winds
6-2
m = ρV (6.4)
where ρ is the density of the water in the pool, and V is the volume of the water in the pool. The volume of all the water in the pool is just equal to the area A of the bottom of the pool times the depth h of the water in the pool, that is,
V = Ah (6.5)
Substituting equations 6.4 and 6.5 into equation 6.3 gives for the pressure at the bottom of the pool:
p = mg = ρVg = ρAhg A A A
Thus, p = ρgh (6.6)
(Although we derived equation 6.6 to determine the water pressure at the bottom of a pool of water, it is completely general and gives the water pressure at any depth h in the pool.) Equation 6.6 says that the water pressure at any depth h in any pool is given by the product of the density ρ of the water in the pool, the acceleration due to gravity g, and the depth h in the pool. Equation 6.6 is sometimes called the hydrostatic equation.
Example 6.1
Pressure in a swimming pool. Find the water pressure at a depth of (a) 1.00 m, (b) 2.00 m, and (c) 3.00 m in a swimming pool.
The density of water is 1000 kg/m3. (a) At a depth of 1.00 m the water pressure, found from equation 6.6, is
p = ρgh = (1000 kg/m3)(9.80 m/s2)(1.00 m)
= 9,800 N/m2 = 1.42 lb/in2 (b) At a depth of 2.00 m the water pressure is
p = ρgh = (1000 kg/m3)(9.80 m/s2)(2.00 m)
= 19,600 N/m2 = 2.84 lb/in2 (c) At a depth of 3.00 m the water pressure is
p = ρgh
Solution

Chapter 6 Air Pressure and Winds
6-3
= (1000 kg/m3)(9.80 m/s2)(3.00 m) = 29,400 N/m2 = 4.26 lb/in2
To go to this Interactive Example click on this sentence.
Notice from this example that the pressure exerted by the water becomes
greater the deeper you go into the water. The pressure at the greatest depth, 3 m, is the greatest in the pool and is the same everywhere at this 3 m level. Hence, the force exerted by the fluid is the same in all directions. That is, the force is the same in up-down, right-left, or in-out directions. You experience this pressure when swimming at a depth of 3.00 m as a pressure on your ears. As you swim up to the surface, the pressure on your ears decreases because h is decreasing. Or to look at it another way, the closer you swim up toward the surface, the smaller is the amount of water that is above you. Because the pressure is caused by the weight of that water above you, the smaller the amount of water, the smaller will be the pressure.
Just as there is a water pressure at the bottom of a swimming pool caused by the weight of all the water above the bottom, there is also an air pressure exerted on every object at the surface of the earth caused by the weight of all the air that is above us in the atmosphere, figure 6.2. That is, we live at the bottom of an ocean of
Figure 6.2 Pressure at the bottom of an ocean of air.
air and that air exerts an atmospheric pressure on us, given by equation 6.1 as
p = F = weight of airA area
(6.7)
However we can not use the same result obtained for the pressure in the pool
of water, the hydrostatic equation 6.6, because air is compressible and hence its density ρ is not constant with height throughout the vertical portion of the atmosphere. The pressure of air at any height in the atmosphere can be found by some involved calculation using the calculus. However, since such calculations are beyond the scope of this course, we will use experimentation to determine the pressure of the atmosphere.
air
p

Chapter 6 Air Pressure and Winds
6-4
6.2 The Measurement of Atmospheric Pressure - The Barometer
The pressure of the air in the atmosphere was first measured by Evangelista Torricelli (1608-1647), a student of Galileo, by the use of a mercury barometer. A long narrow tube is filled to the top with mercury, chemical symbol Hg. It is then placed upside down into a reservoir filled with mercury, as shown in figure 6.3. The
Figure 6.3 A mercury barometer.
mercury in the tube starts to flow out into the reservoir, but it comes to a stop when the top of the mercury column is at a height h above the top of the mercury reservoir, as also shown in figure 6.3. The mercury does not empty completely because the normal pressure of the atmosphere p0 pushes downward on the mercury reservoir. Because the force caused by the pressure of a fluid is the same in all directions, there is also a force acting upward inside the tube at the height of the mercury reservoir, and hence there is also a pressure p0 acting upward as shown in figure 6.3. This force upward is capable of holding the weight of the mercury in the tube up to a height h. Thus, the pressure exerted by the mercury in the tube is exactly balanced by the normal atmospheric pressure on the reservoir, that is,
p0 = pHg (6.8)
But the pressure of the mercury in the tube pHg, given by equation 6.6, is
pHg = ρHggh (6.9)
Substituting equation 6.9 back into equation 6.8, gives
p0 = ρHggh (6.10)
Hg
po
pHg
po
h

Chapter 6 Air Pressure and Winds
6-5
Equation 6.10 says that normal atmospheric pressure can be determined by measuring the height h of the column of mercury in the tube. It is found experimentally, that on the average, normal atmospheric pressure can support a column of mercury 76.0 cm high, or 760 mm high. Using the value of the density of mercury of 13,600 kg/m3, normal atmospheric pressure, determined from equation 6.10, is
p0 = Hggh = 13, 600 kgm3 9.80 m
s2 (0.760 m)
= 1.013 105 N/m2 = 14.7 lb/in.2
Thus, the average or normal atmospheric pressure acting on us at the surface of the earth is 1.013 105 N/m2, which is a rather large number as we will see presently. In the study of meteorology, a different unit of pressure is usually employed, namely the millibar, abbreviated mb. In terms of the unit of millibars, normal atmospheric pressure is 1013 mb. Normal atmospheric pressure can also be recorded as a height of 29.92 in. of Hg. On all surface weather maps in a weather station, pressures are always expressed in terms of millibars.
To determine the actual pressure of the atmosphere from the reading of the barometer certain corrections need to be made. A correction for the temperature of the air must be made because if the temperature is high, the mercury in the thermometer will expand and the barometer will read a higher pressure value than the actual pressure of the air. Similarly if the temperature of the air is low, the mercury in the barometer will contract and will move lower in the tube thereby giving a lower pressure reading than that actually caused by the atmospheric air pressure. The corrected reading is called the station pressure.
But pressure on mountains will always be lower than the pressure recorded in valleys because the mountain is higher and hence there is less air above the mountain than there is above the valley. Therefore in order to make possible direct comparison of pressures at different altitudes, station pressure is converted to sea-level pressure. This is accomplished, see figure 6.4, by assuming that the
Figure 6.4 Correction of station pressure to sea level pressure.
atmospheric column over the station extends all the way down to sea level and a correction to represent the weight of the additional mass of air is added to the
Station
sea level
heightabove sea level

Chapter 6 Air Pressure and Winds
6-6
station pressure. In this way the air pressure recorded in every weather station in the world is referred to the same mean sea level pressure.
The mercury barometer, with the appropriate corrections made, is thus a very accurate means of determining air pressure. The value of 76.0 cm of mercury or 1013 mb are only normal or average values. When the barometer is kept at the same location and the height of the mercury column is recorded daily, the value of h is found to vary slightly. When the value of h becomes greater than 76.0 cm of Hg, the pressure of the atmosphere has increased to a higher pressure. It is then said that a high-pressure area has moved into your region. When the value of h becomes less than 76.0 cm of Hg, the pressure of the atmosphere has decreased to a lower pressure and a low-pressure area has moved in. The barometer is extremely important in weather observation and prediction because, as a general rule of thumb, high atmospheric pressures usually are associated with clear skies and good weather. Low-pressure areas, on the other hand, are usually associated with cloudy skies, precipitation, and in general bad weather.
The mercury barometer, after certain corrections for instrument height above sea level and ambient temperature, is an extremely accurate device to measure atmospheric pressure and can be found in every weather station throughout the world. Its chief limitation is its size. It must always remain vertical, and the glass tube and reservoir are somewhat fragile. Hence, another type of barometer is also used to measure atmospheric pressure. It is called an aneroid barometer, and the face of one is shown in figure 6.4. It is based on the principle of a partially
Figure 6.4 An aneroid barometer.
evacuated, waferlike, metal cylinder called a Sylphon cell. When the atmospheric pressure increases, the cell decreases in size. A combination of linkages and springs are connected to the cell and to a pointer needle that moves over a calibrated scale that indicates the pressure. The aneroid barometer is a more portable device that is rugged and easily used, although it is originally calibrated with a mercury
2627
28
29 30
31
Rai
nSt
orm
y
Change
FairVery Dry

Chapter 6 Air Pressure and Winds
6-7
barometer. The word aneroid means not containing fluid. The aneroid barometer is calibrated in both centimeters of Hg and inches of Hg. Hence, as seen in figure 6.4, the pressure can be measured in terms of inches of mercury. Also note that regions of high pressure (30 in. of Hg) are labeled to indicate fair weather, while regions of low pressure (29 in. of Hg) are labeled to indicate rain or poor weather. In the example of figure 6.4 the pointer needle is indicating a pressure a little above 30 in. of Hg and indicating that the weather will be fair. Note that there is a second, shorter needle pointing toward a pressure of approximately 29.2 in. of Hg. This second needle gives the pressure tendency. When the barometer is read, this second needle is rotated by a knob so as to be aligned with the pointer needle. When the barometer is next read, let us say two or three hours later, the pointer needle may have moved from its present position. As an example, in figure 6.4, let us say that 3 hours earlier the pointer needle and the shorter pressure tendency needle were aligned where the shorter needle is presently located. This would mean that in the last 3 hours the pressure has risen from 29.2 in. of Hg to 30.1 in. of Hg. Hence the pressure tendency is increasing. This means that a higher pressure is moving into your area. If the present position of the pointer needle was at say 28.8 in. of Hg, this would indicate that the pressure is decreasing and a lower pressure area is moving into your area. Since higher pressure area are usually associated with good weather and lower pressure areas with bad weather, the pressure tendency is a good indication of the type of weather that you are going to have.
As we go up into the atmosphere the pressure decreases, because there is less air above us. The aneroid barometer will read smaller and smaller pressures with altitude. Instead of calibrating the aneroid barometer in terms of centimeters of mercury or inches of mercury, we can also calibrate it in terms of feet or meters above the surface of the earth where this air pressure is found. An aneroid barometer so calibrated is called an altimeter, a device to measure the altitude or height of an airplane. The height of the plane is not really measured, the pressure is. But in the standard atmosphere, a particular pressure is found at a particular height above the ground. Hence, when the aneroid barometer measures this pressure, it corresponds to a fixed altitude above the ground. The pilot can read this height directly from the newly calibrated aneroid barometer, the altimeter.
Another type of instrument for measuring pressure is the barograph. The barograph uses an aneroid barometer to measure atmospheric pressure. The pressure is recorded on a chart placed on a drum that rotates. The chart gives a complete record of atmospheric pressure variations for a day.
6.3 Some Examples of Atmospheric Pressure Let us now look at some examples associated with atmospheric pressure.

Chapter 6 Air Pressure and Winds
6-8
Example 6.2
Why you get tired by the end of the day. The top of a student’s head is approximately circular with a radius of 3.50 inches. What force is exerted on the top of the student’s head by normal atmospheric pressure?
The area of the top of the student’s head is found from
A = πr2 = π(3.50 in.)2 = 38.5 in.2
We find the magnitude of the force exerted on the top of the student’s head by rearranging equation 6.1 into the form
F = pA (6.11) Hence,
F = 14.7 lbin.2 (38.5 in.2)
= 566 lb
This is a rather large force to have exerted on our heads all day long.
To go to this Interactive Example click on this sentence.
Example 6.3
Atmospheric pressure on the walls of your house. Find the force on the outside wall of a ranch house, 10.0 ft high and 35.0 ft long, caused by normal atmospheric pressure.
The area of the wall of the house is given by
A = (length)(height) = (35.0 ft)(10.0 ft) 144 in.2
1ft2 = 50,400 in.2
The force on the wall, given by equation 6.11, is
Solution
Solution

Chapter 6 Air Pressure and Winds
6-9
F = pA = 14.7 lbin.2 (50, 400 in.2)
= 740,000 lb
To go to this Interactive Example click on this sentence.
The force on the outside wall of the house in example 6.3 is thus 740,000 lb.
This is truly an enormous force. Why doesn’t the wall collapse under this great force? The wall does not collapse because that same atmospheric air is also inside the house. Remember that air is a fluid and flows. Hence, in addition to being outside the house, the air also flows to the inside of the house. Because the force exerted by the pressure in the fluid is the same in all directions, the air inside the house exerts the same force of 740,000 lb against the inside wall of the house, as shown in figure 6.5(a). The net force on the wall is therefore
Net force = (force)in − (force)out = 740,000 lb − 740,000 lb
= 0
Figure 6.5 Pressure on the walls in a house.
A very interesting case occurs when this net force is not zero. Suppose a tornado, an extremely violent storm, were to move over your house, as shown in figure 6.5(b). The pressure inside the tornado is very low. No one knows for sure how low, because it is slightly difficult to run into a tornado with a barometer to measure it. The pressure can be estimated, however, from the very high winds associated with the tornado. A good estimate is that the pressure inside the tornado is at least 10% below the actual atmospheric pressure. Let us assume that the actual pressure is the normal atmospheric pressure of 1013 mb, then 10% of that is 101 mb. Thus, the pressure in the tornado is approximately
Chapter 6 Air Pressure and Winds
6-10
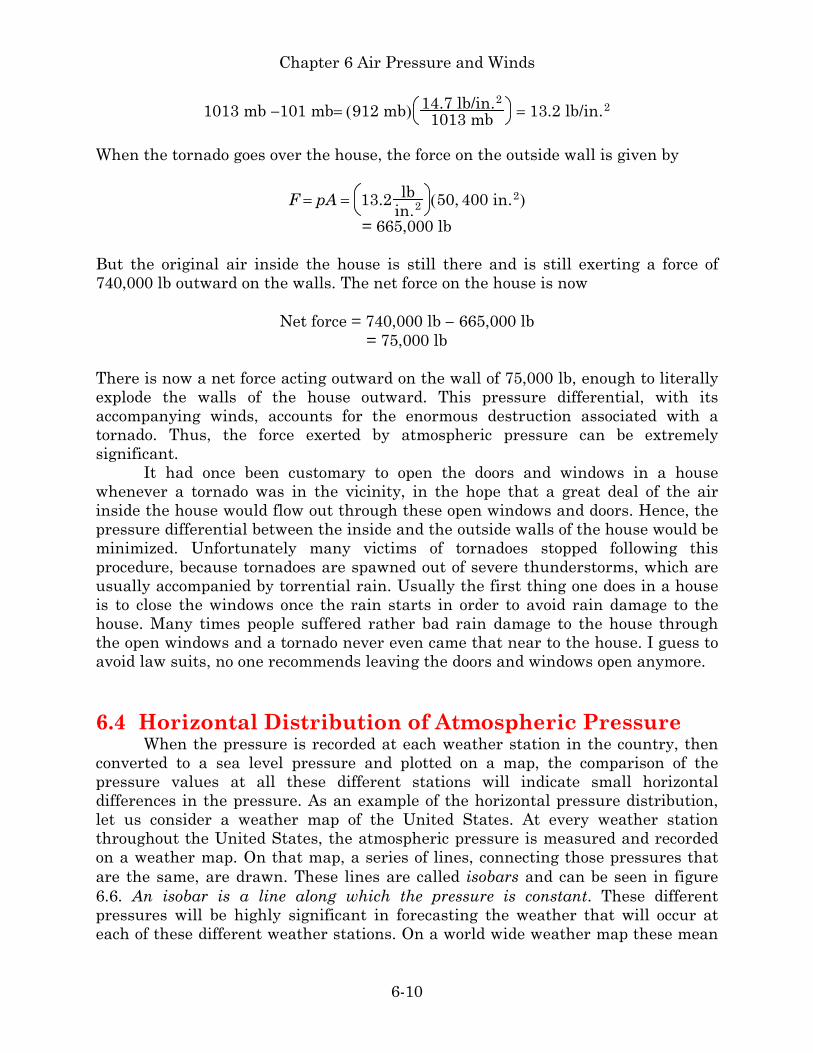
1013 mb −101 mb= (912 mb) 14.7 lb/in.2
1013 mb = 13.2 lb/in.2
When the tornado goes over the house, the force on the outside wall is given by
F = pA = 13.2 lbin.2 (50, 400 in.2)
= 665,000 lb
But the original air inside the house is still there and is still exerting a force of 740,000 lb outward on the walls. The net force on the house is now
Net force = 740,000 lb − 665,000 lb = 75,000 lb
There is now a net force acting outward on the wall of 75,000 lb, enough to literally explode the walls of the house outward. This pressure differential, with its accompanying winds, accounts for the enormous destruction associated with a tornado. Thus, the force exerted by atmospheric pressure can be extremely significant.
It had once been customary to open the doors and windows in a house whenever a tornado was in the vicinity, in the hope that a great deal of the air inside the house would flow out through these open windows and doors. Hence, the pressure differential between the inside and the outside walls of the house would be minimized. Unfortunately many victims of tornadoes stopped following this procedure, because tornadoes are spawned out of severe thunderstorms, which are usually accompanied by torrential rain. Usually the first thing one does in a house is to close the windows once the rain starts in order to avoid rain damage to the house. Many times people suffered rather bad rain damage to the house through the open windows and a tornado never even came that near to the house. I guess to avoid law suits, no one recommends leaving the doors and windows open anymore.
6.4 Horizontal Distribution of Atmospheric Pressure When the pressure is recorded at each weather station in the country, then
converted to a sea level pressure and plotted on a map, the comparison of the pressure values at all these different stations will indicate small horizontal differences in the pressure. As an example of the horizontal pressure distribution, let us consider a weather map of the United States. At every weather station throughout the United States, the atmospheric pressure is measured and recorded on a weather map. On that map, a series of lines, connecting those pressures that are the same, are drawn. These lines are called isobars and can be seen in figure 6.6. An isobar is a line along which the pressure is constant. These different pressures will be highly significant in forecasting the weather that will occur at each of these different weather stations. On a world wide weather map these mean

Chapter 6 Air Pressure and Winds
6-11
sea-level pressures will vary from pressures that are lower than 990 mb to pressures that are higher than 1030 mb. Although low pressure and high pressure are relative terms, regions on the surface of the earth that have pressures lower than 1013 mb are called low pressure areas while regions that have pressures higher than 1013 mb are referred to as high pressure areas. Horizontal pressure
Figure 6.6 A weather map.
differences result primarily from (1) the temperature differences that produce different density differences and (2) dynamic causes that result from atmospheric circulation. Also large amounts of water vapor in the air can cause slight variations in air pressure because water vapor is less dense than the other constituents of the air.
An isobar on a weather map is analogous to a contour line that is drawn on a topographical map to indicate a certain height above mean sea level. As an example, consider the mountain and valley shown in figure 6.7(a). A series of contour lines are drawn around the mountain at constant heights above sea level. The first line is drawn at a height H = 200 m above sea level. Everywhere on this line the height is exactly 200 m above sea level. The next contour line is drawn at H = 400 m. Everywhere on this line the height is exactly 400 m above sea level. Between the 200 m contour and the 400 m contour line the height varies between 200 m and 400 m. The contour line for 600 m is also drawn in the figure. The very top of the mountain is greater than the 600 m and is the highest point of the mountain.

Chapter 6 Air Pressure and Winds
6-12
The contour lines showing the valley are drawn at −200 m, −400 m, and −600 m. The −200 m contour line shows that every point on this line is 200 m below sea level. The bottom of the valley is the lowest point in the valley. If we were to look down on the mountain and valley from above, we would see a series of concentric circles representing the contour lines as they are shown in figure 6.7(b). (On a real mountain and valley the contours would probably not be true circles.) If we were to
Figure 6.7 Contour lines on a topographical map. place a large round bolder on the top of the mountain and give it a shove, it would roll down the mountain into the valley below. If the mountain is very steep, the velocity of the bolder will be large. If the mountain is shallow and not steep, the velocity of the bolder down the mountain will be much smaller.
The isobars are to a weather map as contour lines are to a topographical map. The isobars represent the pressure of the atmosphere. By drawing the isobars, a picture of the pressure field is obtained. Normal atmospheric pressure is 29.92 in. of Hg or 1013.25 mb. But remember that normal is an average of abnormals. At any given time, the pressure in the atmosphere varies slightly from this normal value. If the atmospheric pressure is greater than normal at your location, then you are in a region of high pressure. If, on the other hand, the atmospheric pressure is less than normal at your location, then you are in a region of low pressure. The isobars indicating high and low pressure are shown in figure 6.8(a). The high-pressure region can be visualized as a mountain and the low-pressure region as a valley in figure 6.8(b). Air in the high-pressure region flows down the pressure mountain into the low-pressure valley, just as a ball would roll down a real mountain side into the valley below. This flow of air is called wind. Just
200 m400 m600 m
-200 m-400 m-600 m
sea level
(a)
200 m400 m600 m
Mountain
-200 m-400 m-600 m
Valley
(b)

Chapter 6 Air Pressure and Winds
6-13
Figure 6.8 High and low atmospheric pressure.
as the velocity of the ball rolling down the real mountain depends upon the steepness of the mountain, the velocity of the wind as it rolls down the pressure mountain depends on the steepness of the pressure mountain. The steepness of the pressure mountain is determined by the pressure gradient which is defined as the rate of change of atmospheric pressure between two points at the same elevation. This is written mathematically as
p =px (6.12)
The symbol ∆ is called delta and it is a short hand mathematical notation that means “change in”. Hence, the symbol ∆p means the “change in pressure p” while the symbol ∆x means the “change in distance x”. The upside down delta symbol, called del, when used with the pressure p and designated as p is the symbol used to denote the pressure gradient. The pressure gradient p is proportional to the difference in pressure and is the immediate cause of horizontal air movement, that is, the wind.
The pressure gradient is the isobaric slope of the pressure mountain. When the isobars are packed very closely together, a large pressure gradient p results. This large pressure gradient, which corresponds to a steep slope, causes very large winds, that is, winds of very high velocity. When the isobars are spaced very far apart, a small pressure gradient p results. This small pressure gradient corresponds to a shallow slope, and causes very light winds, that is, winds of very low velocity.
sea level
1015 mb1020 mb1025 mb 995 mb
1000 mb1005 mb
(a)
1010 mb
(b)
1015 mb1020 mb1025 mb
1010 mb
995 mb1000 mb1005 mb
Pressure Mountain
Pressure Valley

Chapter 6 Air Pressure and Winds
6-14
Hence, air always flows out of a high-pressure area into a low-pressure area. The force on a ball rolling down the mountain is the component, acting down the mountain, of the gravitational force on the ball. The force on a parcel of air is caused by the difference in pressure between the higher pressure and the lower pressure. This force is called the pressure gradient force (PGF) and is the pressure gradient per unit mass, it is directed from the high-pressure area to the low-pressure area. It is effectively the slope of the pressure mountain-valley.
6.5 The Coriolis Force If the earth were not rotating, the air would flow perpendicular to the
isobars, directly from the high pressure area to the low pressure area. However, the earth does rotate, and the rotation of the earth causes air to be deflected to the right of its original path in the northern hemisphere. The deflection of air to the right of its path in the northern hemisphere is called the Coriolis effect. The Coriolis effect arises because the rotating earth is not an inertial coordinate system. For small-scale motion the rotating earth approximates an inertial coordinate system. However, for large-scale motion, such as the winds, the effect of the rotating earth must be taken into account.
The Coriolis effect is caused by the rotation of the earth and can best be described by an example. If the earth were not rotating and a projectile, aimed at a point on the equator, were fired from the north pole, its path through space would be in a fixed vertical plane that has the north pole as the starting point of the trajectory and the point on the equator as the ending point of the trajectory, figure 6.9(a).
N
Equator
S
N
Equator
S
(a) Nonrotating earth. (b) Rotating Earth Figure 6.9 The Coriolis force.

Chapter 6 Air Pressure and Winds
6-15
However, the earth rotates, and if a projectile, aimed at a point on the equator, were fired from the north pole, its path through space would be in a fixed vertical plane that has the north pole as the starting point of the trajectory and the point on the equator as the ending point of the trajectory at the moment that the projectile is fired. By the time that the projectile would arrive at the end point of its trajectory, that point would no longer be there, because while the projectile is in motion, the earth is rotating, and the point will have rotated away from the initial position it was in when the projectile was fired. A person fixed to the rotating earth would see the projectile veer away to the right of its initial path, figure 6.9(b), and would assume that a force were acting on the projectile toward the right of its trajectory. This fictitious force is called the Coriolis Force. This effect on a projectile is the same effect that would occur to a parcel of air moving south from the north pole. A person fixed to the rotating earth would see the parcel of air initially heading south but then it would appear to veer away to the right of its initial path. Again this apparently strange effect, caused by an observation on the rotating earth, is taken into account by assuming that there is a fictitious force, called the Coriolis force (CF) that acts to the right of the path of a parcel of air in its motion through the atmosphere. The equation for the Coriolis force is given by
CF = 2vΩ sin φ (6.13)
where CF is the Coriolis force per unit mass of air, v is the speed of the wind at the particular location, Ω is the angular velocity of the earth, and φ is the latitude on the earth where the observation is being made. Thus, the Coriolis force depends on the speed of the air (the greater the speed of the air the greater the force that will pull the air to the right, the lower the speed, the smaller the force) and the latitude angle φ. At the equator, φ = 0 and sin φ = 0, and hence there is no force of deflection at the equator. That is the Coriolis force is zero at the equator. As the latitude angle φ increases, the Coriolis force increases until for φ = 900, sinφ = 1, and hence the maximum force and deflection occur at the pole.
We should point out that just as air is deflected to the right of its path in the northern hemisphere by the Coriolis force, air will be deflected to the left of its path in the southern hemisphere, figure 6.10. Imagine a missile fired from the south pole toward some location A on the equator. It starts out toward the position A at the equator, but while in flight the earth is rotating. By the time the missile reaches the equator, the position A has rotated eastward away from its original position. To the observer at A he sees the missile as though it was deflected to the left of its original path. The magnitude of the Coriolis force in the southern hemisphere is the same as in the northern hemisphere, only the direction is different. Figure 6.10 shows that air is deflected by the Coriolis force to the right of its original path in the northern hemisphere and to the left of its original path in the southern hemisphere. The amount of the deflection is governed by the speed v of the air and the latitude angle φ as given in equation 6.13.

Chapter 6 Air Pressure and Winds
6-16
Figure 6.10 The Coriolis force in both hemispheres. 6.6 Wind Flow in a Low Pressure Area
Taking the Coriolis force into account, let us now describe the motion of the air as it moves toward a low-pressure area. The pressure gradient force PGF initiates the movement of the parcel of air, located at the point A, figure 6.11(a),
Figure 6.11 Winds in a low-pressure area.
along a path that is perpendicular to the isobars. But the air is deflected to the right of its path by the Coriolis force, and ends up at the position B. At B, the pressure gradient force is still acting toward the center of the low-pressure area, while the Coriolis force, acting to the right of the path, is opposite to the pressure gradient force. An approximate balance1
1A more detailed analysis by Newton’s second law would give
exists between the two forces and the air parcel now
N
Equator
S
P.G.F
C.FB
LA P.G.F
C.F v
L
P.G.F.f v
C.F
(a) No friction (b) Friction

Chapter 6 Air Pressure and Winds
6-17
moves parallel to the isobars. Notice that the air moves counterclockwise in a low-pressure area. A low pressure area is sometimes called a cyclone and this counterclockwise flow in a low pressure area in the northern hemisphere is called cyclonic flow.
A simple practical approach to locating the center of a low pressure area is given by Buys-Ballot rule. Buys-Ballot rule says that if you stand with your back to the wind in the northern hemisphere, the pressure on your left is less than the pressure on your right. This can be seen in figure 6.12.
Figure 6.12 Buys-Ballot rule. As the air moves over the ground, there is a frictional force f that acts on the
air which is directed opposite to the direction of motion of the air. This frictional force is responsible for the slowing down of the air which eventually causes a change in direction of the wind. This is shown in figure 6.11(b).
a = F = PGF + CF m
Since the air parcel is moving in a circle of radius r, with a velocity v, the acceleration is the centripetal acceleration given by v2/r. Hence Newton’s second law should be written as
v2 = PGF + CF r
But in very large scale motion, such as over a continent, v2/r ≈ 0.1 10−3 m/s2, while the PGF ≈ 1.1 10−3 m/s2. Thus the centripetal acceleration is about 1/10 of the acceleration caused by the pressure gradient force, and in this simplified analysis is neglected. The second law then becomes
0 = PGF + CF or
PGF = −CF
Hence the force on the air parcel is balanced between the pressure gradient force and the Coriolis force. The wind that results from the balance between the PGF and the CF is called the geostrophic wind. For a more accurate analysis and especially in smaller sized pressure systems such as hurricanes and tornadoes this assumption cannot be made and the centripetal acceleration must be taken into account. The balanced flow of air in a low pressure area taking the centripetal acceleration into account is called the gradient wind.
LLeft Right

Chapter 6 Air Pressure and Winds
6-18
This effect can be explained by noting that the Coriolis force CF is a function of the wind speed v, as seen in equation 6.13. If the wind speed decreases because of friction, the Coriolis force also decreases. Hence, there is no longer the balance between the pressure gradient force PGF and the Coriolis force CF. Since the pressure gradient force is now larger than the Coriolis force, the air parcel moves across the isobars at an angle toward the low-pressure area. The combined result of the pressure gradient force PGF, the Coriolis force CF, and the frictional force f, causes the air to spiral into the low-pressure area, as seen in figure 6.11(b). Over land the wind crosses the isobars an angle of about 450 while over large water areas the wind crosses the isobars an angle of about 100 to 200.
The result of the above analysis shows that air spirals counterclockwise into a low-pressure area at the surface of the earth. But where does all this air go? It must go somewhere. The only place for it to go is upward into the atmosphere. Hence, there is vertical motion upward in a low-pressure area, as shown in figure 6.13.
Figure 6.13 Relation between convergence of air at the surface and ascending air aloft.
That is, there is a general convergence of air into the low pressure area at the surface and then vertical motion upward into the atmosphere. At some greater height in the atmosphere the rising air will diverge away to keep the low pressure area at the surface from filling up. Hence, there must be a region of divergence aloft to maintain the convergence at the surface.
Now recall that the pressure of the air in the atmosphere decreases with altitude. Hence, when the air rises in the low-pressure area it finds itself in a region of still lower pressure aloft. Therefore, the rising air from the surface expands into the lower pressure aloft. But for a gas to expand the gas must do work. Since there is no heat added to, or taken away from this rising air, the air is expanding adiabatically. But the work done in the expansion causes a decrease in the internal energy of the gas. Hence, the rising air cools as it expands because the energy necessary for the gas to expand comes from the internal energy of the gas itself. Hence the temperature of the air decreases as the air expands and the rising air cools.
L
Chapter 6 Air Pressure and Winds
6-19
If the rising air cools down far enough it reaches the point where the air has all the water vapor it can hold. At this point the air is saturated and the relative humidity of the air is 100%. If the air continues to rise and cool, it cannot hold all this water vapor. Hence, some of the water vapor condenses to tiny drops of water. The aggregate of all these tiny drops of water suspended in the air is called a cloud. Hence, clouds are formed when the rising air is cooled to the condensation point. If the rising and cooling continue, more and more water vapor condenses until the water drops get larger, As they collide and coalesce with still other cloud droplets they get so large that they fall and the falling drops are called rain. In summary, associated with a low-pressure area in the atmosphere is rising air. The cooling of this adiabatically expanding air causes the formation of clouds, precipitation, and general bad weather. Thus, when the weatherman says that low pressure is moving into your area, as a general rule, you can expect bad weather.
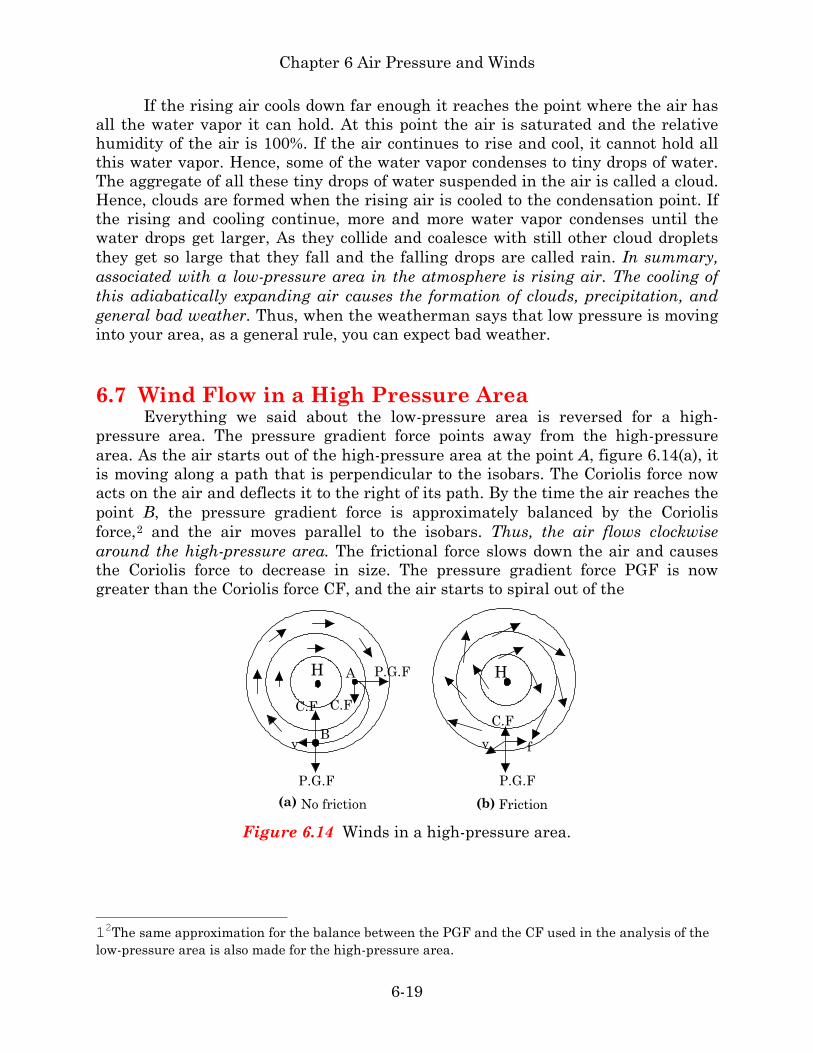
6.7 Wind Flow in a High Pressure Area Everything we said about the low-pressure area is reversed for a high-
pressure area. The pressure gradient force points away from the high-pressure area. As the air starts out of the high-pressure area at the point A, figure 6.14(a), it is moving along a path that is perpendicular to the isobars. The Coriolis force now acts on the air and deflects it to the right of its path. By the time the air reaches the point B, the pressure gradient force is approximately balanced by the Coriolis force,2
Figure 6.14 Winds in a high-pressure area.
and the air moves parallel to the isobars. Thus, the air flows clockwise around the high-pressure area. The frictional force slows down the air and causes the Coriolis force to decrease in size. The pressure gradient force PGF is now greater than the Coriolis force CF, and the air starts to spiral out of the
12The same approximation for the balance between the PGF and the CF used in the analysis of the low-pressure area is also made for the high-pressure area.
P.G.F(a) No friction
P.G.F
C.F
B
A P.G.F
C.F
v
H
(b) Friction
fvC.F
H

Chapter 6 Air Pressure and Winds
6-20
high-pressure area, figure 6.14(b). A high pressure area is sometimes called an anticyclone and the clockwise flow in the high pressure area in the northern hemisphere is often referred to anticyclonic flow.
From what we have just seen, air spirals out of a high pressure area at the surface of the earth. But if all the air that was in the high-pressure area spirals out, what is left within the high-pressure area? If the air is not replenished, the area would become a vacuum. But this is impossible. Therefore, air must come from somewhere to replenish the air spiraling out of the high. The only place that it can come from is from the air aloft. That is, air aloft moves downward into the high-pressure area at the surface. Thus, there is vertical motion downward in a high-pressure area. This subsiding air, and the surface divergence of that air, is shown in figure 6.15.
As the air aloft descends, it finds itself in a region of still higher pressure and is compressed adiabatically. Thus, work is done on the gas by the atmosphere and this increase in energy shows up as an increase in the internal energy of the air, and hence an increase in the temperature of the descending air. Thus, the air warms up adiabatically as it descends. Because warmer air can hold more water vapor than colder air, the water droplets that made up the clouds evaporate into the air. As more and more air descends, more and more water droplets evaporate into the air until any clouds that were present have evaporated, leaving clear skies. Hence, high-pressure areas are associated with clear skies and, in general, good weather. So when the weatherman tells you that high pressure is moving into your area, you can usually expect good weather.
Figure 6.15 Relation between divergence of air at the surface and subsiding air aloft.
Now when you look at your TV weather map, look for the low- and high-
pressure areas. If the low-pressure area is moving into your region, you can expect clouds and deteriorating weather. If the high-pressure area is moving into your region, you can expect improving weather with clear skies.
H

Chapter 6 Air Pressure and Winds
6-21
6.8 Wind Observations For a complete description of the wind we need to measure both the wind
direction and the wind speed. To measure the direction of the wind a wind vane is used. A wind vane usually consists of a metallic arrow that is mounted on a pole and is free to rotate, as shown in figure 6.16. The pole is usually attached to the roof of a building. Since the tail of the arrow is bigger than the tip of the arrow, when the wind hits the arrow it pushes against the tail of the arrow causing it to rotate. The arrow will rotate until the tip of the arrow points into the wind. An electrical
Figure 6.16 A weather vane.
connection is usually made on the wind vane which shows the direction of the wind inside the weather station. Since the arrow points into the direction from which the wind flows, the winds are named for the direction from which they come. That is, a wind that blows from the south to the north is called a south wind, whereas a wind the blows from the north to the south is called a north wind. To account for all the different possible directions for the wind flow, a compass rose is used as shown in figure 6.17. If a wind blows from the east it is called an easterly
Figure 6.17 The compass rose and wind directions.
wind. If the wind blows half way between the north and the east it is called a northeast wind. If the wind blows half way between the south and the east it is called a southeast wind. If the wind blows half way between the north and the west it is called a northwest wind, etc. If the wind blows halfway between north and northeast it is called a north-northeast wind. If the wind blows halfway between northeast and east it is called a east-northeast wind. Using this type of description
N
SEW
N
S
EW
NENW
SESW
3600
1800
2700 900
00 NNE
ENE

Chapter 6 Air Pressure and Winds
6-22
we can describe the direction of the wind for all different directions. For even more detailed description of the wind direction we can use the angles of the compass rose for the wind direction. Thus an east wind would flow from a direction of 900, a south wind from 1800, a west wind from 2700, and a wind from the north as either 00 or 3600. Some arbitrary wind might blow from an angle of 350. So to determine the direction of the wind, all you have to do is to look at the weather vane and see in what direction it is pointing. That direction is the direction from which the wind is blowing.
To determine the speed of the wind we use a device called an anemometer. An example of an anemometer is shown in figure 6.18. It consists of a long pole usually attached to the roof of a building. Connected to it are three metal rods that extend outward in the horizontal direction. At the end of each rod is a little cup. As the wind blows past the anemometer it gets caught in the little cup and causes the cup to rotate around the pole. The greater the speed of the wind the greater the rotation rate of the anemometer cups. The rotation is transferred to a coil below
Figure 6.18 An anemometer for measuring wind speed. that rotates in a magnetic field. The rotating coil in the magnetic field causes a current to flow in a meter that is calibrated to give the wind speed. In this way the wind speed is determined. The standard unit in meteorology for expressing the wind speed is the knot. A knot is defined as a nautical mile per hour, which is equivalent to 1.15 statute miles per hour. (Recall that a statute mile is equal to 5280 ft. while a nautical mile is equal to 6080 ft, and also that 1 mph = 0.87 knots.)
The symbols used on a weather map to indicate the wind speed are shown in figure 6.19. The horizontal straight line in that figure represents the direction of the wind velocity and the marker on the end of the line indicates the wind speed. One line indicates the wind speed is 10 knots, two lines 20 knots, three lines 30 knots, etc. A shorter line indicates a wind speed of 5 knots and when combined with say two longer lines gives 25 knots. In this way any wind speed up to 50 knots can be designated on a weather map. A fifty knot wind has a small blackened triangle at the end of the line. Two triangles represents 100 knots and three triangles 150 knots. A triangle and two lines would represent a speed of 70 knots. Thus different combinations of triangles and lines can show any wind speed above 50. Two examples of a weather station marked on a map showing the wind speed and direction are shown on the right of figure 6.19.

Chapter 6 Air Pressure and Winds
6-23
Figure 6.19 Wind speed Some maps are drawn to show the distribution of wind speeds throughout the
country. On such a map lines are drawn connecting points that have the same wind speed. Lines that connect points that have the same wind speed are called isotachs.
6.9 Winds Aloft Wind direction changes with altitude. As we get away from the surface of the
earth the wind does not slide over the earth’s surface and therefore friction does not slow down the winds. Hence the winds become more nearly parallel to the isobars and wind speed becomes more nearly geostrophic.
A graph of the 500 mb surface is shown in figure 6.20. At every point on this map the pressure is 500 mb. This map is called a constant pressure map. The 500 mb surface rises and falls throughout the atmosphere and the height of the 500 mb surface at any point is measured by a height in meters. So instead of actually drawing isobars on a constant height map such, as is done at the surface, contours of different heights are drawn on a constant pressure surface. The effect is still the same. Where the contour number is high, this represents high pressure, where the contour number is low, this will represent low pressure. Notice that the map does not have all the closed low and high pressure centers that are observed on the surface weather map. Instead we have ridges and troughs in the contour field. A ridge corresponds to a high pressure and a trough to low pressure. Notice that the winds aloft blow more nearly parallel to the contour lines than they do on the surface map.
Upper air winds are determined by a weather balloon which is tracked either optically or by radar. To measure the wind optically with a balloon, called a pilot balloon or sometimes just referred to as a pibal, the balloon is released from the surface and then tracked by a theodolite. A more general way to track the balloon is by radar, and when this is done it is called a Rawin observation.
5 Kts10 kts15 kts20 kts25 kts30 kts35 kts
40 kts
50 Kts
60 Kts
65 Kts
70 Kts75 Kts100 Kts
150 Kts
Station
25 Kt wind 2700from or a westerly wind
of 25 Kt
Station
20 Kt wind 3150from or a northwest wind
of 20 Kt

Chapter 6 Air Pressure and Winds
6-24
Figure 6.20 A 500 mb map.
Strong convection currents cause turbulence in the air aloft. Along
boundaries between air streams having different speeds wind shear develops creating violent turbulence.
Along the boundary where cold air advances against warmer air, the lighter warmer air will rise and spread out above the heavier colder air below, so that at times the winds aloft may be blowing directly opposite the winds below at the surface.
It is observed that there is a diurnal variation of wind speed at the surface of the earth. That is, in the early afternoon the surface wind speeds are at their maximum, while in the early morning hours just before sunrise the winds will be at their lowest value. This diurnal variation of wind speed comes about because of the convection of the air by the heating of the surface during the day light hours. The convection causes an exchange of the slower air below with the faster air aloft. At night the slower air at the surface stays where it is because there is now no thermal convection.
6.10 Local Winds There are many winds that occur because of the local topography of the area
and these are usually referred to as local winds. Some of these local winds and their description are shown below.

Chapter 6 Air Pressure and Winds
6-25
The Sea Breeze Sea breezes occur on clear days in summer, along seacoasts or large inland water bodies. Because the specific heat of water is so much greater than the specific heat of land, the water is able to absorb the same quantity of heat from the sun with a smaller temperature change than the temperature change of the land. Hence, the land heats more rapidly than the water, and the temperature of the air over the land becomes greater than the temperature of the air over the water. We can describe the effect of this in two ways. From the point of view of the temperature of the air, the hot air over the land rises into the atmosphere. The colder air over the ocean now blows on shore to replace this rising air over the land. The air aloft over the ocean now descends to the ocean surface to replace the air that has just blown on shore. The hot air over the land which rose up into the atmosphere, now moves out over the ocean to replace the air that just descended to the ocean surface. Hence a convection cycle has occurred and is shown in figure 6.21. The net result of the sea breeze is to bring cool refreshing winds from over the ocean onshore to the hot summer land. This is why so many people flock to the beaches in the summertime. This is why Long Island is such a popular place to live because it is relatively cool in the usual very hot days of summer.
Figure 6.21 The sea breeze.
The sea breeze can also be explained on the basis of a pressure differential between the air over the ocean and the air over the land. The hotter air over the land expands and becomes less dense than it was previously. This expanding air is less dense and hence the pressure over the land decreases. The colder air over the ocean is more dense and hence its pressure is greater than the pressure of the air over the land. Thus a local low pressure area has developed over the land and a local high pressure area has developed over the ocean. The winds now flow from the high pressure over the ocean to the low pressure over the land thus bringing cool air from the ocean onto the hot land, giving us the sea breeze.
The sea breeze is considered a local wind because the maximum distance inland that the wind blows is only about 50 km (30 miles), and the maximum depth of the sea breeze is only about 1000 m. The sea breeze begins in the late morning hours, from about 11 AM to 12 noon, and moves inland to decrease the afternoon
Hot land
Cool sea
L
H
H L
Sea Breeze

Chapter 6 Air Pressure and Winds
6-26
temperatures. Thus, areas along the coast will have cooler temperatures than areas inland.
At night the process is reversed, and we have what is called the land breeze, see figure 6.22. At night the land cools more rapidly than the ocean, leaving warmer air over the ocean than over the land. Now the warmer air over the ocean rises and the cooler air over the land blows out to replace this rising air. Air aloft over the land descends to replace the departing cool air over the land. Again a convection cycle is developed and is seen in figure 6.22. The land breeze is not as strong as the sea breeze and not as extensive. The maximum wind occurs in the early morning hours and dies out soon after sunup.
Figure 6.22 The land breeze. Mountain and Valley Breeze.
People who live near mountains or valleys experience a local wind called a mountain wind or a valley wind. On clear cool nights the mountain radiates very much energy away and the air in contact with the mountain becomes very cool. This cool air flows down the mountain into the valley below and is called a mountain breeze.
On warm sunny days the mountain receives a good deal of radiation from the sun and warms rapidly. The warm air in contact with the mountain rises and the air below in the valley flows up the side of the mountain to replace this air giving rise to a valley breeze. 6.11 Global Pressure Distribution and Circulation
Convection is the main mechanism of thermal energy transfer in the atmosphere. On a global basis, the nonuniform temperature distribution on the surface of the earth causes convection cycles that result in the prevailing winds. If the earth were not rotating a huge convection cell would be established as shown in figure 6.23(a). The overall pressure distribution on the surface of the earth occurs because of the uneven temperature distribution on the surface of the earth. The equator is the hottest portion of the earth because it gets the maximum radiation from the sun. The hot air at the equator expands and becomes less dense. Recall that atmospheric pressure is caused by the weight of all the air over a unit area of
Cool land
Warm seaL
H
HL
Land Breeze

Chapter 6 Air Pressure and Winds
6-27
the surface. If the air is less dense, there is less of it and hence its weight per unit area is going to be less. Thus the pressure at the equator is going to be low pressure. We call this low pressure area the equatorial low. Air both north and south of the equator will flow into this equatorial low. This convergence of surface air at the equator causes the air to rise into the atmosphere.
While this is happening at the equator let us look at the north pole. The air at the north pole is very cold because of the small amount of solar radiation reaching the surface. If the air is very cold, it contracts and becomes more dense.
(a) Non-rotating Earth (b) Rotating Earth Figure 6.23 Global pressure distribution.
Recall that atmospheric pressure is caused by the weight of all the air over a unit area of the surface. If the air is more dense, there is more of it and hence its weight per unit area is going to be greater. Thus the pressure at the pole is going to be high pressure. This region of high pressure is called the polar high. As we have seen, air flows out of a high pressure area. Hence the cold surface air at the pole now flows outward toward the equator to replace the hot rising surface air at the equator. Air aloft over the poles descends to replace the air at the surface that just moved toward the equator. The initial rising air at the equator flows toward the pole, completing the convection cycle. The net result of the cycle is to bring hot air at the surface of the equator, aloft, then north to the poles, returning cold air at the polar surface back to the equator.
This simplified picture of convection on the surface of the earth is not quite correct, because the effect produced by the rotating earth, the Coriolis Effect, has been neglected. As you recall, the Coriolis effect is caused by the rotation of the earth. When the Coriolis effect is applied to the global circulation of air in the
Equatorial Low
Polar High
Polar High
cold
hothot
cold

Chapter 6 Air Pressure and Winds
6-28
atmosphere, it causes winds in the northern hemisphere to be deflected to the right of their original path. The global convection cycle described above still occurs, but instead of one huge convection cell, there are now three smaller ones in this same area, figure 6.23(b). The reason for this is because as the air aloft at the equator flows north it converges because of the spherical shape of the earth. As an example, the distance between 10 degrees of longitude at the equator is greater than the distance between the same 10 degrees of longitude at 300 north latitude. So all that air at the equator converges together as it heads north. Also, because of the Coriolis effect, that same air is deflected to the right of its path and eventually flows in an easterly direction at approximately 300 north latitude. The piling up, or convergence, of all this air at this latitude causes the air aloft to sink to the surface, figure 6.23(b), where it forms a semipermanent high pressure area called the subtropic high, figure 6.24(a). The air at the surface that flows north from this high pressure area is deflected to the right of its path toward the east, thereby producing the mid-latitude westerlies, figure 6.23(a) and figure6.24(b), or as it is sometimes called the prevailing westerlies. The air at the surface that flows south from this subtropic high pressure is also deflected to the right of its path toward the southwest producing the northeast trade winds, also shown in figures 6.23(b) and 6.24(b). The winds from the polar high flowing south at the surface of the earth are
Equatorial Low
Polar High
Polar High
Subtropic High
Subpolar Low
Subtropic HighSubpolar Low
L
H
L
H
North EastTrade Winds
PolarEasterlies
Westerlies
Doldrums
300
600
(a) (b)
Figure 6.24 (a) Global pressure distribution (b) Global winds deflected to the right of their path and become the polar easterlies as shown in figures 6.23(b) and 6.24(b). The converging air from the polar easterlies and the mid-latitude westerlies form a low pressure area, called the subpolar low. Thus air flowing north from the subtropic high and the air flowing south from the polar high converge and form the subpolar low. Thus because of the rotation of the earth, there are now four permanent air pressures on the surface of the earth, the polar high, the subpolar low, the subtropical high and the equatorial low, as shown in figure 6.24(a). Thus, it is the nonuniform temperature distribution on the surface of the earth that causes the pressure distribution that is responsible for the global winds.
Chapter 6 Air Pressure and Winds
6-29
The westerlies and the polar easterlies meet and converge at the subpolar lows or polar fronts, figure 6.23(b). Here there is frequently a great contrast between the temperature of the winds from subtropical and polar source regions, giving rise to the cyclonic vortices or lows that are carried along in the westerlies. Although the winds in these cyclonic storms may blow from any direction, the prevailing westerlies causes the entire low pressure area, with all its clouds and precipitation, to move from the west toward the east. The weather we get today is the weather that the people west of us got yesterday, along with any modifications caused by the strengthening or weakening of the storm system. We will see more about this in the next chapter.
The Language of Meteorology
Pressure - The magnitude of the normal force acting per unit surface area. The difference in pressure between two points on the surface of the earth is responsible for the winds that blow from the higher pressure area to the lower pressure area. The hydrostatic equation - An equation that gives the pressure of a fluid at a particular depth. Barometer - An instrument that measures atmospheric pressure. Isobar - a line on a weather map, connecting those points whose pressures are the same. Coriolis effect - the rotation of the earth causes air to be deflected to the right of its original path in the northern hemisphere. Low pressure area - air spirals counterclockwise into a low-pressure area at the surface of the earth. There is vertical motion upward in a low-pressure area. The cooling of this adiabatically expanding air causes the formation of clouds, precipitation, and general bad weather. High pressure area - air flows clockwise around a high-pressure area, and spirals out of the high pressure area at the surface of the earth. The air aloft descends to replace the air leaving at the surface. The air warms up adiabatically as it descends. Because warmer air can hold more water vapor than colder air, the water droplets that made up the clouds evaporate into the air. As more and more air descends, more and more water droplets evaporate into the air until any clouds that were present have evaporated, leaving clear skies. Hence, high-pressure areas are associated with clear skies and, in general, good weather. Wind Direction - Winds are named for the direction from which they come.

Chapter 6 Air Pressure and Winds
6-30
Anemometer - A device used to determine the speed of the wind. Knot - The standard unit in meteorology for expressing the wind speed. A knot is defined as a nautical mile per hour. Global Pressure Distribution and Circulation - On a global basis, the nonuniform temperature distribution on the surface of the earth causes convection cycles that result in the prevailing winds. The four main pressure areas in the atmosphere are the Polar High, the Subpolar Low, the Subtropic High, and the Equatorial Low. Polar Easterlies - The winds from the polar high flowing south at the surface of the earth are deflected to the right of their path and become the polar easterlies Mid-latitude Westerlies or Prevailing Westerlies - The air at the surface that flows north from the subtropic high pressure area is deflected to the right of its path toward the east, thereby producing these westerly winds . Northeast Trade Winds - The air at the surface that flows south from this subtropic high pressure is also deflected to the right of its path toward the southwest producing these northeast trade winds.
Summary of Important Equations Pressure p = F
A (6.1)
Hydrostatic equation p = ρgh (6.6) Force F = pA (6.11) Coriolis force CF = 2vΩ sin φ (6.13)
Questions for Chapter 6
1. When you fly in an airplane you find that your ears keep “popping” when the plane is ascending or descending. Explain why.
2. Using a barometer and the direction of the wind, describe how you could make a reasonable weather forecast.

Chapter 6 Air Pressure and Winds
6-31
3. A pilot uses an aneroid barometer as an altimeter that is calibrated to a standard atmosphere. What happens to the aircraft if the temperature of the atmosphere does not coincide with the standard atmosphere?
To go to another chapter, return to the table of contents by clicking on this sentence.


![METEOROLOGY 050 - Traficom 11102018.pdf · [A] A weak pressure gradient and strong winds. [B] A weak pressure gradient and light winds. [C] A large pressure gradient and light winds](https://img.pdfslide.us/doc/110x75/5e448e3b7a4e412c5252303d/meteorology-050-traficom-11102018pdf-a-a-weak-pressure-gradient-and-strong.jpg)