Embed Size (px)
Citation preview
113
Chapter 6
Managing Conflict in System Diagnosis
John W. SheppardARINC Incorporated
William R. SimpsonInstitute for Defense Analyses
Keywords: Diagnostic inference models, diagnostics, system test, certainty factors,Dempster-Shafer, conflict management
Abstract: Advanced diagnostic techniques have become essential for supportingreliable testing of modern systems due to the rapid growth in complexityof these systems. Errors in the test process become more likely withincreased complexity and need to be treated carefully to maximizeaccuracy in diagnosis. In this paper, we discuss several approaches toanalyzing conflicting test results. We have concentrated on one approachbased on model-based diagnosis—the information flow model—toidentify conflict and improve diagnostics.
1. INTRODUCTION
The complexity of modern systems has led to new demands on systemdiagnostics. As systems grow in complexity, the need for reliable testing anddiagnosis grows accordingly. The design of complex systems has beenfacilitated by advanced computer-aided design/computer-aided engineering
114 Chapter 6
(CAD/CAE) tools. Unfortunately, test engineering tools have not kept pace withdesign tools, and test engineers are having difficulty developing reliableprocedures to satisfy the test requirements of modern systems.
Testing of complex systems is rarely perfect. In software, it is almostimpossible to track system state or all of the ways values might be affected.Hardware systems are frequently subject to noise and other random eventsmaking interpretation of test results difficult, thus lowering confidence in whatthe tests indicate. Even with digital testing, which eliminates some noiseproblems, developers must still contend with the effects of state. Finally,modern systems depend heavily on both hardware and software, and theinteractions between hardware and software further compound the problem ofmanaging test errors.
When testing a complex system, what is the proper response tounexpected and conflicting test results? Should the results be scrapped and thetests rerun? Should the system be replaced or redesigned? Should the testprocedures be redeveloped? Determining the best answers to these questions isnot easy. In fact, each of these options might be more drastic than necessary forhandling conflict in a meaningful way.
When test results conflict, the potential source of the conflict must beanalyzed to determine the most likely conclusion. To date, test systems havedone little more than identify when a conflict exists. Since the early 1970s,artificial intelligence researchers have attempted to “handle” uncertain andconflicting test information. But handling the uncertainty and the conflict hasbeen limited to assigning probabilities or confidence values to the conclusionsto provide a ranked list of alternatives for taking appropriate action.
1,2 When test
results are uncertain but consistent, this is about the best we can do.In this article, we discuss two approaches to system diagnosis that apply
several tests and interpret the results based on an underlying model of thesystem being tested. These tests are used to determine if the system isfunctioning properly and, if not, to explain the faulty system performance.When test information conflicts, ignoring or improperly handling this conflictwill degrade diagnostic accuracy. By examining potential sources of conflictand the way conflict might become manifest in a reasoning system, wedeveloped an approach to extend diagnosis to handle the conflict and draw morereliable conclusions.
Managing Conflict in System Diagnosis 115
2. SYSTEM DIAGNOSIS
Frequently, test engineers define a system-level diagnostic process thatis independent of the design and manufacturing process. The first step, forexample, is to develop built-in test (BIT) or built-in self test (BIST) for initialdetection and localization of faults. These tests, which are embedded in thesystem itself, when used with other tests, may localize faults to a level sufficientto take action. Subsequent steps apply a battery of automatic and manual tests tothe system (or subsystem). Eventually, these tests might identify the subunitsuspected of containing the fault. The subunit is then tested to find the faultyunit. Once a unit or subunit is separated from the system, maintainers frequentlyuse specialized equipment (usually from the unit manufacturer) to test it.
Despite improvements in BIT, BIST, and automatic testing,manufacturers typically have not provided maintainers with comprehensivediagnostic procedures. Instead, they rely on part screening and special testapproaches, which are inadequate in that they emphasize ensuring the systemfunctions properly rather than isolating faults when the system does not functionproperly
This approach to system testing is an artifact of a manufacturing processthat tests only pieces of systems. This approach is clearly insufficient to explainanomalous behavior at the system level, since it fails to account for the complexinteractions among system components. At this level, we are left with a feweuphemisms to heuristic approaches, such as “tickle testing” (when we snug allfittings and clean all contacts), or “shotgun maintenance” (when we guess wherethe fault resides and take action until the system anomalies disappear).
In developing an alternative, we focused on ideas developed inintegrated diagnostics programs. Integrated diagnostics programs emphasize theapplication of structured approaches to system testing and diagnosis. They havethree objectives:
• Maximum reuse of design and test data, information, knowledge, andsoftware.
• Integration of support equipment and manual testing, to providecomplete coverage of diagnostic requirements.
• Integration of available diagnostic information, to minimize requiredresources and optimize performance.
Our research focuses on applying a uniform method for representingdiagnostic information: One model type represents the system at all levels of
116 Chapter 6
detail. Using this model, test engineers can determine BIT requirements, definetest programs for automatic test equipment, and guide the manualtroubleshooting process.
The model we use captures test information flow: It models theinformation provided by a set of tests defined for the system with respect to aset of desired conclusions. During troubleshooting, the information gatheredfrom performing the series of tests is combined to make a diagnosis. Definingthe relationships between tests and conclusions results in the information flowmodel. The models are hierarchical, in that a conclusion in one model can beused to invoke a lower-level model. The rules for handling each model andsubmodel are the same regardless of position in the hierarchy.
We begin by developing a set of information flow models for thesystem to be tested. We develop models for on-board diagnosis (thusdetermining the requirements for BIT) and for each subsequent level of testing.The conclusions drawn at one level determine the appropriate model to use atthe next level.
Once developed, we analyze the models to evaluate the system’stestability and perform design trade-offs to improve testability. Thus themodeling process begins in the early stages of system development. As thesystem progresses through the life cycle, the models are revised to reflectchanges and refinements in the design. For diagnosis, the models defineavailable tests and inferences that can be drawn by obtaining test outcomes.Hence, the same models used to evaluate testability of the system can be usedfor troubleshooting.
3. THE INFORMATION FLOW MODEL
To address several problems associated with performing system diagnosisand analyzing system testability, we introduced the concept of an information flowmodel (Simpson & Sheppard, 1994). This model-based approach to system test anddiagnosis incorporates techniques from information fusion and model-based reasoningto guide analysis. The model represents the problem to be solved as diagnosticinformation flow. Tests provide information, and diagnostic inference combinesinformation from multiple tests using information fusion and statistical inference. Thestructure of the information flow model then facilitates our ability to computetestability measures and derive diagnostic strategies.
An information flow model has two primitive elements: tests and fault-isolation conclusions. Tests include any source of information that can be used to
Managing Conflict in System Diagnosis 117
determine the health state of a system. Fault isolation conclusions include failures offunctionality, specific non-hardware failures (such as bus timing), specific multiplefailures, and the absence of a failure indication (No Fault). The information obtainedmay be a consequence of the system operation or a response to a test stimulus. Thus,we include observable symptoms of failure processes in the information flow model astests. Including these symptoms allows us to analyze situations that involveinformation sources other than formally defined tests. Of course, the purpose of themodel is to combine information obtained from these information sources (tests) toderive conclusions about the system being diagnosed.
When developing a fault isolation strategy, the type, amount, and quality oftest information should be considered. For our purposes, we initially assume equalquality among test results in the sense that the good or bad indication of a test actuallyreflects the state of the unit under test. During actual diagnosis, we relax thisassumption to allow a confidence value to be associated with a test result. If all testinferences in a system are known, the information content of each test can becalculated. If a test is performed, the set of inferences allows us to draw conclusionsabout a subset of components. At any point in a sequence of tests, the model can beused to compute the set of remaining failure candidates. We developed a precisealgorithm to look at the information content of the tests. This algorithm selects testssuch that the number of tests required to isolate a fault is minimized over the set ofpotential failure candidates.
4. DIAGNOSIS USING THE INFORMATION FLOWMODEL
Fault isolation can be mathematically described as a set partition problem.Let C = (c1, c2, ..., cn) represent the set of components. After the jth test, a fault-isolation strategy partitions C into two classes. ( )F j j j
mjc c c= 1 2, , ,� 1 is the set of
components that are still failure candidates after the jth test (feasible set). G C Fj j= −is the set of components found to be good after the jth test (infeasible set). By thisstructure, a strategy will have isolated the failure when F j consists of a single elementor an indivisible component ambiguity group.
Let D represent the full set of test inference relationships between componentsand test points. This is formulated as a matrix representation. Let Sk be a sequence ofk tests, (t1, t2,..., tk). Let Fk be the feasible failure candidate set associated with Sk. Wethen develop an information measure, Ik
j , for each remaining (unperformed) test, tj,
which is a function of the inference relationship and the remaining candidate failure
118 Chapter 6
class, say, I kj kf= ( , )D F (Shannon, 1948; Dretske, 1982; Quinlan, 1986; Simpson &
Sheppard, 1994). The test sequence Sk that is derived is obtained by optimizing ateach decision point. That is, the next test in the sequence is taken as the test thatmaximizes Ik
j for the conditions imposed by each previous test outcome and is based
on an unknown current outcome. The sequence ends when adequate information isderived for fault isolation. Although this algorithm uses the greedy heuristic (i.e., doeslocal search), it is based upon a higher order representation and has been providingperformance near the theoretical optimum (Simpson & Sheppard, 1994).
5. DIAGNOSIS AND CONFLICT MANAGEMENT WITHDEMPSTER-SHAFER INFERENCE
Our approach to diagnosis uses a modification of Dempster-Shafer(Dempster, 1968; Shafer, 1976) statistical inference in its inference engine(Simpson & Sheppard, 1994). To summarize, we compute values for twoextremes of a credibility interval for every conclusion in the model. Theseextremes are called Support, sci
, and Plausibility, pci, and for a given
conclusion, ci, s c pc i ci i≤ ≤Pr( ) . To compute these measures, we begin with
assigning a confidence value to a particular test outcome, cft j. In our
formulation, we uniformly distribute the support over all conclusions supportedand apply the full weight of denial (the complement of plausibility) to allconclusions denied. Thus,
scf
c
t
si
j=C
(1)
d cfc ti j= (2)
where Cs is the set of conclusions supported by the evidence given in tj, and dci is
the denial of conclusion ci.From these, we compute support and plausibility measures incrementally.
We determine how much the new evidence conflicts with previously accumulatedevidence (initially assuming no disagreement). Then we revise the support foreach conclusion using a variant on Dempster’s Rule of Combinations (Dempster,1968) which computes normalized mutual support and denial for each conclusion
Managing Conflict in System Diagnosis 119
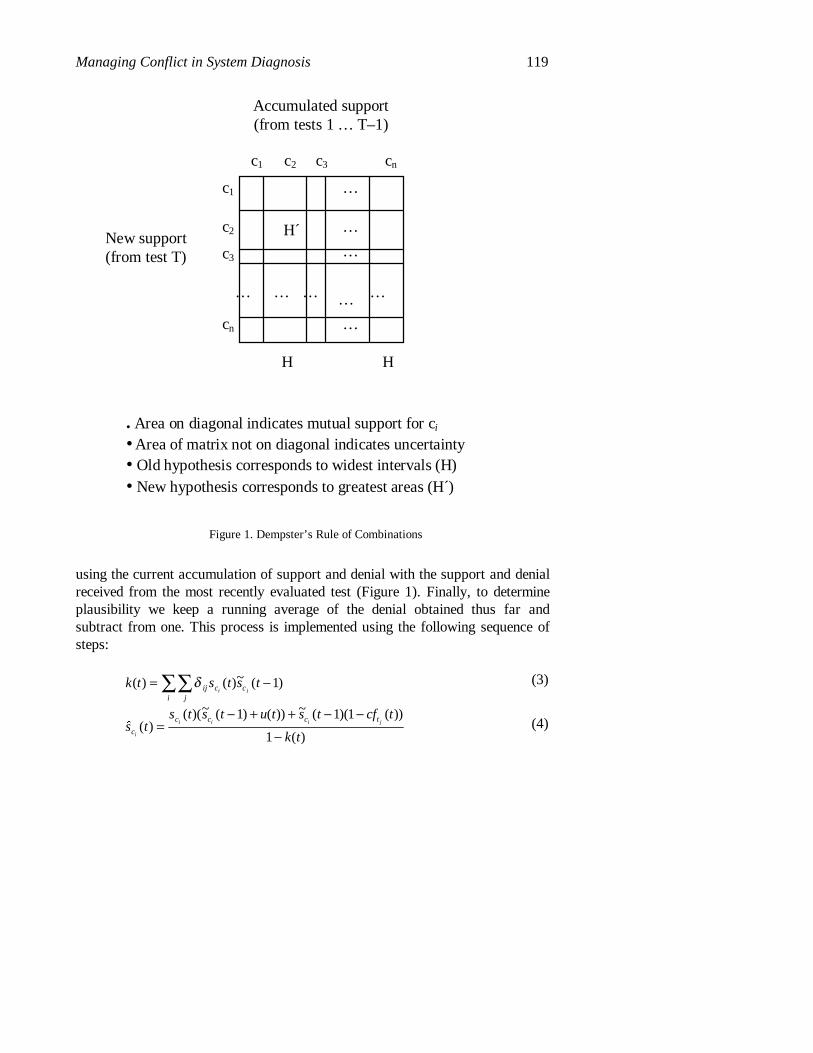
using the current accumulation of support and denial with the support and denialreceived from the most recently evaluated test (Figure 1). Finally, to determineplausibility we keep a running average of the denial obtained thus far andsubtract from one. This process is implemented using the following sequence ofsteps:
k t s t s tij c cji
i j( ) ( )~ ( )= −∑∑ δ 1 (3)
� ( )( )(~ ( ) ( )) ~ ( )( ( ))
( )s t
s t s t u t s t cf t
k tc
c c c t
i
i i i j=− + + − −
−
1 1 1
1(4)
…
…
…
…
… … … ……
c1 c2 c3 cn
c1
c2
c3
cn
Accumulated support(from tests 1 … T–1)
New support(from test T)
H´
HH
• Area on diagonal indicates mutual support for ci
• Area of matrix not on diagonal indicates uncertainty• Old hypothesis corresponds to widest intervals (H)• New hypothesis corresponds to greatest areas (H´)
Figure 1. Dempster’s Rule of Combinations
120 Chapter 6
u t u tcf t
k t
tj( ) ( )( )
( )= −
−
−1
1
1(5)
~( )
~( ) ( )d t d t d tc c ci i i
= − +1 (6)
p td t
tc
c
i
i( )
~( )
= −1 (7)
where,
δ ij
i j
i j=
=≠
⎧⎨⎩
0
1
;
;. (8)
A modification to the Dempster-Shafer process includes defining theunanticipated result (Simpson & Sheppard, 1994). This special conclusion helpsto compensate for declining uncertainty in the face of conflict. The support for anunanticipated result (representing conflict) is computed whenever evidence deniesthe current hypothesis. For this to occur, the evidence must deny all of theconclusions in the hypothesis set H ∈ C+ (a non-empty set of conclusions). Theamount of conflict is apportioned over the number of tests executed so far, so
~ ( ) ~ ( )( ) ( ) ( )
s t s tt k t cf t
tu u
tj= − +1χ
(9)
where χ is the number of times a conflict has occurred. When no conflict exists,support for the unanticipated result decays according to
~ ( ) ~ ( )s t s tt
tu u= − −1
1 . (10)
Now we are ready to compute the final support measure. First note thatequation 7 computes plausibility as a function of normalized denial. Since we areinterested in maintaining information on raw denial and rederiving plausibility, wehave nothing to be concerned about with the plausibility calculation. However, sofar there has been no equivalent normalization operation for support. At eachstep, support is normalized as follows.
~ ( )� ( )( ~ ( ))
( ) � ( )s t
s t s t
u t s tc
c u
cc
i
i=−
+∀ ∈∑
1
C
. (11)
Managing Conflict in System Diagnosis 121
The primary computational burden of this procedure lies in determiningthe normalization constant of Dempster’s rule. This normalizer requires asummation over all pairwise combinations of support values. It has acomplexity of O(n2), where n is the number of conclusions. The calculations forcombining support and denial and for computing conflict are relatively simple,being of complexity O(1), and the final calculation for normalizing support isO(n). Thus, the overall computational complexity of this process is O(n2) ineach step.
6. DIAGNOSIS AND CONFLICT MANAGEMENT WITHCERTAINTY FACTORS
Because of this strong dependence of the support value on previouslynormalized data, the Dempster-Shafer calculations exhibit a temporal-recencyeffect. In other words, more recent events have a greater impact on the evidentialcalculation than more distant events. The significance of this is that the evidentialstatistics are not temporally independent. As a result, if the same set of tests areanalyzed with the same outcomes and the same confidences but in differentorders, the resulting Dempster-Shafer statistics will be different.
Because of this undesirable property, we began to explore alternativeapproaches to reasoning under uncertainty in which we could base our inferenceson the information flow model, assign confidences to test outcomes, and performconsistent inference independent of any temporal ordering. As a guide, we beganby listing several characteristics we felt were reasonable for any uncertainty-based inference system. These characteristics included the following:
• We should be able to track levels of support and denial for eachconclusion in the model.
• We should be able to convert these support and denial measures to anestimate of probability given the evidence, i.e., Pr(ci|e) that is bothreasonable and intuitive.
• We should be able to apply test results in any order and yield thesame result.
• We should be able to evaluate levels of conflict in the inferenceprocess, and all measures associated with conflict should have thesame properties of any other conclusion in the model.
122 Chapter 6
From these “requirements,” we started to derive a simplified approach toreasoning with uncertain test data and discovered that we had re-derived arelatively old method called certainty factors. Certainty factors were first used byEdward Shortliffe in his MYCIN system, developed in the early 1970s andprovided an intuitive approach to reasoning under uncertainty in rule-basedsystems that had several roots in probability theory (Shortliffe, 1976). As westarted to work with certainty factors, we found they satisfied all of ourrequirements except for the handling of conflict. The following describes ourimplementation of certainty factors for the information flow model, including thecreation of a conflict-management strategy that satisfies the above requirements.
As with Dempster-Shafer, we begin by noting that test outcomes eithersupport or deny conclusions in our conclusion space. The first variation onDempster-Shafer, is that we assign the full confidence value to all conclusionseither supported or denied rather than apportioning confidence to the supportedconclusions. Using the notation developed above for Dempster-Shafer, we have,
s cfc ti j= (12)
d cfc ti j= (13)
Obviously, as before, support is only applied to a conclusion if the test outcomeactually supports that conclusion, and denial is only applied if the test outcomeactually denies the conclusion.
Updating support and denial over time is straightforward and hassimilarities to combining probabilities. In particular, we can update support anddenial as follows:
~ ( ) ~ ( ) ( ) ~ ( ) ( )s t s t s t s t s tc c c c ci i i i i= − + − −1 1 (14)
~( )
~( ) ( )
~( ) ( )d t d t d t d t d tc c c c ci i i i i
= − + − −1 1 (15)
According to Shortliffe, the certainty in a conclusion is given by
cert t s t d tc c ci i i( ) ~ ( )
~( )= − . (16)
This is not quite enough for us since certci∈ −[ , ]11 . First we need to rescale the
value such that certci′ ∈[ , ]0 1 . We accomplish this as follows:
Managing Conflict in System Diagnosis 123
cert certc ci i′ = +1
2 1( ) . (17)
Then we compute the probability as
Pr( | )
( )
c ecert
certic
cc unt
i=′
∀ ∈ ∪∑C
. (18)
Note this equation includes unt, i.e., the unanticipated result. Recall thatall test outcomes support some conclusions and deny other conclusions. Prior todoing any diagnosis, we can determine the support sets for each of the tests.Determining the denial set is done by taking the complement of the support setwhich adds no new information to our calculation. Further, the impact of denial isbased on a single failure assumption which makes determining conflict based ondenial questionable.
For any given test, we can determine the test’s support set when the testpasses and when the test fails. We want to compare these support sets to thesupport sets of other tests. In particular, for a sequence of tests, we are interestedin determining the relative conflict between all pairs of tests in that sequence.Support and denial for conflict then consist of combining support and denial ateach step in the sequence using the combination procedures described byEquations 14 and 15. All we need now is a way to determine su and du (Sheppard,1996).
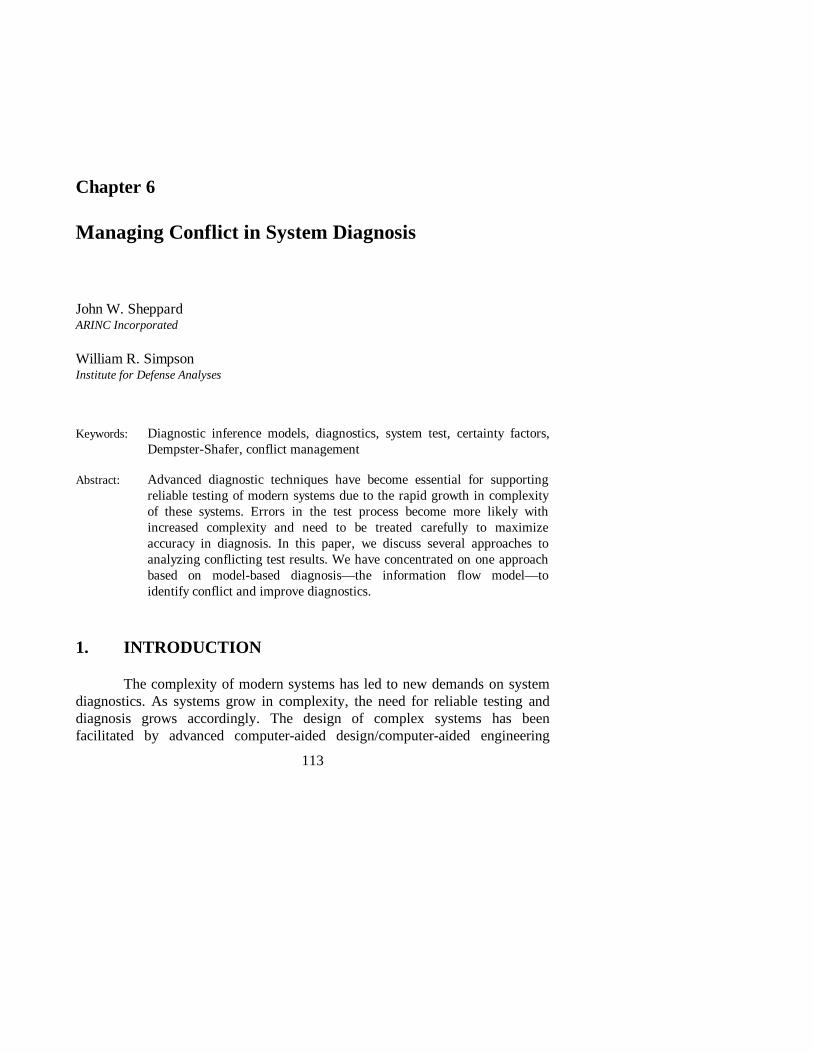
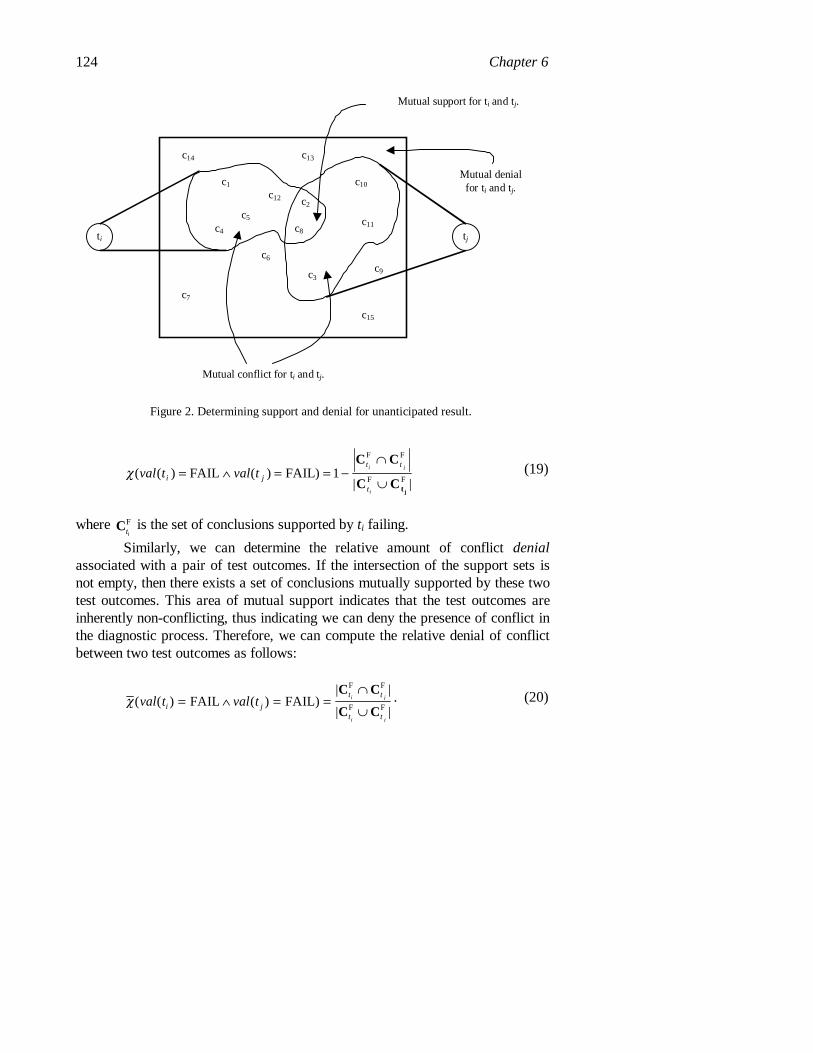
Consider two tests ti and tj. These two tests may conflict in any of fourpossible situations–when both tests pass, when both tests fail, when ti passes andtj fails, and when ti fails and tj passes. Without loss of generality, suppose bothtests fail. If we consider the intersection of the tests’ support sets given they fail,we claim that if the intersection is the empty set, these two outcomes areinherently conflicting, i.e., they support completely different sets of conclusionsand, in fact, deny each other’s sets of conclusions (Figure 2). In this scenario, wecan determine the relative amount of conflict as follows:
124 Chapter 6
χ( ( ) ( )| |
val t val ti j
t t
t
i j
i
= ∧ = = −∩
∪FAIL FAIL)
F F
F F1
C C
C Ctj
(19)
where CtiF is the set of conclusions supported by ti failing.
Similarly, we can determine the relative amount of conflict denialassociated with a pair of test outcomes. If the intersection of the support sets isnot empty, then there exists a set of conclusions mutually supported by these twotest outcomes. This area of mutual support indicates that the test outcomes areinherently non-conflicting, thus indicating we can deny the presence of conflict inthe diagnostic process. Therefore, we can compute the relative denial of conflictbetween two test outcomes as follows:
χ( ( ) ( )| |
| |val t val ti j
t t
t t
i j
i j
= ∧ = =∩
∪FAIL FAIL)
F F
F F
C C
C C. (20)
c1
c2
c3
c4
c5
c6
c7
c8
c9
c10
c11
c12
c13c14
c15
ti tj
Mutual support for ti and tj.
Mutual denialfor ti and tj.
Mutual conflict for ti and tj.
Figure 2. Determining support and denial for unanticipated result.
Managing Conflict in System Diagnosis 125
Individual values for su or du depend on the confidence in the test outcomes andcan be computed as
s val t val t cf cf val t val tu i j t t i ji j( ( ) ( )) ( ( ) ( ))∧ = ∧χ (21)
d val t val t cf cf val t val tu i j t t i ji j( ( ) ( )) ( ( ) ( ))∧ = ∧χ (22)
As tests are evaluated, we accumulate support or denial for theunanticipated result in a similar fashion to equations 14 and 15 except that asingle test outcome can cause several new “events” to be added. Formally, weperform the accumulation as follows:
~ ( ) ( ( ) ( )) ~ ( )s s val t val t sui
u i uτ ττ
τ= ⊕ ∧⎛⎝⎜
⎞⎠⎟ ⊕ −
=
−
1
1
1 (23)
~( ) ( ( ) ( ))
~( )d d val t val t du
iu i uτ τ
τ
τ= ⊕ ∧⎛⎝⎜
⎞⎠⎟ ⊕ −
=
−
1
1
1 (24)
where ⊕ denotes combination as defined in equations 14 and 15. Thus, we haveto combine conflict at each step by considering all past steps in the test process.This is the most computationally expensive part of the certainty factor approach:It requires O(T2) time, where T is the number of tests performed. Thecomplexity of computing relative conflict is O(m2) for each of the fouralternatives, where m is the number of tests in the model; however, this processneed be performed only once for each model.
The primary advantages to using certainty factors rather than Dempster-Shafer include reduced computational complexity and sequence independence indetermining support and denial for each of the conclusions. Dempster-Shafer’sprimary advantage is a firmer grounding in probability theory and a larger baseof practical experience demonstrating acceptable behavior.
7. INTERPRETING CONFLICT
The previous sections provided algorithms for system diagnosis in thepresence of uncertainty and conflict. As we discussed in the introduction, drawingconclusions from uncertain, but consistent test information is relativelystraightforward. In this section, we will focus on the problem of interpretingconflicting test results. We begin by pointing out some basic assumptions formaking a diagnosis in which conflict might arise.
126 Chapter 6
First, we will limit our discussion to interpreting test results that eitherpass or fail. Note that this is not really a limiting assumption since all tests can bereduced to a set of binary outcome tests. Further, the algorithms we providedearlier will work with multiple-outcome tests as well as binary tests. Second, weassume that the diagnostic system is focusing on identifying a single fault. Thisassumption will appear, initially, to be very restrictive; however, we will see thatthis assumption will be useful for interpreting conflict as an indicator of amultiple fault which, in turn, facilitates multiple fault diagnosis. Normalassumptions in papers on system diagnosis include that the model is correct andthe test results (or at least their confidences) are correct. Since test error andmodel error are prime causes of conflict, we will not make these assumptions.
We believe that only three fundamental reasons exist that might lead toconflict.
1. An error occurred in testing or test recording2. Multiple faults exist in the system.3. An error exists in the knowledgebase or model
By providing a separate conclusion in the model for conflicting information, weprovide a powerful mechanism for identifying if one of three situations exists. Wepoint out, however, that independent analysis may be required to distinguish thesepotential sources of conflict in any particular instance. The following paragraphsdescribe approaches that have been used in actual diagnosis to identify causes ofconflict.
7.1 Identifying Errors in Testing
In real systems, testing is rarely perfect. In software, it is almostimpossible to keep track of system state or to track all of the ways values mightbe affected. Hardware systems are frequently subject to noise and other randomevents making interpretation of test results difficult, thus lowering confidence inwhat the tests are indicating. Digital testing that may not be as susceptible tonoise problems still must contend with the effects of state. Finally, modernsystems heavily depend on both hardware and software, and the interactionsbetween hardware and software further compound the problem of managing testerror.
A common approach to minimizing the probability of error in testing is toapply automatic test methods to the system. The thought is that automatic testing
Managing Conflict in System Diagnosis 127
takes much of the uncertainty out of testing since the same test is applied everytime, and a machine performs and evaluates the results of the test. Unfortunately,automatic testing, while eliminating many sources of error, introduce many moresources. Software must be written to run on the tester, and that software mustalso be tested. Until recently, much of the test software has been written fromscratch with every new system to be tested leading to a high development cost anda high likelihood of repeatedly making the same mistakes in writing the tests.Finally, instrumentation used to apply test stimuli (or inputs) and interpret theresponse (or outputs) have physical limitations that can introduce error as well(Dill, 1995).
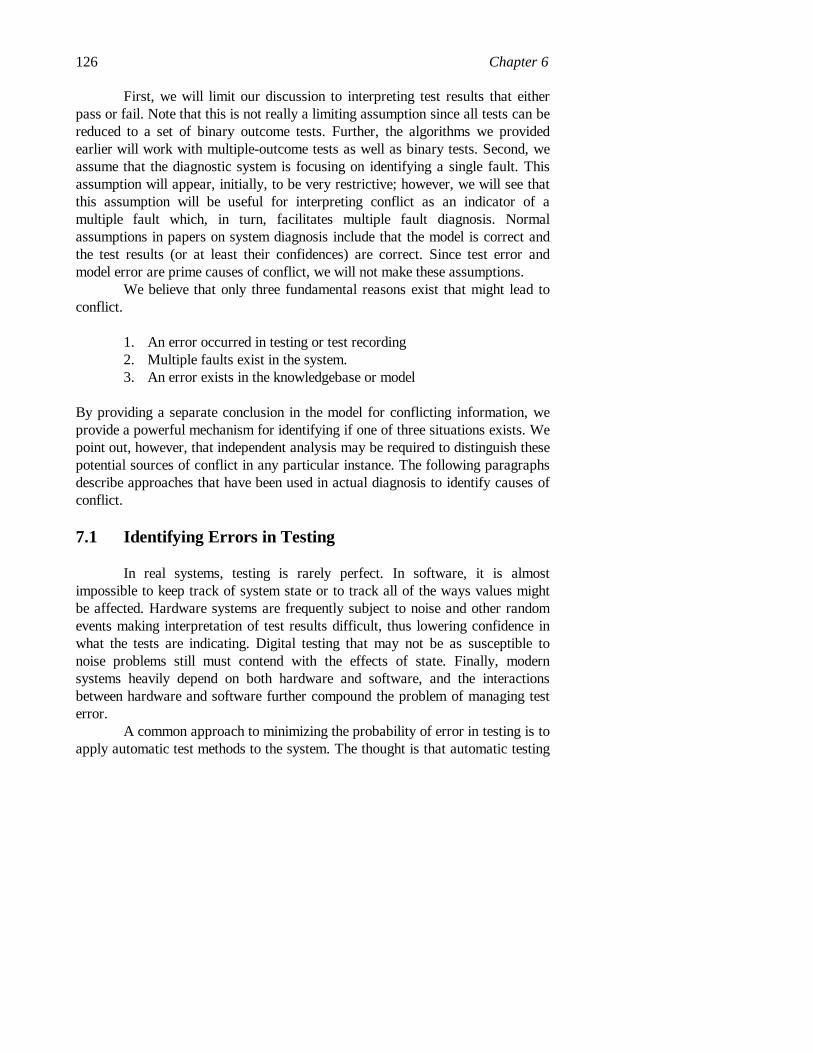
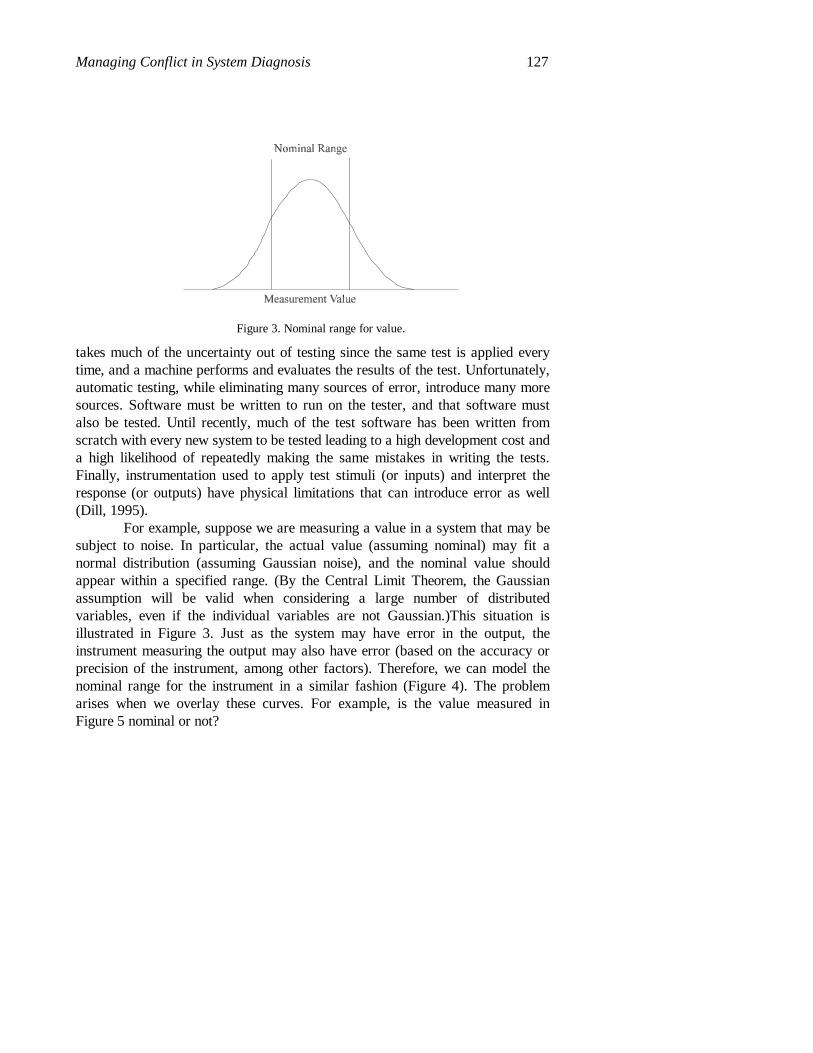
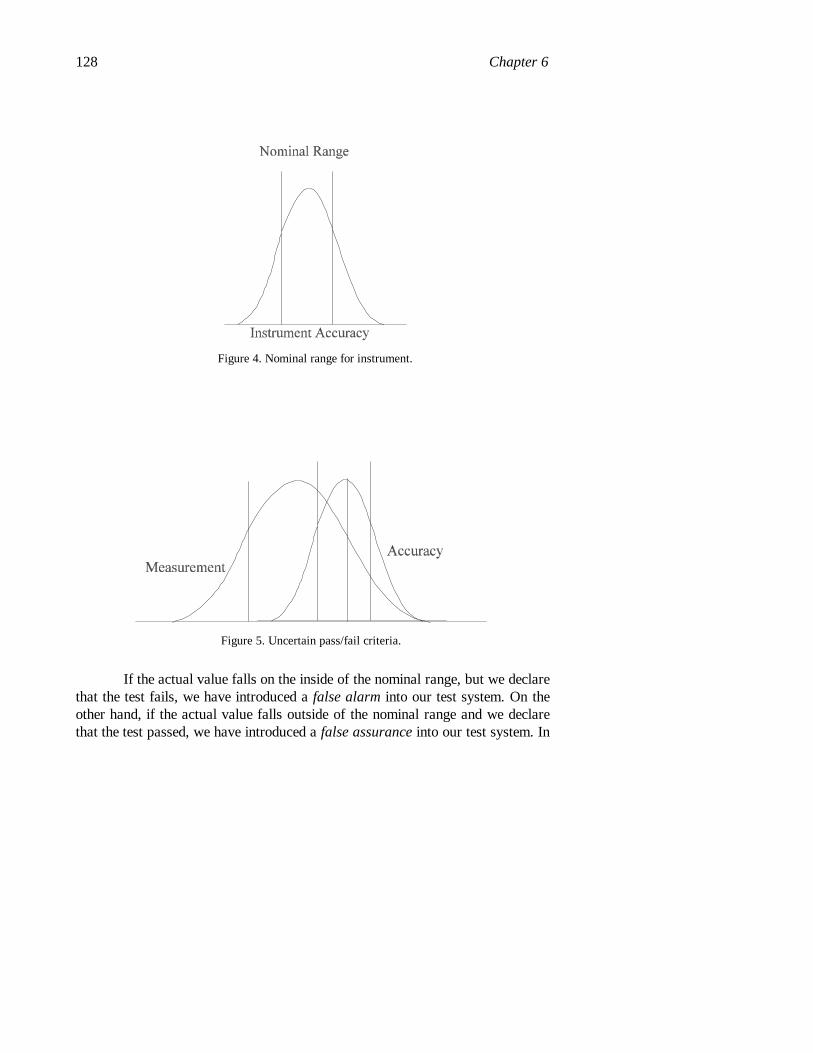
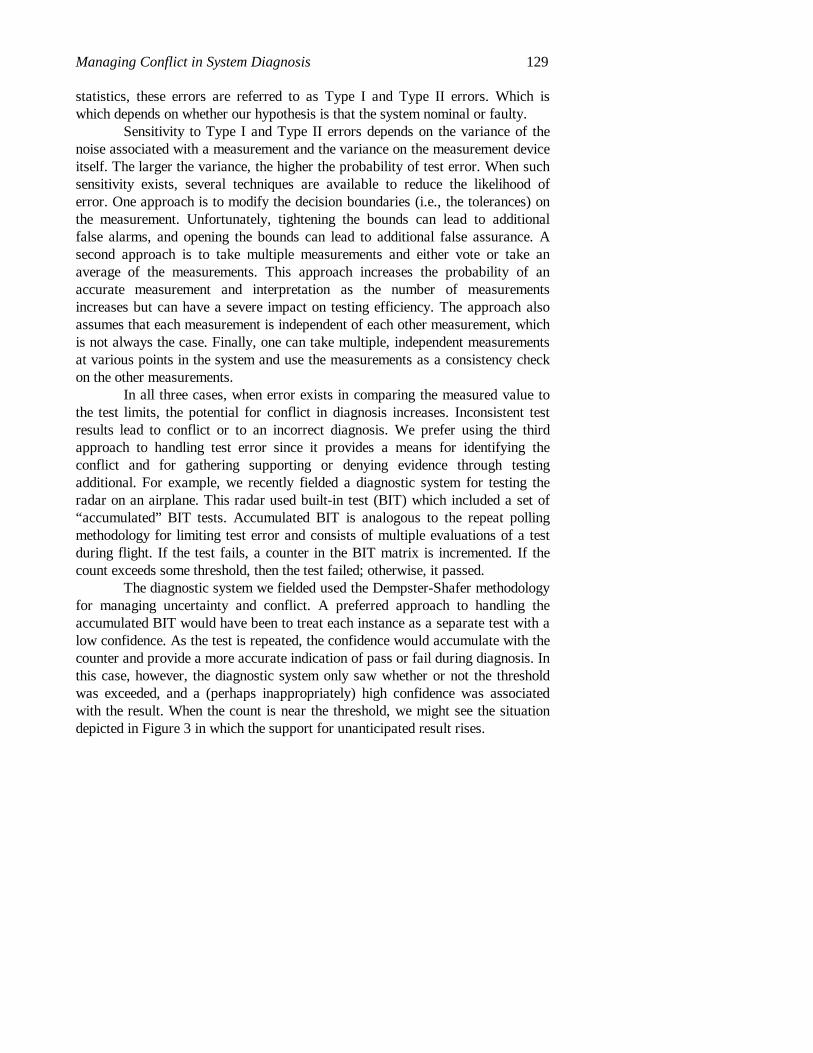
For example, suppose we are measuring a value in a system that may besubject to noise. In particular, the actual value (assuming nominal) may fit anormal distribution (assuming Gaussian noise), and the nominal value shouldappear within a specified range. (By the Central Limit Theorem, the Gaussianassumption will be valid when considering a large number of distributedvariables, even if the individual variables are not Gaussian.)This situation isillustrated in Figure 3. Just as the system may have error in the output, theinstrument measuring the output may also have error (based on the accuracy orprecision of the instrument, among other factors). Therefore, we can model thenominal range for the instrument in a similar fashion (Figure 4). The problemarises when we overlay these curves. For example, is the value measured inFigure 5 nominal or not?
Figure 3. Nominal range for value.
128 Chapter 6
If the actual value falls on the inside of the nominal range, but we declarethat the test fails, we have introduced a false alarm into our test system. On theother hand, if the actual value falls outside of the nominal range and we declarethat the test passed, we have introduced a false assurance into our test system. In
Figure 4. Nominal range for instrument.
Figure 5. Uncertain pass/fail criteria.
Managing Conflict in System Diagnosis 129
statistics, these errors are referred to as Type I and Type II errors. Which iswhich depends on whether our hypothesis is that the system nominal or faulty.
Sensitivity to Type I and Type II errors depends on the variance of thenoise associated with a measurement and the variance on the measurement deviceitself. The larger the variance, the higher the probability of test error. When suchsensitivity exists, several techniques are available to reduce the likelihood oferror. One approach is to modify the decision boundaries (i.e., the tolerances) onthe measurement. Unfortunately, tightening the bounds can lead to additionalfalse alarms, and opening the bounds can lead to additional false assurance. Asecond approach is to take multiple measurements and either vote or take anaverage of the measurements. This approach increases the probability of anaccurate measurement and interpretation as the number of measurementsincreases but can have a severe impact on testing efficiency. The approach alsoassumes that each measurement is independent of each other measurement, whichis not always the case. Finally, one can take multiple, independent measurementsat various points in the system and use the measurements as a consistency checkon the other measurements.
In all three cases, when error exists in comparing the measured value tothe test limits, the potential for conflict in diagnosis increases. Inconsistent testresults lead to conflict or to an incorrect diagnosis. We prefer using the thirdapproach to handling test error since it provides a means for identifying theconflict and for gathering supporting or denying evidence through testingadditional. For example, we recently fielded a diagnostic system for testing theradar on an airplane. This radar used built-in test (BIT) which included a set of“accumulated” BIT tests. Accumulated BIT is analogous to the repeat pollingmethodology for limiting test error and consists of multiple evaluations of a testduring flight. If the test fails, a counter in the BIT matrix is incremented. If thecount exceeds some threshold, then the test failed; otherwise, it passed.
The diagnostic system we fielded used the Dempster-Shafer methodologyfor managing uncertainty and conflict. A preferred approach to handling theaccumulated BIT would have been to treat each instance as a separate test with alow confidence. As the test is repeated, the confidence would accumulate with thecounter and provide a more accurate indication of pass or fail during diagnosis. Inthis case, however, the diagnostic system only saw whether or not the thresholdwas exceeded, and a (perhaps inappropriately) high confidence was associatedwith the result. When the count is near the threshold, we might see the situationdepicted in Figure 3 in which the support for unanticipated result rises.
130 Chapter 6
As indicated earlier, determining the cause of conflict frequently requirespost mortem analysis of the test results to determine the cause. In the absence ofadditional information, it is almost impossible to determine if the source ofconflict was test error. In the case described above, test error becomes likelywhen considering the nature of the test itself. Since a “hard” threshold is appliedto the test interpretation rather than applying either a “fuzzy” threshold or aconfidence based on proximity to the threshold, the chances of not detecting afault or reacting to false alarms increases. Knowledge of the nature of the test andthe way the test results are fed to the diagnostic system facilitate this analysis.
7.2 Identifying Multiple Faults
The next step in managing conflict involves identifying the possibility ofmultiple faults being present in the system being tested. Multiple fault diagnosisis highly complex (deKleer, 1987; Sheppard & Simpson, 1994; Shakeri et al.,1995). While many diagnostic systems exist that claim to diagnose multiplefaults, and indeed it is possible to estimate most likely optimal faults fairlyefficiently, the ability to correctly identify a multiple fault every time in areasonable period of time is virtually impossible.
We use the conflict conclusion (i.e., unanticipated result) as anindication that a multiple fault may be present. If diagnosis leads to a single faultconclusion with no conflict, the probability is high that the single fault identifiedis correct (ignoring the problem of masked root cause faults and false failureindications). Therefore, if testing yields inconsistent results, one possible highprobability cause is the presence of multiple faults.
Typically, multiple faults are identified and addressed in single faultsystems using a sequential approach to diagnosis and repair (Shakeri et al.,1995). In particular, first a single fault is identified and repaired. After the fault isremoved from the system, the system undergoes additional testing to determine ifanother fault exists in the system. If so, it is identified and repaired as before.This process continues until all faults are identified and repaired.
This approach will work (albeit inefficiently) for all multiple faults in thesystem, with the exception of two. The first multiple fault situation in which“peeling” does not adequately identify and repair the system is when the rootcause of system failure is masked by another, secondary fault caused by that rootcause. When the root cause fault is masked by the secondary fault, both singlefault isolation and any multiple fault isolation will identify only the secondaryfault. This is a direct result of the masking effect. This in turn leads to ineffective
Managing Conflict in System Diagnosis 131
repair since repairing the secondary fault is futile. The secondary fault recurswhen the system is reinitialized because of the root cause fault.
The second multiple fault situation in which “peeling” does notadequately identify and repair the system is when a false failure indicationoccurs. A false failure indication occurs when the symptoms of two or morefaults are identical to another single fault. Once again, this leads to ineffectiverepair of the system since repairing the indicated single fault has no effect and thesystem is not restored to operational status. In other words, diagnosis will nothave identified the faulty components, and maintenance leaves the system in theoriginal failed state. Multiple failure diagnosis does not eliminate the problem,but the situation is improved. In particular, we find that with multiple failurediagnosis, we will be able to identify both the single fault that would be falselyindicated under single fault diagnosis, and the multiple fault. Unfortunately, weare unable to tell the difference between the two, and the two conclusions areconsidered to be ambiguous.
Generally, root cause situations can be identified through engineeringanalysis prior to fielding a diagnostic system, and common false failureindications can be tied to root cause situations. Therefore, it is still possible forsingle fault diagnosis, tied to good repair procedures, to address these problems.But what happens if multiple, independent faults exist in the system and we donot have the luxury of the time required to use the peeling strategy? Alternatively,what if certain faults simply cannot be removed from the system (e.g., a fault on asatellite in orbit)?
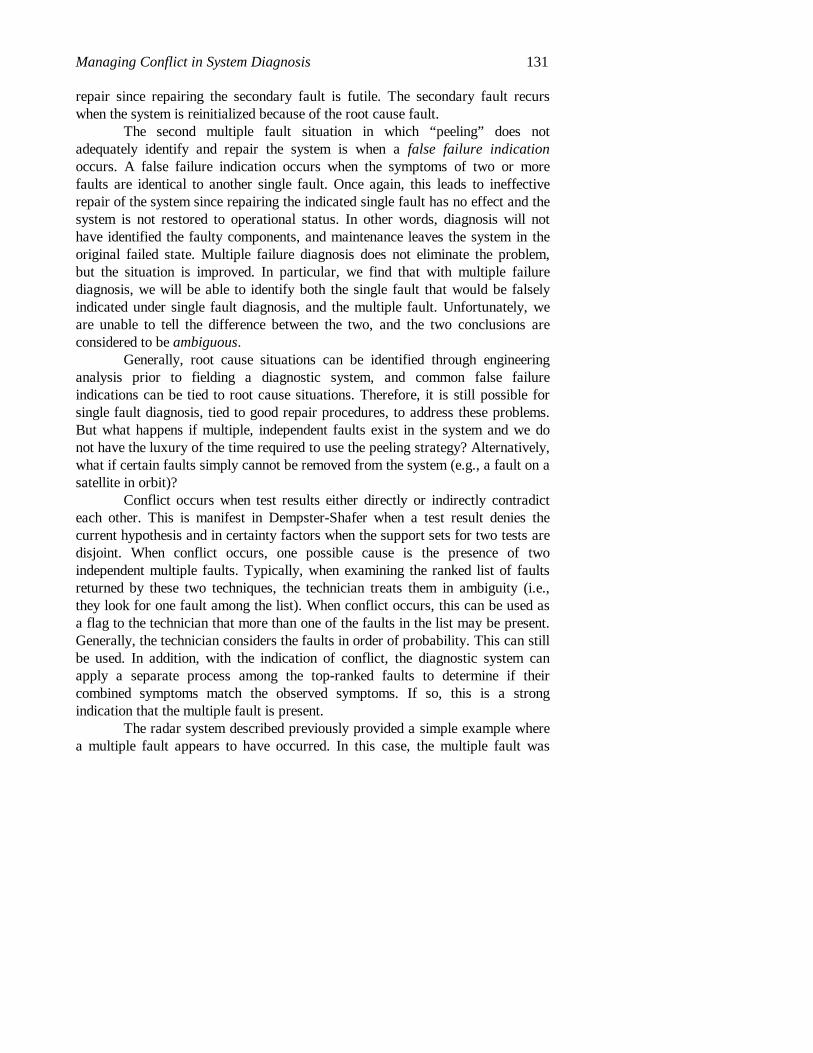
Conflict occurs when test results either directly or indirectly contradicteach other. This is manifest in Dempster-Shafer when a test result denies thecurrent hypothesis and in certainty factors when the support sets for two tests aredisjoint. When conflict occurs, one possible cause is the presence of twoindependent multiple faults. Typically, when examining the ranked list of faultsreturned by these two techniques, the technician treats them in ambiguity (i.e.,they look for one fault among the list). When conflict occurs, this can be used asa flag to the technician that more than one of the faults in the list may be present.Generally, the technician considers the faults in order of probability. This can stillbe used. In addition, with the indication of conflict, the diagnostic system canapply a separate process among the top-ranked faults to determine if theircombined symptoms match the observed symptoms. If so, this is a strongindication that the multiple fault is present.
The radar system described previously provided a simple example wherea multiple fault appears to have occurred. In this case, the multiple fault was
132 Chapter 6
benign in that both faults were contained within the same replaceable unit, and themaintenance personnel were only interested in fault isolating to the replaceableunit. Personnel at the next level of maintenance would have a problem when theyattempted to repair further.
In this case, the problem was the presence of two antenna faults. Twoindependent BIT codes were obtained directly indicting two separate failuremodes of the antenna. The diagnostic system noted the conflict and called for aseparate “initiated” BIT (IBIT) to be run. The result was identification of theantenna with both faults identified and equally supported in the fault candidatelist.
7.3 Identifying Modeling Errors
Modeling systems for diagnosis frequently entails capturing knowledgesimilar to traditional knowledge engineering tasks in expert system development.One common complaint with expert systems is that they are brittle, that is theyare frequently incapable of handling situations in which the information obtainedis inconsistent with the knowledge base. The availability of a special conclusionrepresenting the presence of such an inconsistency, and the ability to furtherprocess the model in light of the inconsistency provides tremendous power inovercoming the brittleness of the traditional expert system.
If the test results are understood and no multiple faults exist in thesystem, then conflict may be caused by error in the model. The process ofdiagnostic modeling is extremely difficult and error prone. Identifying errors inthe model is equally difficult. So far, the best approaches found for modelverification have been based on analyzing logic characteristics of the models andperforming fault insertion in the diagnostic strategies. Fault insertion is generallythe most effective approach but can be time consuming and damaging to actualsystems. Using fault insertion together with fault simulation eliminates theproblem of potentially damaging the system; however, the verification problemnow includes verifying that the simulation model is correct. Otherwise, the onlyassurance gained from fault insertion in the simulation model is that thediagnostic model represents the simulation, not the actual system.
One of the advantages to modeling systems with the information flowmodel is that logical characteristics of the model can be extremely useful inverifying the model. Identifying ambiguity groups, redundant and excess tests,logical circularities, masked and masking faults, and potential false failure
Managing Conflict in System Diagnosis 133
indications can all indicate potential problems with the model. Details on usingthese characteristics in verification are provided in Simpson & Sheppard (1994).
Even with the best verification tools and techniques, errors invariablyremain (especially in complex models). During actual testing, it is frequentlydifficult to identify when model errors arise. However, with the unanticipatedresult included in the set of possible conclusions, a “flag” can be raised whenevera model error might have been encountered. As with test error and multiple faultdiagnosis, if the model is error, it is likely at some point for a test result to becontrary to what is expected—in which case a conflict occurs and theunanticipated result gains support.
In the case of the radar system, we were able to find model errors sincetwo types of models were available for comparison—a system-level model andmultiple replaceable unit-level models. (While the two types of models were notderived independently, they offer alternative representations of the system.) Whentest results were processed through the model representing the transmitter, noconflict was encountered and a large ambiguity group consisting of wiring, thetransmitter itself, and the computer power supply. When the same test resultswere run through the system-level model (the model of choice in the field since thereplaceable unit did not need to be known prior to testing, the same ambiguitygroup was concluded as the most likely fault, but considerable conflict wasencountered during testing. No conflict was encountered in the replaceable unitmodel.
When we noticed this discrepancy, we looked at the diagnostic log filesfor the two runs. In the case of the replaceable unit-level model, only one testwere considered, and that test pointed directly at the fault in question. At thesystem level, seven tests were considered (including the one from the replaceableunit level). Four of these tests did not appear in the replaceable-unit level model.Six tests, included these four, depended on the common test in system-level modeland all passed where the common test failed. Since each of these tests dependedon the common test, when the common test failed, each of these additional testsshould have failed as well. Since they did not, they were in conflict with previousexperience.
This discrepancy led us to take a closer look at the tests in question. Oneof the conflicting tests that appeared in both models served as a “collector” of testinformation in the BIT. In other words, all test information was funneled throughthat test such that if any other test failed, that test was expected to fail as well.But this test had another odd characteristic. Whenever certain of these other testsfailed, this test was disabled and not run. The diagnostic system assumed that a
134 Chapter 6
test that was not run would have passed (a bad assumption) and this led to theconflict. The failing test determined whether the transmitter was transmitting byexamining the least significant bit in a data word sent in a loopback test.
The more appropriate representation of this situation in the model wouldhave used what is referred to as a “linked test outcome.” Information flow modelsassume “like” inferences. In other words, if a test fails, it is assumed testinferences drawn from that test will consist only of failing and if the test passes,test inferences drawn from that test will consist only of passing. But this is not arealistic assumption, so the information flow model permits declaration of specialinference linkages—linked test outcomes—in which a passing test can result inother tests being inferred fail or unavailable and a failing test can result in othertests being inferred pass or unavailable. The skipped test in the radar transmittermodel should have been linked to the each of the tests that would have caused itto be skipped such that failure of those tests would cause an inference of theskipped test being unavailable. This was not used in the model resulting in anerror. In fact, it was found that a “hard” dependency existed between the collectortest (the skipped test) and the communications test in the system model and nodependency existed at all in the replaceable unit-level test. Both models were inerror but for different reasons.
8. SUMMARY
The process of diagnostic modeling and diagnostic testing is complex andoften leads to conflicting information. Traditional tree-based approaches maymiss apparent conflicts and provide reduced diagnostic accuracy. Whetherinterpreting uncertain test results, handling multiple faults, or contending withmodeling error, the diagnostics used should support gathering informationcapable of identifying conflict and assessing the cause of the conflict. Wepresented two approaches for identifying conflict within the framework of theinformation flow model and provided several examples of how one can use theidentification of conflict to improve the diagnostics of the system.
Uncertain and inexact testing can lead to conflict in diagnosis in that theoutcome of the test as measured may not accurately reflect the system beingtested. This can occur when the error range of the test instrument compared to thetolerance of the expected test results overlap significantly. Identifying when thissituation exists involves a detailed understanding of the failure modes detected bythe test and the error range of the instrument relative to the test. The occurrence
Managing Conflict in System Diagnosis 135
of conflict in testing can indicate the need for closer examination of the testresults by identifying that unexpected test results have occurred.
In addition to the ability to raise the concern of problem tests, detectingand analyzing the presence of conflict can be useful in multiple fault diagnosiswhen the diagnostic procedure begins with the assumption of a single fault. Whenmultiple faults exist, test results can be consistent with one of the faults butinconsistent with the other. Since the process of multiple fault diagnosis iscomputationally complex, using the presence of conflict to flag the need forchecking for multiple faults is a reasonable and computationally efficientapproach to take.
Finally, since modeling and knowledge engineering is a complex anderror prone task, the diagnostics can be used to assist modeling by identifyingwhen inconsistent or illogical conditions arise. Such inconsistency is identified inthe diagnostics with the unanticipated result gaining support. If the certainty inthe test results is correctly represented and no multiple fault exists in the system,then an analyst can assume an inadequacy exists in the model. Test outcomes canresult in a wide range of possible inferences, and unexpected inferences can beidentified with conflict. By examining the tests evaluated and the conclusionsdrawn, an analyst can localize the potential cause of the conflict and identifypossible problems in the model.
To date, little discussion has occurred on the positive role of conflict insystem test and diagnosis. Conflict has always been regarded as something to beavoided. But conflict can provide valuable information about the tests, thediagnostics, and the system being tested. In this paper, we attempted to describean approach for capturing and quantifying the amount of conflict encountered intesting and to describe approaches to using the conflict to benefit the diagnosticprocess, thus leading to more robust overall system diagnostics.
9. ACKNOWLEDGMENTS
This paper describes the results of work that has been performed overseveral years, and the authors have received input and guidance from severalpeople to improve the techniques and the paper itself. We would like to thankBrian Kelley, John Agre, Tim McDermott, Jerry Graham, Don Gartner, andSteve Hutti for their comments as the algorithms were developed and the systemfielded.
136 Chapter 6
10. REFERENCES
Cantone, R. And P. Caserta. 1988. “Evaluating the Economical Impact of Expert System FaultDiagnosis Systems: The I-CAT Experience,” Proceedings of the 3rd IEEE InternationalSymposium on Intelligent Control, Los Alamitos, California: IEEE Computer Society Press.
Davis, R. 1984. “Diagnostic Reasoning Based on Structure and Behavior,” ArtificialIntelligence, 24:347–410.
deKleer, J. 1987. “Diagnosing Multiple Faults,” Artificial Intelligence, 28:163–196.Dempster, A. P. 1968. “A Generalization of Bayesian Inference,” Journal of the Royal Statistical
Society, Series B, pp. 205–247.Dill, H. 1994. “Diagnostic Inference Model Error Sources,” Proceedings of AUTOTESTCON,
New York: IEEE Press, pp. 391–397.Dretske, F. I. 1982. Knowledge and the Flow of Information, Cambridge, Massachusetts: The
MIT Press.Pearl, J. 1988. Probabilistic Reasoning in Intelligent Systems, San Mateo, California: Morgan
Kaufmann Publishers.Peng, Y. and J. Reggia. 1990. Abductive Inference Models for Diagnostic Problem Solving, New
York: Springer-Verlag.Pople, H. E. 1977. “The Formulation of Composite Hypotheses in Diagnostic Problem Solving:
An Exercise in Synthetic Reasoning,” Proceedings of the 5th International Conference onArtificial Intelligence, pp. 1030–1037.
Quinlan, J. R. 1986. “The Induction of Decision Trees,” Machine Learning, Vol. 1, pp. 81–106.Shafer, G. 1976. A Mathematical Theory of Evidence, Princeton, New Jersey: Princeton
University Press.Shakeri, M., K. R. Pattipati, V. Raghavan, A. Patterson-Hine, and T. Kell. 1995. “Sequential
Test Strategies for Multiple Fault Isolation,” Proceedings of AUTOTESTCON, New York:IEEE Press, pp. 512–527.
Shannon, C. E. 1948. “A Mathematical Theory of Communications,” Bell Systems TechnicalJournal, Vol. 27, pp. 379–423.
Sheppard, J. W. 1996. “Maintaining Diagnostic Truth with Information Flow Models,”Proceedings of AUTOTESTCON, New York: IEEE Press, to appear.
Sheppard, J. W. and W. R. Simpson, 1994. “Multiple Failure Diagnosis,” Proceedings ofAUTOTESTCON, New York: IEEE Press, pp. 381–389.
Shortliffe, E. H. 1976. Computer Based Medical Consultations: MYCIN, New York: AmericanElsevier.
Simpson, W. R. and J. W. Sheppard. 1994. System Test and Diagnosis, Norwell, Massachusetts:Kluwer Academic Publishers.
Wilmering, T. J. 1992. “AutoTEST: A Second-Generation Expert System Approach toTestability Analysis,” Proceedings of the ATE and Instrumentation Conference West, pp.141–152.