Embed Size (px)
Citation preview
CHAPTER 5
STUDY OF SUPERCONDUCTING
BEHAVIOR OF NbB2 COMPOSITES
106
5.1 SYNTHESIS AND CHARACTERIZATION OF BORON
EXCESS SAMPLES OF NIOBIUM DIBORIDE
5.1.1 INTRODUCTION
The discovery of high Tc,(Critical transition temperature) superconductivity in MgB2 [1]
has put an impetus in search for analogous behavior in similar systems. Although the
most similar candidates for such investigations seem to be the AlB2 type alkali, alkaline
or group III element diborides AB2 (A=Li, Na, Be, Al) but none of them is reported to
have superconductivity [2,3,4]. The group IVa Va & VIIa elements (Nb, Ta, Mo, Zr &
Hf) also form diborides isostructural to MgB2. These transition metal diborides are
studied theoretically by various groups [5-7] but the reports on experimental approach
towards the synthesis and characterization of diborides other than MgB2, are still scant.
Various controversial reports exist on the superconductivity and value of Tc for different
diborides. Hulm, Mathias and others [8,9] reported superconductivity in Boron deficient
alloys like NbB1.94, Cooper et al [10] found superconductivity in Nb- deficient
compositions, such as NbB2.5, but absence of superconductivity in stoichiometric NbB2.
Gasprov et al [11] and Kackzorowski et al [12] also reported no superconductivity in
NbB2. On the other hand, several reports exist on the presence of superconductivity in
NbB2 with different transition temperatures [13-17]. Specifically, Tc is found to vary
between 0.62 K and 9.2 K. This means that even the phase pure samples of NbB2 show
varying behavior. The clear analysis of existing literature highlights the point that the
samples are synthesized employing different synthesis methods in different reports. For
example, some groups synthesized NbB2 sample at high temperature and high pressure
conditions[18], some at high temperature with no pressure by solid state reaction route
and a few reports also exist where the sample is either synthesized by arc melting or by
some other mechano-chemical process [10, 19]. These different synthesis routes although
result in phase pure compound but the lattice parameters are different. In other words,
the synthesis conditions affect stress/strain in the unit cell and hence results in the
107
compressed/ stretched unit cell. The stretched lattice results in strong electron-phonon
interaction and hence helps in emergence of superconductivity. This was one of the
possible reasons behind the unique superconductivity of MgB2. Keeping this idea of
inducing strain in the lattice to get enhanced lattice parameters, the off stoichiometric
samples namely NbB2+x are synthesized. As expected, the excess of Boron in NbB2
samples results in the increase of lattice parameters. The role of stretched c parameter on
the superconductivity of NbB2 is described systematically.
5.1.2 EXPERIMENTAL
5.1.2.1 Synthesis of samples
The details of sample synthesis by solid state reaction route are mentioned in section 2.2
under Chapter 2 and both In-Situ and Ex-situ synthesis techniques are described in
section 1.3, Chapter 1. Briefly, the Polycrystalline bulk samples of NbB2+x (x = 0.0, 0.2,
0.4, 0.6, 0.8 & 1.0) were synthesized by Ex-situ solid-state reaction route. The
commercial NbB2 and Boron powders were taken as the precursor material. Both the
ingredients were taken in stoichiometric ratio according to the desired composition,
NbB2+x as [NbB2+x(B)]. The powders were grinded thoroughly for 2-3 h. The well
ground mixtures were palletized and encapsulated in iron tubes followed by sintering in a
tubular furnace at 1100oC in Argon flow for 20h. The ramp rate during heating was
maintained to be 10o/min. Then the samples were directly quenched to liquid nitrogen
temperature. Direct quenching to liquid nitrogen temperature or slow cooling does not
have much effect on phase purity of samples of NbB2.
5.1.2.2 Characterization of the samples
The characterizations of the samples were carried out by the following techniques:
5.1.2.2 .1 X-ray diffraction Studies
Details of X-ray diffraction technique are described in Chapter 2 under Section 2.3.1.1.
Briefly, the X-ray diffraction patterns of all the synthesized samples were recorded using
108
the synthesized samples in powder form and X-ray source consists of CuK radiation
(1.54Å). Rietveld analysis was done by Fullprof program so as to obtain lattice
parameters.
5.1.2.2 .2 Resistivity measurements
Temperature dependent resistivity measurements on NbB2+x samples were carried out
using four-probe technique and the probe was inserted in a container having Helium
liquid so as to achieve temperature as low as 4.2 K. Resistivity measurements were
carried out in the temperature range 4.2-300 K. Details of this technique are given under
Section 2.3.2.1 in Chapter 2.
5.1.2.2 .3 Magnetization Studies
Details of magnetic characterization of samples are given in Chapter 2 in section 2.3.2.2
and section 2.3.2.3. Briefly, Magnetization measurements on NbB2 sample were carried
out on a SQUID magnetometer (MPMS-XL).
5.1.3 RESULTS AND DISCUSSION
To understand the diversities of reported superconducting Tc, the structural phases of
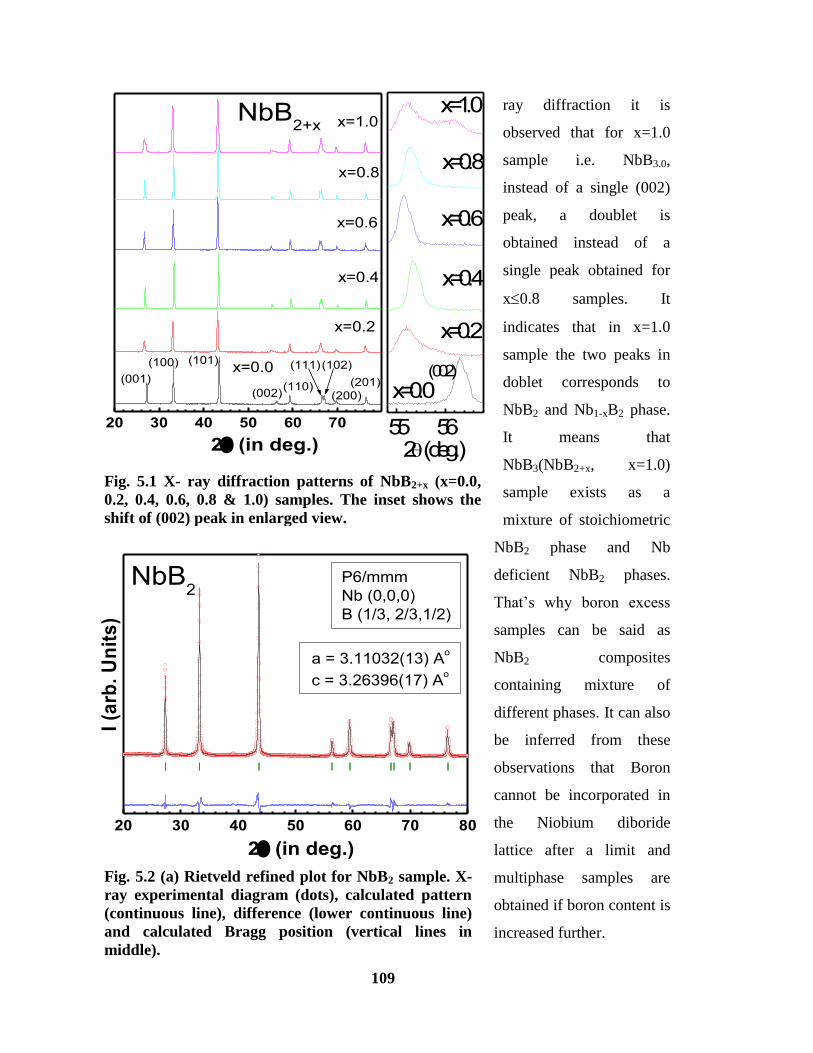
NbB2 with different Nb/B ratios are realized. X-ray diffraction patterns of NbB2+x (x=0.0,
0.2, 0.4, 0.6, 0.8 & 1.0) are shown in Fig. 5.1. All samples crystallize in P6/mmm,
hexagonal structure. The characteristic peaks for the pure NbB2 sample are indexed in
Fig. 5.1. No extra impurity peak is noticed in any sample. Systematic shift is observed in
(002) peak towards lower angle side with the increment in Boron content indicating the
increase in c parameter. The enlarged view is shown in the inset of Fig. 5.1. A single
(002) peak is obtained up to NbB2.8 i.e. for Nb0.71B2. Actually, the Boron plane is quite
rigid and doesn’t allow the extra Boron to be incorporated at interstitial site. Hence the
non-stoichiometry or Boron excess is is accommodated by metal deficiency. The extra
boron is incorporated into the niobium diboride phase creating metal vacancy in the
lattice as discussed in various theoretical studies [20, 21]. That’s why NbB2+x samples
can be regarded as Nb1-xB2 samples and hence NbB2.8 corresponds to Nb0.71B2. From X-
109
ray diffraction it is
observed that for x=1.0
sample i.e. NbB3.0,
instead of a single (002)
peak, a doublet is
obtained instead of a
single peak obtained for
x0.8 samples. It
indicates that in x=1.0
sample the two peaks in
doblet corresponds to
NbB2 and Nb1-xB2 phase.
It means that
NbB3(NbB2+x, x=1.0)
sample exists as a
mixture of stoichiometric
NbB2 phase and Nb
deficient NbB2 phases.
That’s why boron excess
samples can be said as
NbB2 composites
containing mixture of
different phases. It can also
be inferred from these
observations that Boron
cannot be incorporated in
the Niobium diboride
lattice after a limit and
multiphase samples are
obtained if boron content is
increased further.
Fig. 5.1 X- ray diffraction patterns of NbB2+x (x=0.0,
0.2, 0.4, 0.6, 0.8 & 1.0) samples. The inset shows the
shift of (002) peak in enlarged view.
20 30 40 50 60 70 55 56
(002)
x=1.0
x=0.8
x=0.6
x=0.4
x=0.2
x=0.0
2 (deg.)
NbB2+x
(111)
(201)
(200)
(102)
(110)(002)
(101)(100)
(001)
x=1.0
x=0.8
x=0.6
x=0.4
x=0.2
x=0.0
2 (in deg.)
20 30 40 50 60 70 80
NbB2
I (a
rb.
Un
its
)
P6/mmm
Nb (0,0,0)
B (1/3, 2/3,1/2)
a = 3.11032(13) Ao
c = 3.26396(17) Ao
2 (in deg.)
Fig. 5.2 (a) Rietveld refined plot for NbB2 sample. X-
ray experimental diagram (dots), calculated pattern
(continuous line), difference (lower continuous line)
and calculated Bragg position (vertical lines in
middle).
110
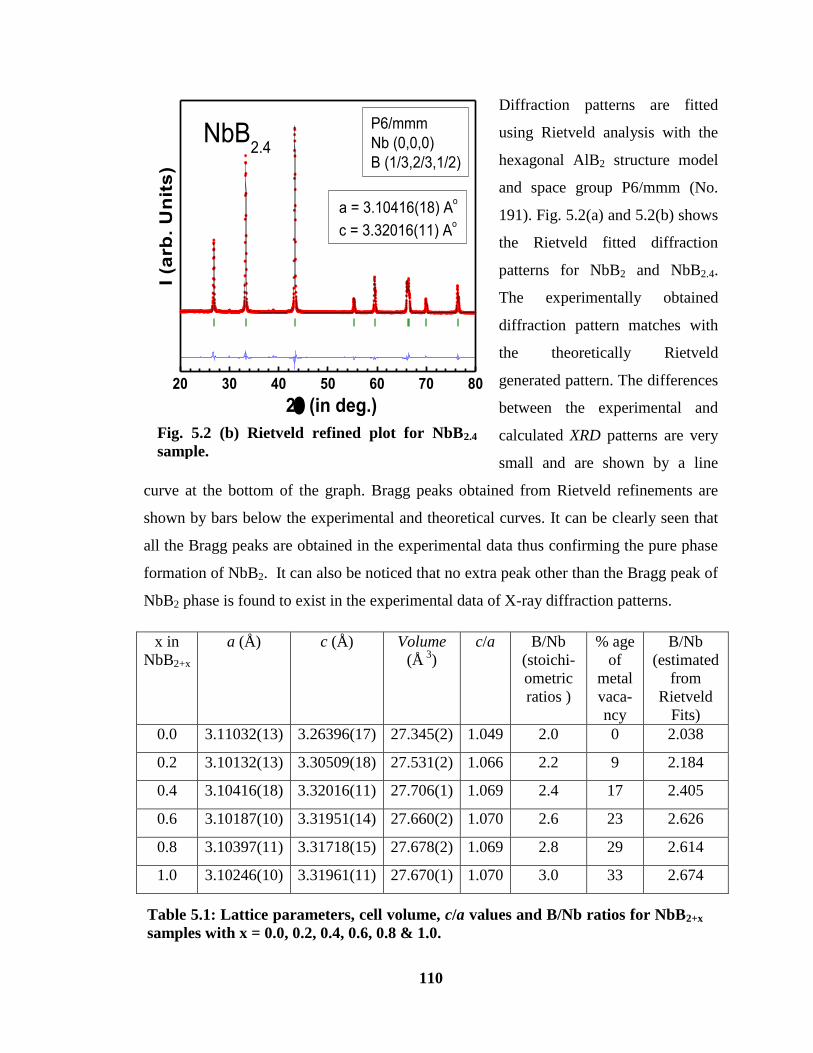
Diffraction patterns are fitted
using Rietveld analysis with the
hexagonal AlB2 structure model
and space group P6/mmm (No.
191). Fig. 5.2(a) and 5.2(b) shows
the Rietveld fitted diffraction
patterns for NbB2 and NbB2.4.
The experimentally obtained
diffraction pattern matches with
the theoretically Rietveld
generated pattern. The differences
between the experimental and
calculated XRD patterns are very
small and are shown by a line
curve at the bottom of the graph. Bragg peaks obtained from Rietveld refinements are
shown by bars below the experimental and theoretical curves. It can be clearly seen that
all the Bragg peaks are obtained in the experimental data thus confirming the pure phase
formation of NbB2. It can also be noticed that no extra peak other than the Bragg peak of
NbB2 phase is found to exist in the experimental data of X-ray diffraction patterns.
x in
NbB2+x
a (Å) c (Å) Volume
(Å 3
)
c/a B/Nb
(stoichi-
ometric
ratios )
% age
of
metal
vaca-
ncy
B/Nb
(estimated
from
Rietveld
Fits)
0.0 3.11032(13) 3.26396(17) 27.345(2) 1.049 2.0 0 2.038
0.2 3.10132(13) 3.30509(18) 27.531(2) 1.066 2.2 9 2.184
0.4 3.10416(18) 3.32016(11) 27.706(1) 1.069 2.4 17 2.405
0.6 3.10187(10) 3.31951(14) 27.660(2) 1.070 2.6 23 2.626
0.8 3.10397(11) 3.31718(15) 27.678(2) 1.069 2.8 29 2.614
1.0 3.10246(10) 3.31961(11) 27.670(1) 1.070 3.0 33 2.674
20 30 40 50 60 70 80
NbB2.4
P6/mmm
Nb (0,0,0)
B (1/3,2/3,1/2)
a = 3.10416(18) Ao
c = 3.32016(11) Ao
2 (in deg.)
I (a
rb.
Un
its
)
Fig. 5.2 (b) Rietveld refined plot for NbB2.4
sample.
Table 5.1: Lattice parameters, cell volume, c/a values and B/Nb ratios for NbB2+x
samples with x = 0.0, 0.2, 0.4, 0.6, 0.8 & 1.0.
111
Rietveld analysis also calculates the exact lattice parameters of sample up to 3rd
place of
decimal and error is provided for 4th
and 5th
place of decimal. In this way, lattice
parameters are calculated for all the NbB2+x samples and are tabulated in Table 5.1. It is
observed that c parameter increases continuously with the increase in boron content up to
x=0.4 in NbB2+x samples. For pure NbB2, c = 3.26396(17)Å, which increases sharply to
3.30509(18)Å and 3.32016(11)Å for NbB2.2 & NbB2.4 samples respectively. Beyond that
parameter changes slightly in a random way and hence has reached the saturation value.
The occupancy factors are also calculated from the Rietveld analysis. As seen from Table
5.1, there is no considerable difference between the experimentally taken stochiometric
ratios and the Rietveld determined values up to NbB2.6 sample. After that the level of
Boron incorporation in the lattice or the extent of metal vacancy creation seems to be
saturated because the Rietveld determined B/ Nb ratio does not increase much after
x=0.6. It means that saturation limit of boron incorporation or metal vacancy creation
corresponds to NbB2.6 or Nb0.76B2. The percentage of metal vacancy can be calculated
mathematically from the stoichiometric ratios of the samples using the formula
% age of metal vacancy in NbB2+x sample = [1-{2/(2+x)}]*100
The calculated values of %age of metal vacancy in boron excess samples are tabulated in
Table 5.1. It can be seen from table 5.1 that maximum limit of metal vacancy creation is
approximately 23% corresponding to NbB2.6 sample. The fact of saturation limit of boron
incorporation is also confirmed by the saturation of c parameter values after NbB2.6 or
Nb0.76B2. Thereafter, the extra added Boron forms NbB2 phase along with the Nb1-xB2
phase as observed in terms of a doublet in case of NbB3(NbB2+x, x=1.0) shown in inset of
Fig. 5.1.
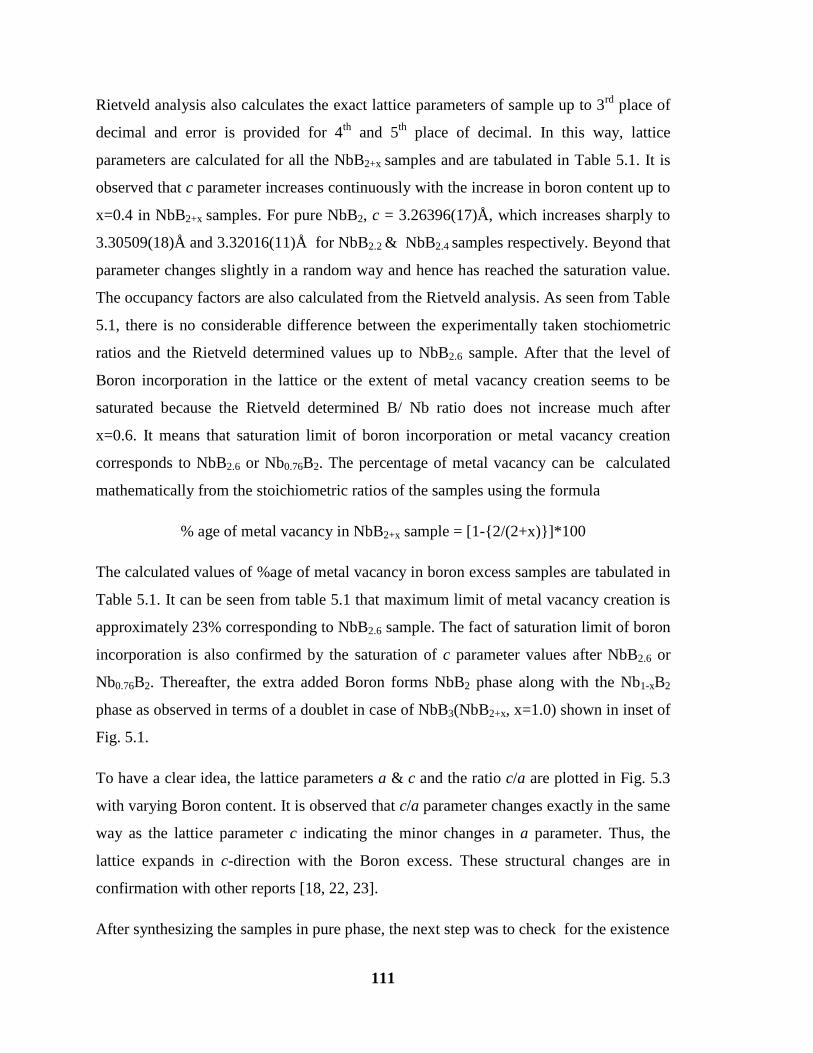
To have a clear idea, the lattice parameters a & c and the ratio c/a are plotted in Fig. 5.3
with varying Boron content. It is observed that c/a parameter changes exactly in the same
way as the lattice parameter c indicating the minor changes in a parameter. Thus, the
lattice expands in c-direction with the Boron excess. These structural changes are in
confirmation with other reports [18, 22, 23].
After synthesizing the samples in pure phase, the next step was to check for the existence
112
0.0 0.2 0.4 0.6 0.8 1.0
3.10
3.11
3.123.26
3.28
3.30
3.32
1.04
1.05
1.06
1.07
c /
a
La
ttic
e P
ara
me
ters
(Ao)
x in NbB2+x
c
a
c/a
Fig. 5.3 Variation of lattice parameters and c/a value
with the increasing Boron content in non-
stoichiometric Niobium boride.
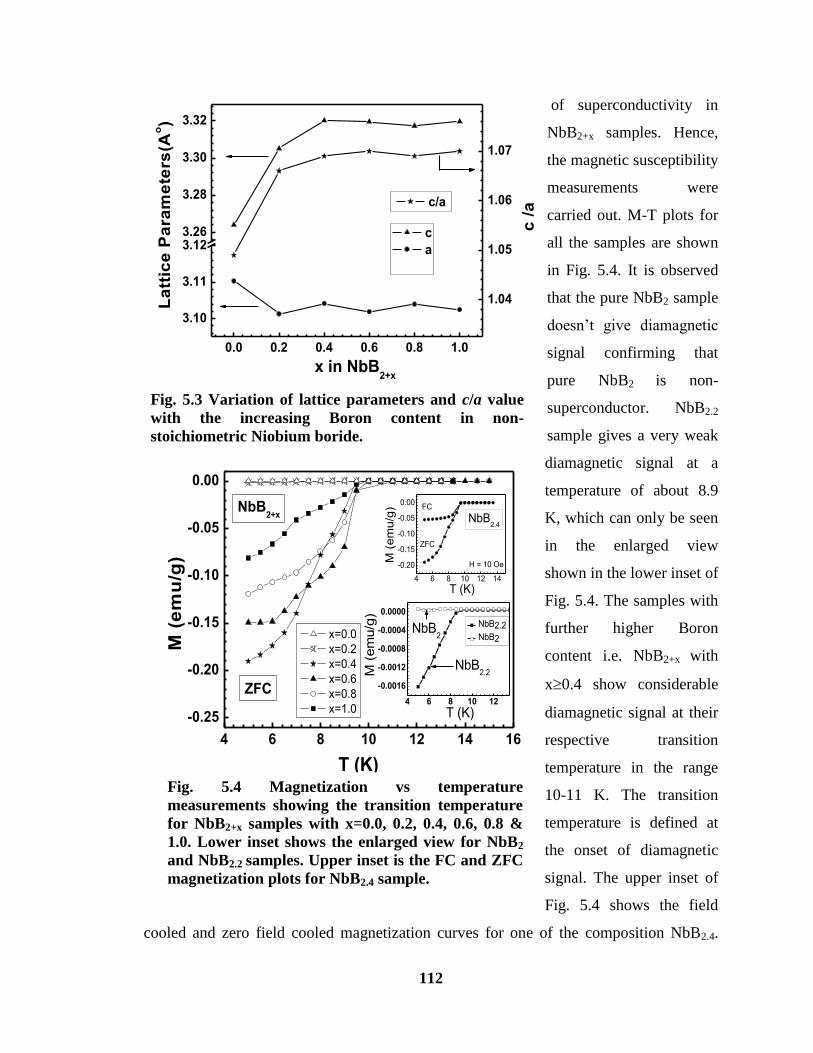
of superconductivity in
NbB2+x samples. Hence,
the magnetic susceptibility
measurements were
carried out. M-T plots for
all the samples are shown
in Fig. 5.4. It is observed
that the pure NbB2 sample
doesn’t give diamagnetic
signal confirming that
pure NbB2 is non-
superconductor. NbB2.2
sample gives a very weak
diamagnetic signal at a
temperature of about 8.9
K, which can only be seen
in the enlarged view
shown in the lower inset of
Fig. 5.4. The samples with
further higher Boron
content i.e. NbB2+x with
x0.4 show considerable
diamagnetic signal at their
respective transition
temperature in the range
10-11 K. The transition
temperature is defined at
the onset of diamagnetic
signal. The upper inset of
Fig. 5.4 shows the field
cooled and zero field cooled magnetization curves for one of the composition NbB2.4.
4 6 8 10 12 14 16
-0.25
-0.20
-0.15
-0.10
-0.05
0.00
4 6 8 10 12
-0.0016
-0.0012
-0.0008
-0.0004
0.0000
NbB2.2
NbB2
NbB2.2
NbB2
M (
em
u/g
)
T (K)
4 6 8 10 12 14
-0.20
-0.15
-0.10
-0.05
0.00
H = 10 Oe
NbB2.4
ZFC
FC
M (
em
u/g
)
T (K)
NbB2+x
ZFC
M (
em
u/g
)
T (K)
x=0.0
x=0.2
x=0.4
x=0.6
x=0.8
x=1.0
Fig. 5.4 Magnetization vs temperature
measurements showing the transition temperature
for NbB2+x samples with x=0.0, 0.2, 0.4, 0.6, 0.8 &
1.0. Lower inset shows the enlarged view for NbB2
and NbB2.2 samples. Upper inset is the FC and ZFC
magnetization plots for NbB2.4 sample.
113
0.0 0.2 0.4 0.6 0.8 1.027.2
27.3
27.4
27.5
27.6
27.7
27.8
27.9
0
1
2
3
4
5
6
7
8
9
10
11
Vo
lum
e[(A
o)3
]
x in NbB2+x
Volume
T
c (
K)
Tc
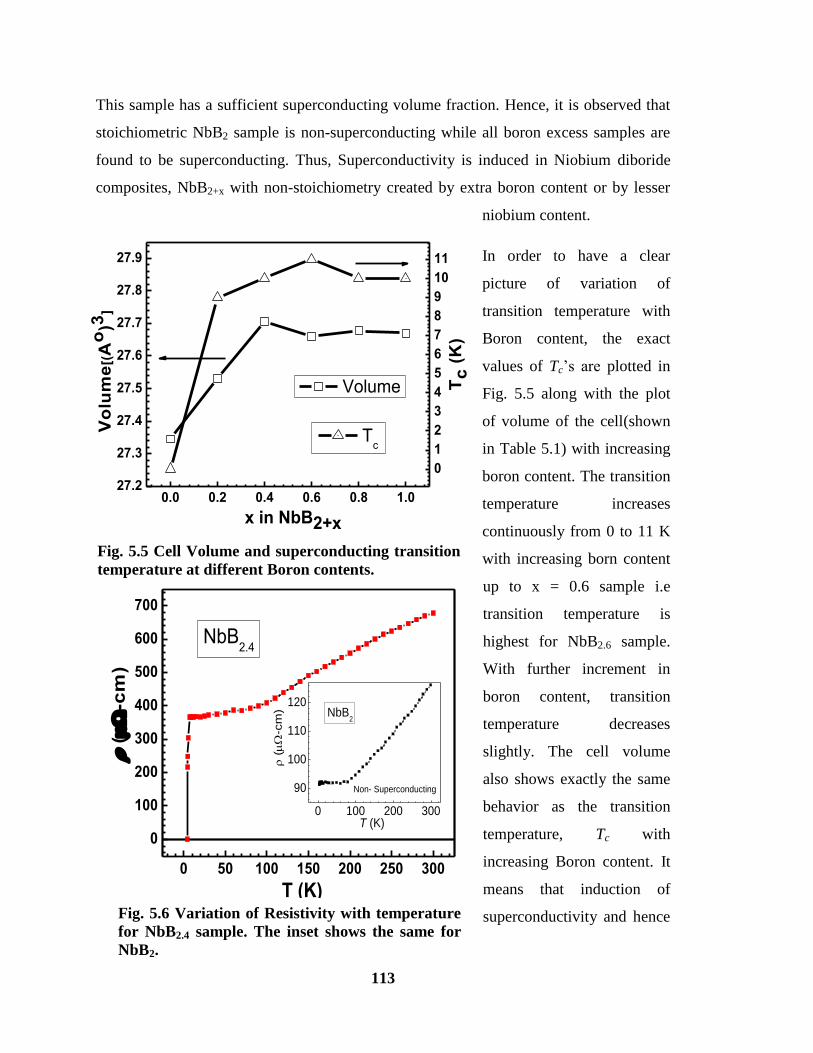
Fig. 5.5 Cell Volume and superconducting transition
temperature at different Boron contents.
This sample has a sufficient superconducting volume fraction. Hence, it is observed that
stoichiometric NbB2 sample is non-superconducting while all boron excess samples are
found to be superconducting. Thus, Superconductivity is induced in Niobium diboride
composites, NbB2+x with non-stoichiometry created by extra boron content or by lesser
niobium content.
In order to have a clear
picture of variation of
transition temperature with
Boron content, the exact
values of Tc’s are plotted in
Fig. 5.5 along with the plot
of volume of the cell(shown
in Table 5.1) with increasing
boron content. The transition
temperature increases
continuously from 0 to 11 K
with increasing born content
up to x = 0.6 sample i.e
transition temperature is
highest for NbB2.6 sample.
With further increment in
boron content, transition
temperature decreases
slightly. The cell volume
also shows exactly the same
behavior as the transition
temperature, Tc with
increasing Boron content. It
means that induction of
superconductivity and hence
0 50 100 150 200 250 300
0
100
200
300
400
500
600
700
0 100 200 300
90
100
110
120
Non- Superconducting
NbB2
(
-cm
)
T (K)
NbB2.4
(
-cm
)
T (K)Fig. 5.6 Variation of Resistivity with temperature
for NbB2.4 sample. The inset shows the same for
NbB2.
114
the transition temperature in NbB2+x samples is related with the cell dimensions or the
lattice parameters. The lattice stretchening in c-direction increases the electron phonon
interaction and hence induces superconductivity in the non-stoichiometric Niobium
diboride samples.
The Resistivity vs temperature measurement (-T) is also carried out for further
confirmation of existence of superconductivity in NbB2+x samples. Fig. 5.6 shows the -T
plots for NbB2 and NbB2.4 sample. The main panel shows the -T measurement for
NbB2.4 sample while the inset shows the same for NbB2 sample. The NbB2.4 sample
shows a sharp transition with a Tc onset of 7.5 K. On the other hand the stoichiometric
NbB2 sample just shows metallic behavior from 300 K to about T=80 K. With further
decrease in temperature, resistivity becomes almost constant and shows no
superconducting transition down to 5 K. Thus -T measurement is in confirmation with
the M-T measurement showing that only Boron excess sample is superconducting
although Tc onset obtained from magnetization measurement for NbB2.4 is comparatively
higher.
Hence, it is confirmed that
superconductivity is
introduced in NbB2 by
increasing Boron content
or by creating Nb vacancy.
The presence of vacancies
in the Niobium sub-lattice
of NbB2 brings about
considerable changes in the
density of states in the near
Fermi region and gives rise
to a peak in the density of
states [24]. The increase in
the DOS (density of states)
at fermi level corresponds
-2 -1 0 1 2
-6
-4
-2
0
2
4
6
-2 -1 0 1 2
-0.030
-0.015
0.000
0.015
0.030 NbB2.2
NbB2
M (
em
u/g
)
H (kOe)
5 K
M (
em
u/g
)
H (kOe)
x=0.0
x=0.2
x=0.4
x=0.6
x=0.8
x=1.0
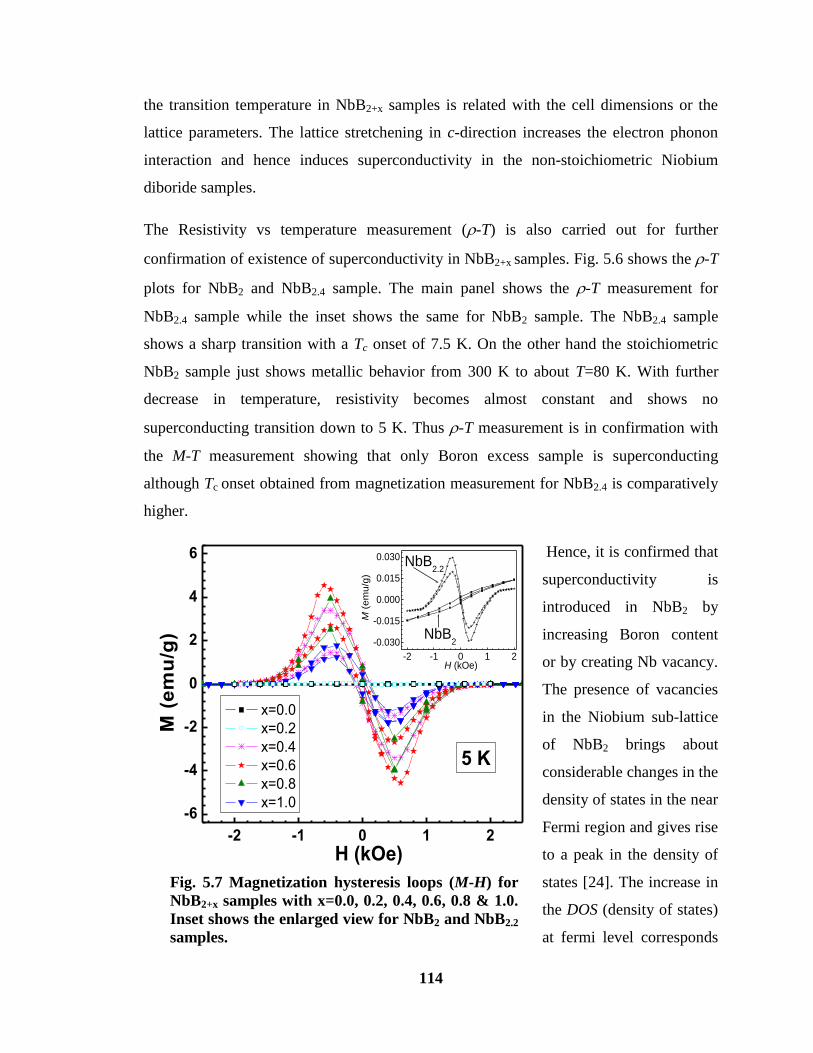
Fig. 5.7 Magnetization hysteresis loops (M-H) for
NbB2+x samples with x=0.0, 0.2, 0.4, 0.6, 0.8 & 1.0.
Inset shows the enlarged view for NbB2 and NbB2.2
samples.
115
to the increase in transition temperature with Boron excess.
Magnetization hysteresis loops (M-H) are shown in Fig. 5.7 for all synthesized samples in
both the increasing and decreasing field directions at 5 K. Pure NbB2 sample doesn’t
show any negative moment, rather a paramagnetic signal is given which can be seen in
the enlarged view in the inset of Fig. 5.7. NbB2.2 sample gives weak negative moment
with the field and possess a hysteresis in increasing and decreasing field directions which
is not visible in the main graph but can be seen in the inset. All other samples with higher
Boron content i.e samples with x0.2 show considerable magnetic moments in opposite
direction of field and can be seen in the main graph of Fig. 5.7. Since the magnetization
measurements are taken in both increasing and decreasing field directions, two curves are
seen for one particular sample in both the quadrants of Fig. 5.7 thus forming the M-H
hysteresis loop. The magnetization M(H) grows (as usual) slowly with H and then falls to
near zero moment value, and further grows again in a common way. It is clear from the
M-H plots that the non-stoichiometric Niobium boride samples are Type-II
superconductor and the results are supported by existing report on this compound [25].
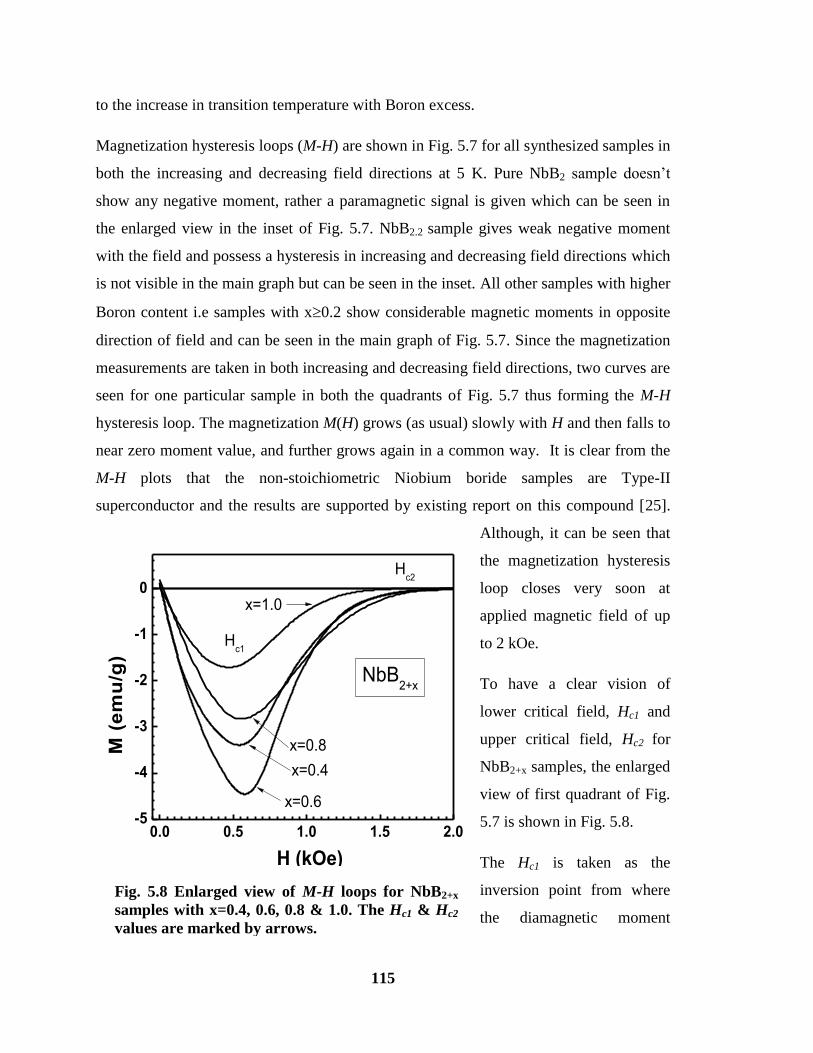
Although, it can be seen that
the magnetization hysteresis
loop closes very soon at
applied magnetic field of up
to 2 kOe.
To have a clear vision of
lower critical field, Hc1 and
upper critical field, Hc2 for
NbB2+x samples, the enlarged
view of first quadrant of Fig.
5.7 is shown in Fig. 5.8.
The Hc1 is taken as the
inversion point from where
the diamagnetic moment
0.0 0.5 1.0 1.5 2.0-5
-4
-3
-2
-1
0x=1.0
x=0.8
x=0.4
Hc2
Hc1
NbB2+x
M (
em
u/g
)
H (kOe)
x=0.6
Fig. 5.8 Enlarged view of M-H loops for NbB2+x
samples with x=0.4, 0.6, 0.8 & 1.0. The Hc1 & Hc2
values are marked by arrows.
116
starts decreasing or otherwise the field starts penetrating through the sample. Hc2 is taken
as the field value at which the diamagnetic signal of the sample vanishes or otherwise the
applied field completely penetrates through the sample. The lower critical field value Hc1
increases with increasing Boron content and is found to be maximum for the x=0.6
sample i.e. Hc1 = 592 Oe for NbB2.6 sample. With further increase in Boron content, Hc1
value decreases slightly. On the other hand, the upper critical field, Hc2 is same for 0.4
x0.8 samples and the value is about 2000 Oe while it is 1600 Oe for x=1.0 i.e NbB3
sample.
5.2 SYNTHESIS AND CHARACTERIZATION OF Mg
SUBSTITUTED NbB2 SAMPLES
5.2.1 INTRODUCTION
In the previous section (5.1), it is observed that Boron excess samples result in increase
of c parameter or in other words, result in lattice stretchening in c direction. The c/a value
increases from 1.05 to 1.07 with Boron excess. This lattice stretchening increases the
electron phonon interaction and hence induces superconductivity in the non-
stoichiometric NbB2+x samples. An alternative way to induce stress in the lattice is to
substitute a slightly bigger metal element at Nb site which can accommodate the same
space group. Secondly, substituting a less valent element will create holes in the lattice. It
results in increase of hole states at Fermi level and hence lowers the Fermi level as
compared to that of NbB2. Both the factors are helpful in inducing superconductivity. Nb
is tetra valent in NbB2. Mg is divalent and MgB2 itself is stable in the same space group
P6/mmm as that of NbB2. Moreover, the ionic radius of Mg is also greater than that of
Nb. So, substituting Mg at Nb site is one of the best options.
Keeping all these key points in mind, we have synthesized Nb1-xMgxB2 samples by
simple solid-state reaction route at ambient pressure in order to induce an increase in c
parameter. The structural and superconducting characterizations are carried out
systematically for all the samples. The impact of Mg substitution at Nb site on the
117
superconducting behavior of NbB2 is studied in detail.
5.2.2 EXPERIMENTAL
The details of sample synthesis by solid state reaction route are mentioned in section 2.2
under Chapter 2 and both In-Situ and Ex-situ techniques are described in section 1.3,
Chapter 1. Briefly, the Polycrystalline bulk samples of Nb1-xMgxB2 were synthesized by
Ex-situ solid-state reaction route. The commercial NbB2 and MgB2 powders were taken
as the precursor material. Both the ingredients were taken in stoichiometric ratio
according to the desired composition, Nb1-xMgxB2 as [(1-x)NbB2+x(MgB2)]. The pellets
were enclosed in soft iron tubes and then sealed in Quartz tube up to a vacuum of 10-5
torr. The sealed quartz tubes were sintered at 1100oC for 20 hours followed by natural
cooling to room temperature. The heating rate was approximately 10oC/min. It is to be
mentioned here that vaccum annealing can be done to avoid the continuous argon flow.
The X-ray diffraction patterns of all the synthesized samples were recorded using the
synthesized samples in powder form. Rietveld analysis was done by Fullprof program so
as to obtain lattice parameters. Magnetization measurements on NbB2 sample were
carried out on a SQUID magnetometer (MPMS-XL), details of which are given in Chapter
2 in section 2.3.2.2 and section 2.3.2.3 while details of X-ray diffraction technique are
given in Chapter 2 under Section 2.3.1.1.
5.2.3 RESULTS AND DISCUSSION
The X-ray diffraction patterns for the pure and Mg substituted NbB2 samples are shown
in Fig. 5.9. The characteristic peaks are indexed in the Fig. and no impurity peak of
considerable intensity is noticed. The Mg substituted samples are also phase pure like
pristine sample except a small intensity MgO peak. A shift in the (002) peak towards the
lower angle side with increasing Mg content is observed which can be seen clearly in
inset of Fig. 5.9. In order to confirm the exact phase formation and to determine the
lattice parameters precisely, the Rietveld analysis is done on all the samples. The
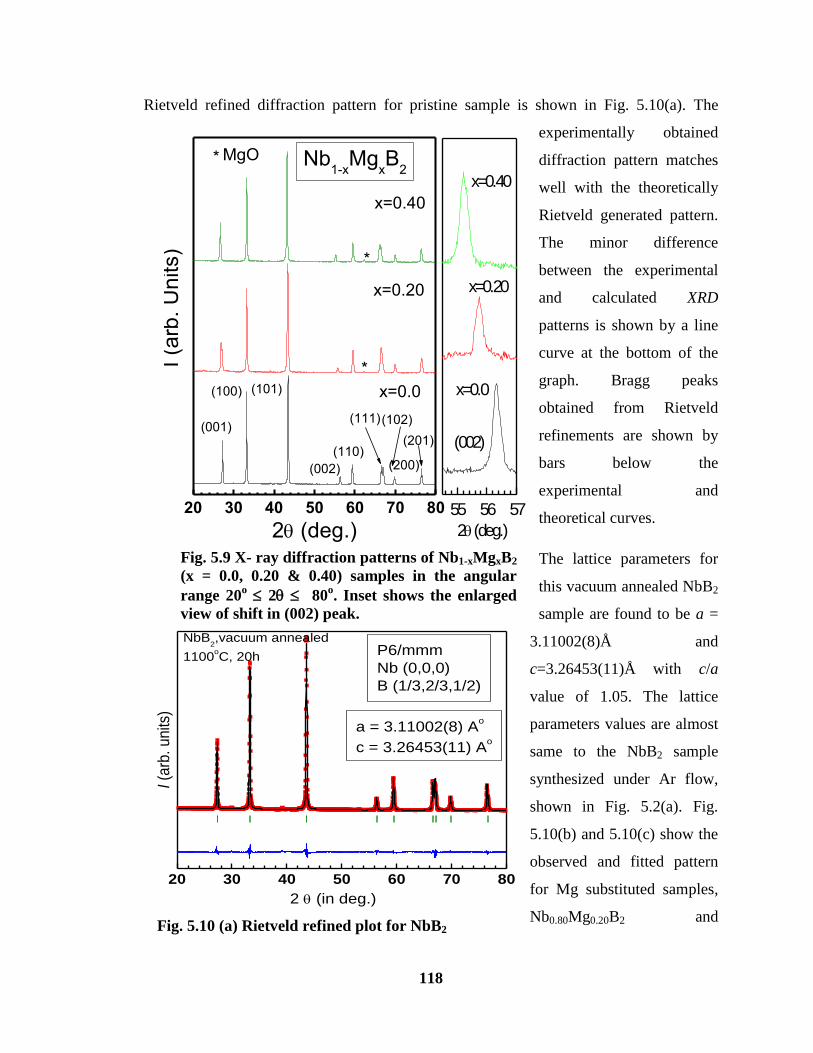
118
Rietveld refined diffraction pattern for pristine sample is shown in Fig. 5.10(a). The
experimentally obtained
diffraction pattern matches
well with the theoretically
Rietveld generated pattern.
The minor difference
between the experimental
and calculated XRD
patterns is shown by a line
curve at the bottom of the
graph. Bragg peaks
obtained from Rietveld
refinements are shown by
bars below the
experimental and
theoretical curves.
The lattice parameters for
this vacuum annealed NbB2
sample are found to be a =
3.11002(8)Å and
c=3.26453(11)Å with c/a
value of 1.05. The lattice
parameters values are almost
same to the NbB2 sample
synthesized under Ar flow,
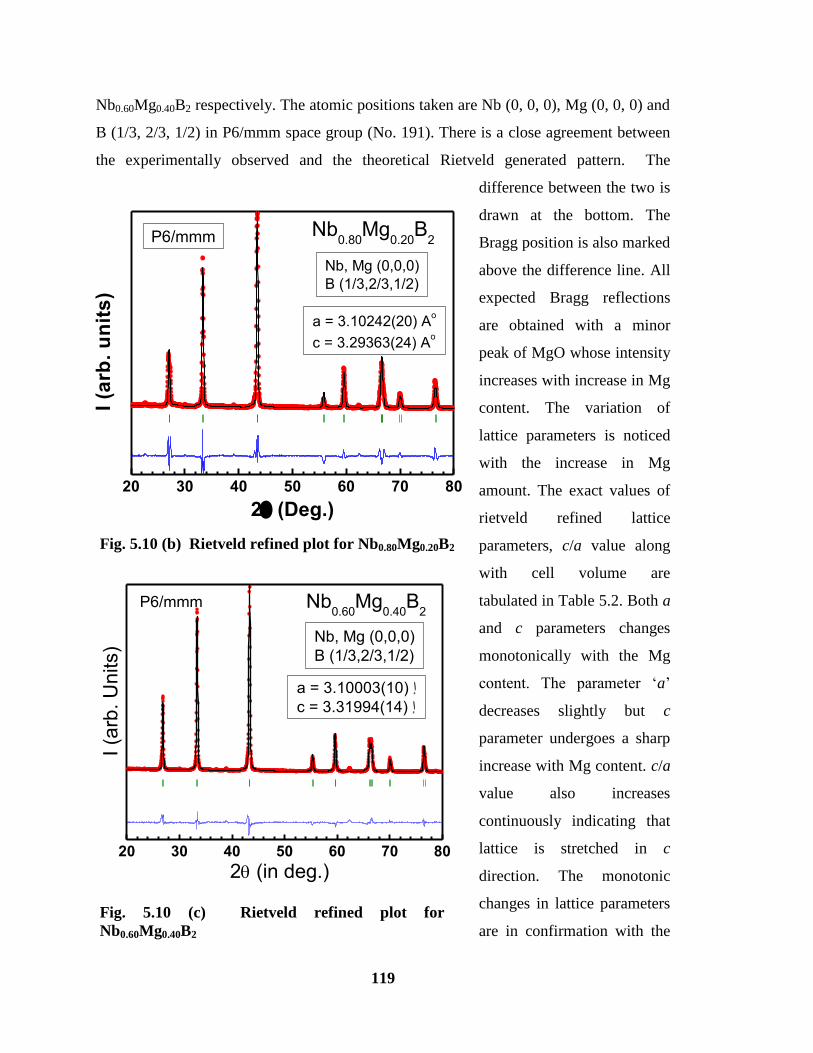
shown in Fig. 5.2(a). Fig.
5.10(b) and 5.10(c) show the
observed and fitted pattern
for Mg substituted samples,
Nb0.80Mg0.20B2 and
20 30 40 50 60 70 80
55 56 57
(002)
x=0.0
x=0.20
x=0.40
2 (deg.)
MgO*
*
*
(201)
(200)
(102)(111)
(110)
(002)
(101)(100)
(001)
I (a
rb.
Un
its)
x=0.40
x=0.20
x=0.0
Nb1-x
MgxB
2
2 (deg.)Fig. 5.9 X- ray diffraction patterns of Nb1-xMgxB2
(x = 0.0, 0.20 & 0.40) samples in the angular
range 20o 2 80
o. Inset shows the enlarged
view of shift in (002) peak.
20 30 40 50 60 70 80
I (a
rb. units
)
P6/mmm
Nb (0,0,0)
B (1/3,2/3,1/2)
a = 3.11002(8) Ao
c = 3.26453(11) Ao
NbB2,vacuum annealed
1100oC, 20h
2 (in deg.)
Fig. 5.10 (a) Rietveld refined plot for NbB2
119
20 30 40 50 60 70 80
P6/mmm Nb0.60
Mg0.40
B2
a = 3.10003(10) إ
c = 3.31994(14) إ
Nb, Mg (0,0,0)
B (1/3,2/3,1/2)
I (a
rb. U
nits)
2 (in deg.)
Fig. 5.10 (c) Rietveld refined plot for
Nb0.60Mg0.40B2
Fig. 5.10 (b) Rietveld refined plot for Nb0.80Mg0.20B2
20 30 40 50 60 70 80
a = 3.10242(20) Ao
c = 3.29363(24) Ao
Nb, Mg (0,0,0)
B (1/3,2/3,1/2)
Nb0.80
Mg0.20
B2P6/mmm
I (a
rb.
un
its
)
2 (Deg.)
Nb0.60Mg0.40B2 respectively. The atomic positions taken are Nb (0, 0, 0), Mg (0, 0, 0) and
B (1/3, 2/3, 1/2) in P6/mmm space group (No. 191). There is a close agreement between
the experimentally observed and the theoretical Rietveld generated pattern. The
difference between the two is
drawn at the bottom. The
Bragg position is also marked
above the difference line. All
expected Bragg reflections
are obtained with a minor
peak of MgO whose intensity
increases with increase in Mg
content. The variation of
lattice parameters is noticed
with the increase in Mg
amount. The exact values of
rietveld refined lattice
parameters, c/a value along
with cell volume are
tabulated in Table 5.2. Both a
and c parameters changes
monotonically with the Mg
content. The parameter ‘a’
decreases slightly but c
parameter undergoes a sharp
increase with Mg content. c/a
value also increases
continuously indicating that
lattice is stretched in c
direction. The monotonic
changes in lattice parameters
are in confirmation with the
120
earlier report on Nb1-xMgxB2 [26].
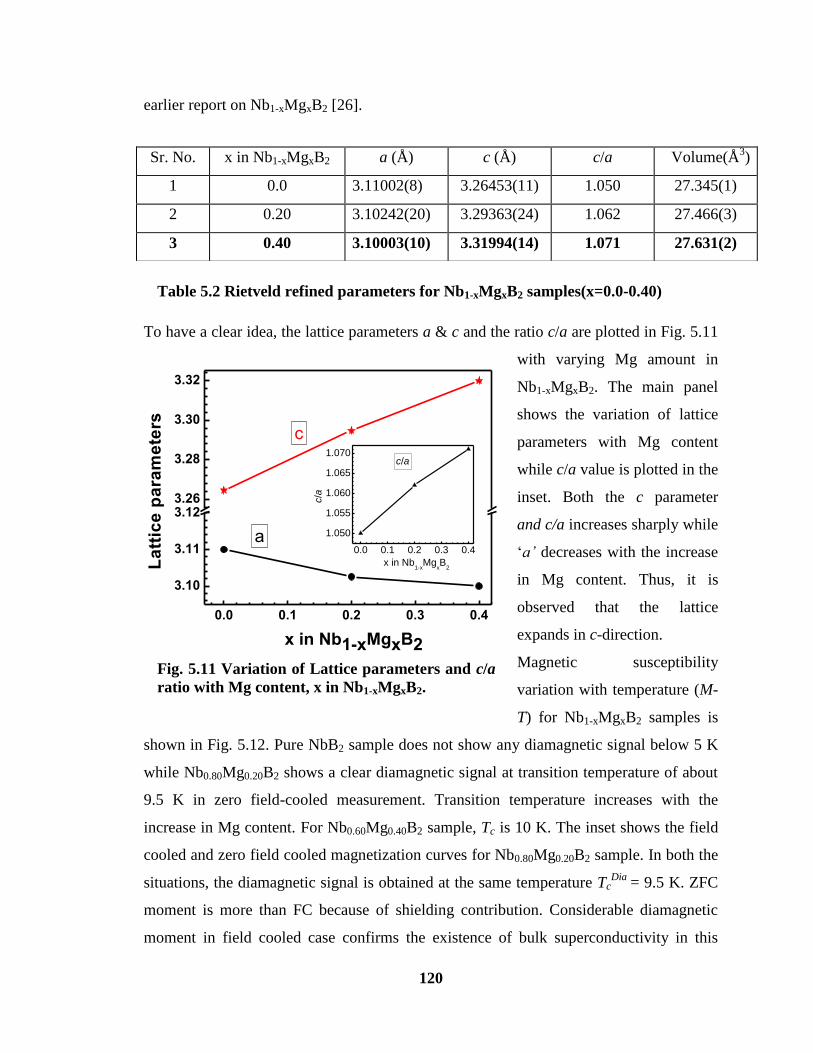
To have a clear idea, the lattice parameters a & c and the ratio c/a are plotted in Fig. 5.11
with varying Mg amount in
Nb1-xMgxB2. The main panel
shows the variation of lattice
parameters with Mg content
while c/a value is plotted in the
inset. Both the c parameter
and c/a increases sharply while
‘a’ decreases with the increase
in Mg content. Thus, it is
observed that the lattice
expands in c-direction.
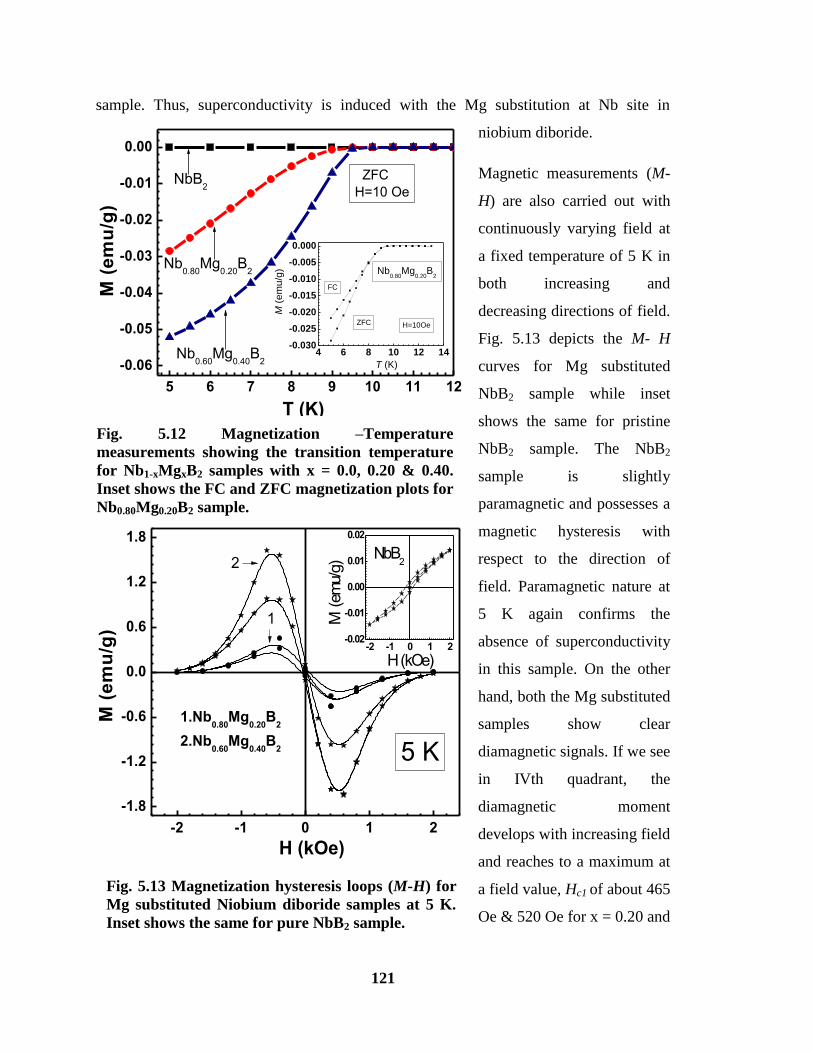
Magnetic susceptibility
variation with temperature (M-
T) for Nb1-xMgxB2 samples is
shown in Fig. 5.12. Pure NbB2 sample does not show any diamagnetic signal below 5 K
while Nb0.80Mg0.20B2 shows a clear diamagnetic signal at transition temperature of about
9.5 K in zero field-cooled measurement. Transition temperature increases with the
increase in Mg content. For Nb0.60Mg0.40B2 sample, Tc is 10 K. The inset shows the field
cooled and zero field cooled magnetization curves for Nb0.80Mg0.20B2 sample. In both the
situations, the diamagnetic signal is obtained at the same temperature TcDia
= 9.5 K. ZFC
moment is more than FC because of shielding contribution. Considerable diamagnetic
moment in field cooled case confirms the existence of bulk superconductivity in this
Sr. No. x in Nb1-xMgxB2 a (Å) c (Å) c/a Volume(Å3)
1 0.0 3.11002(8) 3.26453(11) 1.050 27.345(1)
2 0.20 3.10242(20) 3.29363(24) 1.062 27.466(3)
3 0.40 3.10003(10) 3.31994(14) 1.071 27.631(2)
Table 5.2 Rietveld refined parameters for Nb1-xMgxB2 samples(x=0.0-0.40)
Fig. 5.11 Variation of Lattice parameters and c/a
ratio with Mg content, x in Nb1-xMgxB2.
0.0 0.1 0.2 0.3 0.4
3.10
3.11
3.123.26
3.28
3.30
3.32
a
c
0.0 0.1 0.2 0.3 0.4
1.050
1.055
1.060
1.065
1.070c/a
c/a
x in Nb1-x
MgxB
2
x in Nb1-xMgxB2
La
ttic
e p
ara
me
ters
121
5 6 7 8 9 10 11 12
-0.06
-0.05
-0.04
-0.03
-0.02
-0.01
0.00
Nb0.60
Mg0.40
B2
Nb0.80
Mg0.20
B2
NbB2
4 6 8 10 12 14-0.030
-0.025
-0.020
-0.015
-0.010
-0.005
0.000
Nb0.80
Mg0.20
B2
H=10Oe
FC
ZFC
M (
em
u/g
)
T (K)
ZFC
H=10 Oe
M
(e
mu
/g)
T (K)
Fig. 5.12 Magnetization –Temperature
measurements showing the transition temperature
for Nb1-xMgxB2 samples with x = 0.0, 0.20 & 0.40.
Inset shows the FC and ZFC magnetization plots for
Nb0.80Mg0.20B2 sample.
sample. Thus, superconductivity is induced with the Mg substitution at Nb site in
niobium diboride.
Magnetic measurements (M-
H) are also carried out with
continuously varying field at
a fixed temperature of 5 K in
both increasing and
decreasing directions of field.
Fig. 5.13 depicts the M- H
curves for Mg substituted
NbB2 sample while inset
shows the same for pristine
NbB2 sample. The NbB2
sample is slightly
paramagnetic and possesses a
magnetic hysteresis with
respect to the direction of
field. Paramagnetic nature at
5 K again confirms the
absence of superconductivity
in this sample. On the other
hand, both the Mg substituted
samples show clear
diamagnetic signals. If we see
in IVth quadrant, the
diamagnetic moment
develops with increasing field
and reaches to a maximum at
a field value, Hc1 of about 465
Oe & 520 Oe for x = 0.20 and
-2 -1 0 1 2
-1.8
-1.2
-0.6
0.0
0.6
1.2
1.8
-2 -1 0 1 2-0.02
-0.01
0.00
0.01
0.02
M (em
u/g)
H (kOe)
NbB2
1.Nb0.80
Mg0.20
B2
2.Nb0.60
Mg0.40
B2
M (
em
u/g
)
H (kOe)
2
1
5 K
Fig. 5.13 Magnetization hysteresis loops (M-H) for
Mg substituted Niobium diboride samples at 5 K.
Inset shows the same for pure NbB2 sample.
122
0.40 samples respectively. With further increment in field, the diamagnetic moment starts
decreasing gradually as generally happen in Type-II superconductor. The diamagnetic
signal vanishes at a field value of about 2000 Oe i.e. the sample remains no longer super
conducting with further increase in field. The magnitude of diamagnetic moment for
Nb0.60Mg0.40B2 sample is more than four times to that of Nb0.80Mg0.20B2 sample at its
peak, which shows the improved superconductivity with increasing Mg content.
5.3 SUMMARY AND CONCLUSIONS
The structural and superconducting behavior of non- stoichiometric boron excess,
NbB2+x samples and the Mg substituted NbB2 samples i.e. Nb1-xMgxB2 is studied
systematically.
Both, the Niobium vacancy in NbB2+x samples and the substitution of Mg at Nb
site in Nb1-xMgxB2 samples result in expanding of crystal lattice in c-direction,
thus, increasing the c/a ratio and the cell volume.
The upper limit to the metal vacancy creation in NbB2+x samples is observed to be
near 23% while Mg substitutes successfully at Nb site up to 40% in case of Nb1-
xMgxB2 samples.
These structural changes in NbB2+x and Nb1-xMgxB2 samples are accompanied
with the induction of superconductivity in both the systems. Resistivity and
Magnetization measurements confirm the induction of superconductivity in boron
excess and Mg substituted niobium diboride samples. The transition temperature
increases from 8.9-11 K with the increase of Niobium vacancy in NbB2+x samples
while increases from 9.5 to 10 K with increase in Mg content in Nb1-xMgxB2
samples.
The M-H hysteresis loops confirm the type-II superconductivity in both the
series. The lower critical field Hc1 increases with the increase in Boron content up
to x=0.6 sample in NbB2+x series with Hc1 592 Oe while decreases with further
increment in Boron content. The upper critical field value Hc2 is around 2000 Oe
for all superconducting NbB2+x samples except NbB3 with Hc2 1600 Oe.
123
Similarly, Hc1 of about 465 Oe & 520 Oe is observed for x = 0.20 and 0.40
samples respectively in Nb1-xMgxB2 series The upper critical field value Hc2 is
around 2000 Oe for both the superconducting Mg substituted samples.
The present investigations reveal that both the non-stoichiometry and the
substitution by less valency element like Mg can induce superconductivity in
NbB2 composites. The induction of superconductivity in these compounds is
directly related to the stretching of lattice in c-direction. That’s why improvement
of Tc is limited at 11 K for NbB2.4 sample with saturation to the increase in c-
parameter. Transition temperature may increase further if somehow lattice
stretchening in c-direction is enhanced further by some technique in niobium
diboride samples.
124
REFERENCES
1. J. Nagamatsu, N. Nakagawa, T. Muranaka, Y. Zenitani and J. Akimitsu, Nature
410 (2001) 63.
2. J. S. Slusky, N. Rogado, K. A. Regan, M. A. Hayward, P. Khallfah, T. He, K.
Innumaru, S. M. Loureiro, M. K. Haas, H. W. Zandbergan and R. J. Cava, Nature
410 (2001) 343.
3. I. Felner, Physica C 353 (2001) 11.
4. Y. G. Zhao, X. P. Zhang, P. T. Qiao, H. T. Zhang, S. L. Jia, B. S. Cao, M. H. Zhu,
Z. H. Han, X. L. Wang and B. L. Gu, Physica C 361 (2001) 91.
5. C. Jariwala, A. Chainani, S. Tsuda, T. Yokoya, S. Shin, Y. Takano, K. Togano, S.
Otani, and H. Kito, Phys. Rev. B 68 (2003) 174506.
6. I. R. Shein and A. L. Ivanovski, Physics of the Solid State, 44 (2002)1833-1839.
7. A. N. Kolmogorov and Stefano Curtarolo, Phys. Rev. B 74 (2006) 224507.
8. J. K. Hulm and B. T. Mathias, Phys. Rev. 82 (1951) 273.
9. W. A. Zeigler and R. Young, Phys Rev 94 (1953) 115.
10. A. S. Cooper, E. Corenzwit, L. D. Longinotti, B. T. Mathias and W. H.
Zachariasen, Proc Natl Acad Sci 67 (1970) 313.
11. V. A. Gasprov, N. S. Sidorov, I. I. Zever’kova and M. P. Kulakov, JETP Lett. 73
(2001) 601.
12. D. Kaczorowski, A. J. Zaleski, O. J. Zogal and J. Klamut, cond-mat 0103571
(2001).
13. H. Kotegawa, K. Ishida, Y. Kitaoka, T. Muranaka, H. Takagiwa and J. Akimitsu,
Physica C 378 (2002) 25.
14. J. E. Schriber, D. L. Overmeyer, B. Morosin, E. L. Venturini, R. Baughman, D.
Emin, H. Klesnar and T. Aselage, Phys. Rev. B 45 (1992) 10787.
15. J. K. Hulm and B. T. Mathias, Phys. Rev. B 82 (1951) 273.
16. W. A. Zeigler and R. Young, Phys. Rev. B 94 (1953) 115.
17. L. leyarovska and E. Leyarovski, J. Less-Common Met. 67 (1979) 249.
18. A. Yamamoto, C. Takao, T. Matsui, M. Izumi and S. Tajima, Physica C 383
(2002) 197.
125
19. T. Takahashi, Shuichi Kawamata, Satoru Noguchi and Takekazu Ishida, Physica
C 426-431 (2005) 478-481.
20. L. E. Muzzy, M. Avdeev, G. Lawes, M. K. Hass, H. W. Zandbergan, A. P.
Ramirez, J. D. Jorgensen and R. J. Cava, Physica C 382 (2002) 153.
21. H. Klesner, T. L. Aselage, B. Morosin and G. H. Kwei, J. Alloys and compounds
241 (1996) 180.
22. R. Escamilla, O. Lovera, T. Akachi, A. Duran, R. Falconi, F. Morales and R.
Escudero, J. Phys.: Condens. Matter 16 (2004) 5979.
23. Zhi-An Ren, Sogo Kuroiwa, Yoko Tomita and Jun Akimitsu, Physica C 468
(2008) 411.
24. I. R. Shein, N. I. Medvedeva and A. L. Ivanovskii, Physics of the solid state, 45
(2003) 1617.
25. Carlos Angelo Nunes, D. Kackzorowski, P. Rogl, M. R. Baldissera, P. A. Suzuki,
G. C. Coelho, A. Grytsiv, G. Andre, F. Bouree and S. Okada, Acta Materialia 53
(2005) 3679.
26. H. X. Geng, G. C. Che, W. Huang, S. L. Jia, H. Chen and Z. X. Zhao, Supercond.
Sci. Technol. 20 (2007) 452.