Embed Size (px)
Citation preview

Chapter 55: Ecosystems and Energy
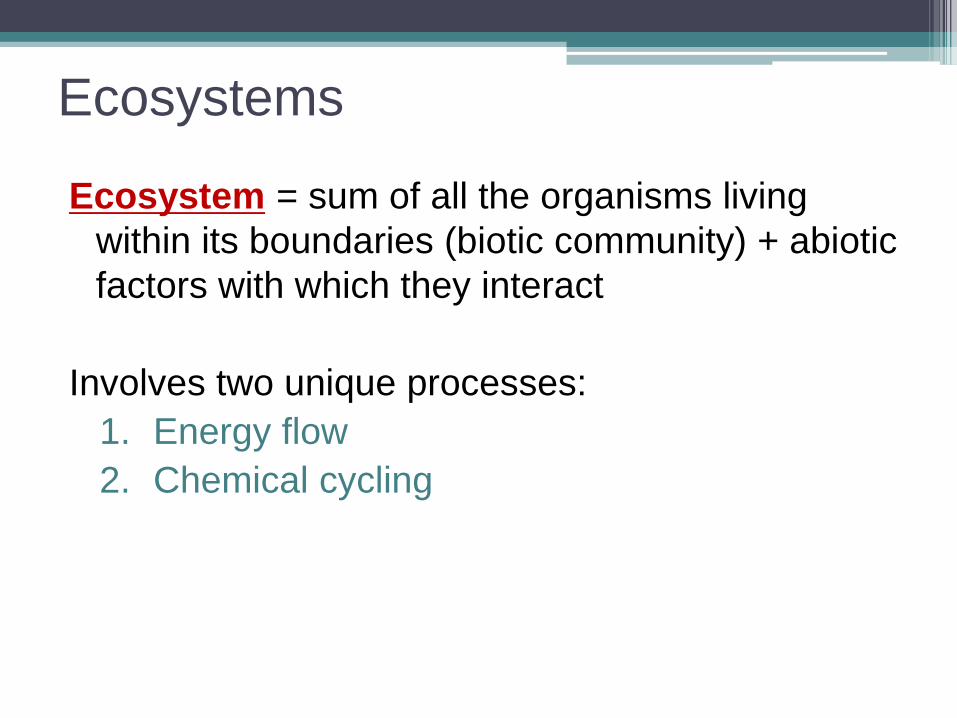
Ecosystems
Ecosystem = sum of all the organisms living
within its boundaries (biotic community) + abiotic
factors with which they interact
Involves two unique processes:
1. Energy flow
2. Chemical cycling

Overview of energy & nutrient dynamics

Energy Flow in an Ecosystem
• Energy cannot be recycled must be constantly
supplied to an ecosystem (mostly by SUN)
• The autotrophs (“self feeders”) are the primary
producers, and are usually photosynthetic (plants
or algae).
▫ They use light energy to synthesize sugars and other
organic compounds.
• Heterotrophs (“other feeders”) – can’t make own
food

• Heterotrophs are
at trophic levels
above the primary
producers and
depend on their
photosynthetic
output.

▫ Herbivores that eat primary producers are
called primary consumers.
▫ Carnivores that eat herbivores are called
secondary consumers.
▫ Carnivores that eat secondary consumers are
called tertiary consumers.
▫ Another important group of heterotrophs is the
detritivores, or decomposers.
They get energy from detritus, nonliving
organic material, and play an important role
in material cycling.

Main decomposers:
fungi & prokaryotes

Primary Production
• Primary production = amt. of light energy that
is converted to chemical energy
• Gross primary production (GPP): total primary
production in an ecosystem
• Net primary production (NPP) = gross primary
production minus the energy used by the
primary producers for respiration (R):
▫ NPP = GPP – R
• NPP = storage of chemical energy available to
consumers in an ecosystem

Open ocean
Continental shelf
Upwelling zones
Extreme desert, rock, sand, ice
Swamp and marsh
Lake and stream
Desert and semidesert scrub
Tropical rain forest
Temperate deciduous forest
Temperate evergreen forest
Tropical seasonal forest
Savanna
Cultivated land
Estuary
Algal beds and reefs
Boreal forest (taiga)
Temperate grassland
Woodland and shrubland
Tundra
0.4
0.4
1.0
1.3
1.5
1.6
1.7
1.8
2.4
2.7
2.9
3.3
3.5
4.7
0.3
0.1
0.1
5.2
65.0
Freshwater (on continents)
Terrestrial
Marine
Key Percentage of Earth’ssurface area
Average net primary
production (g/m2/yr)
6050403020100 2,5002,0001,5001,0005000
Percentage of Earth’s net
primary production
2520151050
125
2,500
360
1,500
500
3.0
90
900
600
800
2,200
600
250
1,600
1,200
1,300
2,000
700
140
0.3
7.9
9.1
9.6
5.4
3.5
0.6
7.1
4.9
3.8
2.3
24.4
5.6
1.2
0.9
0.1
0.04
0.9
22
Net primary production of different ecosystems

Primary production factors in:
•Aquatic ecosystems:
▫ Light availability (↑ depth, ↓ photosynthesis)
▫ Nutrient availability (N, P in marine env.)
•Terrestrial ecosystems:
▫ Temperature & moisture
•A nutrient-rich lake that supports algae growth is
eutrophic.

Energy transfer between trophic levels is
typically only 10% efficient
• Production efficiency:
only fraction of E stored
in food
• Energy used in
respiration is lost as heat
• Energy flows (not cycle!)
within ecosystems

Pyramid of Energy:
10% transfer of
energy from one
level to next

Ecological pyramids give insight to food chains
Pyramid of Numbers
Pyramid of Biomass
• Loss of energy limits #
of top-level carnivores
• Most food webs only
have 4 or 5 trophic
levels

Trophic level
Secondary
consumers
Primary
consumers
Primary
producers
The dynamics of energy through ecosystems have
important implications for the human population

Matter Cycles in Ecosystem
• Biogeochemical cycles: nutrient cycles that
contain both biotic and abiotic components
• organic inorganic parts of an ecosystem
• Nutrient Cycles: water, carbon, nitrogen,
phosphorus


Water Cycle

Water Cycle
1. Evaporation – liquid water becomes a gas
▫ Transpiration – evaporating off plants
2. Condensation – water changing from gas to liquid

3. Precipitation – water falling to Earth from
atmosphere
4. Run-off – water running over the land
▫ collect in the oceans, lakes or rivers
5. Infiltration – water seeping into the ground
– Ground Water- stored in underground caverns
and porous rock
– Provides water for the soil, streams, rivers, and
oceans

Watersheds
• The area of land that contributes water to a river system is called a watershed.

Aquifers
• Aquifer – Layer of permeable rock or sediment.
• “recharged” by precipitation filtering into permeable soils
• Water Table – Boundary at the top of the groundwater zone.


Human impacts on water cycle
• Removing forests and vegetation – increases runoff and erosion, reduces transpiration and lowers water tables
• Damming rivers increases evaporation and infiltration
• Emitting pollutants = acid precipitation
• Most threatening : overdrawing groundwater▫ Agriculture, watering, etc.
Lake Mead
White Bear Lake
http://www.wblcd.org/wl/images/articles/PDF/Million_dollar_question_meansWBP102616.pdf
http://www.wblcd.org/wl/images/articles/PDF/TheupsanddownsofWBL_ST052216.pdf

Carbon Cycle
• CO2 removed by
photosynthesis,
added by burning
fossil fuels

Ways carbon moves
• Photosynthesis – moves from environment to plants
• Respiration- moves from living things back to the environment
• Decomposition/Decay- moving from dead organisms back to the environment
• Combustion- Burning releases carbon back into the atmosphere

Carbon in the
Atmosphere
• Greenhouse effect
▫ Trapping of heat by molecules (water, methane,
CO2,)

Human Impact
• Fossil fuels
▫ Releases stores of carbon
• Deforestation and Habitat Destruction
▫ Fewer plants mean less CO2 removed from
atmosphere
• Methane release
▫ Agriculture and animal, wetlands, leakages during
natural gas extraction, transportation, use

Humans affect the carbon cycle
• Today’s atmospheric carbon dioxide reservoir is the largest in the past 800,000 years

Photo from IPCC

The Keeling Curve

Effects of Climate ChangeEcosystem change
• Ranges being shifted
▫ Some butterflies, foxes, and alpine plants have
moved farther north or to higher, cooler areas
• Flowering earlier
• Loss of species▫ Polar Bears, penguins, golden toad
• Climate Change: marine ecosystems

Glaciers are melting
Why artic sea ice matters
1. It reflects sunlight
2. It influences ocean and air currents
3. Keeps methane locked away
4. It limits severe weather
5. It supports native people and wildlife
IPCC (2007)

Other Effects
• Sea Level Rise
▫ Melting of ice sheets
▫ Expansion of heated (warm) sea water
▫ Flooding of coastal communities
• Spread of diseases
• Increase of extreme weather events
• Precipitation has increased across the globe, on
averagehttp://news.nationalgeographic.com/2015/12/151229-before-after-earth-features/

Nitrogen Cycle• Nitrogen fixation:
▫ N2 plants by bacteria
• Nitrification:
▫ ammonium nitrite
nitrate
▫ Absorbed by plants
• Denitrification:
▫ Release N to atmosphere

Nitrogen Cycle• Nitrogen is used for proteins, DNA
• Nitrogen is found in atmosphere and is unusable
▫ Converted to a useable form through nitrogen
fixation
Special organisms/bacteria that convert
legumes
Lightning
▫ Animals get nitrogen from eating plants
• Returned to soil when animals urinates/dies
▫ Denitrification – nitrogen is converted back to gas

Humans affect the nitrogen cycle
• Fertilizers and animal waste
• Excess Nitrogen can cause Eutrophication
▫ causes aquatic life to die due to low levels of oxygen
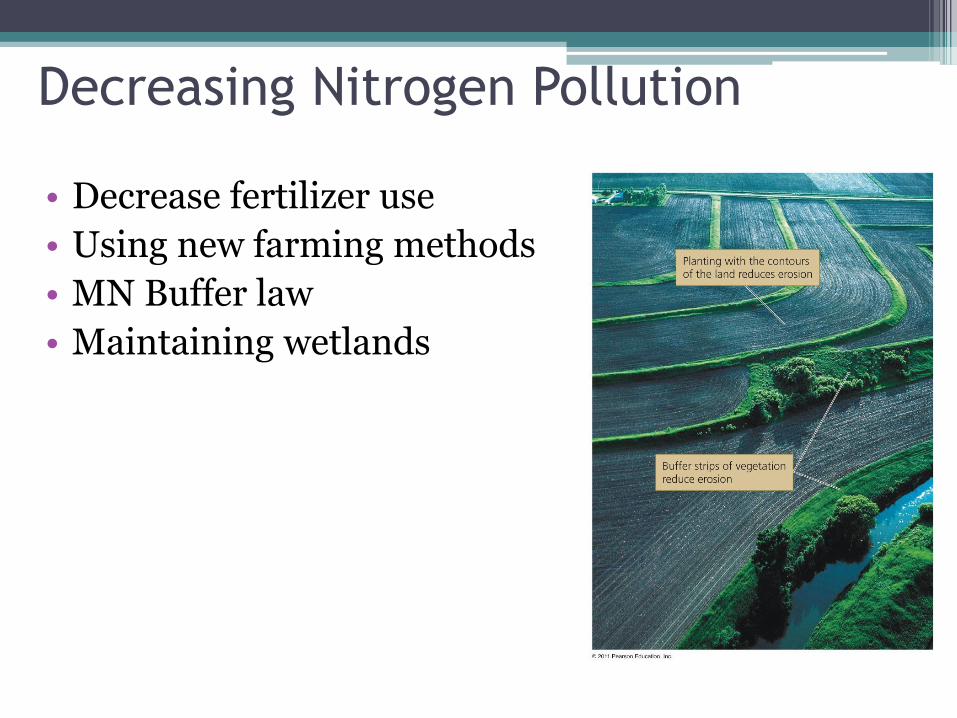
Decreasing Nitrogen Pollution
• Decrease fertilizer use
• Using new farming methods
• MN Buffer law
• Maintaining wetlands

Phosphorus Cycle