Embed Size (px)
DESCRIPTION
Chapter 54. Ecosystems. Ecosystems Microcosm: aquarium Lakes, forests. Figure 54.1. Dynamics. Energy flows Matter cycles. Ecosystem ecologists Monitor energy & matter. Tertiary consumers. Microorganisms and other detritivores. Secondary consumers. Primary consumers. Detritus. - PowerPoint PPT Presentation
Citation preview
Copyright © 2005 Pearson Education, Inc. publishing as Benjamin Cummings
PowerPoint Lectures for Biology, Seventh Edition
Neil Campbell and Jane Reece
Lectures by Chris Romero
Chapter 54Chapter 54
Ecosystems

Copyright © 2005 Pearson Education, Inc. publishing as Benjamin Cummings
• Ecosystems
• Microcosm: aquarium
• Lakes, forests
Figure 54.1

Copyright © 2005 Pearson Education, Inc. publishing as Benjamin Cummings
Dynamics
• Energy flows
• Matter cycles
Copyright © 2005 Pearson Education, Inc. publishing as Benjamin Cummings
• Ecosystem ecologists
• Monitor energy & matter

Copyright © 2005 Pearson Education, Inc. publishing as Benjamin Cummings
• Energy flows
• Light - heat
Figure 54.2
Microorganismsand other
detritivores
Detritus
Primary producers
Primary consumers
Secondaryconsumers
Tertiary consumers
Heat
Sun
Key
Chemical cycling
Energy flow

Copyright © 2005 Pearson Education, Inc. publishing as Benjamin Cummings
Decomposition – connects levels
• Detritivores, (bacteria, fungi) recycle chemical elements
Figure 54.3
Copyright © 2005 Pearson Education, Inc. publishing as Benjamin Cummings
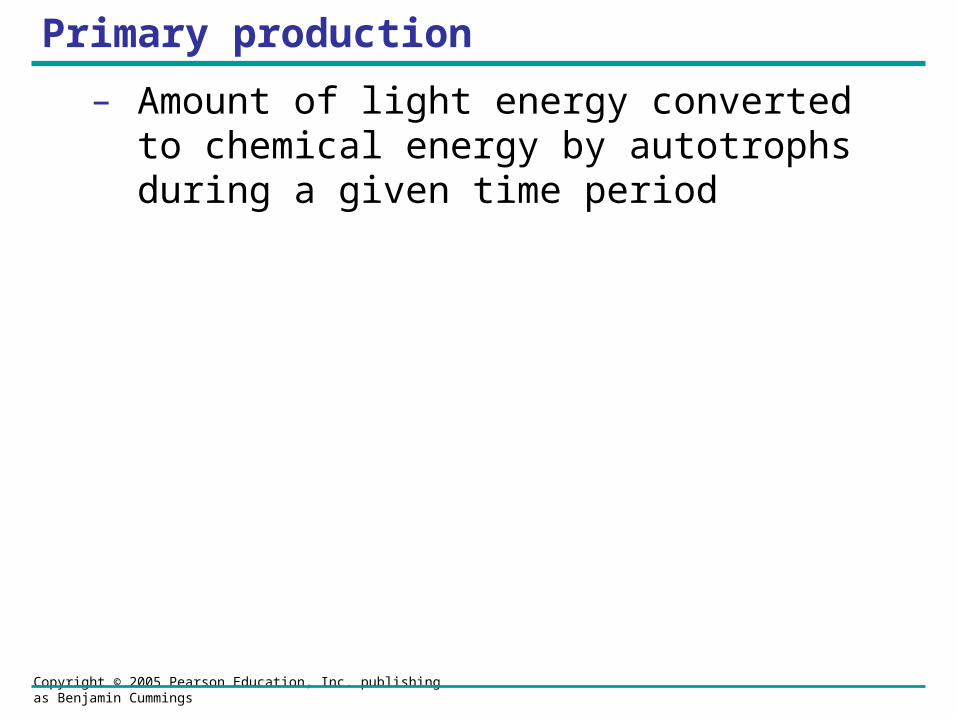
Primary production
– Amount of light energy converted to chemical energy by autotrophs during a given time period

Copyright © 2005 Pearson Education, Inc. publishing as Benjamin Cummings
Ecosystem Energy Budgets
• The extent of photosynthetic production
– Sets the spending limit for the energy budget of the entire ecosystem

Copyright © 2005 Pearson Education, Inc. publishing as Benjamin Cummings
The Global Energy Budget
• Only a small fraction of solar energy
– Actually strikes photosynthetic organisms

Copyright © 2005 Pearson Education, Inc. publishing as Benjamin Cummings
Gross and Net Primary Production
• GPP – total production
• Not all stored as organic material in growing plants

Copyright © 2005 Pearson Education, Inc. publishing as Benjamin Cummings
• NPP
– GPP minus energy used by 1o producers for respiration
• Only NPP is available to consumers

Copyright © 2005 Pearson Education, Inc. publishing as Benjamin Cummings
NPP varies in ecosystems– And in their contribution to the total NPP on Earth
Lake and stream
Open ocean
Continental shelf
Estuary
Algal beds and reefs
Upwelling zones
Extreme desert, rock, sand, ice
Desert and semidesert scrub
Tropical rain forest
Savanna
Cultivated land
Boreal forest (taiga)
Temperate grassland
Tundra
Tropical seasonal forestTemperate deciduous forest
Temperate evergreen forest
Swamp and marsh
Woodland and shrubland
0 10 20 30 40 50 60 0 500 1,000 1,500 2,000 2,500 0 5 10 15 20 25
Percentage of Earth’s netprimary production
Key
Marine
Freshwater (on continents)
Terrestrial
5.2
0.3
0.1
0.1
4.7
3.53.3
2.9
2.7
2.41.8
1.7
1.6
1.5
1.3
1.0
0.4
0.4
125
360
1,500
2,500
500
3.0
90
2,200
900
600
800
600
700
140
1,600
1,2001,300
2,000
250
5.6
1.2
0.9
0.1
0.040.9
22
7.99.1
9.6
5.4
3.50.6
7.1
4.9
3.8
2.3
0.3
65.0 24.4
Figure 54.4a–c
Percentage of Earth’ssurface area
(a) Average net primaryproduction (g/m2/yr)(b) (c)
Copyright © 2005 Pearson Education, Inc. publishing as Benjamin Cummings
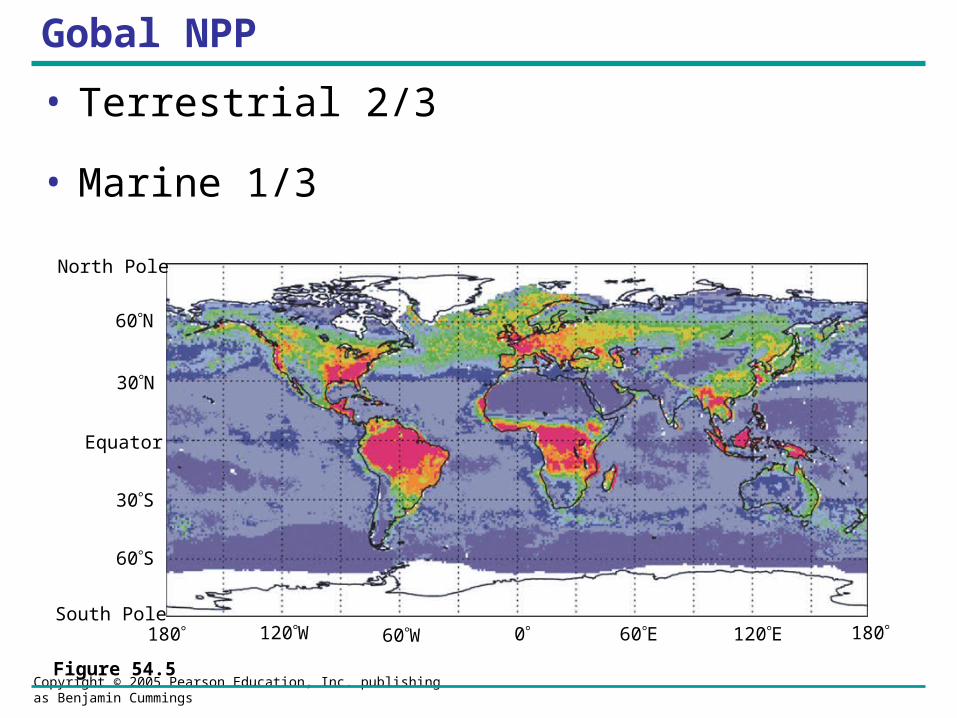
Gobal NPP
• Terrestrial 2/3
• Marine 1/3
Figure 54.5
180 120W 60W 0 60E 120E 180
North Pole
60N
30N
Equator
30S
60S
South Pole

Copyright © 2005 Pearson Education, Inc. publishing as Benjamin Cummings
Primary Production in Marine and Freshwater Ecosystems

Copyright © 2005 Pearson Education, Inc. publishing as Benjamin Cummings
Light Limitation
• light penetration
– Affects primary production throughout the photic zone of an ocean or lake
Copyright © 2005 Pearson Education, Inc. publishing as Benjamin Cummings
Nutrient limitation
• Limiting nutrient: element that must be added
– for production to increase in a particular area
• Nitrogen and phosphorous
– most often limit marine production
Copyright © 2005 Pearson Education, Inc. publishing as Benjamin Cummings
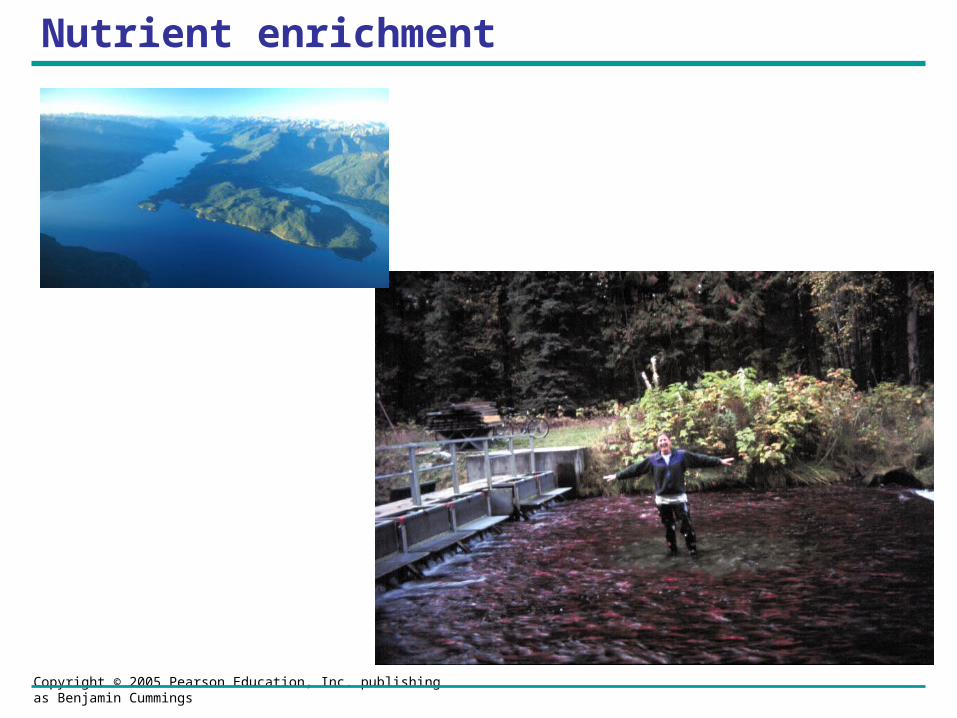
Nutrient enrichment

Copyright © 2005 Pearson Education, Inc. publishing as Benjamin Cummings
• Iron may limit PP
Table 54.1

Copyright © 2005 Pearson Education, Inc. publishing as Benjamin Cummings
• The addition of large amounts of nutrients to lakes
– Has a wide range of ecological impacts

Copyright © 2005 Pearson Education, Inc. publishing as Benjamin Cummings
Eutrophication
• Sewage runoff may cause eutrophication
Figure 54.7
Copyright © 2005 Pearson Education, Inc. publishing as Benjamin Cummings
Primary Production in Terrestrial and Wetland Ecosystems
• Climate factors such as temperature and moisture affect primary production on a large geographic scale

Copyright © 2005 Pearson Education, Inc. publishing as Benjamin Cummings
Evapotranspiration measurements
• Actual evapotranspiration
– amount of water annually transpired by plants and evaporated from a landscape
– related to net primary production
Figure 54.8Actual evapotranspiration (mm H2O/yr)
Tropical forest
Temperate forest
Mountain coniferous forest
Temperate grassland
Arctic tundra
Desertshrubland
Net
prim
ary
prod
uctio
n (g
/m2 /
yr)
1,000
2,000
3,000
0500 1,000 1,5000
Copyright © 2005 Pearson Education, Inc. publishing as Benjamin Cummings
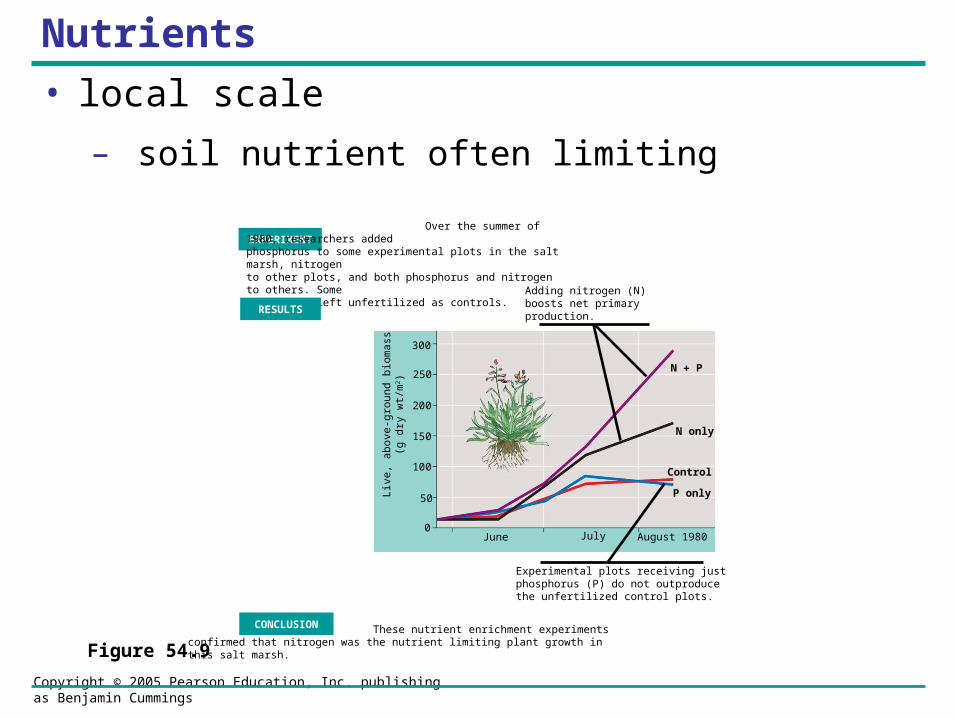
Nutrients
• local scale
– soil nutrient often limiting
Figure 54.9
EXPERIMENT Over the summer of 1980, researchers added phosphorus to some experimental plots in the salt marsh, nitrogento other plots, and both phosphorus and nitrogen to others. Some plots were left unfertilized as controls.
RESULTS
Experimental plots receiving just phosphorus (P) do not outproduce the unfertilized control plots.
CONCLUSION
Live
, ab
ove-
grou
nd b
iom
ass
(g d
ry w
t/m
2)
Adding nitrogen (N) boosts net primaryproduction.
300
250
200
150
100
50
0June July August 1980
N P
N only
Control
P only
These nutrient enrichment experiments confirmed that nitrogen was the nutrient limiting plant growth in this salt marsh.

Copyright © 2005 Pearson Education, Inc. publishing as Benjamin Cummings
Energy transfer
• Between trophic levels < 20% efficient
• 2o production
– amount of chemical energy in consumers’ food converted to own new biomass during a given period of time

Copyright © 2005 Pearson Education, Inc. publishing as Benjamin Cummings
Production Efficiency
• When a caterpillar feeds on a plant leaf
– Only about one-sixth of the energy in the leaf is used for secondary production
Figure 54.10
Plant materialeaten by caterpillar
Cellularrespiration
Growth (new biomass)
Feces100 J
33 J
200 J
67 J

Copyright © 2005 Pearson Education, Inc. publishing as Benjamin Cummings
Production efficiency of organism
– Fraction of energy stored in food that is not used for respiration

Copyright © 2005 Pearson Education, Inc. publishing as Benjamin Cummings
Trophic Efficiency and Ecological Pyramids
• Trophic efficiency
– percentage of production transferred from one trophic level to the next
– ranges from 5% to 20%

Copyright © 2005 Pearson Education, Inc. publishing as Benjamin Cummings
Pyramids of Production
Figure 54.11
Tertiaryconsumers
Secondaryconsumers
Primaryconsumers
Primaryproducers
1,000,000 J of sunlight
10 J
100 J
1,000 J
10,000 J
• Shows energy loss

Copyright © 2005 Pearson Education, Inc. publishing as Benjamin Cummings
Biomass pyramids
– Show a sharp decrease at successively higher trophic levels
Figure 54.12a
(a) Most biomass pyramids show a sharp decrease in biomass at successively higher trophic levels, as illustrated by data froma bog at Silver Springs, Florida.
Trophic level Dry weight(g/m2)
Primary producers
Tertiary consumers
Secondary consumers
Primary consumers
1.5
11
37809
Copyright © 2005 Pearson Education, Inc. publishing as Benjamin Cummings
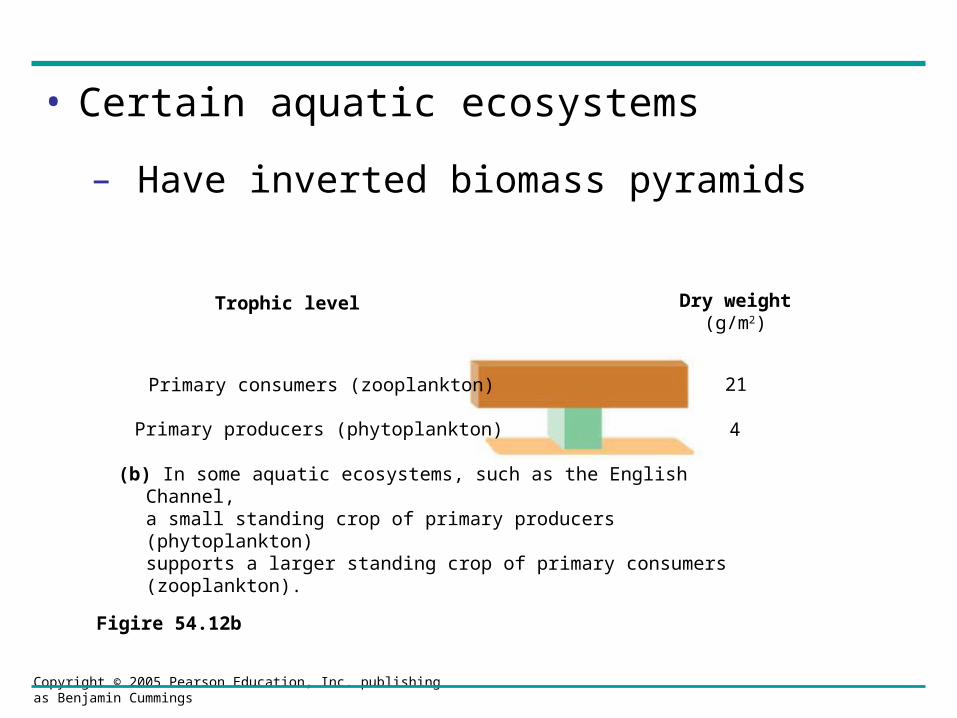
• Certain aquatic ecosystems
– Have inverted biomass pyramids
Figire 54.12b
Trophic level
Primary producers (phytoplankton)
Primary consumers (zooplankton)
(b) In some aquatic ecosystems, such as the English Channel, a small standing crop of primary producers (phytoplankton)supports a larger standing crop of primary consumers (zooplankton).
Dry weight(g/m2)
21
4

Copyright © 2005 Pearson Education, Inc. publishing as Benjamin Cummings
Pyramids of Numbers
Figure 54.13
Trophic level Number of individual organisms
Primary producers
Tertiary consumers
Secondary consumers
Primary consumers
3
354,904
708,624
5,842,424
Copyright © 2005 Pearson Education, Inc. publishing as Benjamin Cummings
Energy flow dynamics
– important for human population
• Eating meat
– Is a relatively inefficient way of tapping photosynthetic production

Copyright © 2005 Pearson Education, Inc. publishing as Benjamin Cummings
• Worldwide agriculture could successfully feed many more people
– If humans all fed more efficiently, eating only plant material
Figure 54.14
Trophic level
Secondaryconsumers
Primaryconsumers
Primaryproducers
Copyright © 2005 Pearson Education, Inc. publishing as Benjamin Cummings
The Green World Hypothesis
• Terrestrial herbivores consume relatively little plant biomass because they are held in check by a variety of factors
Copyright © 2005 Pearson Education, Inc. publishing as Benjamin Cummings
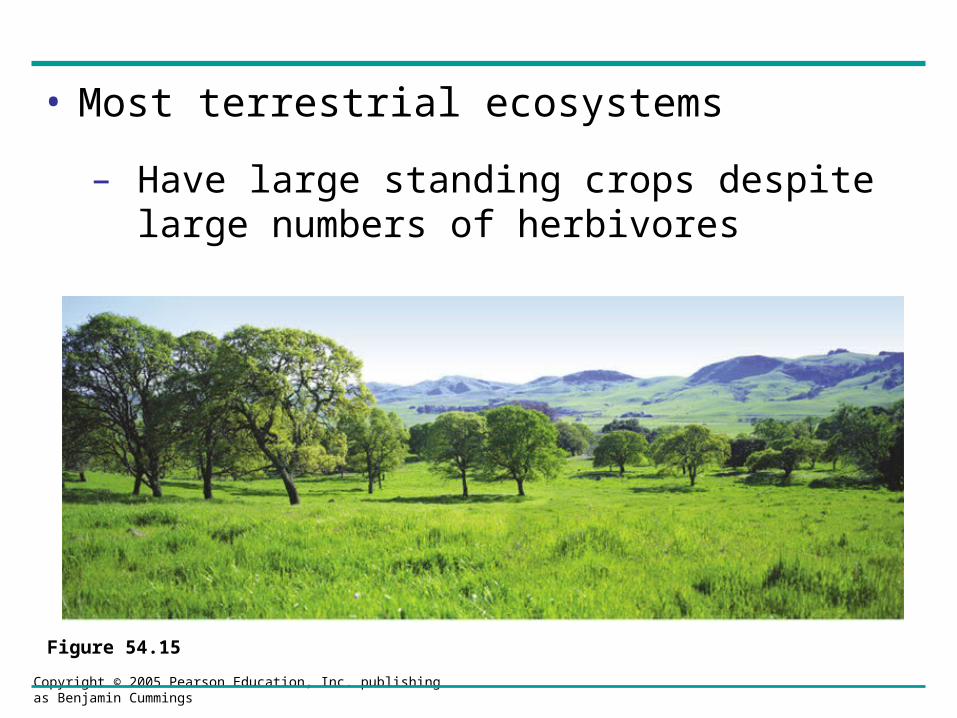
• Most terrestrial ecosystems
– Have large standing crops despite large numbers of herbivores
Figure 54.15

Copyright © 2005 Pearson Education, Inc. publishing as Benjamin Cummings
• Several factors keep herbivores in check
– Plant defenses
– Nutrients
– Abiotic factors
– Intraspecific competition
– Interspecific interactions

Copyright © 2005 Pearson Education, Inc. publishing as Benjamin Cummings
Biogeochemical cycles
• Biological and geochemical processes move nutrients between organic and inorganic parts of the ecosystem
• Life on Earth
– Depends on recycling of essential chemical elements
Copyright © 2005 Pearson Education, Inc. publishing as Benjamin Cummings
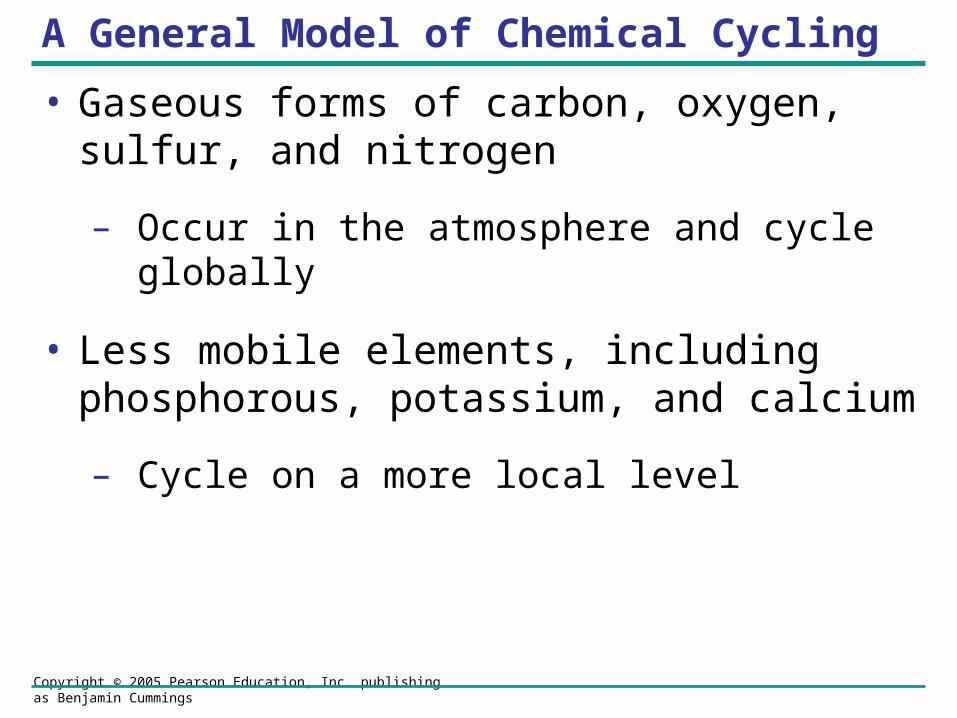
A General Model of Chemical Cycling
• Gaseous forms of carbon, oxygen, sulfur, and nitrogen
– Occur in the atmosphere and cycle globally
• Less mobile elements, including phosphorous, potassium, and calcium
– Cycle on a more local level

Copyright © 2005 Pearson Education, Inc. publishing as Benjamin Cummings
Model of nutrient cycling
– Includes main reservoirs of elements and processes that transfer elements between reservoirs
Figure 54.16
Organicmaterialsavailable
as nutrients
Livingorganisms,detritus
Organicmaterials
unavailableas nutrients
Coal, oil,peat
Inorganicmaterialsavailable
as nutrients
Inorganicmaterials
unavailableas nutrients
Atmosphere,soil, water
Mineralsin rocksFormation of
sedimentary rock
Weathering,erosion
Respiration,decomposition,excretion
Burningof fossil fuels
Fossilization
Reservoir a Reservoir b
Reservoir c Reservoir d
Assimilation, photosynthesis

Copyright © 2005 Pearson Education, Inc. publishing as Benjamin Cummings
• All elements
– Cycle between organic and inorganic reservoirs

Copyright © 2005 Pearson Education, Inc. publishing as Benjamin Cummings
Biogeochemical Cycles
• The water cycle and the carbon cycle
Figure 54.17
Transportover land
Solar energy
Net movement ofwater vapor by wind
Precipitationover ocean
Evaporationfrom ocean
Evapotranspirationfrom land
Precipitationover land
Percolationthroughsoil
Runoff andgroundwater
CO2 in atmosphere
Photosynthesis
Cellularrespiration
Burning offossil fuelsand wood
Higher-levelconsumersPrimary
consumers
DetritusCarbon compounds in water
Decomposition
THE WATER CYCLE THE CARBON CYCLE
Copyright © 2005 Pearson Education, Inc. publishing as Benjamin Cummings
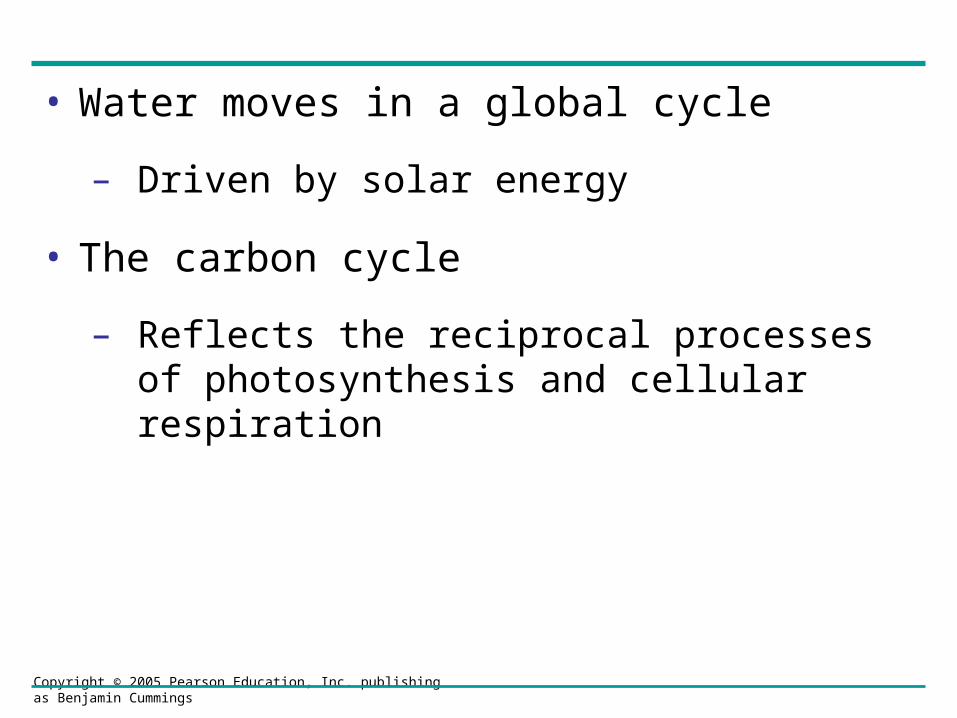
• Water moves in a global cycle
– Driven by solar energy
• The carbon cycle
– Reflects the reciprocal processes of photosynthesis and cellular respiration

Copyright © 2005 Pearson Education, Inc. publishing as Benjamin Cummings
• The nitrogen cycle and the phosphorous cycle
Figure 54.17
N2 in atmosphere
Denitrifyingbacteria
Nitrifyingbacteria
Nitrifyingbacteria
Nitrification
Nitrogen-fixingsoil bacteria
Nitrogen-fixingbacteria in rootnodules of legumes
Decomposers
Ammonification
Assimilation
NH3 NH4+
NO3
NO2
Rain
Plants
Consumption
Decomposition
Geologicuplift
Weatheringof rocks
Runoff
SedimentationPlant uptakeof PO4
3
Soil
Leaching
THE NITROGEN CYCLE THE PHOSPHORUS CYCLE
Copyright © 2005 Pearson Education, Inc. publishing as Benjamin Cummings
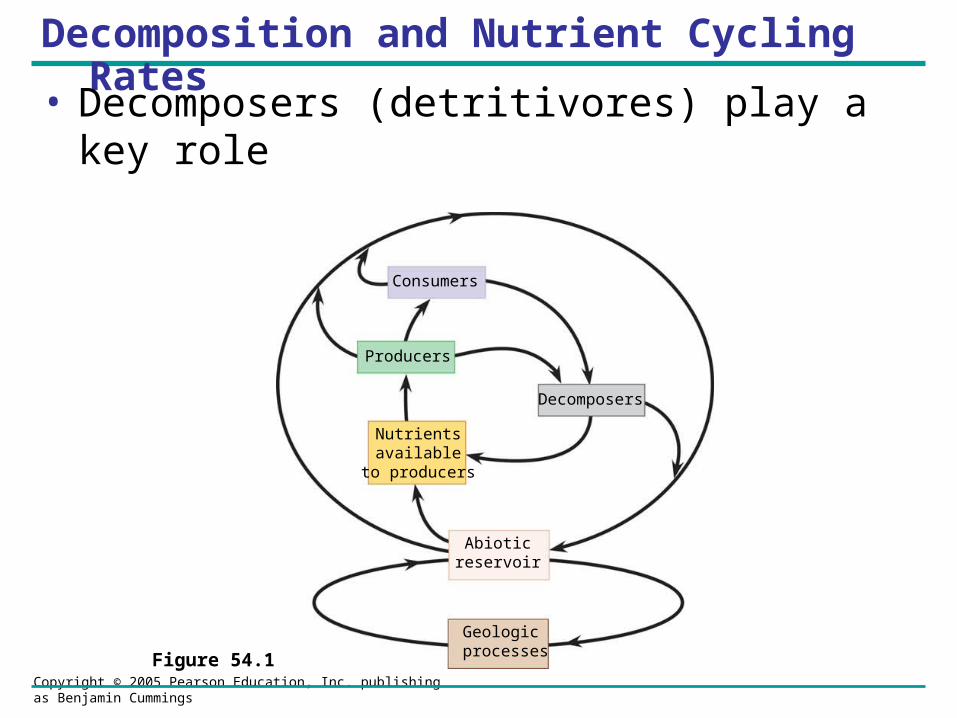
Decomposition and Nutrient Cycling Rates
• Decomposers (detritivores) play a key role
Figure 54.18
Consumers
Producers
Nutrientsavailable
to producers
Abioticreservoir
Geologicprocesses
Decomposers
Copyright © 2005 Pearson Education, Inc. publishing as Benjamin Cummings
Nutrient cycling rates
– Are extremely variable, mostly as a result of differences in rates of decomposition
Copyright © 2005 Pearson Education, Inc. publishing as Benjamin Cummings
Vegetation and Nutrient Cycling: The Hubbard Brook Experimental Forest
• Nutrient cycling
– Is strongly regulated by vegetation

Copyright © 2005 Pearson Education, Inc. publishing as Benjamin Cummings
Hubbard Brook
• The research team constructed a dam on the site
– To monitor water and mineral loss
Figure 54.19a
(a) Concrete dams and weirs built across streams at the bottom of watersheds enabled researchers to monitor the outflow of water and nutrients from the ecosystem.

Copyright © 2005 Pearson Education, Inc. publishing as Benjamin Cummings
• Trees in one valley were cut down
• Sprayed with herbicides
Figure 54.19b(b) One watershed was clear cut to study the effects of the loss
of vegetation on drainage and nutrient cycling.
Copyright © 2005 Pearson Education, Inc. publishing as Benjamin Cummings
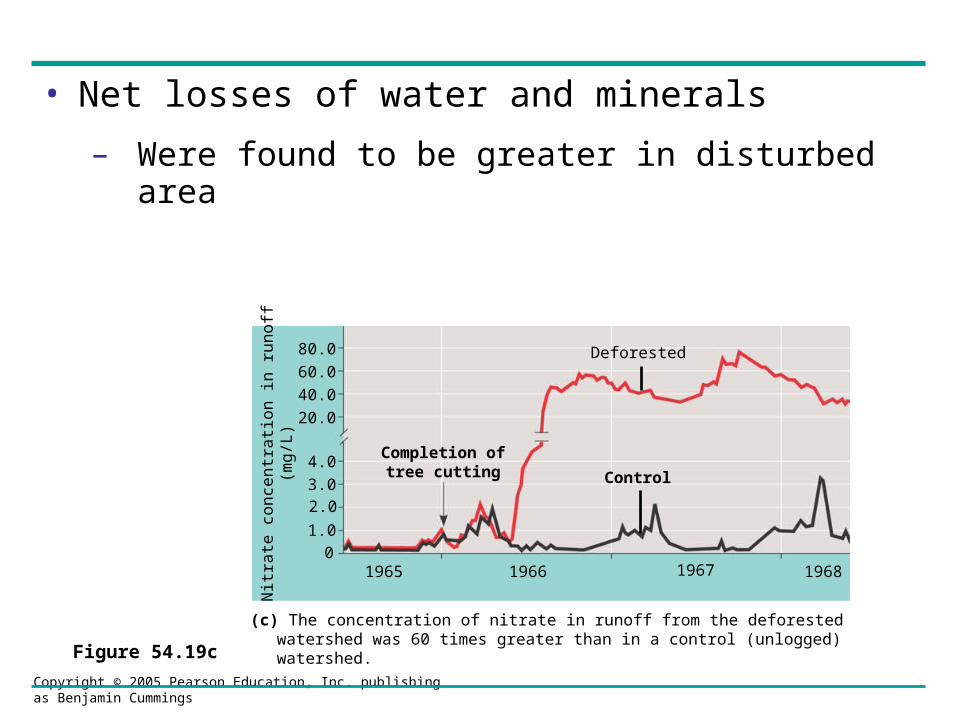
• Net losses of water and minerals
– Were found to be greater in disturbed area
Figure 54.19c(c) The concentration of nitrate in runoff from the deforested watershed was 60 times
greater than in a control (unlogged) watershed.
Nitr
ate
co
nce
ntr
atio
n in
ru
no
ff(m
g/L
)
Deforested
Control
Completion oftree cutting
1965 1966 1967 1968
80.0
60.0
40.0
20.0
4.0
3.02.0
1.0
0
Copyright © 2005 Pearson Education, Inc. publishing as Benjamin Cummings
• We are disrupting chemical cycles throughout the biosphere
• With human population increase
– Our activities disrupted trophic structure, energy flow, and chemical cycling of ecosystems in most parts of the world

Copyright © 2005 Pearson Education, Inc. publishing as Benjamin Cummings
Nutrient Enrichment
• Transporting nutrients
• Adding new materials (some toxic)
Copyright © 2005 Pearson Education, Inc. publishing as Benjamin Cummings
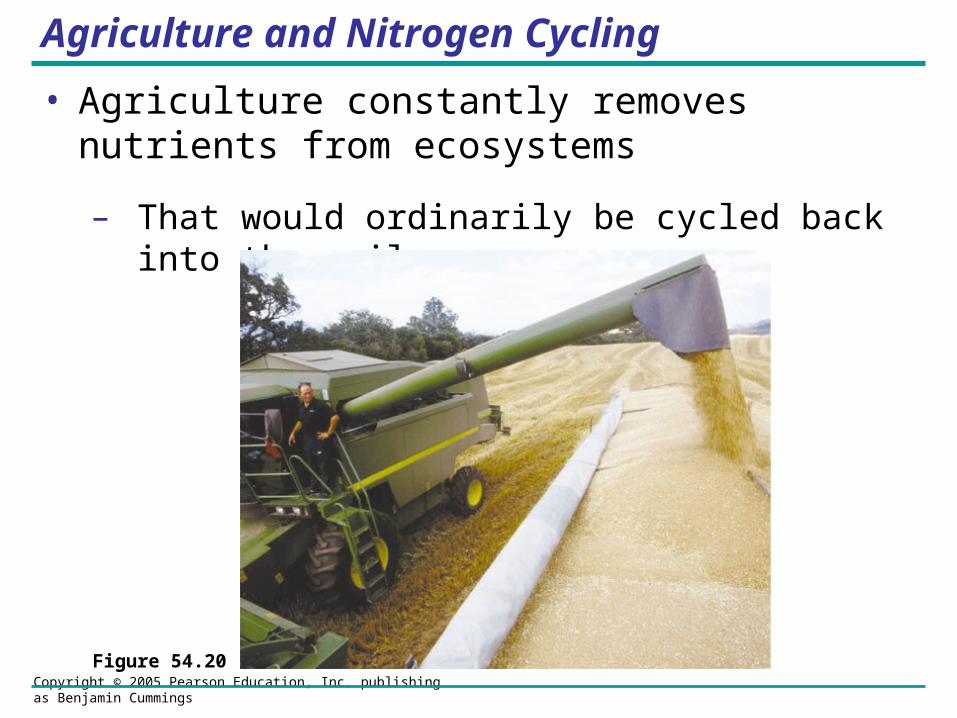
Agriculture and Nitrogen Cycling
• Agriculture constantly removes nutrients from ecosystems
– That would ordinarily be cycled back into the soil
Figure 54.20
Copyright © 2005 Pearson Education, Inc. publishing as Benjamin Cummings
• Agriculture has a great impact on nitrogen cycle
• Fertilizer used to replace nitrogen
– But the effects on an ecosystem can be harmful

Copyright © 2005 Pearson Education, Inc. publishing as Benjamin Cummings
Contamination of Aquatic Ecosystems
• The critical load for a nutrient
– Is the amount of that nutrient that can be absorbed by plants in an ecosystem without damaging it

Copyright © 2005 Pearson Education, Inc. publishing as Benjamin Cummings
• When critical load exceeded
– Remaining nutrients can contaminate groundwater and freshwater and marine ecosystems

Copyright © 2005 Pearson Education, Inc. publishing as Benjamin Cummings
• Sewage runoff contaminates freshwater ecosystems
• Eutrophication
• Change in species composition or species loss

Copyright © 2005 Pearson Education, Inc. publishing as Benjamin Cummings
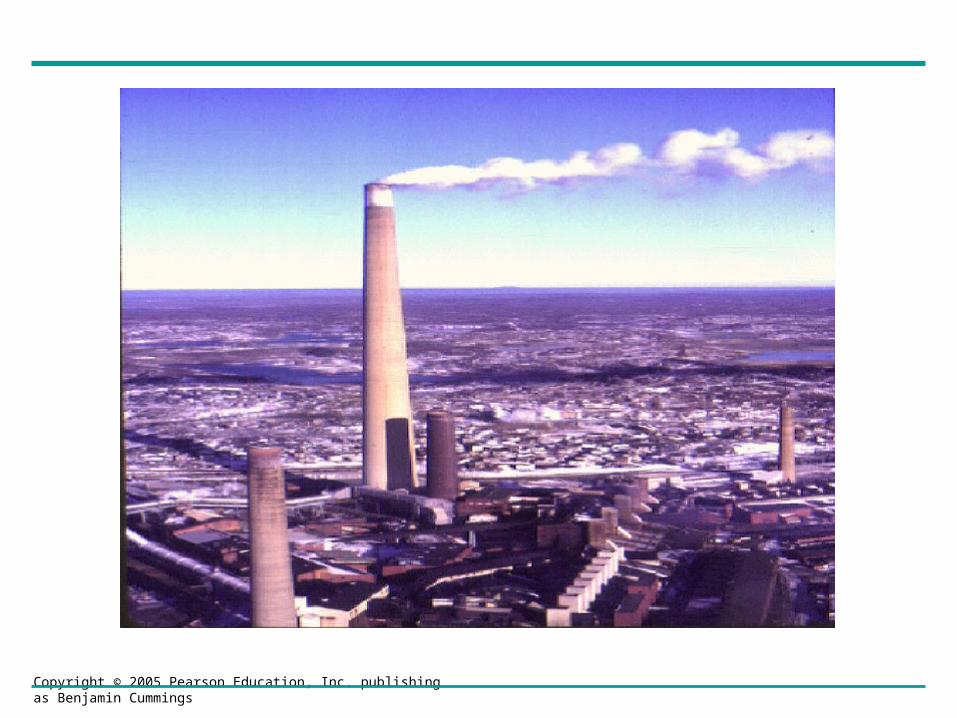
Acid Precipitation
• Combustion of fossil fuels
– Is the main cause of acid precipitation
Copyright © 2005 Pearson Education, Inc. publishing as Benjamin Cummings
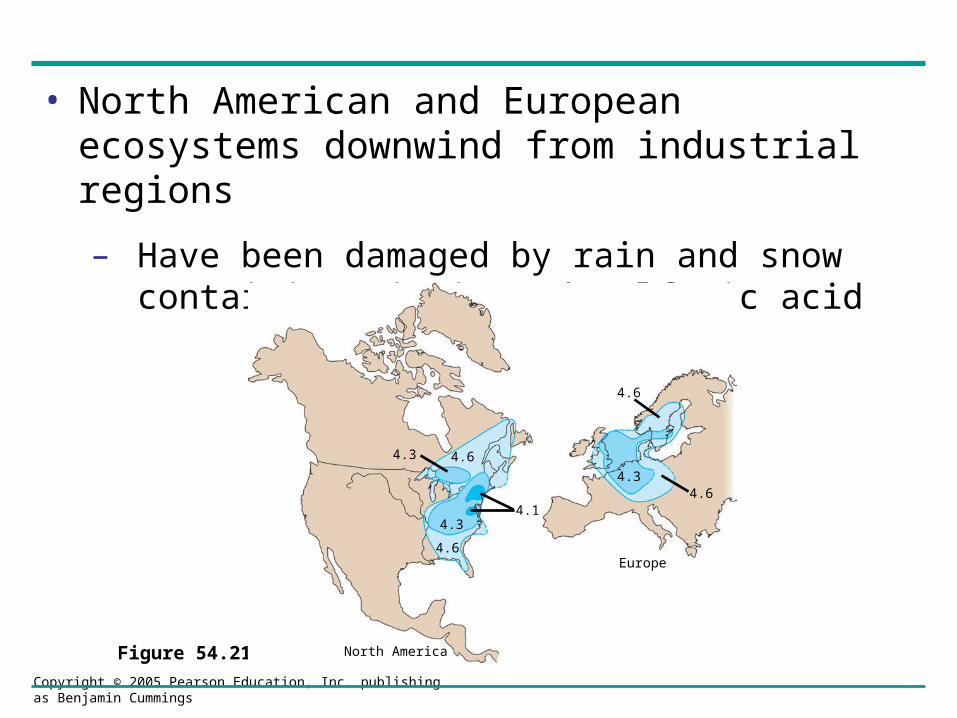
• North American and European ecosystems downwind from industrial regions
– Have been damaged by rain and snow containing nitric and sulfuric acid
Figure 54.21
4.6
4.64.3
4.14.3
4.6
4.64.3
Europe
North America
Copyright © 2005 Pearson Education, Inc. publishing as Benjamin Cummings

Copyright © 2005 Pearson Education, Inc. publishing as Benjamin Cummings

Copyright © 2005 Pearson Education, Inc. publishing as Benjamin Cummings
• Environmental regulations and new industrial technologies
– Have allowed many developed countries to reduce sulfur dioxide emissions in the past 30 years

Copyright © 2005 Pearson Education, Inc. publishing as Benjamin Cummings
Toxins in the Environment
• Humans release an immense variety of toxic chemicals
– Including thousands of synthetics previously unknown to nature
• One of the reasons such toxins are so harmful
– Is that they become more concentrated in successive trophic levels of a food web
Copyright © 2005 Pearson Education, Inc. publishing as Benjamin Cummings
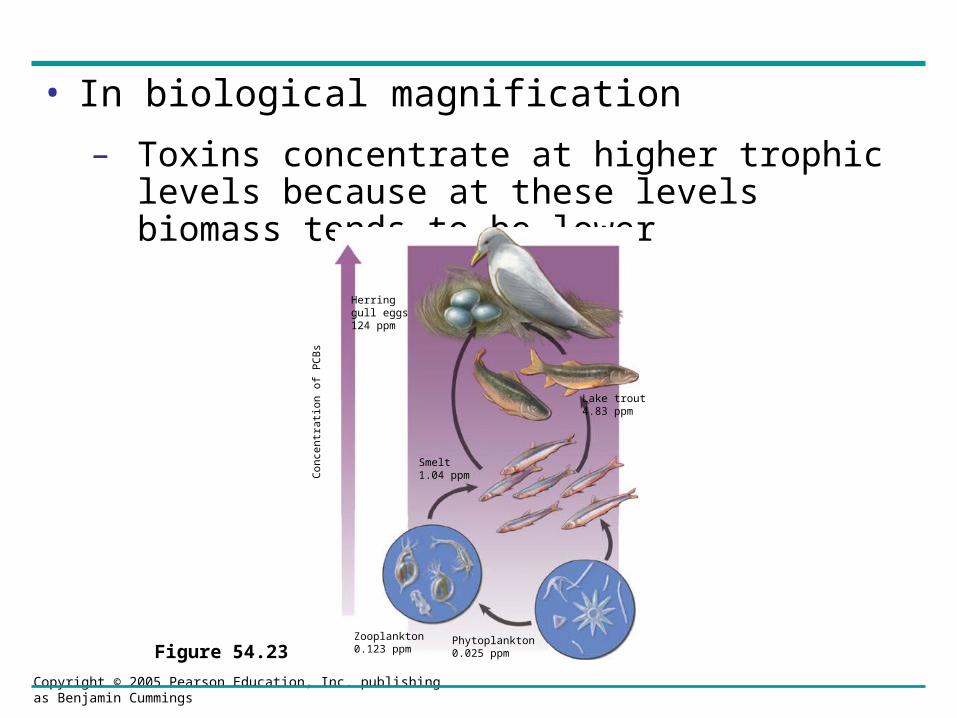
• In biological magnification
– Toxins concentrate at higher trophic levels because at these levels biomass tends to be lower
Figure 54.23
Con
cent
ratio
n of
PC
Bs
Herringgull eggs124 ppm
Zooplankton 0.123 ppm
Phytoplankton 0.025 ppm
Lake trout 4.83 ppm
Smelt 1.04 ppm

Copyright © 2005 Pearson Education, Inc. publishing as Benjamin Cummings
• In some cases, harmful substances
– Persist for long periods of time in an ecosystem and continue to cause harm
Copyright © 2005 Pearson Education, Inc. publishing as Benjamin Cummings
Atmospheric Carbon Dioxide
• One pressing problem caused by human activities
– Is the rising level of atmospheric carbon dioxide
Copyright © 2005 Pearson Education, Inc. publishing as Benjamin Cummings
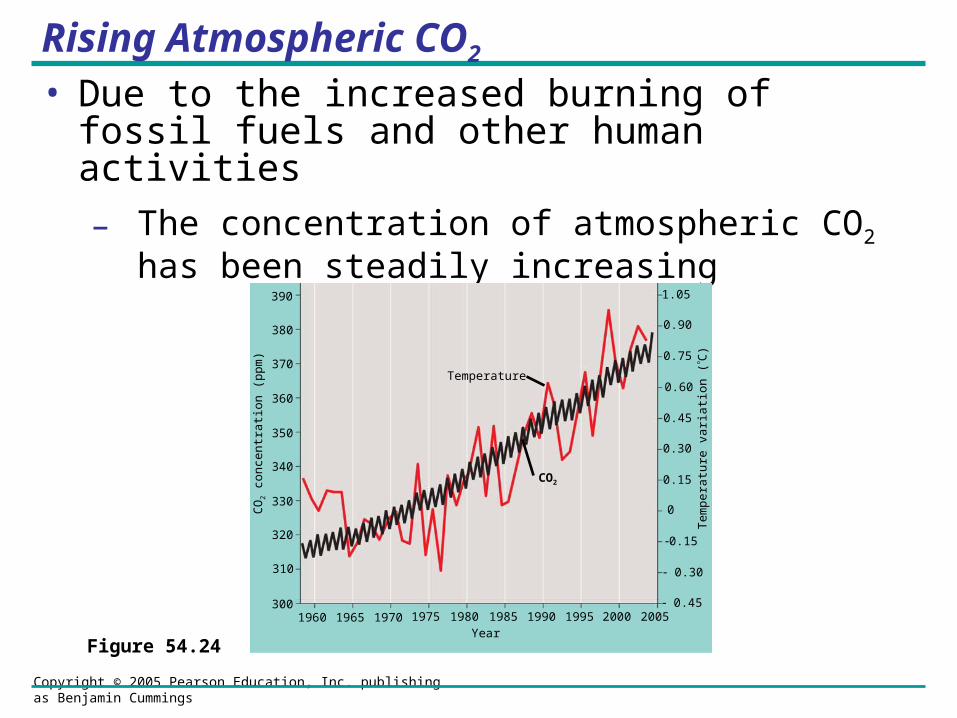
Rising Atmospheric CO2
• Due to the increased burning of fossil fuels and other human activities
– The concentration of atmospheric CO2 has been steadily increasing
Figure 54.24
CO
2 c
onc
en
trat
ion
(pp
m)
390
380
370
360
350
340
330
320
310
3001960 1965 1970 1975 1980 1985 1990 1995 2000 2005
1.05
0.90
0.75
0.60
0.45
0.30
0.15
0
0.15
0.30
0.45
Te
mp
era
ture
va
ria
tion
(C
)
Temperature
CO2
Year
Copyright © 2005 Pearson Education, Inc. publishing as Benjamin Cummings
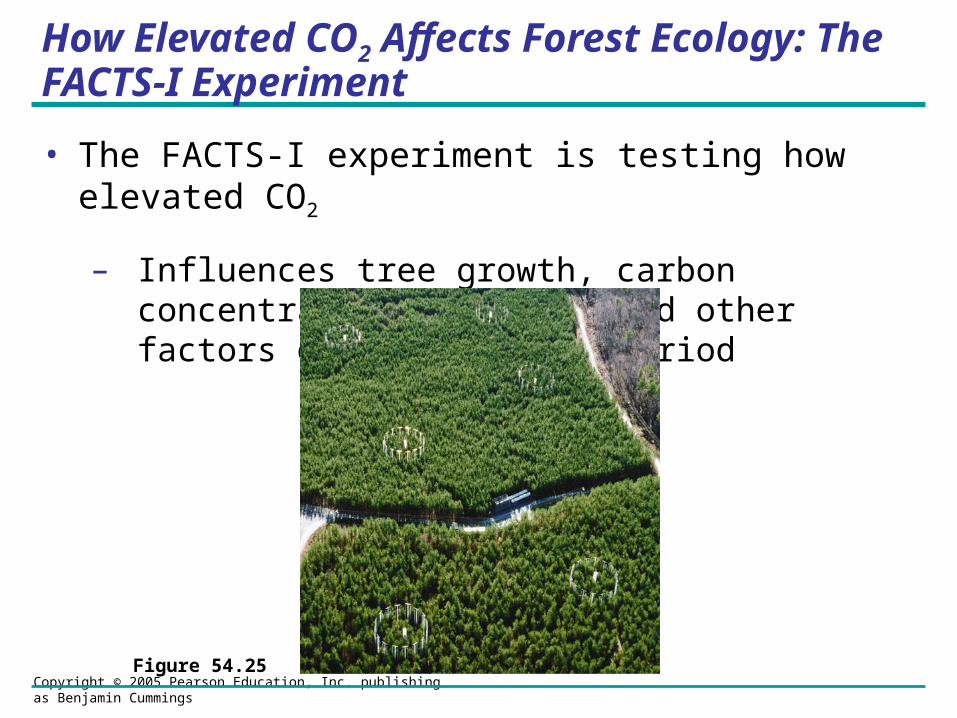
How Elevated CO2 Affects Forest Ecology: The FACTS-I Experiment
• The FACTS-I experiment is testing how elevated CO2
– Influences tree growth, carbon concentration in soils, and other factors over a ten-year period
Figure 54.25

Copyright © 2005 Pearson Education, Inc. publishing as Benjamin Cummings
The Greenhouse Effect and Global Warming
• The greenhouse effect is caused by atmospheric CO2
– But is necessary to keep the surface of the Earth at a habitable temperature

Copyright © 2005 Pearson Education, Inc. publishing as Benjamin Cummings
• Increased levels of atmospheric CO2 are magnifying the greenhouse effect
– Which could cause global warming and significant climatic change
Copyright © 2005 Pearson Education, Inc. publishing as Benjamin Cummings
Depletion of Atmospheric Ozone
• Life on Earth is protected from the damaging effects of UV radiation
– By a protective layer or ozone molecules present in the atmosphere
Copyright © 2005 Pearson Education, Inc. publishing as Benjamin Cummings
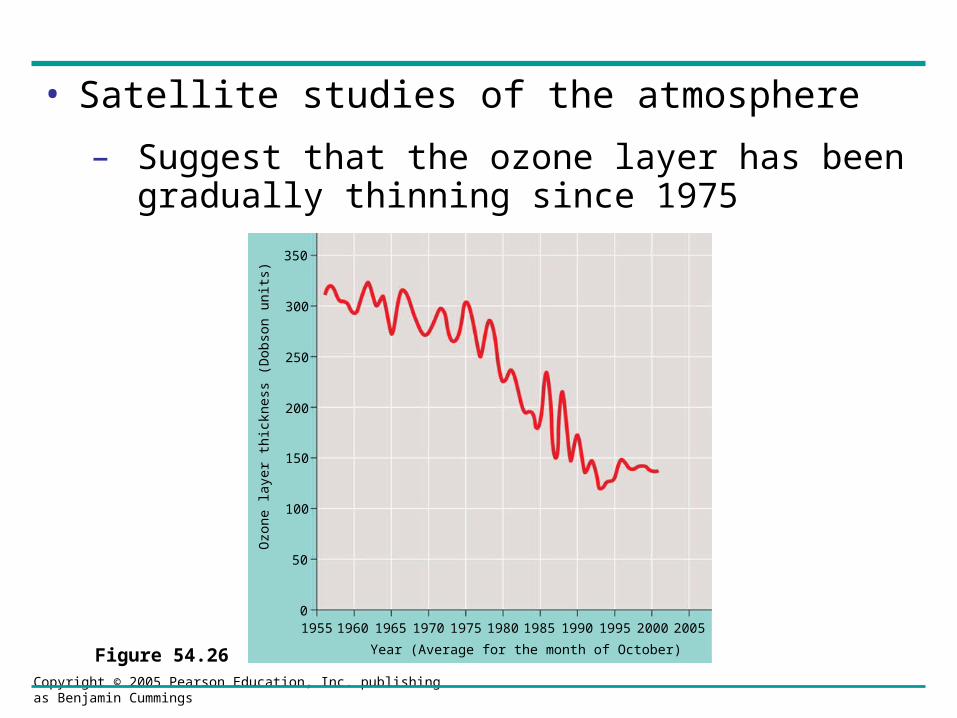
• Satellite studies of the atmosphere
– Suggest that the ozone layer has been gradually thinning since 1975
Figure 54.26
Ozo
ne la
yer
thic
knes
s (D
obso
n un
its)
Year (Average for the month of October)
350
300
250
200
150
100
50
01955 1960 1965 1970 1975 1980 1985 1990 1995 2000 2005
Copyright © 2005 Pearson Education, Inc. publishing as Benjamin Cummings
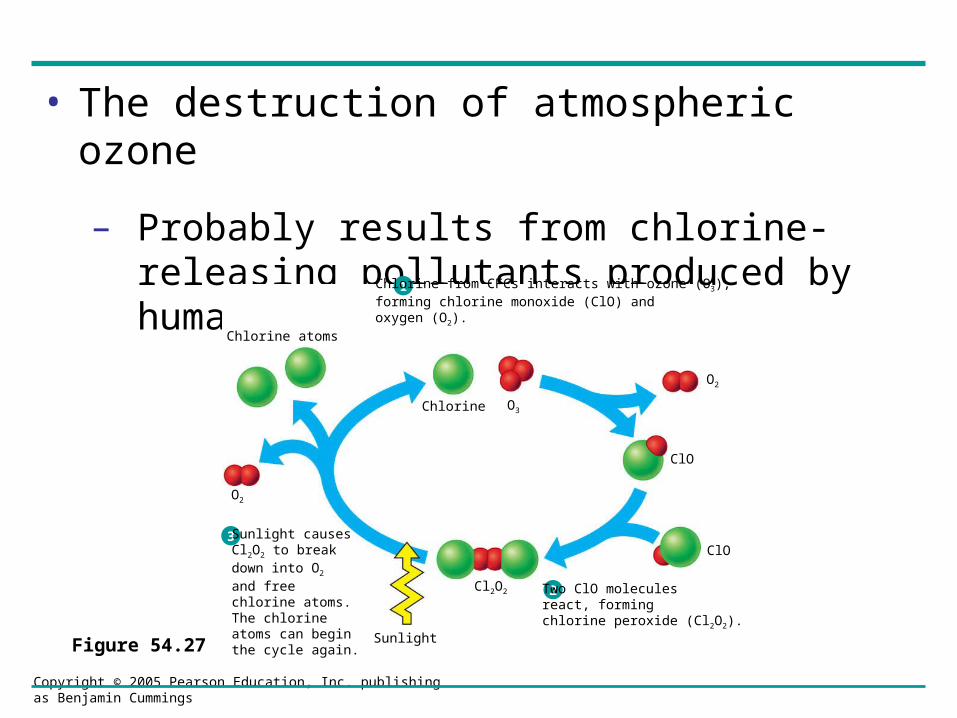
• The destruction of atmospheric ozone
– Probably results from chlorine-releasing pollutants produced by human activity
Figure 54.27
1
2
3
Chlorine from CFCs interacts with ozone (O3),forming chlorine monoxide (ClO) and oxygen (O2).
Two ClO molecules react, forming chlorine peroxide (Cl2O2).
Sunlight causes Cl2O2 to break down into O2 and free chlorine atoms. The chlorine atoms can begin the cycle again.
Sunlight
Chlorine O3
O2
ClO
ClO
Cl2O2
O2
Chlorine atoms
Copyright © 2005 Pearson Education, Inc. publishing as Benjamin Cummings
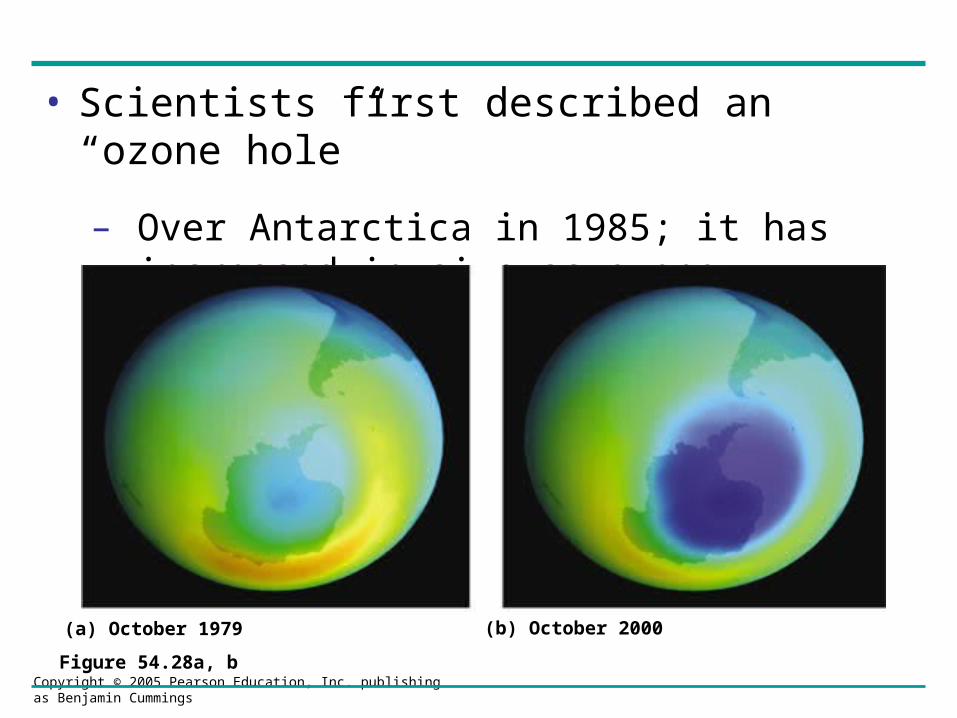
• Scientists first described an “ozone hole”
– Over Antarctica in 1985; it has increased in size as ozone depletion has increased
Figure 54.28a, b
(a) October 1979 (b) October 2000