Embed Size (px)
Citation preview
5 Tourism accommodation infrastructure
ƨ Summary
Available, high-quality, and affordable accommodation is very important for building positive visitor experiences.
Though demand for hotel accommodation has grown significantly over the past five years, there has not been a concomitant increase in hotel capacity. This has increased occupancy rates in peak seasons. This is most evident in Queenstown and Auckland.
The pressure on the Queenstown commercial accommodation stock is also spilling over to private non-commercial accommodation. In the holiday home booking website analysed, the number of private non-commercial rooms available in the Queenstown/Wanaka region is similar to the number available in Auckland, and offered prices are on average higher.
Hotel construction appears to be responding to demand in Auckland, with planned developments estimated to increase the number of hotel rooms by 20 per cent. Earthquake-damaged Christchurch has a similar percentage of growth planned, but other regions are significantly less than that. The vast majority of planned hotel development expenditure is in Auckland, and is for large high-rise buildings.
5.1 Accommodation infrastructure demand
5.1.1 Guest nights
Hotels make up only a small proportion of the overall number of accommodation operators in the country, but they make up the significant proportion of all guest nights. Visitors who stay in hotels also tend to spend more, having a larger economic impact.
For commercial accommodation, hotels made up approximately 35.5 per cent of all guest nights in New Zealand in the January 2016 year. When looked at by Regional Tourism Organisation (RTO), hotels are concentrated in the urban tourism centres of Auckland, Canterbury, Queenstown, Wellington and Rotorua. Around 59.7 per cent of Auckland guest nights (4.3 million) are for hotels. In terms of magnitude, however, 33 per cent of all hotel guest nights are based in Auckland.
In smaller cities and regions, motels make up a major part of tourist accommodation. In overall magnitude, Auckland remains the largest motel guest night provider in the country (with 1.6 million guest nights). Canterbury is not far behind with 1.3 million guest nights. In Waikato, Hawke’s Bay and Taupo, motels are the most popular, with 46, 51.7 and 47.8 per cent of total guest nights, respectively.
Holiday parks are important in some parts of the country. Northland is the largest provider of holiday park guest nights, at 695,000, while in Canterbury and Nelson-Tasman, holiday parks are significant (at 720,000 and 530,000, respectively). In the Coromandel, holiday parks make up over half of all guest nights (at 57 per cent).
MINISTRY OF BUSINESS, INNOVATION AND EMPLOYMENT AUGUST 2016TOURISM INSIGHT SERIESTOURISM INFRASTRUCTURE
36
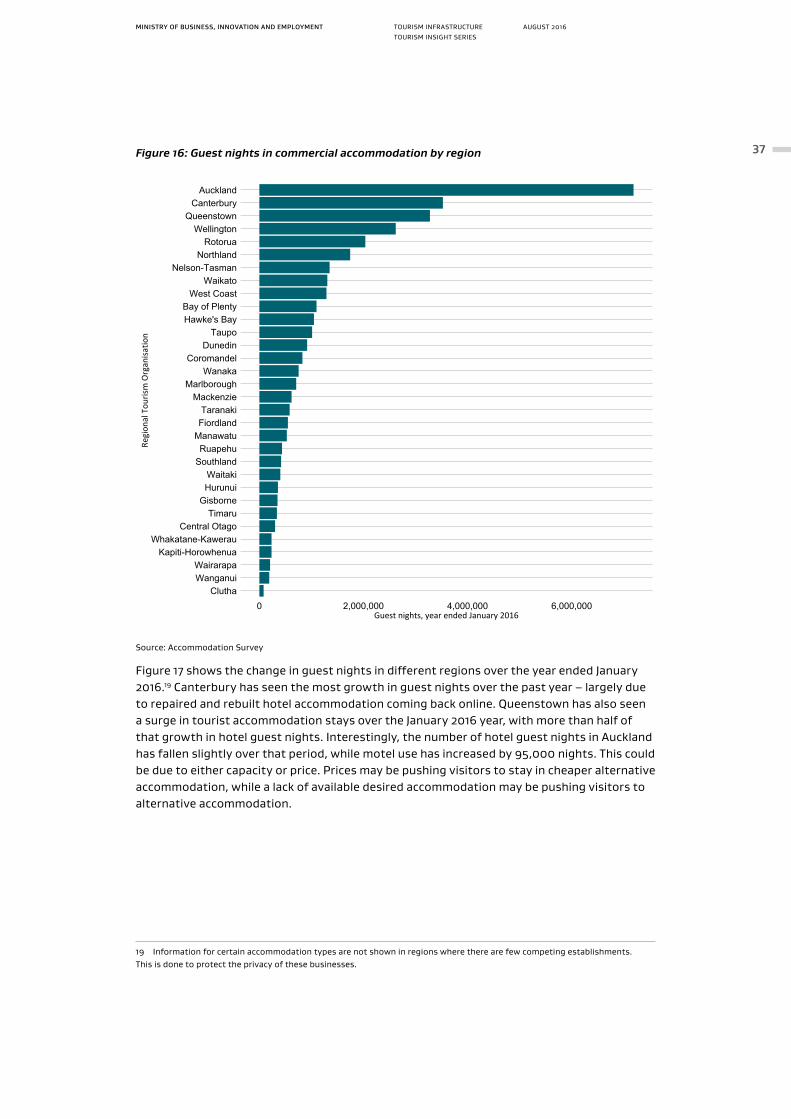
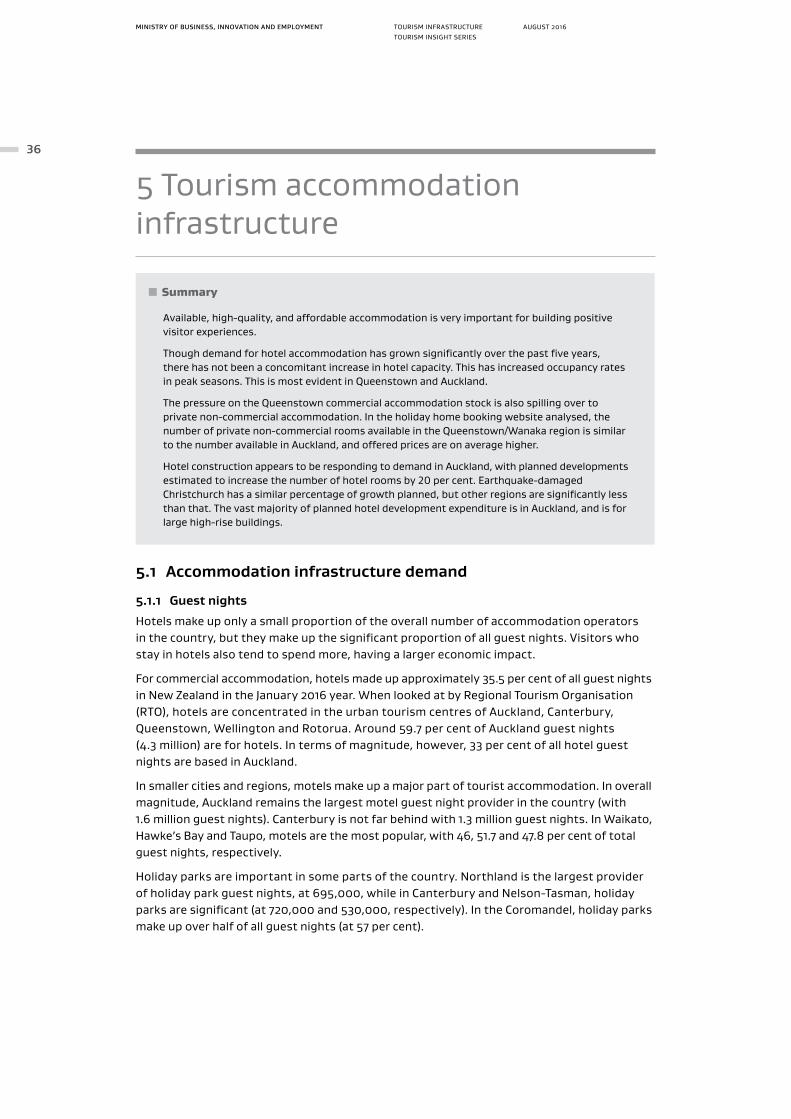
Figure 16: Guest nights in commercial accommodation by region
CluthaWanganuiWairarapa
Kapiti-HorowhenuaWhakatane-Kawerau
Central OtagoTimaru
GisborneHurunuiWaitaki
SouthlandRuapehu
ManawatuFiordlandTaranaki
MackenzieMarlborough
WanakaCoromandel
DunedinTaupo
Hawke's BayBay of Plenty
West CoastWaikato
Nelson-TasmanNorthland
RotoruaWellington
QueenstownCanterbury
Auckland
0 2,000,000 4,000,000 6,000,000Guest nights, year ended January 2016
Regi
onal
Tou
rism
Org
anisa
tion
Source: Accommodation Survey
Figure 17 shows the change in guest nights in different regions over the year ended January 2016.19 Canterbury has seen the most growth in guest nights over the past year – largely due to repaired and rebuilt hotel accommodation coming back online. Queenstown has also seen a surge in tourist accommodation stays over the January 2016 year, with more than half of that growth in hotel guest nights. Interestingly, the number of hotel guest nights in Auckland has fallen slightly over that period, while motel use has increased by 95,000 nights. This could be due to either capacity or price. Prices may be pushing visitors to stay in cheaper alternative accommodation, while a lack of available desired accommodation may be pushing visitors to alternative accommodation.
19 Information for certain accommodation types are not shown in regions where there are few competing establishments. This is done to protect the privacy of these businesses.
MINISTRY OF BUSINESS, INNOVATION AND EMPLOYMENT AUGUST 2016TOURISM INSIGHT SERIESTOURISM INFRASTRUCTURE
37
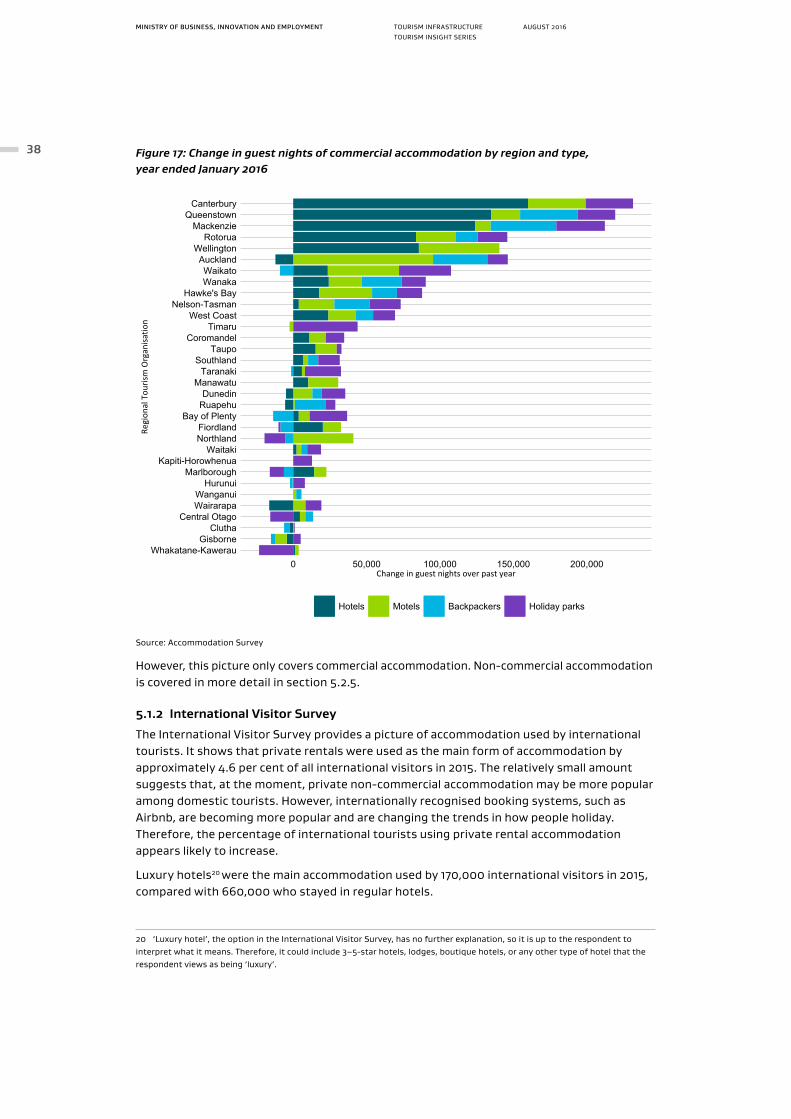
Figure 17: Change in guest nights of commercial accommodation by region and type, year ended January 2016
Whakatane-KawerauGisborne
CluthaCentral Otago
WairarapaWanganui
HurunuiMarlborough
Kapiti-HorowhenuaWaitaki
NorthlandFiordland
Bay of PlentyRuapehuDunedin
ManawatuTaranaki
SouthlandTaupo
CoromandelTimaru
West CoastNelson-Tasman
Hawke's BayWanakaWaikato
AucklandWellington
RotoruaMackenzie
QueenstownCanterbury
0 50,000 100,000 150,000 200,000Change in guest nights over past year
Regi
onal
Tou
rism
Org
anisa
tion
Hotels Motels Backpackers Holiday parks
Source: Accommodation Survey
However, this picture only covers commercial accommodation. Non-commercial accommodation is covered in more detail in section 5.2.5.
5.1.2 International Visitor Survey
The International Visitor Survey provides a picture of accommodation used by international tourists. It shows that private rentals were used as the main form of accommodation by approximately 4.6 per cent of all international visitors in 2015. The relatively small amount suggests that, at the moment, private non-commercial accommodation may be more popular among domestic tourists. However, internationally recognised booking systems, such as Airbnb, are becoming more popular and are changing the trends in how people holiday. Therefore, the percentage of international tourists using private rental accommodation appears likely to increase.
Luxury hotels20 were the main accommodation used by 170,000 international visitors in 2015, compared with 660,000 who stayed in regular hotels.
20 ‘Luxury hotel’, the option in the International Visitor Survey, has no further explanation, so it is up to the respondent to interpret what it means. Therefore, it could include 3–5-star hotels, lodges, boutique hotels, or any other type of hotel that the respondent views as being ‘luxury’.
MINISTRY OF BUSINESS, INNOVATION AND EMPLOYMENT AUGUST 2016TOURISM INSIGHT SERIESTOURISM INFRASTRUCTURE
38
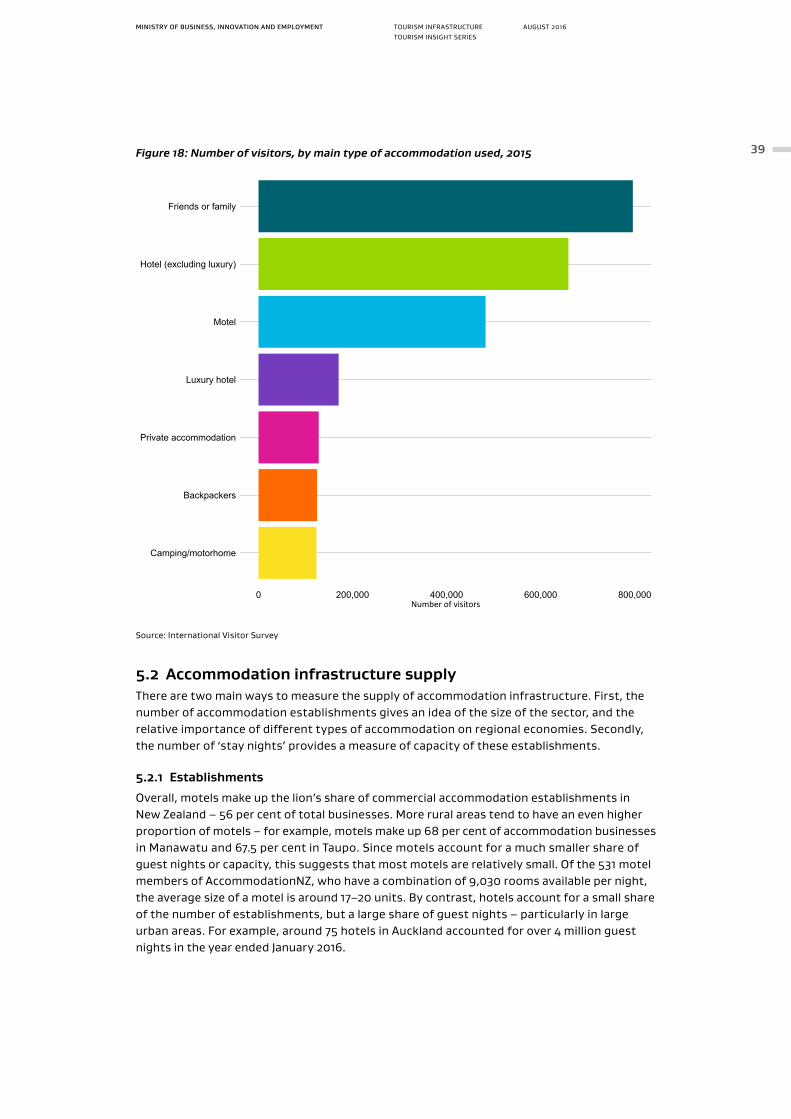
Figure 18: Number of visitors, by main type of accommodation used, 2015
Camping/motorhome
Backpackers
Private accommodation
Luxury hotel
Motel
Hotel (excluding luxury)
Friends or family
0 200,000 400,000 600,000 800,000Number of visitors
Source: International Visitor Survey
5.2 Accommodation infrastructure supplyThere are two main ways to measure the supply of accommodation infrastructure. First, the number of accommodation establishments gives an idea of the size of the sector, and the relative importance of different types of accommodation on regional economies. Secondly, the number of ‘stay nights’ provides a measure of capacity of these establishments.
5.2.1 Establishments
Overall, motels make up the lion’s share of commercial accommodation establishments in New Zealand – 56 per cent of total businesses. More rural areas tend to have an even higher proportion of motels – for example, motels make up 68 per cent of accommodation businesses in Manawatu and 67.5 per cent in Taupo. Since motels account for a much smaller share of guest nights or capacity, this suggests that most motels are relatively small. Of the 531 motel members of AccommodationNZ, who have a combination of 9,030 rooms available per night, the average size of a motel is around 17–20 units. By contrast, hotels account for a small share of the number of establishments, but a large share of guest nights – particularly in large urban areas. For example, around 75 hotels in Auckland accounted for over 4 million guest nights in the year ended January 2016.
MINISTRY OF BUSINESS, INNOVATION AND EMPLOYMENT AUGUST 2016TOURISM INSIGHT SERIESTOURISM INFRASTRUCTURE
39
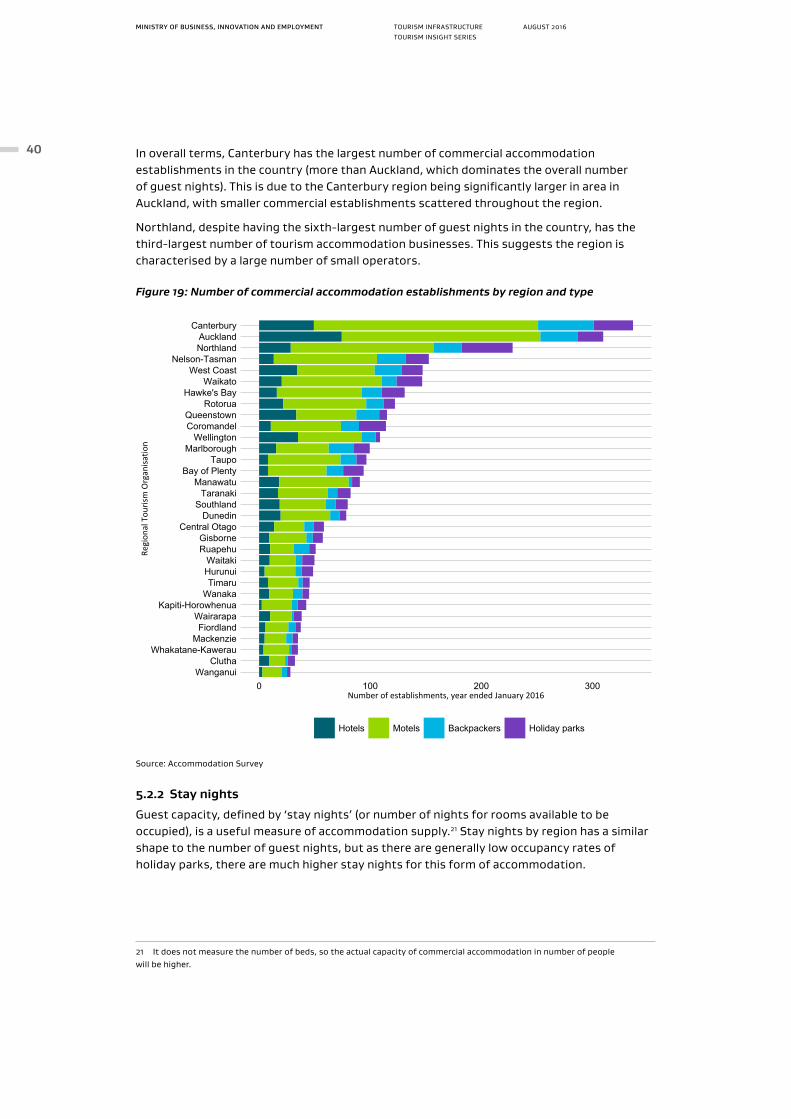
In overall terms, Canterbury has the largest number of commercial accommodation establishments in the country (more than Auckland, which dominates the overall number of guest nights). This is due to the Canterbury region being significantly larger in area in Auckland, with smaller commercial establishments scattered throughout the region.
Northland, despite having the sixth-largest number of guest nights in the country, has the third-largest number of tourism accommodation businesses. This suggests the region is characterised by a large number of small operators.
Figure 19: Number of commercial accommodation establishments by region and type
WanganuiClutha
Whakatane-KawerauMackenzie
FiordlandWairarapa
Kapiti-HorowhenuaWanaka
TimaruHurunuiWaitaki
RuapehuGisborne
Central OtagoDunedin
SouthlandTaranaki
ManawatuBay of Plenty
TaupoMarlborough
WellingtonCoromandelQueenstown
RotoruaHawke's Bay
WaikatoWest Coast
Nelson-TasmanNorthlandAuckland
Canterbury
0 100 200 300Number of establishments, year ended January 2016
Regi
onal
Tou
rism
Org
anisa
tion
Hotels Motels Backpackers Holiday parks
Source: Accommodation Survey
5.2.2 Stay nights
Guest capacity, defined by ‘stay nights’ (or number of nights for rooms available to be occupied), is a useful measure of accommodation supply.21 Stay nights by region has a similar shape to the number of guest nights, but as there are generally low occupancy rates of holiday parks, there are much higher stay nights for this form of accommodation.
21 It does not measure the number of beds, so the actual capacity of commercial accommodation in number of people will be higher.
MINISTRY OF BUSINESS, INNOVATION AND EMPLOYMENT AUGUST 2016TOURISM INSIGHT SERIESTOURISM INFRASTRUCTURE
40
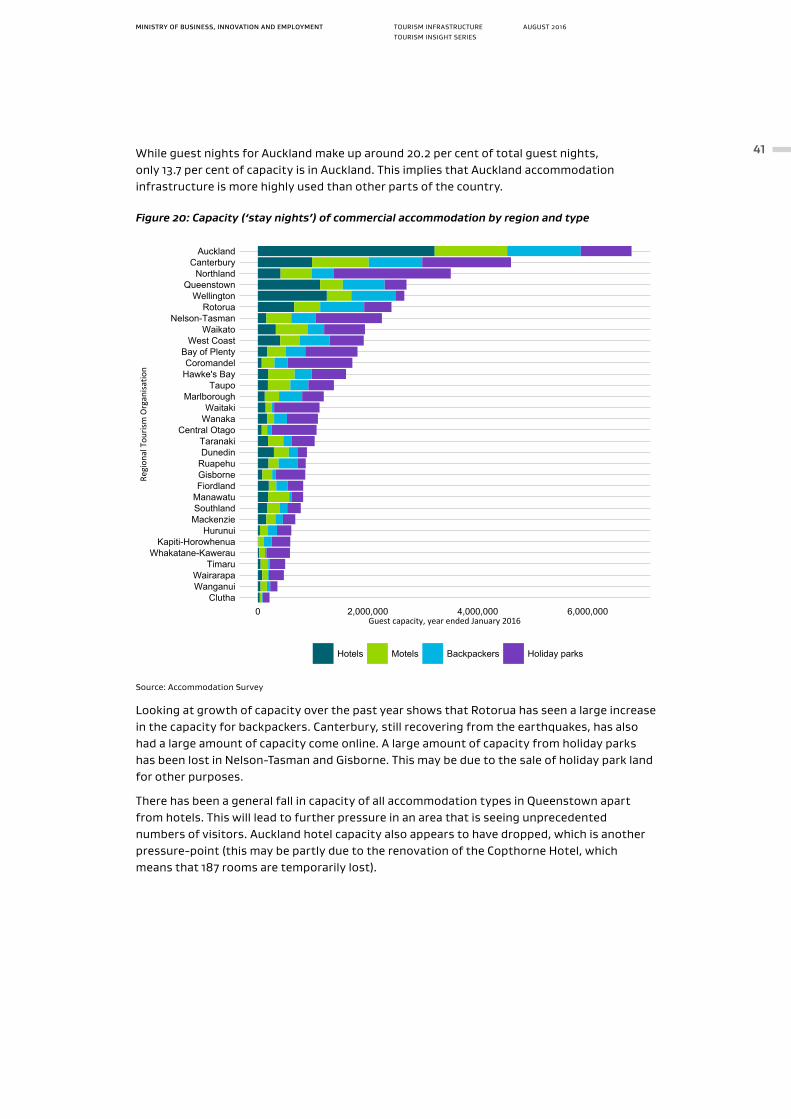
While guest nights for Auckland make up around 20.2 per cent of total guest nights, only 13.7 per cent of capacity is in Auckland. This implies that Auckland accommodation infrastructure is more highly used than other parts of the country.
Figure 20: Capacity (‘stay nights’) of commercial accommodation by region and type
CluthaWanganuiWairarapa
TimaruWhakatane-Kawerau
Kapiti-HorowhenuaHurunui
MackenzieSouthlandManawatuFiordlandGisborneRuapehuDunedinTaranaki
Central OtagoWanakaWaitaki
MarlboroughTaupo
Hawke's BayCoromandel
Bay of PlentyWest Coast
WaikatoNelson-Tasman
RotoruaWellington
QueenstownNorthland
CanterburyAuckland
0 2,000,000 4,000,000 6,000,000Guest capacity, year ended January 2016
Regi
onal
Tou
rism
Org
anisa
tion
Hotels Motels Backpackers Holiday parks
Source: Accommodation Survey
Looking at growth of capacity over the past year shows that Rotorua has seen a large increase in the capacity for backpackers. Canterbury, still recovering from the earthquakes, has also had a large amount of capacity come online. A large amount of capacity from holiday parks has been lost in Nelson-Tasman and Gisborne. This may be due to the sale of holiday park land for other purposes.
There has been a general fall in capacity of all accommodation types in Queenstown apart from hotels. This will lead to further pressure in an area that is seeing unprecedented numbers of visitors. Auckland hotel capacity also appears to have dropped, which is another pressure-point (this may be partly due to the renovation of the Copthorne Hotel, which means that 187 rooms are temporarily lost).
MINISTRY OF BUSINESS, INNOVATION AND EMPLOYMENT AUGUST 2016TOURISM INSIGHT SERIESTOURISM INFRASTRUCTURE
41
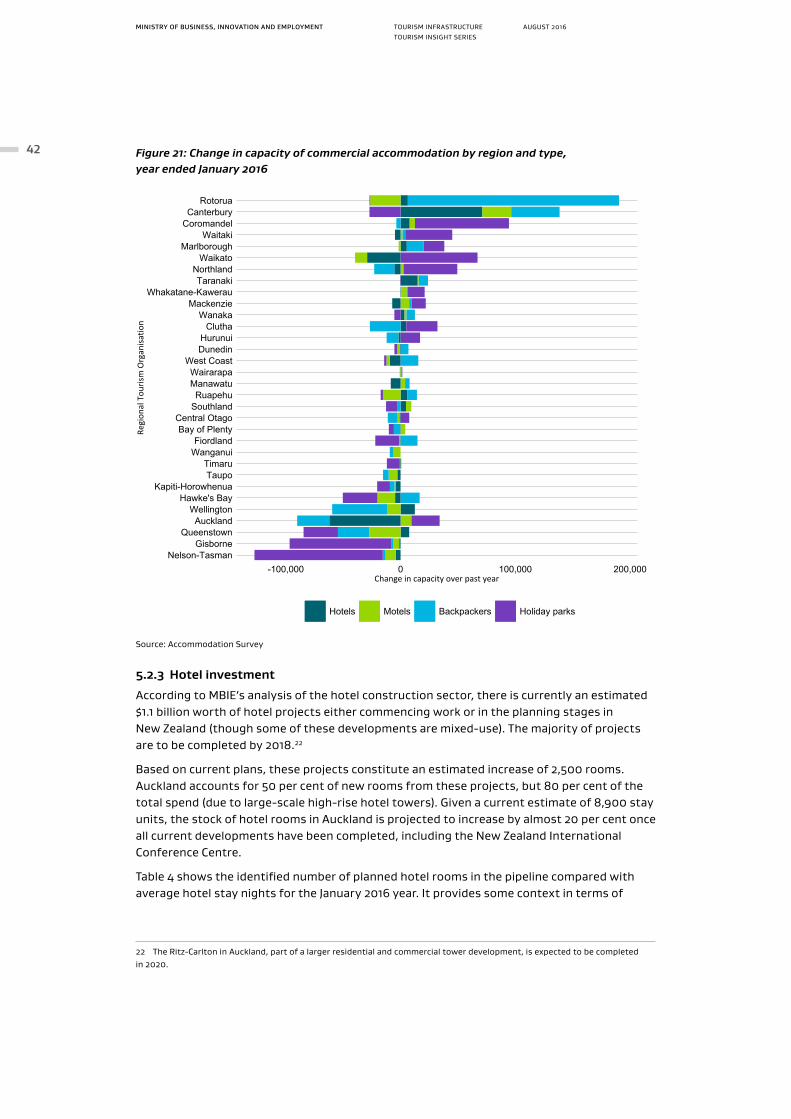
Figure 21: Change in capacity of commercial accommodation by region and type, year ended January 2016
Nelson-TasmanGisborne
QueenstownAuckland
WellingtonHawke's Bay
Kapiti-HorowhenuaTaupoTimaru
WanganuiFiordland
Bay of PlentyCentral Otago
SouthlandRuapehu
ManawatuWairarapa
West CoastDunedinHurunui
CluthaWanaka
MackenzieWhakatane-Kawerau
TaranakiNorthland
WaikatoMarlborough
WaitakiCoromandelCanterbury
Rotorua
-100,000 0 100,000 200,000Change in capacity over past year
Regi
onal
Tou
rism
Org
anisa
tion
Hotels Motels Backpackers Holiday parks
Source: Accommodation Survey
5.2.3 Hotel investment
According to MBIE’s analysis of the hotel construction sector, there is currently an estimated $1.1 billion worth of hotel projects either commencing work or in the planning stages in New Zealand (though some of these developments are mixed-use). The majority of projects are to be completed by 2018.22
Based on current plans, these projects constitute an estimated increase of 2,500 rooms. Auckland accounts for 50 per cent of new rooms from these projects, but 80 per cent of the total spend (due to large-scale high-rise hotel towers). Given a current estimate of 8,900 stay units, the stock of hotel rooms in Auckland is projected to increase by almost 20 per cent once all current developments have been completed, including the New Zealand International Conference Centre.
Table 4 shows the identified number of planned hotel rooms in the pipeline compared with average hotel stay nights for the January 2016 year. It provides some context in terms of
22 The Ritz-Carlton in Auckland, part of a larger residential and commercial tower development, is expected to be completed in 2020.
MINISTRY OF BUSINESS, INNOVATION AND EMPLOYMENT AUGUST 2016TOURISM INSIGHT SERIESTOURISM INFRASTRUCTURE
42
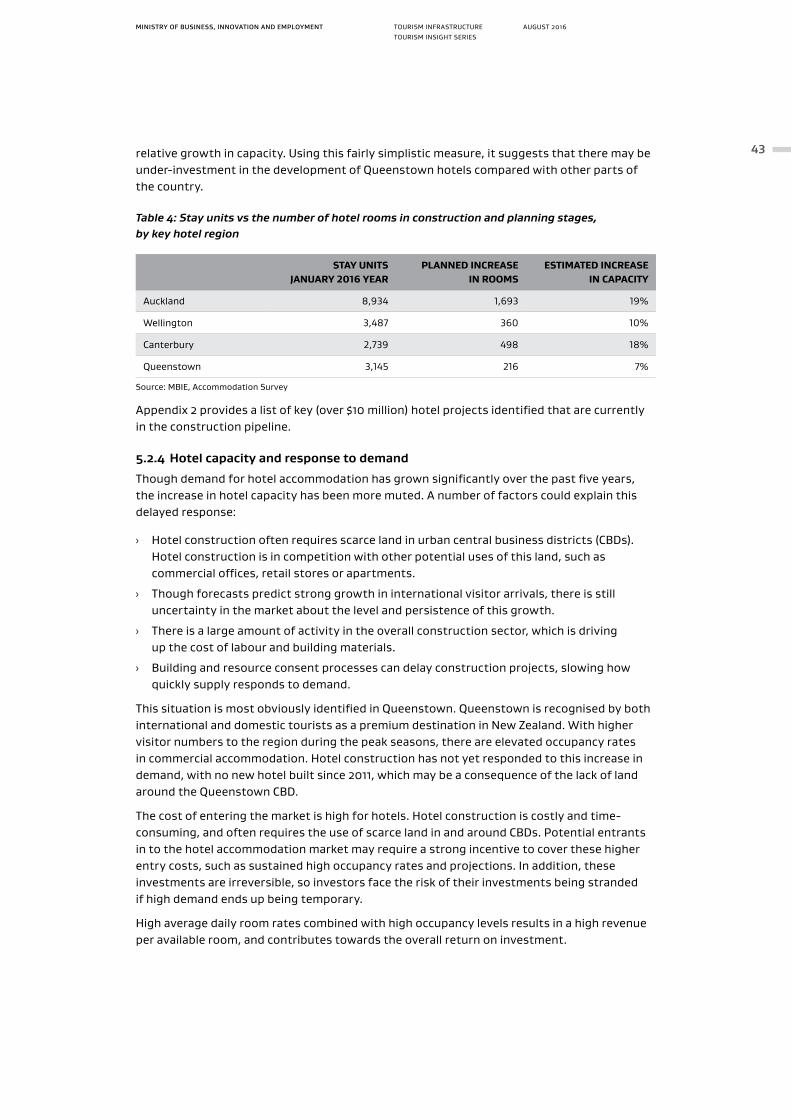
relative growth in capacity. Using this fairly simplistic measure, it suggests that there may be under-investment in the development of Queenstown hotels compared with other parts of the country.
Table 4: Stay units vs the number of hotel rooms in construction and planning stages, by key hotel region
STAY UNITS JANUARY 2016 YEAR
PLANNED INCREASE IN ROOMS
ESTIMATED INCREASE IN CAPACITY
Auckland 8,934 1,693 19%
Wellington 3,487 360 10%
Canterbury 2,739 498 18%
Queenstown 3,145 216 7%
Source: MBIE, Accommodation Survey
Appendix 2 provides a list of key (over $10 million) hotel projects identified that are currently in the construction pipeline.
5.2.4 Hotel capacity and response to demand
Though demand for hotel accommodation has grown significantly over the past five years, the increase in hotel capacity has been more muted. A number of factors could explain this delayed response:
› Hotel construction often requires scarce land in urban central business districts (CBDs). Hotel construction is in competition with other potential uses of this land, such as commercial offices, retail stores or apartments.
› Though forecasts predict strong growth in international visitor arrivals, there is still uncertainty in the market about the level and persistence of this growth.
› There is a large amount of activity in the overall construction sector, which is driving up the cost of labour and building materials.
› Building and resource consent processes can delay construction projects, slowing how quickly supply responds to demand.
This situation is most obviously identified in Queenstown. Queenstown is recognised by both international and domestic tourists as a premium destination in New Zealand. With higher visitor numbers to the region during the peak seasons, there are elevated occupancy rates in commercial accommodation. Hotel construction has not yet responded to this increase in demand, with no new hotel built since 2011, which may be a consequence of the lack of land around the Queenstown CBD.
The cost of entering the market is high for hotels. Hotel construction is costly and time-consuming, and often requires the use of scarce land in and around CBDs. Potential entrants in to the hotel accommodation market may require a strong incentive to cover these higher entry costs, such as sustained high occupancy rates and projections. In addition, these investments are irreversible, so investors face the risk of their investments being stranded if high demand ends up being temporary.
High average daily room rates combined with high occupancy levels results in a high revenue per available room, and contributes towards the overall return on investment.
MINISTRY OF BUSINESS, INNOVATION AND EMPLOYMENT AUGUST 2016TOURISM INSIGHT SERIESTOURISM INFRASTRUCTURE
43
Commercial accommodation providers need to take account of costs that do not apply for private non-commercial accommodation. In addition to larger management costs, commercial accommodation must comply with specific rules and government requirements that are claimed to be considerably more costly than rules applying to non-commercial operations. Considering what has been described above, this may be a reason why the hotel industry appears to be showing a slower response to changes in demand than other forms of commercial accommodation. Therefore, more and earlier planning is required if expanding the hotel capacity is the strategy chosen to meet an increasing demand.
5.2.5 Private non-commercial accommodation
Private non-commercial accommodation, such as holiday home rentals, has become increasingly more popular as an alternative to staying in commercial accommodation. Though it remains a relatively small part of the accommodation sector, non-commercial accommodation helps to alleviate demand pressure when commercial providers are close to capacity. This area of the accommodation market is not covered by official tourism statistics, so the supply and use of this form of accommodation is not well understood. According to Airbnb, the number of listings in New Zealand has doubled to more than 15,000 over the last year, with around 4,000 listings in Auckland. Hosts rent out rooms or houses for an average of 26 to 27 nights per year, evenly split between entire houses and single rooms. The top five international cities where Airbnb travellers originate are Sydney, Melbourne, London, Singapore and Brisbane.
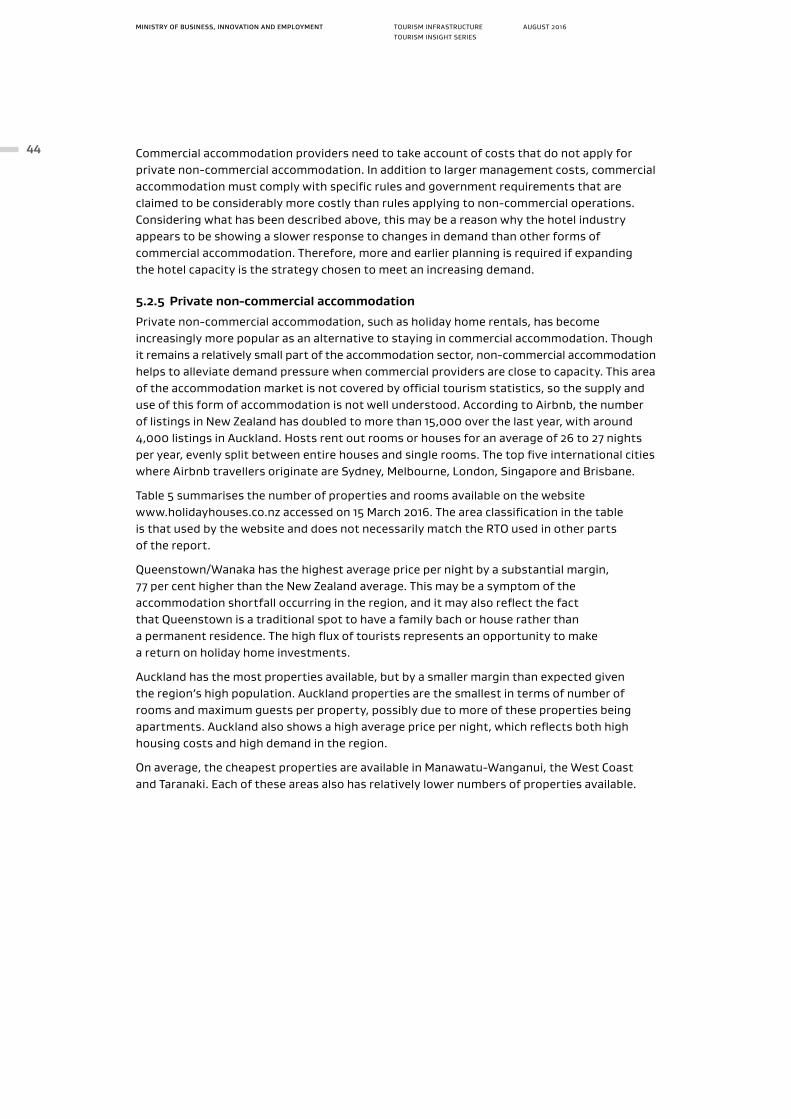
Table 5 summarises the number of properties and rooms available on the website www.holidayhouses.co.nz accessed on 15 March 2016. The area classification in the table is that used by the website and does not necessarily match the RTO used in other parts of the report.
Queenstown/Wanaka has the highest average price per night by a substantial margin, 77 per cent higher than the New Zealand average. This may be a symptom of the accommodation shortfall occurring in the region, and it may also reflect the fact that Queenstown is a traditional spot to have a family bach or house rather than a permanent residence. The high flux of tourists represents an opportunity to make a return on holiday home investments.
Auckland has the most properties available, but by a smaller margin than expected given the region’s high population. Auckland properties are the smallest in terms of number of rooms and maximum guests per property, possibly due to more of these properties being apartments. Auckland also shows a high average price per night, which reflects both high housing costs and high demand in the region.
On average, the cheapest properties are available in Manawatu-Wanganui, the West Coast and Taranaki. Each of these areas also has relatively lower numbers of properties available.
MINISTRY OF BUSINESS, INNOVATION AND EMPLOYMENT AUGUST 2016TOURISM INSIGHT SERIESTOURISM INFRASTRUCTURE
44
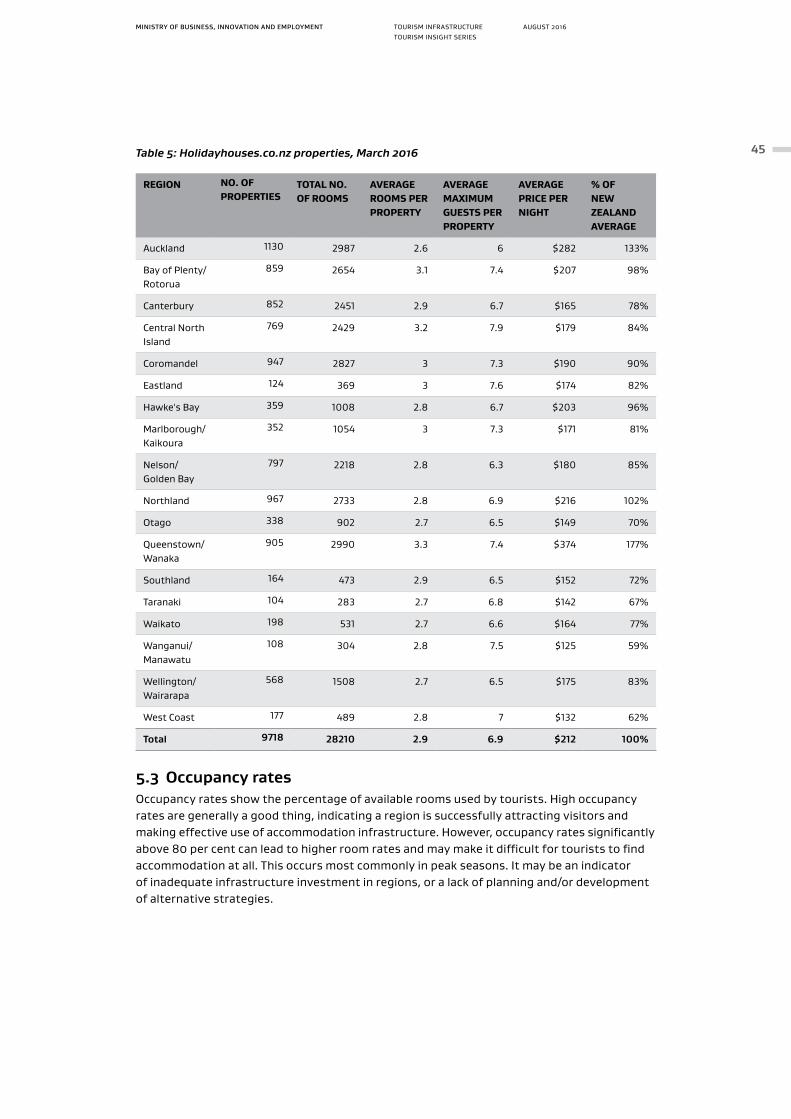
Table 5: Holidayhouses.co.nz properties, March 2016
REGION NO. OF PROPERTIES
TOTAL NO. OF ROOMS
AVERAGE ROOMS PER PROPERTY
AVERAGE MAXIMUM GUESTS PER PROPERTY
AVERAGE PRICE PER NIGHT
% OF NEW ZEALAND AVERAGE
Auckland 1130 2987 2.6 6 $282 133%
Bay of Plenty/Rotorua
859 2654 3.1 7.4 $207 98%
Canterbury 852 2451 2.9 6.7 $165 78%
Central North Island
769 2429 3.2 7.9 $179 84%
Coromandel 947 2827 3 7.3 $190 90%
Eastland 124 369 3 7.6 $174 82%
Hawke's Bay 359 1008 2.8 6.7 $203 96%
Marlborough/Kaikoura
352 1054 3 7.3 $171 81%
Nelson/Golden Bay
797 2218 2.8 6.3 $180 85%
Northland 967 2733 2.8 6.9 $216 102%
Otago 338 902 2.7 6.5 $149 70%
Queenstown/Wanaka
905 2990 3.3 7.4 $374 177%
Southland 164 473 2.9 6.5 $152 72%
Taranaki 104 283 2.7 6.8 $142 67%
Waikato 198 531 2.7 6.6 $164 77%
Wanganui/Manawatu
108 304 2.8 7.5 $125 59%
Wellington/Wairarapa
568 1508 2.7 6.5 $175 83%
West Coast 177 489 2.8 7 $132 62%
Total 9718 28210 2.9 6.9 $212 100%
5.3 Occupancy ratesOccupancy rates show the percentage of available rooms used by tourists. High occupancy rates are generally a good thing, indicating a region is successfully attracting visitors and making effective use of accommodation infrastructure. However, occupancy rates significantly above 80 per cent can lead to higher room rates and may make it difficult for tourists to find accommodation at all. This occurs most commonly in peak seasons. It may be an indicator of inadequate infrastructure investment in regions, or a lack of planning and/or development of alternative strategies.
MINISTRY OF BUSINESS, INNOVATION AND EMPLOYMENT AUGUST 2016TOURISM INSIGHT SERIESTOURISM INFRASTRUCTURE
45
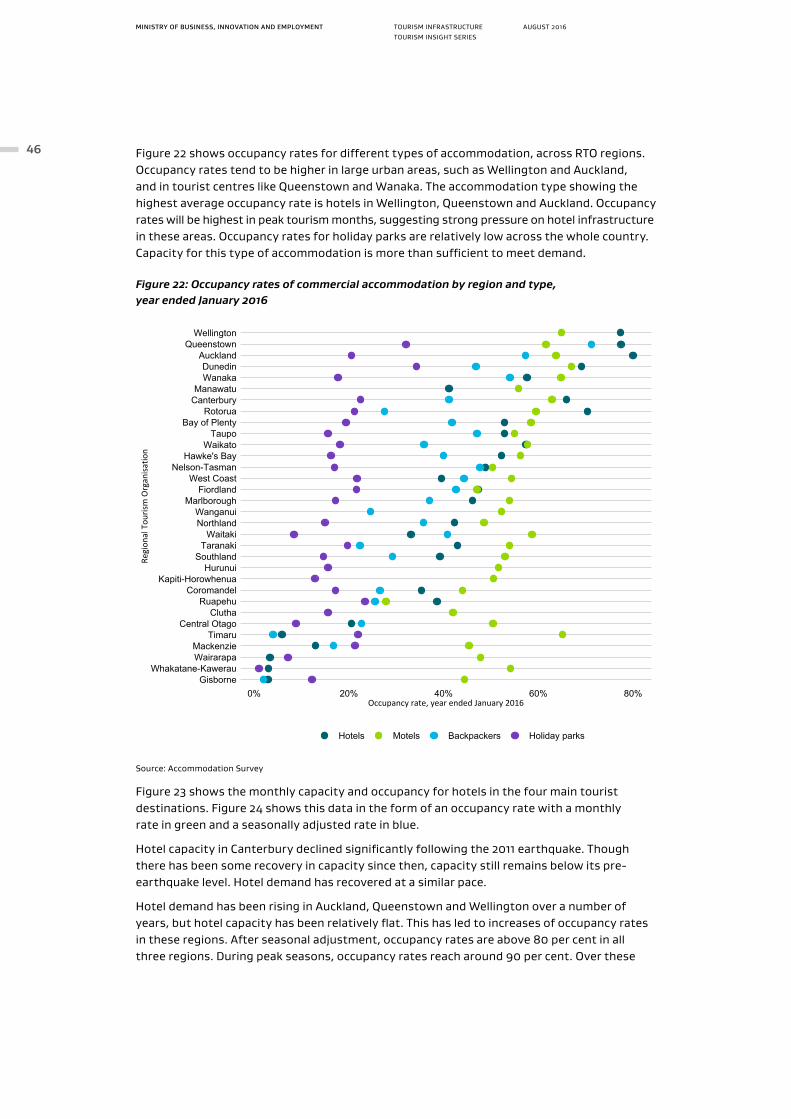
Figure 22 shows occupancy rates for different types of accommodation, across RTO regions. Occupancy rates tend to be higher in large urban areas, such as Wellington and Auckland, and in tourist centres like Queenstown and Wanaka. The accommodation type showing the highest average occupancy rate is hotels in Wellington, Queenstown and Auckland. Occupancy rates will be highest in peak tourism months, suggesting strong pressure on hotel infrastructure in these areas. Occupancy rates for holiday parks are relatively low across the whole country. Capacity for this type of accommodation is more than sufficient to meet demand.
Figure 22: Occupancy rates of commercial accommodation by region and type, year ended January 2016
GisborneWhakatane-Kawerau
WairarapaMackenzie
TimaruCentral Otago
CluthaRuapehu
CoromandelKapiti-Horowhenua
HurunuiSouthland
TaranakiWaitaki
NorthlandWanganui
MarlboroughFiordland
West CoastNelson-Tasman
Hawke's BayWaikato
TaupoBay of Plenty
RotoruaCanterburyManawatu
WanakaDunedin
AucklandQueenstown
Wellington
0% 20% 40% 60% 80%Occupancy rate, year ended January 2016
Regi
onal
Tou
rism
Org
anisa
tion
Hotels Motels Backpackers Holiday parks
Source: Accommodation Survey
Figure 23 shows the monthly capacity and occupancy for hotels in the four main tourist destinations. Figure 24 shows this data in the form of an occupancy rate with a monthly rate in green and a seasonally adjusted rate in blue.
Hotel capacity in Canterbury declined significantly following the 2011 earthquake. Though there has been some recovery in capacity since then, capacity still remains below its pre-earthquake level. Hotel demand has recovered at a similar pace.
Hotel demand has been rising in Auckland, Queenstown and Wellington over a number of years, but hotel capacity has been relatively flat. This has led to increases of occupancy rates in these regions. After seasonal adjustment, occupancy rates are above 80 per cent in all three regions. During peak seasons, occupancy rates reach around 90 per cent. Over these
MINISTRY OF BUSINESS, INNOVATION AND EMPLOYMENT AUGUST 2016TOURISM INSIGHT SERIESTOURISM INFRASTRUCTURE
46
periods there were few available rooms, which would have impacted on room availability and pricing for visitors.
Capacity appears to be responding to increasing demand with a lag, potentially because investment in capacity for hotels is costly and takes time.
If occupancy rates continue to grow at their current rate, hotels will be full in Queenstown and Auckland by 2020. This shows that a sustained pipeline of added hotel capacity is needed to meet increasing projected demand.
Figure 23: Capacity and occupancy of hotels, four main centres
Auckland Canterbury
Queenstown Wellington
0
100,000
200,000
300,000
0
100,000
200,000
300,000
2006 2008 2010 2012 2014 2016 2006 2008 2010 2012 2014 2016
Mon
thly
cap
acity
and
occ
upan
cy (s
tay
units
)
Capacity Occupancy
Source: Accommodation Survey
MINISTRY OF BUSINESS, INNOVATION AND EMPLOYMENT AUGUST 2016TOURISM INSIGHT SERIESTOURISM INFRASTRUCTURE
47
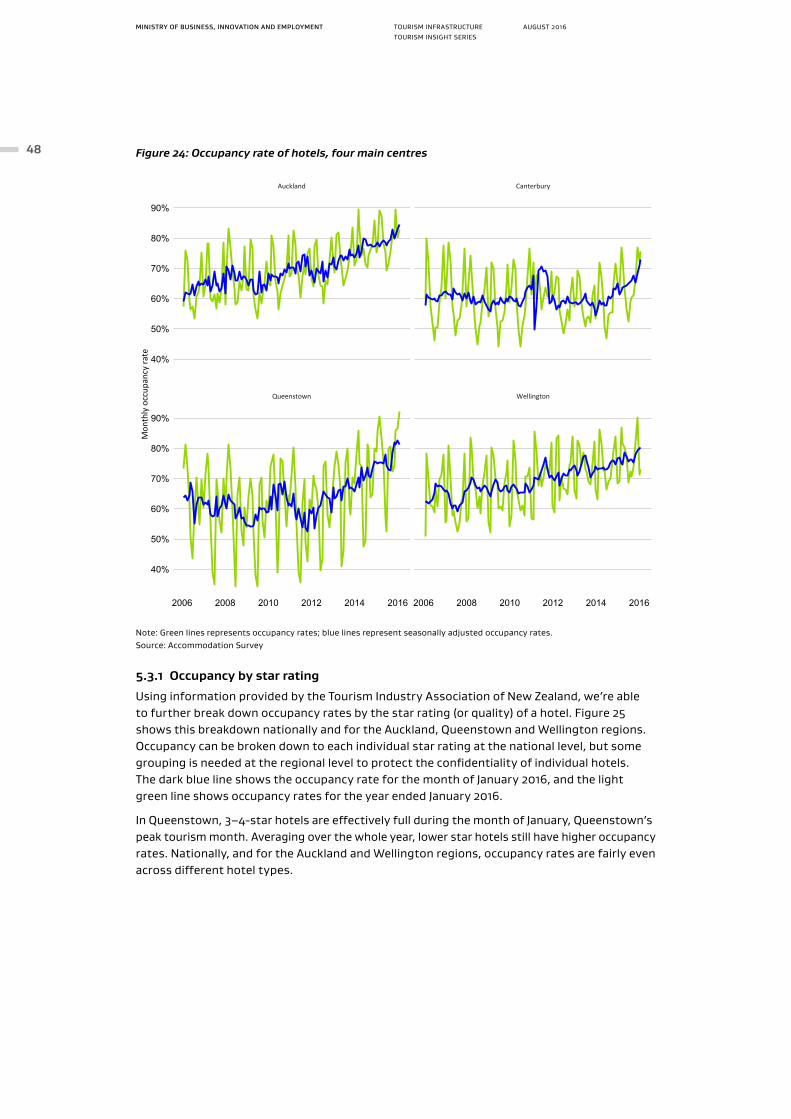
Figure 24: Occupancy rate of hotels, four main centres
Auckland Canterbury
Queenstown Wellington
40%
50%
60%
70%
80%
90%
40%
50%
60%
70%
80%
90%
2006 2008 2010 2012 2014 2016 2006 2008 2010 2012 2014 2016
Mon
thly
occ
upan
cy ra
te
Note: Green lines represents occupancy rates; blue lines represent seasonally adjusted occupancy rates. Source: Accommodation Survey
5.3.1 Occupancy by star rating
Using information provided by the Tourism Industry Association of New Zealand, we’re able to further break down occupancy rates by the star rating (or quality) of a hotel. Figure 25 shows this breakdown nationally and for the Auckland, Queenstown and Wellington regions. Occupancy can be broken down to each individual star rating at the national level, but some grouping is needed at the regional level to protect the confidentiality of individual hotels. The dark blue line shows the occupancy rate for the month of January 2016, and the light green line shows occupancy rates for the year ended January 2016.
In Queenstown, 3–4-star hotels are effectively full during the month of January, Queenstown’s peak tourism month. Averaging over the whole year, lower star hotels still have higher occupancy rates. Nationally, and for the Auckland and Wellington regions, occupancy rates are fairly even across different hotel types.
MINISTRY OF BUSINESS, INNOVATION AND EMPLOYMENT AUGUST 2016TOURISM INSIGHT SERIESTOURISM INFRASTRUCTURE
48
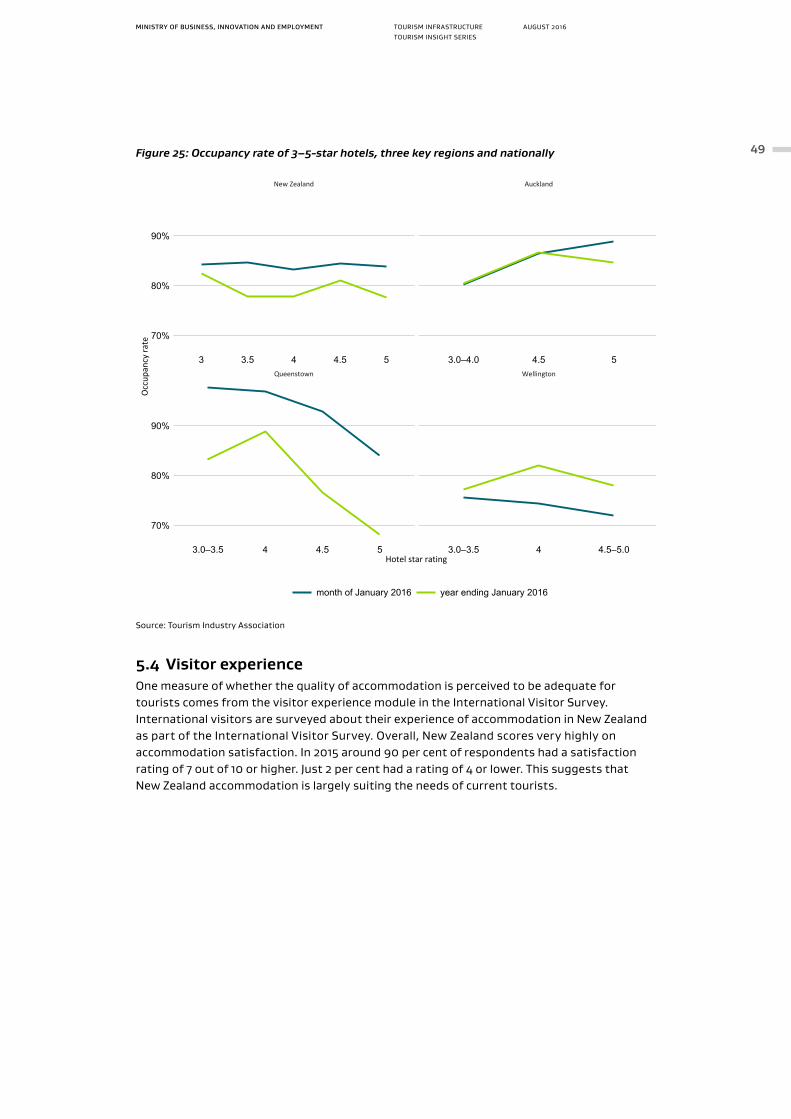
Figure 25: Occupancy rate of 3–5-star hotels, three key regions and nationally
New Zealand Auckland
Queenstown Wellington
70%
80%
90%
70%
80%
90%
3 3.5 4 4.5 5 3.0–4.0 4.5 5
3.0–3.5 4 4.5 5 3.0–3.5 4 4.5–5.0Hotel star rating
Occ
upan
cy ra
te
month of January 2016 year ending January 2016
Source: Tourism Industry Association
5.4 Visitor experienceOne measure of whether the quality of accommodation is perceived to be adequate for tourists comes from the visitor experience module in the International Visitor Survey. International visitors are surveyed about their experience of accommodation in New Zealand as part of the International Visitor Survey. Overall, New Zealand scores very highly on accommodation satisfaction. In 2015 around 90 per cent of respondents had a satisfaction rating of 7 out of 10 or higher. Just 2 per cent had a rating of 4 or lower. This suggests that New Zealand accommodation is largely suiting the needs of current tourists.
MINISTRY OF BUSINESS, INNOVATION AND EMPLOYMENT AUGUST 2016TOURISM INSIGHT SERIESTOURISM INFRASTRUCTURE
49
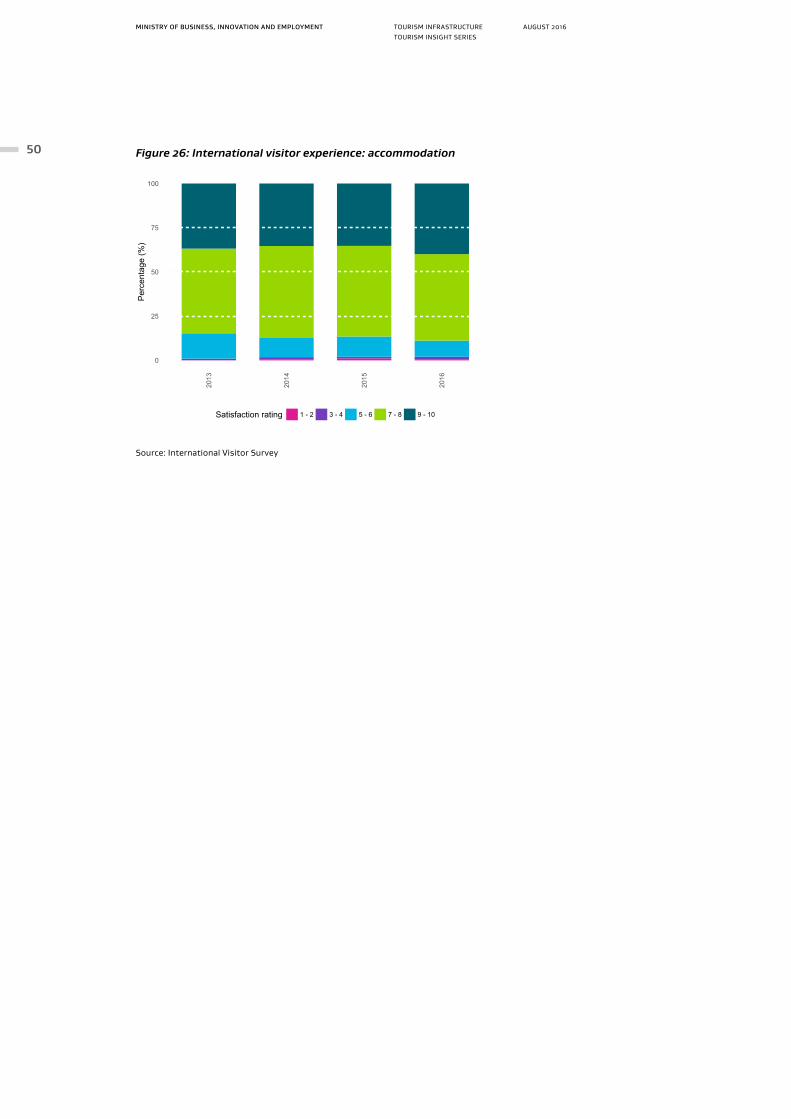
Figure 26: International visitor experience: accommodation
0
25
50
75
100
2013
2014
2015
2016
Per
cent
age
(%)
Satisfaction rating 1 - 2 3 - 4 5 - 6 7 - 8 9 - 10
Source: International Visitor Survey
MINISTRY OF BUSINESS, INNOVATION AND EMPLOYMENT AUGUST 2016TOURISM INSIGHT SERIESTOURISM INFRASTRUCTURE
50


![⃝Ƨ [staff of vault] vep the coca cola company 2003](https://img.pdfslide.us/doc/110x75/568ca9411a28ab186d9cba19/-staff-of-vault-vep-the-coca-cola-company-2003.jpg)


![⃝Ƨ [amos oz] under this blazing light](https://img.pdfslide.us/doc/110x75/568ca9a71a28ab186d9e5b6a/-amos-oz-under-this-blazing-light.jpg)


