Embed Size (px)
Citation preview
Chapter 5
Threat and Authoritarianism: Polarization or Convergence
As the literature on authoritarianism has evolved from treating it as a static
personality characteristic a la Adorno et al. (1950) to a disposition that manifests itself in
situation specific circumstances (e.g. Feldman 2003; Stenner 2005), threat has come to
play a starring role in understanding its effect. Scholars today tend not believe that the
level of authoritarianism in a population changes much over time (but see e.g. Altemeyer
1996 who measures it differently). Instead, its effect changes depending upon measurable
circumstances. Specifically, the new conventional wisdom holds that an authoritarian
disposition lays dormant in the absence of threat, meaning that the preferences of the
more and less authoritarian will not differ by much. Threat activates an authoritarian
disposition, which, in turn, causes it to have measurable effects on opinions, behaviors,
and preferences (see e.g. Feldman and Stenner 1997; Stenner 2005, for the most complete
treatment).
Although we wholeheartedly embrace the notion of situationism – that
authoritarianism’s effect will wax and wane depending on how threatened people feel –
we will demonstrate that scholars have misunderstood the relationship between threat and
authoritarianism. Worse, this flawed thinking encourages a fundamental misreading of
the recent dynamics of American politics. In correcting this misunderstanding, we can
better explain why support for gay rights, limitations on civil liberties, the use of force,
and even approval of the president has tended to move in the directions they have over
1
the last decade. Our explanation also provides some purchase on why opinions on these
matters have been relatively more and less polarized at different points in time.
To use the language of social science, the new conventional wisdom about
authoritarianism suggests a positive interaction between authoritarianism and threat. As
threat increases, the difference between the preferences of the most and least
authoritarian is supposed to increase. The reasoning goes that authoritarians become
increasingly concerned about maintaining the group’s well being (and likely their own
well being since they are part of the group) during threatening circumstances, which
makes them increasingly supportive of policies that would, for example, value security
over civil liberties. Although much literature largely ignores non-authoritarians, the
positive interaction also suggests that threat may cause them to become even more
invested than usual in things like civil liberties, diplomacy, and tolerance (Stenner 2005;
Perrin 2005).
We find a positive interaction unlikely. We depart from the conventional wisdom
in two ways. First, we believe those who score high and low in authoritarianism will
have different preferences in the absence of threat. Different cognitive styles and
capacities tend to produce different preferences under most conditions. Since a central
part of the authoritarian disposition is characterized by feelings of pessimism, maybe
even paranoia (Adorno et al. 1950; Stenner 2005), we believe that those scoring high in
authoritarianism will tend to believe the world is more threatening than do non-
authoritarians during times that are objectively unthreatening to most. Hence, people
who are more and less authoritarian ought to display significantly different preferences
under “normal” circumstances.
2
Second, we think that threat has the potential to actually reduce the difference in
preferences between the more and less authoritarian rather than enhance them. When
circumstances make the world a scary place for more people, which a high profile
terrorist attack that kills thousands of people might, the difference in perceived threat
between the more and less authoritarian ought to narrow, maybe even evaporate. As a
result, the preferences of authoritarians and non-authoritarians ought to differ by less than
they do under “normal” circumstances. When both feels threatened, both will seek safety
and security. Our reasoning suggests a negatively signed interaction between the two.
Furthermore, we argue that our understanding of the interaction between threat and
authoritarianism squares better with the aggregate level findings that informed the early
thinking on situationism (see e.g. Sales 1972, 1973).
In this chapter, we first demonstrate that support for civil liberties, in particular,
waned after the September 11 terrorist attacks but began to wax as years passed. We
indirectly link these changes to a decrease in the amount of threat people felt from
terrorism as September 11 became a more distant memory. We next test our hypotheses
about the interaction between authoritarianism and threat, using all the dependent
variables we demonstrated last chapter to be structured in part by authoritarianism. We
find strong evidence for a negative interaction. We also consider changes in George W.
Bush’s job approval rating through this lens. Finally, in carrying out these tests, we
demonstrate that different threat conditions produce either convergence or polarization of
public opinion. When threat is perceived widely across categories of authoritarianism, as
it was with terrorism post-September 11, it leads to convergence. When threat is
perceived asymmetrically, it leads to the polarization of public opinion.
3
What a Positive Interaction and a Negative Interaction Mean
When we use the term interaction, we mean that the effect of one variable
depends on the value of another variable. That is, one variable conditions the effect of
another. A positive interaction between threat and authoritarianism means
authoritarianism will have little to no effect when perceived threat is low, but it will have
a large effect when perceived threat is high. This relationship is depicted graphically as
the solid line in Figure 1. The theory suggests that threats cause authoritarians to respond
in a more authoritarian manner but cause non-authoritarians to act in a more tolerant
manner (see Stenner 2005). The key point is that those who score high and low in
authoritarianism will differ in their preferences by more under conditions of threat than in
the absence of threat.
(Figure 1 About Here)
This relationship is supposedly supported by both aggregate level and individual
level data. At the aggregate level, scholars have shown that periods of both social and
economic unease, which are treated in this literature as threats, tend to predate increases
in authoritarian-friendly policy outcomes. These outcomes include increased support for
police budgets and harsher prison sentences (Sales 1973), more public support for
censorship, and a wider expression of racial prejudice (Doty, Peterson, and Winter 1991).
In addition, periods of high threat apparently cause more people to embrace powerful
figures like the president (McCann 1987). Certainly the literature on support for
authoritarian leaders in the developing world is consistent with this view.
4
Such findings, however, do not necessarily suggest a positive interaction between
threat and authoritarianism. In fact, we believe they suggest the reverse. The more
authoritarian differ from the less authoritarian, often by a lot, on a number of issues even
in the absence of an objective threat.1 For example, those who score high and low in
authoritarianism differed in their preferences about gay rights by a lot in 1992 even
though gay rights received little attention in the national media. To the extent that
differences are slightly larger now that gays receive more attention, it is because non-
authoritarians have become more tolerant at a faster rate, not because authoritarians have
grown chillier toward them. Similarly, those who score high and low in authoritarianism
differ in their levels of racial resentment and racial prejudice today just like they did in
the early 1990s when race was a much bigger part of the political dialogue.
Rather than needing a readily identifiable threat, we believe that those who score
high in authoritarianism are more likely to perceive threat, even when situations might
not be objectively threatening to most others. The literature on authoritarianism certainly
implies that those who score high in authoritarianism find the world a threatening place,
suggesting that perceptions of threat are a relative constant for them over time
(Altemeyer 1996). If true, then the opinions and preferences of authoritarians are
unlikely to change much when more threat is introduced, since their baseline preferences
already reflect a high degree of perceived threat. How much more anti-gay rights, pro-
security, or anti-affirmative action can one get?
The aggregate level findings often cited in the authoritarianism literature suggest
that policy outcomes change in an authoritarian direction during tumultuous times. Since
1 Indeed, only one experiment that we are aware of, which appears in Stenner’s (2005) book, suggests that authoritarians have the same opinions and behaviors as non-authoritarians absent some threat manipulation, and this one piece of evidence is derived from a student sample of less than 100 subjects.
5
policy change tends to reflect changes in the overall distribution of opinion (Page,
Shapiro, and Dempsey 1983; Erikson, MacKuen, and Stimson 2002), it suggests that
more people are embracing preferences for such changes. Those who score high in
authoritarianism have these preferences already. In a similar vein, far right political
parties, like the National Front in France, tend to attract more votes during tumultuous
times than quiet ones (Mudde 2008). But it is not that hard core authoritarians, the usual
base of support for such parties (Dow 1999; Sniderman, Hagendoorn, and Prior 2004),
get even more supportive of parties like this; they already support them. Instead people
who are not hard core authoritarians start to support them. Similarly, when Hugo
Chavez, the authoritarian leader of Venezuela, warns his citizens that the U.S. might
invade the country, his strategy is to increase his number of supporters (Morolla and
Zechmeister 2009); the most authoritarian by disposition already like his strong hand.
All this suggests that increases in the percentage of the public that embraces order
during threatening times must be the result of a change in behavior among people who
are less authoritarian. This implies a negative interaction between perceived threat and
authoritarianism, which we depict graphically as the broken line in Figure 1. The
negative interaction between threat and authoritarianism suggests that, as perceived threat
increases, the difference in the opinions and behaviors of authoritarians relative to non-
authoritarians decreases. As people in the middle and lower tiers of authoritarianism
come to perceive threat, they adopt policy orientations that are more like an
authoritarian’s.
Illustrations
6
Liberal television talk show host, Bill Maher, has seemed to suggest this
relationship between threat and authoritarianism. Maher’s politics as articulated on his
HBO series, Real Time, suggest a strongly non-authoritarian bent. He is pro-gay rights,
makes frequent reference to drug use, and criticizes the Republican base whenever
presented the opportunity. However, months after the September 11 attacks, Maher
opined that airport security screeners should profile passengers based on whether or not
they appeared to be Muslims. Certainly racial or, in this case, religious profiling is
antithetical to what appears to be his worldview, and he probably did not feel this way
before terrorism became a more salient concern. But, Maher likely flies a lot and would
feel safer doing it if every potential Islamic extremist was patted down before they got on
a plane with him. Those who score high in authoritarianism might have been inclined to
think that this was a good idea long before September 11 because they tend not to trust
people who are different from them. This example further illustrates that, when threat is
high, authoritarians and non-authoritarians will act more alike than when threat is low.
Based on their respective expressed policy preferences in the 2000 campaign and
their voting records when they were members of Congress, it seems reasonable to assume
that Al Gore would score lower in authoritarianism than Vice President Dick Cheney.
Had Gore been elected president in 2000, however, how different would his first impulse
have been to September 11 when threat was overwhelming high? Would his first step
have been to affirm his commitment to civil liberties, as the positive interaction between
authoritarianism and threat suggests? This seems unlikely to us. Instead, we suspect that
taking steps to insure the safety of the nation would have been Gore’s top priority.
7
As such, Gore probably would have given serious consideration to initiatives like
warrantless wiretapping than he would have had the attack not taken place. Although
differences in Gore’s and Cheney’s preferences probably would have persisted (for
example, Gore has stated he would not have invaded Iraq), we suspect their respective
preferences on tradeoffs between civil liberties and security and the general use of force
would have been closer in 2002 than they were in 2000. Indeed it is probably instructive
to recall that it was Franklin Roosevelt, a political leader who almost surely scored
relatively low in authoritarianism, who thought it necessary to inter Japanese-Americans
after the attack on Pearl Harbor.
In sum, in the face of a grave objective threat, authoritarians’ preferences
probably won’t change too much because they feel relatively threatened by the world as a
condition of their cognitive and emotional style. Hence the people to observe through
changing threat conditions are those who score lower in authoritarianism. Those scoring
lower in authoritarianism will likely adopt preferences more like those of authoritarians
than under “normal” circumstances. What good are high minded principles if you are
dead?
Our thinking works in both directions. Assume that no terrorist attacks take place
in the U.S. for many years. Perceived threat from terrorism ought to drop, especially
among those who score lower in authoritarianism. Rather than continuing to be occupied
with personal security, non-authoritarians will be more likely to adopt, for example, a
more pro-civil liberties position because the conditions that caused them to be more pro-
security have passed. Among those who score high in authoritarianism, perceptions of
threat are likely to remain higher and drop slower than for those who score low. In other
8
words, perceptions of threat will ebb asymmetrically. As a result, the effect of
authoritarianism in shaping preferences will increase. The preferences of authoritarians
and non-authoritarians will come to differ by a lot.
Why Previous Analysis Suggests a Positive Interaction
It is not as though scholars who have explored the relationship between threat and
authoritarianism and found a positive interaction did sloppy work. A number of factors
are potentially at play both individually and in combination to produce such an outcome.
Scholars have used many different measures of threat, some of which seem better
than others. Although similar critiques could be leveled against a range of measures, we
concentrate here on Stenner’s because her treatment is among the most recent and is
certainly the most comprehensive and powerful. Stenner (2005) distinguishes between
garden variety threats, which she argues are often not important, and threats to the
“normative order”, which she argues are critically important. These normative threats are
threats to “some system of openness and sameness that makes ‘us’ an ‘us’: some
demarcation of people, authorities, institutions, values, and norms that for some folks at
some point defines who ‘we’ are, and what ‘we’ believe in” (Stenner 2005, 17).
We have no quibble with her conceptual definition. Less clear is whether
Stenner’s measure of threat in the context of her survey work taps the concept.2
Specifically, she uses a scale of equally weighted items composed of the following four
pieces: relative evaluations of presidential candidates, perceptions of distance between
the respondent and both political parties, perceived belief divergence between “typical
2 We leave aside Stenner’s (2005) experimental work here. It is clear that the survey and experimental worlds are different on this question. Surveys are only able to determine whether perceived threat exists after an uncontrolled set of circumstances unfolds in the real world.
9
Americans” and “members of Congress”, and perceived ideological distance between the
respondent and “typical Americans.” This seems to us an excellent measure of political
alienation, but not really of normative threat. There are plenty of good reasons to think
that the interaction between alienation and authoritarianism might be negative, which
may be why Stenner finds the pattern of results that she does. But, it is probably unwise
to infer too much about the sign on the interaction between threat and authoritarianism
from an analysis using this particular measure of threat.
Second, when scholars introduce threatening conditions in the lab, there is an
implicit assumption that all subjects ought to be equally threatened by them. Reasons
abound that suggest otherwise. For example, we confirm in Chapter 3 the findings of
many others that non-authoritarians tend to score higher in cognitive complexity than do
authoritarians. Hence it might be more difficult to threaten non-authoritarians in a lab
environment. If so, those scoring higher in authoritarianism will tend to react to the
stimulus while those at the bottom of the distribution would not. Such a pattern would
produce a positive interaction. This might or might not replicate when people receive
real world threats. So, it might be the case that those scoring high in authoritarianism are
more susceptible to threat, but it is not clear what effect authoritarianism will have when
people who score low and high in authoritarianism both perceive threat.
Fourth, many of the threats that scholars use in these experimental manipulations
tend to be about matters that would be much more threatening those scoring high in
authoritarianism than those scoring low. Consider an experiment that focuses on gay
rights. Gays and lesbians are threatening to authoritarians. Although non-authoritarians
do not necessarily embrace the group, they will not be, on average, as threatened as
10
authoritarians will be by a threat manipulation involving this group. If we simply
compare the group differences after the threat manipulation, authoritarians who got the
treatment will be less supportive of gay rights than non-authoritarians who got the
treatment, probably by a greater amount than those who didn’t receive the treatment.
That is because of the nature of the threat. Again this example suggests the need to test
whether or not people felt threatened by the manipulation. This, of course, suggests that,
if you chose a group that was threatening to non-authoritarians and not authoritarians, the
pattern of results would differ as well.
Although we believe threat is important in understanding the dynamic effect of
authoritarianism, we will demonstrate that it works differently in the real world than
psychologists using experimental methods have shown. Rather than assuming a treat is
threatening, we rely on people’s reports of how threatened they actually feel.
Some Descriptive Evidence
If our thinking is correct, we ought to see increasing percentages of people
backing, for instance, safety and security over civil liberties during a threatening time.
People scoring very high in authoritarianism might be less concerned with abstractions
like civil liberties under most circumstances, but people scoring lower in authoritarianism
might swell the percentage of people willing to forgo certain civil liberty protections
when threat is strong. After 9/11, for instance, a much higher percentage of people across
the distribution of authoritarianism will perceive significant threat from world terrorism.
Starting in 1999, the First Amendment Center at Vanderbilt University started to
ask a question to random cross-sections of Americans. After explaining the purpose of
11
the First Amendment, the survey asked respondents whether “The First Amendment goes
too far in the rights it guarantees.” In the two years before the 9/11 attacks, only 28 and
22 percent of Americans, respectively, thought that the First Amendment went too far.
At the end of 2001, however, the percentage jumped to 39 percent, nearly double the
reading in 2000. And, in 2002, with Americans living with constant updates about terror
threat levels from the news media, the percentage of people who thought the First
Amendment went too far peaked at 49 percent. As September 11 became a more distant
memory and as people became accustomed to living with terrorism, public opinion began
to turn. By 2003, only 34 percent thought the First Amendment went too far, and, in
2004, only about 30 percent did, a percentage statistically indistinguishable from the
percentage recorded in 1999.3
The First Amendment Center’s findings are not anomalous. Starting in
September, 2001, the Pew Foundation for the People and the Press debuted a question
that asked respondents “In order to curb terrorism in this country, do you think it will be
necessary for the average person to give up some civil liberties or not?” Sixty-one
percent of an understandably shaken public said yes in a survey taken just two weeks
after the attacks. By June, 2002, that percentage had fallen to 46 percent, and, in July
2004, only 38 percent said yes.
Similarly, whether or not people thought the government had “gone too far in
restricting civil liberties” follows a similar pattern. Princeton Research Associates in
collaboration with Newsweek asked this question six times between September, 2001 and
August, 2002, and the Gallup Organization used the question in November, 2003. Right
after the 9/11 attacks, the percentage who thought the government had gone to far was in 3 First Amendment Center’s 2004 Report, p. 1.
12
the single digits. Two years later, more than a quarter of the public expressed concern
that the government was going to far in restricting civil liberties.
Finally, CBS News asked people whether they were more concerned about the
government failing to make anti-terrorist laws strong enough or whether government
laws would excessively restrict civil liberties at several points in time. The first reading
from CBS was taken in December, 2001, and 43 percent expressed more concern that the
laws would not be strong enough while 45 percent expressed more concerned about civil
liberties. In the most recent survey, which was taken in November, 2006, only 36 percent
were concerned that the laws wouldn’t be strong enough, while a majority (51 percent)
expressed more concern about civil liberties.
The results here tell a story consistent with the theory we explicated above. The
surge then decline in perceived threat increased then decreased the number of people
willing to tradeoff civil liberties for security. Since those scoring high in authoritarianism
are likely to feel more threatened than non-authoritarians under typical circumstances, it
is more likely that those moving the distribution are people who scored closer to the
bottom of the authoritarianism scale.
Testing the Hypothesis
To test our hypotheses, we replicate the regression models we estimated in
Chapter 4, but we add an interaction between our measures of perceived threat and
authoritarianism in each of the models. Recall that we included measures of threat in all
these models because we (rightly) thought that perceptions of threat would affect support
13
for things like gay rights, the use of force rather than diplomacy, and tradeoffs between
civil liberties and security.
Of course, the threat one might perceive from gays and lesbians is different from
the one perceives from terrorism, so we use a different measure of threat in each. In the
gay rights models, the item we used to tap threat asked respondents whether and how
strongly they agreed or disagreed with the following statement: “the newer lifestyles are
contributing to the breakdown of our society”. In the force versus diplomacy models and
the security versus civil liberties models, the item we used asked respondents to place
themselves on a four point scale ranging from “very worried” to “not worried at all” in
response to the following question: “How worried are you that you personally might
become a victim of a terrorist attack?”
Gay Rights
The results of the gay rights regression models, including the interactive terms,
appear in Table 1. In discussing the results, we will focus solely on the effects of
authoritarianism and threat because we discussed the effects of the other variables last
chapter. The addition of the interactive terms did not much affect the estimates for the
other variables in the models.
(Table 1 About Here)
In terms of both sign and, for the most part, significance, the results consistently
follow expectations. Authoritarianism has a very large effect, when people perceive less
threat. Contrary to the scholarly conventional wisdom, however, we find that
authoritarianism’s effect diminishes as people perceive increasing threat from “newer
14
lifestyles”. The results also suggest that perceived threat from newer lifestyles has an
effect on these dependent variables, but, also counter to conventional wisdom, we find its
effect is strongest among those who score lowest in authoritarianism.
In all four equations, the so called main effect for authoritarianism is statistically
significant and substantively quite large. The negative sign suggests that those who are
more authoritarian are significantly less likely to support gay rights than people who
score low on the authoritarianism scale when perceived threat from a gay lifestyle is low
(that is when perceived threat is equal to 0). But the oppositely signed and most often
statistically significant effect on the interaction between authoritarianism and perceived
threat suggests that the magnitude of authoritarianism’s negative effect on support for gay
rights decreases as the perceived threat from “the newer lifestyles” increases. In other
words, when respondents express feeling high levels of threat, knowing whether a person
is authoritarian or not provides no guidance as to whether he or she supports various gay
rights initiatives. But, when they express feeling little to moderate threat,
authoritarianism explains a lot.
We show graphically in Figure 2 how this interaction manifests itself in real
terms. Although we could have used any of the items to show the pattern, we use gay
adoption because the issue has captured a good deal of attention and the results are
particularly sharp. Since the model is estimated using logistic regression, we must use an
algorithm to derive predicted probabilities that people support gay adoption. To make the
estimates substantively interpretable, we simulate a “typical” respondent and vary the
values of both threat and authoritarianism. To simulate a typical respondent, we fix the
variables measured on interval or ordinal scales, such as income, education, party
15
identification, moral traditionalism, and ideology, at their sample means. We fix the
dummy variables at specific values. Specifically, our simulation captures the predicted
opinion of a non-African-American, female, regular church going, mainline Protestant.
(Figure 2 About Here)
Several features of Figure 2 are noteworthy. First, authoritarianism has no effect
when threat is at its maximum, which is manifested in the flat line at the bottom of the
figure labeled “Threat = 1”. If someone is threatened by the “newer lifestyles”, that
person’s probability of supporting gay marriage, other things held constant, is about 0.30
no matter whether they scored at the high, middle, or low point on the authoritarianism
scale. Since we would classify someone with a predicted probability below 0.5 as not
supporting gay adoption, this result is a nice check on the reliability of our model. It is
reassuring that it predicts people who feel substantial threat from newer lifestyles oppose
gay adoption.
Second, it is noteworthy that, no matter how much or how little threat the most
authoritarian respondents feel, their probability of supporting gay adoption is statistically
the same. This is captured as the tightly clustered figure entries above where
authoritarianism equals 1 on the x-axis. And third, it is those who score toward the
minimum of the authoritarianism scale who show the most variation in their response to
threat. When they feel a lot of it, their preferences are indistinguishable from those who
score high in authoritarianism. Conversely, when people who score low in
authoritarianism feel little to no threat, their preferences are enormously different from
both authoritarians and non-authoritarians who feel substantial threat. This is captured in
the fanning out of predicted probabilities that run down the left side of the figure.
16
Even inside the extremes, authoritarianism can have a marked effect on
preferences, provided perceptions of threat are low to moderate. For example, when
people are only moderately threatened by “newer lifestyles” (Threat = .5), the predicted
probability of someone supporting gay marriage increases from .316 among the most
authoritarian to .718 among the least authoritarian, which represents a .402 point change
in predicted probability. It is worth noting that the sample mean for the threat item is just
above .5, making this a particularly relevant simulation. The result is substantively
important as well. Based on our predicted probabilities, we would categorize those
“typical” respondents who scored at or near the maximum of the authoritarianism scale as
opposing gay rights since their predicted probability of support is below .5. For those
scoring at or near the minimum, however, we would categorize them as supporting gay
rights since their predicted probability of support is well above .5. When perceived threat
is at its midpoint, then, authoritarianism can be decisive in understanding support or
opposition to gay rights.
Again, consistent with expectations, the effect of authoritarianism is largest when
threat is at a minimum, not at its maximum as some scholarship suggests. When people
feel no threat from “newer lifestyles”, the effect of authoritarianism is enormous. In
moving from maximum to minimum authoritarianism, the probability of support for gay
adoption increases from .361 to .928, more than a fifty percent change in probability.
Again it is a substantively relevant change with those scoring at the maximum in
authoritarianism scoring below a predicted probability of .5 and those scoring lower in
authoritarianism comfortably above .5.
17
We can also use this simulation to test whether certain issues are likely to cause
polarization or convergence in public opinion. When perceived threat and
authoritarianism are positively correlated, as we would expect to be the case most of the
time given that those who score high in authoritarianism have a disposition that is
sensitive to threat, it will cause polarization. People who score both high in
authoritarianism and perceived threat will produced predicted probabilities that are in the
lower right corner of Figure 2. Conversely, a positive correlation suggests that those who
score low in authoritarianism will tend to score low in perceived threat. This profile will,
on average, produce predicted probabilities in the top left of Figure 2.
For gay rights, this is, indeed, the case. In the 2004 NES, the correlation between
authoritarianism and the “newer lifestyles” item is .31, which is very strong for survey
data. To put this correlation in more concrete terms, the average perceived threat among
those who provided zero authoritarian responses to the child-rearing battery was .335,
and it was .530 among people who provided one authoritarian response. Our simulation
predicts that, other things being equal, these two profiles would be pro-gay adoption.
The average perceived threat from “newer lifestyles” among those who provided three
authoritarian responses to the child rearing battery was .711, and, among those who
provided four, it was .713. Our simulation suggests that, other things being equal, these
two profiles will be anti-gay adoption. The result is polarization of opinion.
But, consider how much less polarized opinions would have been had the
relationship between authoritarianism and threat remained what it was in 1992. That
year, the average threat perceived by those who provided either three or four authoritarian
responses to the child rearing battery was about .75, which is almost the same as it was in
18
2004. Among those who provided either 0 or 1 authoritarian responses, however, the
average levels of threat were .482 and .612, respectively, which is significantly higher
than in 2004. Our simulation would predict that many of the people scoring in the lower
authoritarianism categories would have been classified as anti-gay adoption because they
felt substantial fear from gays and lesbians, much like those who scored high in
authoritarianism. Because threat is less strongly correlated with authoritarianism in 1992
than it is in 2004, we would predict more convergence on gay adoption. And, of course,
that is exactly what the pattern has been with gay adoption over time.
Perceived Threat from Terrorism and Support for Civil Liberties
The interaction we show between authoritarianism and threat is not a function of
the data we analyzed, the measure of threat we used, or the time that the survey was
taken. To demonstrate this, we replicate our approach using a series of dependent
variables that tap support for limitations on civil liberties. Our expectations are the same.
Authoritarianism ought to have no effect when perceived threat is high; the opinions of
non-authoritarians who are frightened for their safety will mirror those of authoritarians
who by disposition tend to feel this way. As perceived threat drops, however, we ought
to see authoritarianism shaping preferences in an increasingly powerful fashion, with
those scoring high in authoritarianism significantly more inclined to favor limitations to
civil liberties.
Recall from the prior chapter that the National Election Study neither asked
people to assess how much threat they felt from terrorism, nor did it ask people questions
about civil liberties. Hence we again turn to the variables we examined last chapter from
19
the 2006 Cooperative Congressional Election Study (CCES). Specifically, we asked
people whether they 1) supported using wiretaps without a warrant, 2) supported using
video cameras to monitor people in public places, 3) thought whether people ought to
refrain from criticizing the president during the war on terror and 4) whether they thought
the media ought to keep secrets from the public that might be relevant to fighting the war
on terrorism.
We showed last chapter that those who score high in authoritarianism provide the
government more latitude in infringing on civil liberties than do non-authoritarians. We
believe, however, that its effect ought to be conditioned by how much threat they people
perceive from terrorism. The results appear in Table 2. Again, they follow expectations.
For all four models, the so called main effect of authoritarianism is positive and
significant. This indicates that when people “are not worried at all” that they will be
personally affected by terrorism, authoritarianism has a large and positive effect on
support for limiting civil liberties. When threat is low, those scoring high in
authoritarianism are much more likely to support things like warrantless wiretaps and
using video cameras to monitor public places than those who score low in
authoritarianism. Similarly, those scoring high in authoritarianism are more likely to
oppose criticizing the president about his efforts to fight the war on terror, and they are
more inclined to support the media withholding stories that might affect the terror fight.
(Table 2 About Here)
As was also the case for the gay rights items, we find the expected interaction
between perceived threat from terrorism and authoritarianism carrying a sign that is
opposite that of the so called main effect. Moreover, this interaction is statistically
20
significant in three of the four models. This suggests that, as perceived threat increases,
the effect of authoritarianism decreases. Hence, when threat is low, how authoritarian a
person is provides us a powerful explanation for a person’s opinions about limiting civil
liberties. But, when threat is at its maximum, those who score low and high in
authoritarianism are statistically indistinguishable from each other.
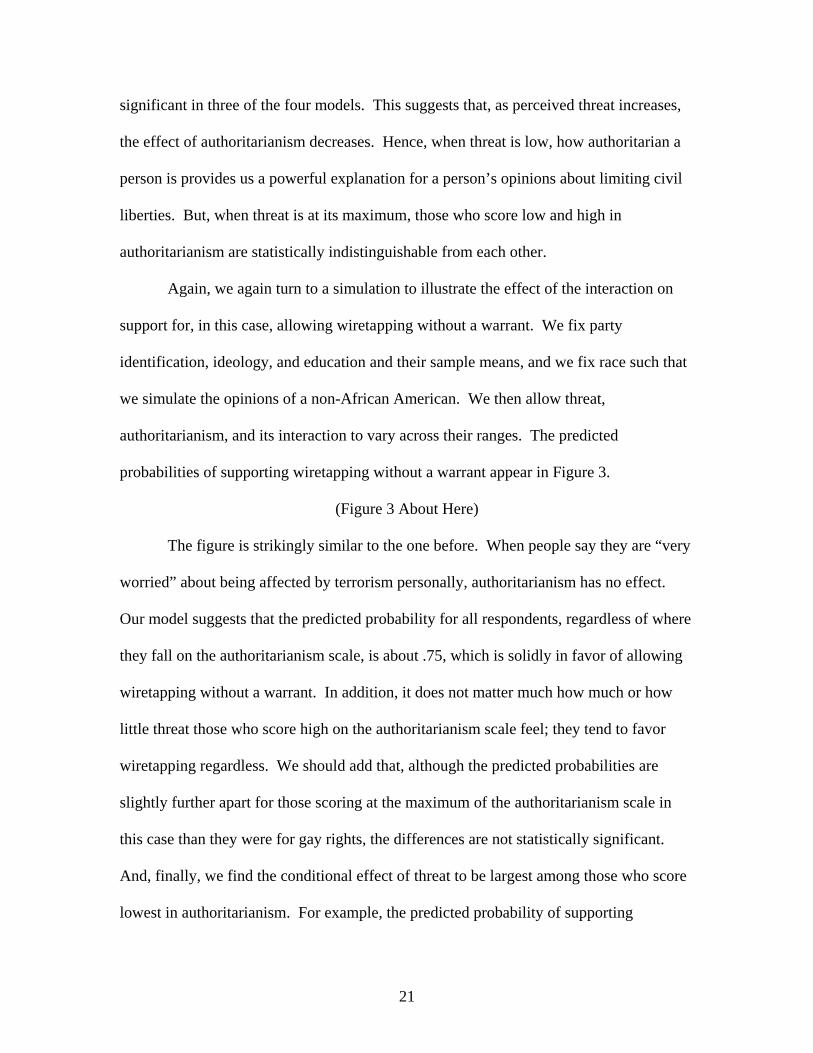
Again, we again turn to a simulation to illustrate the effect of the interaction on
support for, in this case, allowing wiretapping without a warrant. We fix party
identification, ideology, and education and their sample means, and we fix race such that
we simulate the opinions of a non-African American. We then allow threat,
authoritarianism, and its interaction to vary across their ranges. The predicted
probabilities of supporting wiretapping without a warrant appear in Figure 3.
(Figure 3 About Here)
The figure is strikingly similar to the one before. When people say they are “very
worried” about being affected by terrorism personally, authoritarianism has no effect.
Our model suggests that the predicted probability for all respondents, regardless of where
they fall on the authoritarianism scale, is about .75, which is solidly in favor of allowing
wiretapping without a warrant. In addition, it does not matter much how much or how
little threat those who score high on the authoritarianism scale feel; they tend to favor
wiretapping regardless. We should add that, although the predicted probabilities are
slightly further apart for those scoring at the maximum of the authoritarianism scale in
this case than they were for gay rights, the differences are not statistically significant.
And, finally, we find the conditional effect of threat to be largest among those who score
lowest in authoritarianism. For example, the predicted probability of supporting
21
warrantless wiretapping among those who scores lowest on the authoritarianism scale and
are “very worried” about being affected by a terrorist attack is about .77. The predicted
probability for those low in authoritarianism who are “not worried at all” about terrorism
is less than .30, roughly a 50 percentage point difference.
The effect of authoritarianism is also substantial when perceived threat from
terrorism is moderate. Among those who report being “not very worried”, the predicted
probability of those who score at authoritarianism’s minimum supporting warrantless
wiretaps is .336. Since that is less than .5, we would classify this “typical” respondent as
opposed. In contrast, the predicted probability of someone who scores at the
authoritarianism maximum is .649, which is about 30 percentage points higher. Since
this typical respondent’s predicted probability is greater than .5 we would classify this
person as supportive of the practice.
Like for gay rights, these results can also help us understand whether and under
what circumstances polarization or convergence occurs in public opinion. The
descriptive statistics that we reported in Chapter 4 demonstrated that the public is much
less polarized on limitations to civil liberties than on things like gay adoption and gay
marriage. Our models suggest that that relationship we have uncovered between threat
and authoritarianism contributes to the difference. Whereas the correlation between
authoritarianism and threat from “newer lifestyles” was more than .3, the correlation
between authoritarianism and being personally affected by a terrorist attack is about half
that. Put another way, the most and least authoritarian differed in their perceived threat
by nearly 40 percentage points in our measure of perceived threat in the gay rights
condition. In the civil liberties condition, the difference is only about 15 percentage
22
points. If those differences widen, then it will produce an increase in polarization, other
things being equal. If, however, we see another terrorist attack against the U.S., we
suspect that any differences we see in perceived threat between authoritarians and non-
authoritarians would shrink, maybe even disappear. This would lead to a convergence of
preferences in the public toward the side of more limitations to civil liberties.
We began this chapter by tracing the surge, then gradual drop off, in support for
limitations on civil liberties in return for greater security. Our results suggest that the
interaction between threat and authoritarianism helps us understand the dynamics of these
changes. It should not surprise anyone that changes in perceived threat drive the
dynamic. But, we show that, when threatening situations occur, it is the less authoritarian
who change their opinions. This suggests that the effect of threat is largest on people
who score low in authoritarianism, not high. The effect is actually smallest on people
who score high in authoritarianism, because, by disposition, they likely feel a marked
sense of threat even under normal circumstances.
Disposition toward Force and Diplomacy
The last set of dependent variables we used last chapter to demonstrate the role
that authoritarianism is playing in structuring contemporary American politics involved
the use of force. Specifically, we asked people 1) whether the U.S. ought to follow its
national interests or account for the preferences of its allows, 2) whether they thought the
use of force or diplomacy was a more formidable weapon in the fight against terrorism
and 3) whether or not the Iraq war was a mistake.
23
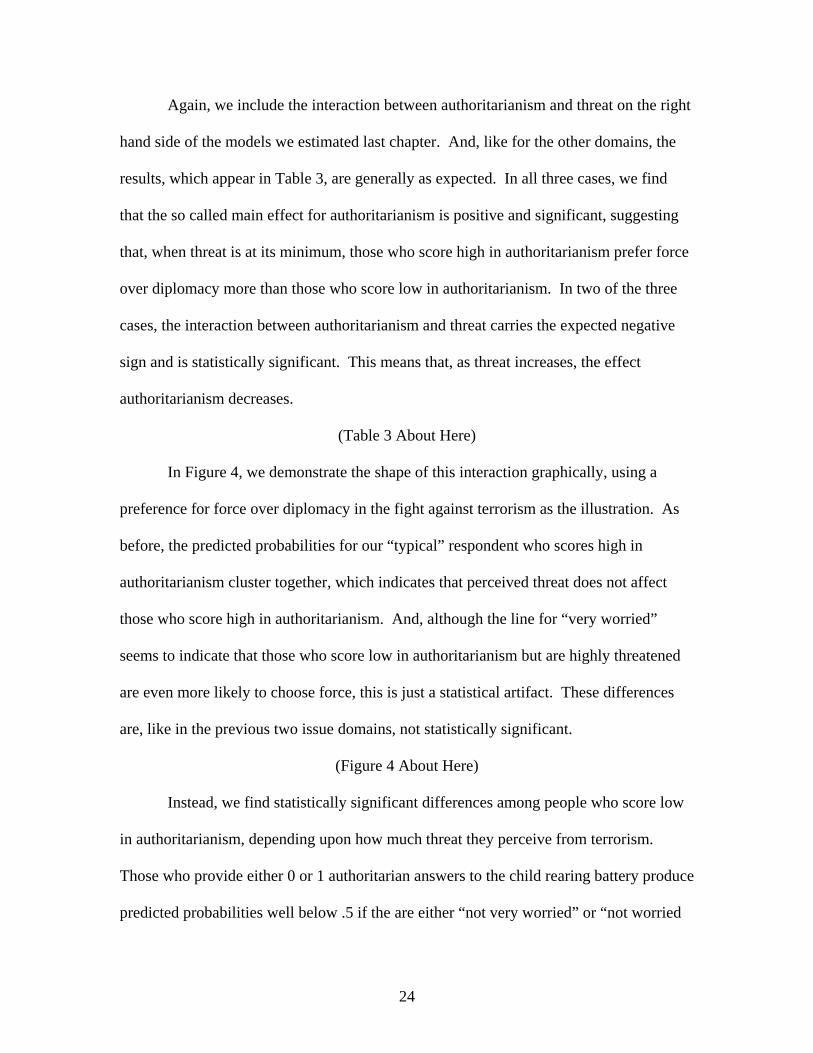
Again, we include the interaction between authoritarianism and threat on the right
hand side of the models we estimated last chapter. And, like for the other domains, the
results, which appear in Table 3, are generally as expected. In all three cases, we find
that the so called main effect for authoritarianism is positive and significant, suggesting
that, when threat is at its minimum, those who score high in authoritarianism prefer force
over diplomacy more than those who score low in authoritarianism. In two of the three
cases, the interaction between authoritarianism and threat carries the expected negative
sign and is statistically significant. This means that, as threat increases, the effect
authoritarianism decreases.
(Table 3 About Here)
In Figure 4, we demonstrate the shape of this interaction graphically, using a
preference for force over diplomacy in the fight against terrorism as the illustration. As
before, the predicted probabilities for our “typical” respondent who scores high in
authoritarianism cluster together, which indicates that perceived threat does not affect
those who score high in authoritarianism. And, although the line for “very worried”
seems to indicate that those who score low in authoritarianism but are highly threatened
are even more likely to choose force, this is just a statistical artifact. These differences
are, like in the previous two issue domains, not statistically significant.
(Figure 4 About Here)
Instead, we find statistically significant differences among people who score low
in authoritarianism, depending upon how much threat they perceive from terrorism.
Those who provide either 0 or 1 authoritarian answers to the child rearing battery produce
predicted probabilities well below .5 if the are either “not very worried” or “not worried
24
at all” about terrorism affecting them personally, which means our model would classify
them as favoring diplomacy over force. Our model predicts, however, that those scoring
in the two low authoritarian categories will favor force over diplomacy if they feel either
“somewhat worried” or “very worried”. Again, we find that those scoring low in
authoritarianism are the people to watch across different levels of perceived threat. This,
of course, suggests that, when threat is high across categories of authoritarianism,
opinions will converge toward the strength over diplomacy position. But, when
perceived threat drops, as has happened with September 11 receding deeper into memory,
we get a polarization of opinion in this issue domain as well.
Approval of President Bush
The best example of the convergence and polarization of opinion over the early
years of the 21st Century involve evaluations of George W. Bush. In the months after the
September 11 terrorist attacks, he achieved approval levels higher than those ever
achieved by a president, peaking at over 90 percent. He maintained extraordinarily high
approval for well over a year after the attacks. At the time of the 2002 midterm elections,
for example, his approval was above 70 percent, which many believe contributed to the
Republicans historic wins that year (see Hetherington and Nelson 2003).
Only two years later, he became the least popular president ever returned to
office, with an approval rating below 50 percent in November 2004. Things, for the most
part, only went down hill from there. By the time of our CCES survey in November
2006, his approval rating was in the low 30s, which is where it remained throughout the
balance of his administration. Of course, many things contributed to the president’s
25
weakening approval ratings, including his administration’s handling of Hurricane Katrina
in New Orleans and the rest of the Gulf coast, an increasingly unpopular war in Iraq, and
the usual downturn in popularity that a president experiences during his second term. We
believe, however, that the drop in perceived threat from terrorism and its interaction with
authoritarianism is an important part of understanding the dynamics of Bush’s approval
ratings as well.
To build our case, we first turn to the 2000-2002 portion of the National Election
Studies’ 2000-2004 panel study. Although the authoritarianism battery was not asked in
2002, it was asked in 2000 to more than 700 people who were re-interviewed by the NES
in both 2002 and 2004. Consistent with other survey organizations, the NES found that
Bush had the approval of 69 percent of Americans in 2002. The difference between
authoritarians and non-authoritarians was marked, which we would have expected given
the types of issues on the agenda in 2002. Those who scored at the scale’s maximum
provided Bush much higher scores than those who scored at the minimum, with a spread
of just under 25 percentage points across the range of authoritarianism.
By 2004, Bush’s approval rating among panel respondents dropped to 55 percent.
More important, the difference between the most and least authoritarian increased to
more than 30 percentage points. While approval dropped across all categories of the
authoritarianism index, it dropped most precipitously among those toward the minimum
of the scale. This pattern of change is consistent with our theory. In 2002, more
Americans were feeling more threat from terrorism than they were in 2004. With threat
higher across all categories of authoritarianism, it ought to lead to a convergence of
preferences, in this case approval of President Bush. As threat decreases, it ought to do
26
so asymmetrically, with those scoring low in authoritarianism feeling less threatened
more quickly than those scoring high. This would produce polarization in Bush’s job
approval numbers.
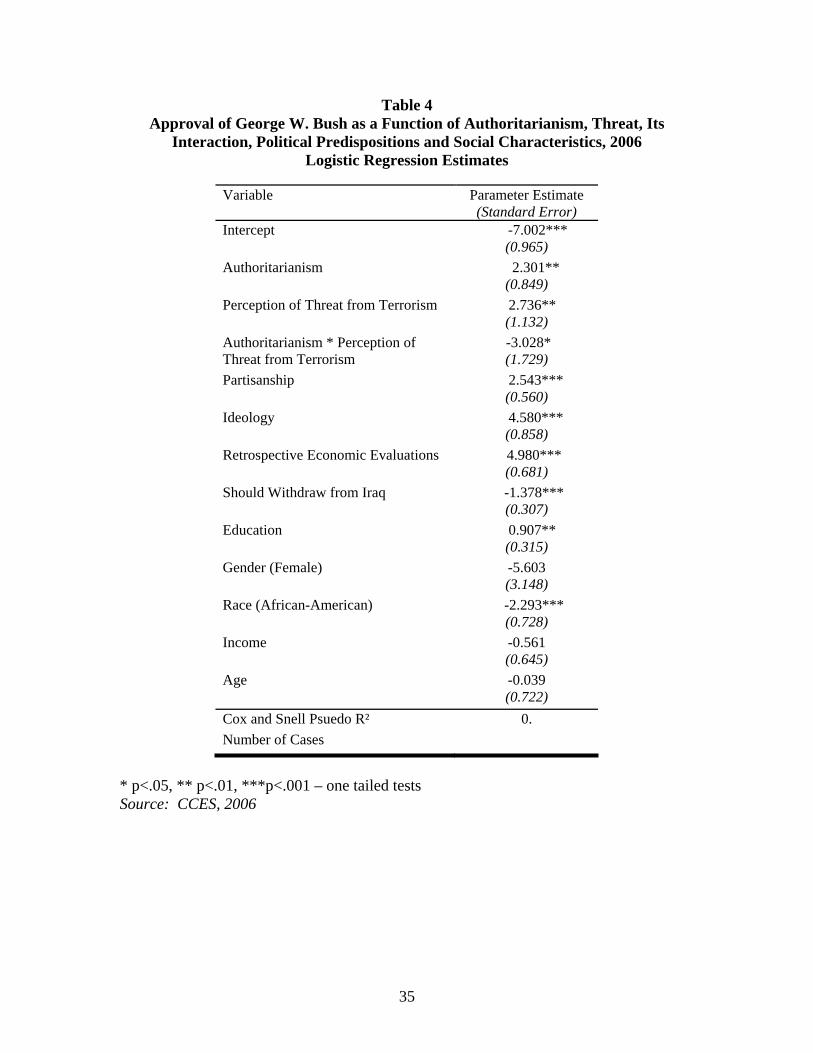
To test whether the interaction between threat and authoritarianism exists for
presidential approval, we must turn again to the CCES since the NES failed to ask how
threatened people felt by terrorism. Fortunately, we can specify a model of presidential
approval using CCES data that would be almost identical to any model we could specify
using the NES. Our dependent variable is whether or not respondents approved of the job
George W. Bush was doing as president. To explain variation in responses, we start with
our four item authoritarianism battery, the perceived threat posed by terrorism item that
we used in the civil liberties and use of force models above, and the interaction between
the two. To make our estimates of these variables’ effects more secure, we also provide
controls for a range of political and demographic variables, including party identification,
race, retrospective evaluations of the national economy, whether or not the U.S. should
begin to withdraw troops from Iraq, race, gender, age, education, and income.
The results of the analysis appear in Table 4. The explanatory variables produce
signs and levels of significance as they should. Republicans, conservatives, and those
who think the national economy has gotten better over the last year are more inclined to
approve of Bush. Those who want to withdraw from Iraq, African-Americans, and the
best educated are less inclined to approve of the president.
(Table 4 About Here)
Most important for our purposes, we again find the familiar negative interaction
between threat and authoritarianism. The positive and significant effect for the so called
27
main effect of authoritarianism means that, when threat is at its minimum, people who
score higher in authoritarianism are significantly more positive toward Bush than people
who score lower. But, the oppositely signed interaction between authoritarianism and
threat means that, as threat increases, the effect of authoritarianism decreases.
We show the effect graphically in Figure 5. Since we used logistic regression to
estimate the model, we again need to fix the variables that are not part of the interaction
and theoretically interesting values and vary the components of the interaction to simulate
changes in predicted probabilities. In this case, we fix all the ordinal and interval scale
variables at their means. We fix the dummy variables, such that our simulation predicts
the opinions of non-black, women who are opposed to withdrawing from Iraq.
(Figure 5 About Here)
As before, our model predicts that both people who report being “very worried”
about terrorism affecting them personally and those who score high in authoritarianism
show little variation in their evaluations of President Bush. We see the familiar flat line
representing the “very worried” category, and the clustering together of predicted
probabilities in the high authoritarian categories. As threat levels drop to either “not very
worried” or “not worried at all” about being personally affected by terrorism, however,
the effect of authoritarianism is large. For example, among those who score at the
minimum of the authoritarianism scale, perceived threat has nearly a 50 percentage point
effect on the probability of approving of the president.
In sum, President Bush’s approval ratings dropped for any number of reasons.
But one feature of the decay in approval that is interesting to us is that it occurred
disproportionately among those who scored low in authoritarianism. This is particularly
28
remarkable because those scoring low in authoritarianism were already substantially less
likely to approve of the president than those scoring high. The reason for the asymmetry
here appears to be a change in perceptions of threat. As September 11 continued to
recede deeper into people’s memories, those who score low in authoritarianism started to
approve less. Whereas their preferences converged with those scoring high in
authoritarianism right after 9-11, those preferences polarized years later.
Conclusion
Throughout this chapter, we have demonstrated time and again that, when
preferences on issues are structured by authoritarianism, an interaction exists between
authoritarianism and perceived threat. Importantly, the sign we consistently find on the
interaction is the reverse of the scholarly conventional wisdom. We show that threat
narrows the differences between those who score high and low in authoritarianism.
These results square well with political reality. Increased threat often increases the
number of people supporting policies or candidates that promise to impose more order.
People who score high in authoritarianism already tend to support such initiatives. It is
those who score lower in authoritarianism, but who feel significant threat from political
circumstances at a particular point in time, that explain changes over time.
Understanding this relationship can also explain why issues can cause either
convergence or polarization. When threat is fairly evenly felt across levels of
authoritarianism, as was the case for gay rights in the early 1990s or right after the
September 11 terrorist attacks, convergence is the result. When people who score low in
authoritarianism perceive significant threat, their preferences are often much like those of
29
people who score high in authoritarianism. When threat is perceived asymmetrically
across the authoritarianism distribution, then it leads to polarization. This is the case with
gay rights in the early 2000s. Perceived threat from “newer lifestyles” has dropped, but
not across the board. As a result, those who score low in authoritarianism now have
much different preferences about gay rights. If we are correct in our hypothesis that
authoritarianism now cleaves party preferences as well, this is an important part of the
story of mass party polarization. It also suggests that, if people continue to feel less
threatened by gays and lesbians and if the U.S. is able to keep terrorism at bay, it will
lead to increasing polarization over time on issues in which authoritarianism explains
preferences, other things being equal.
Although we have focused throughout this chapter on the scholarly implications
of our findings, there are obvious electoral implications as well. This chapter helps to
explain why, at least lately, the Republicans seem to benefit by raising the specter of
threat, especially as it relates to terrorism. In making this observation, we do not mean to
suggest this is a purely cynical strategy; terrorists have proven that they are a real, not
just an imagined m. The important point is that, if perceived threat increases across a
broad swath of the electorate, people across levels of authoritarianism will tend to adopt
more conservative preferences on issues that are structured in part by authoritarianism.
This will advantage Republican candidates. But, if people feel relatively safe from a
terrorist threat, their preferences on these issues will move in a more liberal direction,
advantaging Democratic candidates.
We suspect that a major reason John Kerry lost the 2004 presidential election was
that he was unable to make enough Americans feel safe from terrorism. His problem was
30
particularly acute among women, who came to be called security moms. As evidence,
the gender gap shrank considerably in 2004. In 2000, women voted 11 percentage points
more for Gore than men did, but they only gave Kerry a seven point edge in 2004. In
general, Democrats face a tough challenge on this score. To give themselves the best
chance to win in the present environment, they need to convince people that, in the words
of Franklin D. Roosevelt, “there is nothing to fear but fear itself.” But, if their assurances
prove to be wrong and terrorism strikes the United States again, the damage to the party
could be irreparable for perhaps decades.
In making these observations, we do not mean to suggest that threat is the
currency of only conservatives. Liberals use threat of economic insecurity, in particular,
to their advantage with regularity. Conservatives do not make reference to grandmothers
too poor to pay for prescription medication or having to skip meals because Social
Security benefits might be reduced under privatization “schemes”. Those were campaign
themes forwarded by Democratic presidential nominee Al Gore in 2000. We do not
focus on these particular threats because preferences about Social Security and Medicare
are not structured by authoritarianism, but it is not that they are unimportant. They are
just beyond the scope of our study.
In the next chapter, we turn to the
31
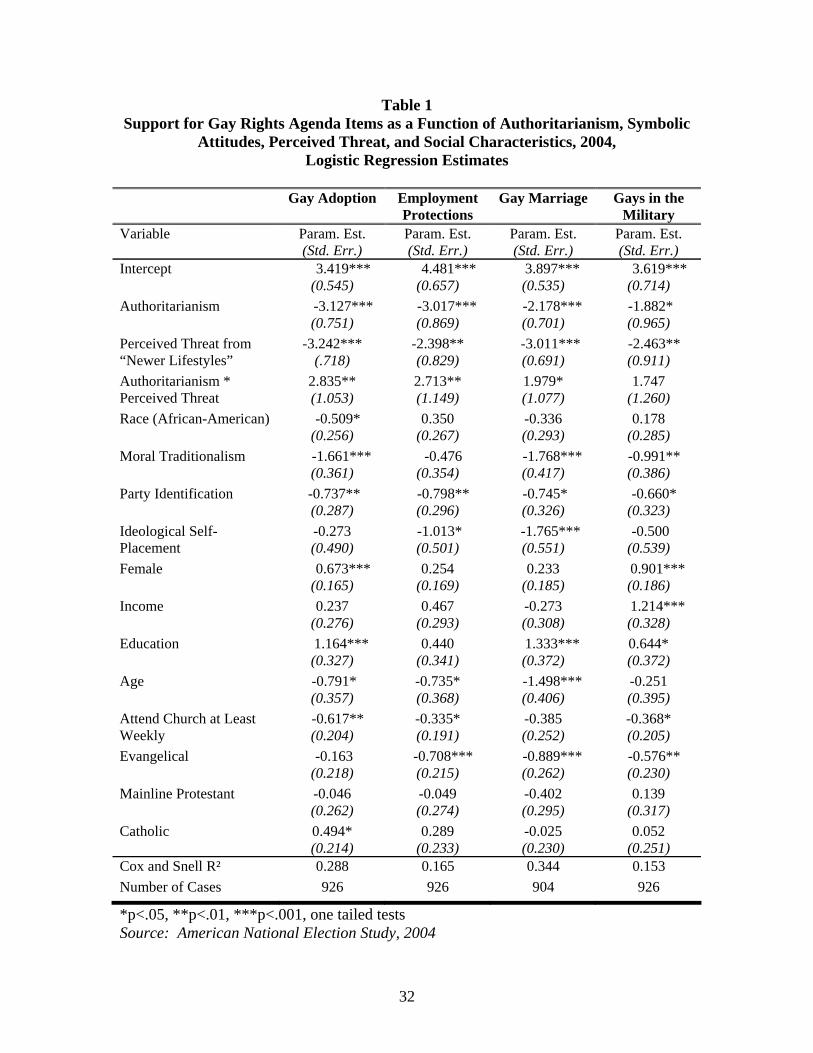
Table 1 Support for Gay Rights Agenda Items as a Function of Authoritarianism, Symbolic
Attitudes, Perceived Threat, and Social Characteristics, 2004, Logistic Regression Estimates
Gay Adoption Employment
Protections Gay Marriage Gays in the
Military Variable Param. Est.
(Std. Err.) Param. Est. (Std. Err.)
Param. Est. (Std. Err.)
Param. Est. (Std. Err.)
Intercept 3.419*** (0.545)
4.481*** (0.657)
3.897*** (0.535)
3.619*** (0.714)
Authoritarianism -3.127*** (0.751)
-3.017*** (0.869)
-2.178*** (0.701)
-1.882* (0.965)
Perceived Threat from “Newer Lifestyles”
-3.242*** (.718)
-2.398** (0.829)
-3.011*** (0.691)
-2.463** (0.911)
Authoritarianism * Perceived Threat
2.835** (1.053)
2.713** (1.149)
1.979* (1.077)
1.747 (1.260)
Race (African-American) -0.509* (0.256)
0.350 (0.267)
-0.336 (0.293)
0.178 (0.285)
Moral Traditionalism -1.661*** (0.361)
-0.476 (0.354)
-1.768*** (0.417)
-0.991** (0.386)
Party Identification -0.737** (0.287)
-0.798** (0.296)
-0.745* (0.326)
-0.660* (0.323)
Ideological Self-Placement
-0.273 (0.490)
-1.013* (0.501)
-1.765*** (0.551)
-0.500 (0.539)
Female 0.673*** (0.165)
0.254 (0.169)
0.233 (0.185)
0.901*** (0.186)
Income 0.237 (0.276)
0.467 (0.293)
-0.273 (0.308)
1.214*** (0.328)
Education 1.164*** (0.327)
0.440 (0.341)
1.333*** (0.372)
0.644* (0.372)
Age -0.791* (0.357)
-0.735* (0.368)
-1.498*** (0.406)
-0.251 (0.395)
Attend Church at Least Weekly
-0.617** (0.204)
-0.335* (0.191)
-0.385 (0.252)
-0.368* (0.205)
Evangelical -0.163 (0.218)
-0.708*** (0.215)
-0.889*** (0.262)
-0.576** (0.230)
Mainline Protestant -0.046 (0.262)
-0.049 (0.274)
-0.402 (0.295)
0.139 (0.317)
Catholic 0.494* (0.214)
0.289 (0.233)
-0.025 (0.230)
0.052 (0.251)
Cox and Snell R² 0.288 0.165 0.344 0.153 Number of Cases 926 926 904 926
*p<.05, **p<.01, ***p<.001, one tailed tests Source: American National Election Study, 2004
32
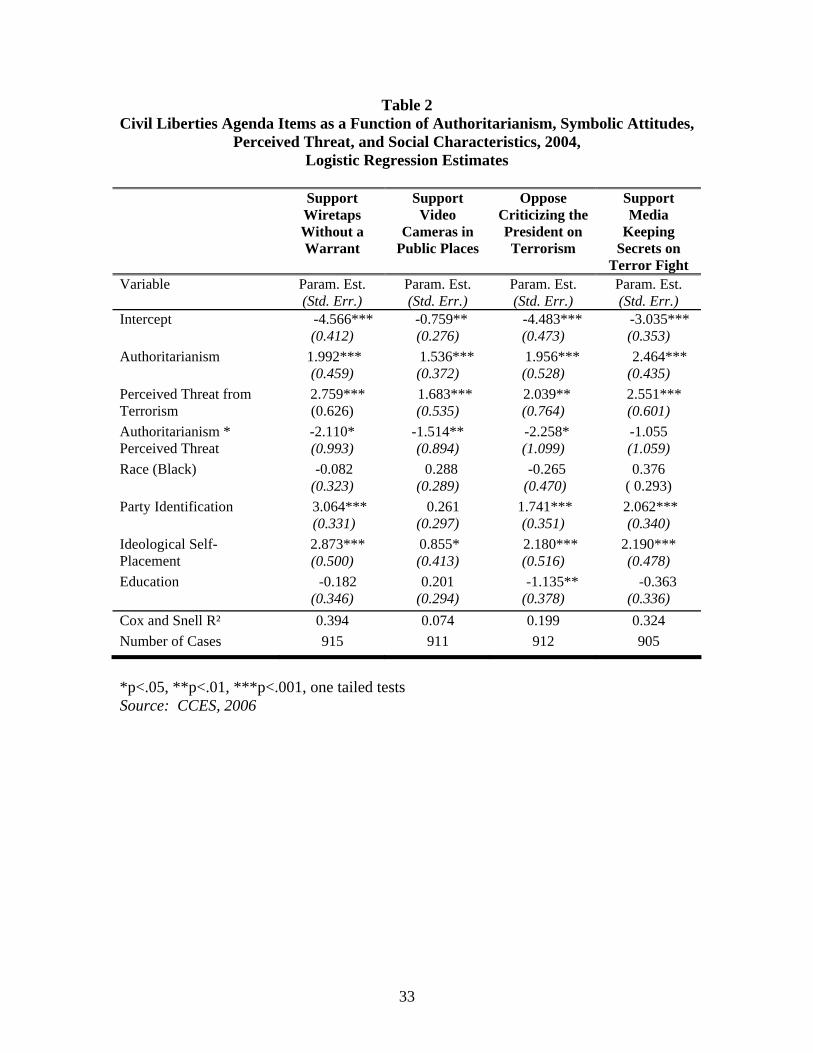
Table 2 Civil Liberties Agenda Items as a Function of Authoritarianism, Symbolic Attitudes,
Perceived Threat, and Social Characteristics, 2004, Logistic Regression Estimates
Support
Wiretaps Without a Warrant
Support Video
Cameras in Public Places
Oppose Criticizing the President on Terrorism
Support Media
Keeping Secrets on
Terror Fight Variable Param. Est.
(Std. Err.) Param. Est. (Std. Err.)
Param. Est. (Std. Err.)
Param. Est. (Std. Err.)
Intercept -4.566*** (0.412)
-0.759** (0.276)
-4.483*** (0.473)
-3.035*** (0.353)
Authoritarianism 1.992*** (0.459)
1.536*** (0.372)
1.956*** (0.528)
2.464*** (0.435)
Perceived Threat from Terrorism
2.759*** (0.626)
1.683*** (0.535)
2.039** (0.764)
2.551*** (0.601)
Authoritarianism * Perceived Threat
-2.110* (0.993)
-1.514** (0.894)
-2.258* (1.099)
-1.055 (1.059)
Race (Black) -0.082 (0.323)
0.288 (0.289)
-0.265 (0.470)
0.376 ( 0.293)
Party Identification 3.064*** (0.331)
0.261 (0.297)
1.741*** (0.351)
2.062*** (0.340)
Ideological Self-Placement
2.873*** (0.500)
0.855* (0.413)
2.180*** (0.516)
2.190*** (0.478)
Education -0.182 (0.346)
0.201 (0.294)
-1.135** (0.378)
-0.363 (0.336)
Cox and Snell R² 0.394 0.074 0.199 0.324 Number of Cases 915 911 912 905
*p<.05, **p<.01, ***p<.001, one tailed tests Source: CCES, 2006
33
Table 3 Attitudes on the Use of Force as a Function of Authoritarianism, Symbolic
Attitudes, and Social Characteristics, 2006 Logistic Regression Estimates
Iraq War Was
Not a Mistake Follow National
Interest vs. Allies Better to Rely on Strength opposed
to Diplomacy Variable Param. Est.
(Std. Err.) Param. Est. (Std. Err.)
Param. Est. (Std. Err.)
Intercept -4.761*** (0.444)
-3.432*** (0.374)
-4.751*** (0.422)
Authoritarianism 2.022*** (0.505)
0.937* (0.438)
1.743*** (0.471)
Perceived Threat from Terrorism 3.314*** (0.677)
0.270 (0.668)
3.247*** (0.648)
Authoritarianism * Perceived Threat from Terrorism
-3.265*** (1.076)
0.636 (0.986)
-2.621** (1.016)
Race (African-American) -0.173 (0.389)
0.158 (0.342)
-1.634*** (0.445)
Party Identification 4.334*** (0.381)
1.574*** (0.332)
2.614*** (0.329)
Ideological Self-Placement 2.440*** (0.533)
1.766*** (0.462)
3.167*** (0.515)
Education -1.123** (0.376)
-0.307 (0.325)
0.167 (0.347)
Cox and Snell R² 0.456 0.176 0.394 Number of Cases 915 910 909
*p<.05, **p<.01, ***p<.001, one tailed tests Source: CCES, 2006
34
35
Table 4 Approval of George W. Bush as a Function of Authoritarianism, Threat, Its
Interaction, Political Predispositions and Social Characteristics, 2006 Logistic Regression Estimates
Variable Parameter Estimate
(Standard Error) Intercept -7.002***
(0.965) Authoritarianism 2.301**
(0.849) Perception of Threat from Terrorism 2.736**
(1.132) Authoritarianism * Perception of Threat from Terrorism
-3.028* (1.729)
Partisanship 2.543*** (0.560)
Ideology 4.580*** (0.858)
Retrospective Economic Evaluations 4.980*** (0.681)
Should Withdraw from Iraq -1.378*** (0.307)
Education 0.907** (0.315)
Gender (Female) -5.603 (3.148)
Race (African-American) -2.293*** (0.728)
Income -0.561 (0.645)
Age -0.039 (0.722)
Cox and Snell Psuedo R² 0. Number of Cases
* p<.05, ** p<.01, ***p<.001 – one tailed tests Source: CCES, 2006
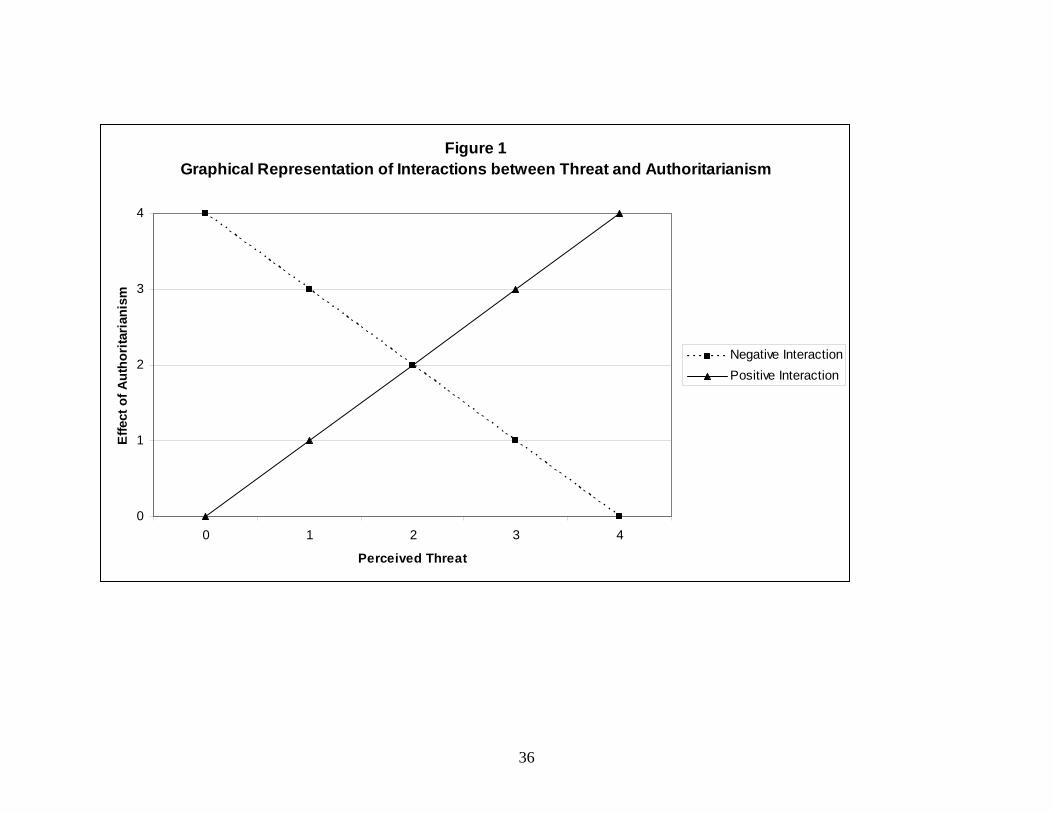
Figure 1Graphical Representation of Interactions between Threat and Authoritarianism
0
1
2
3
4
0 1 2 3 4
Perceived Threat
Effe
ct o
f Aut
hori
tari
anis
m
Negative InteractionPositive Interaction
36
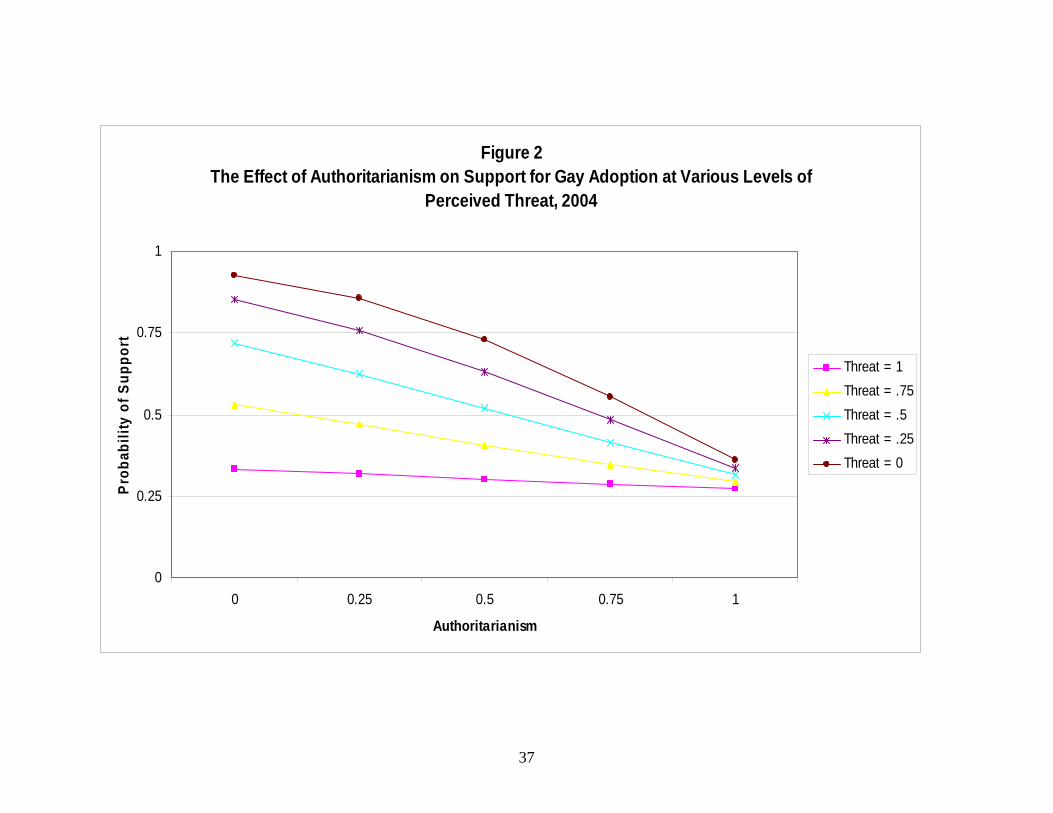
Figure 2The Effect of Authoritarianism on Support for Gay Adoption at Various Levels of
Perceived Threat, 2004
0
0.25
0.5
0.75
1
0 0.25 0.5 0.75 1
Authoritarianism
Prob
abili
ty o
f Sup
port
Threat = 1Threat = .75Threat = .5Threat = .25Threat = 0
37
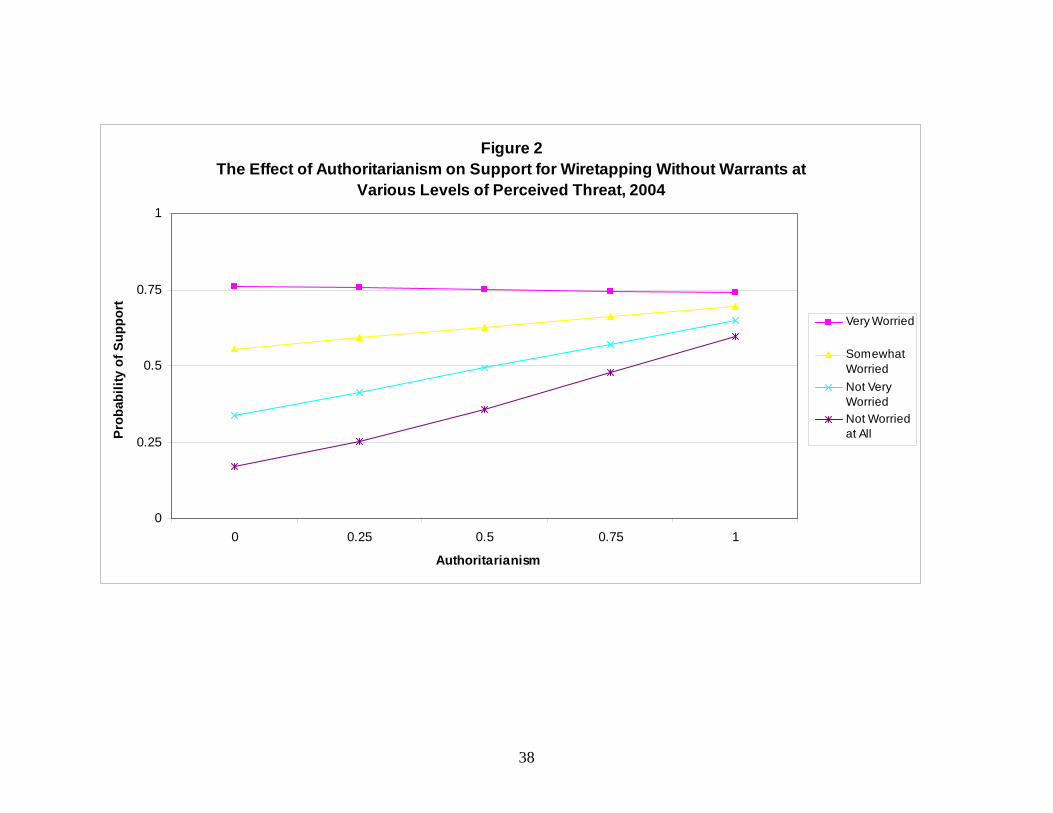
Figure 2The Effect of Authoritarianism on Support for Wiretapping Without Warrants at
Various Levels of Perceived Threat, 2004
0
0.25
0.5
0.75
1
0 0.25 0.5 0.75 1
Authoritarianism
Prob
abili
ty o
f Sup
port
Very Worried
SomewhatWorriedNot VeryWorriedNot Worriedat All
38
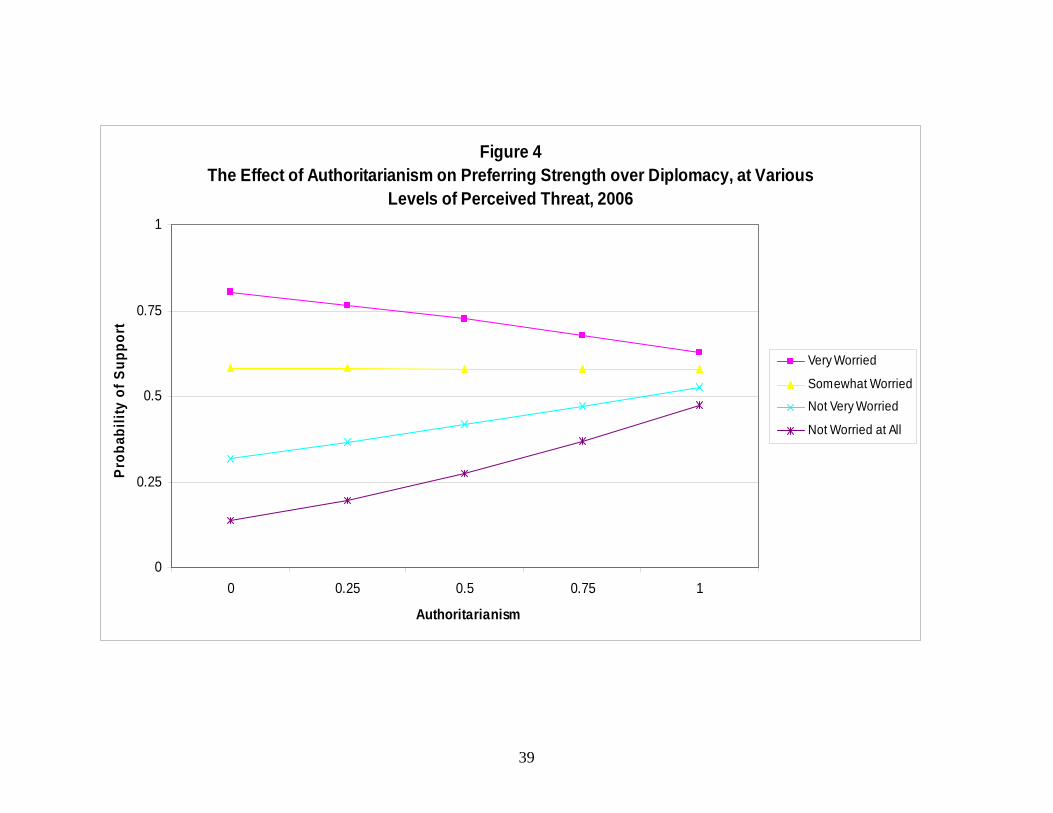
Figure 4The Effect of Authoritarianism on Preferring Strength over Diplomacy, at Various
Levels of Perceived Threat, 2006
0
0.25
0.5
0.75
1
0 0.25 0.5 0.75 1
Authoritarianism
Prob
abili
ty o
f Sup
port
Very Worried
Somewhat Worried
Not Very Worried
Not Worried at All
39

40
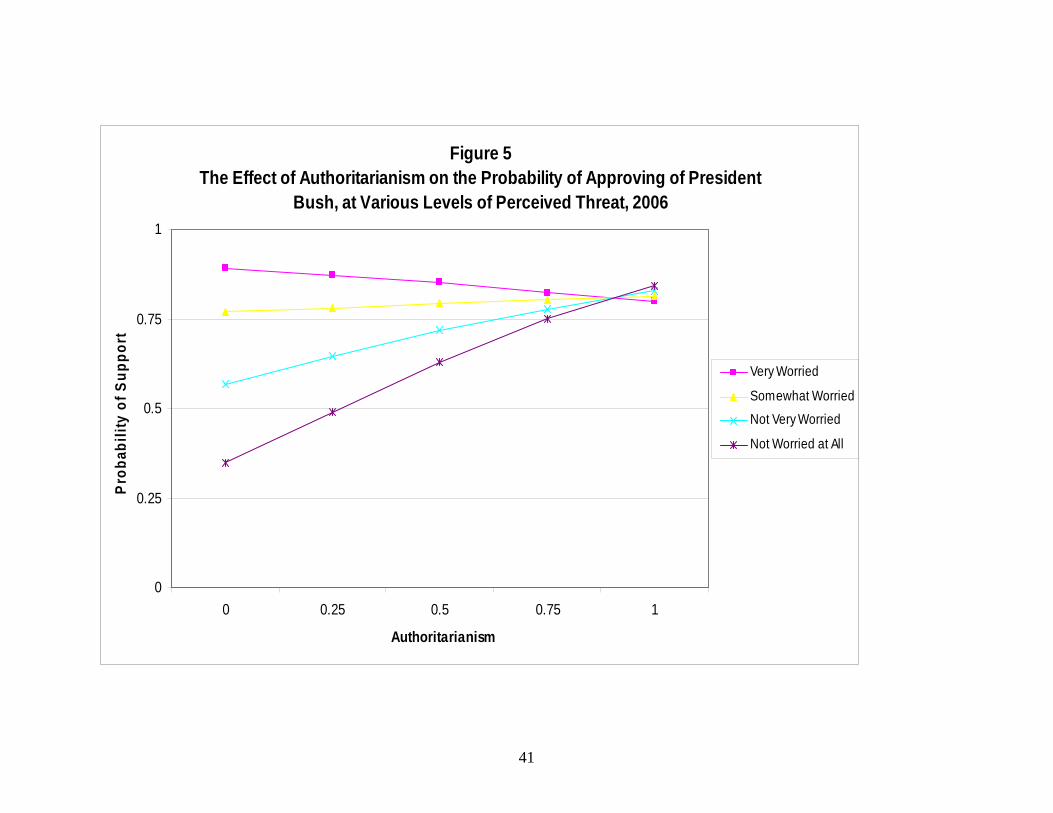
Figure 5The Effect of Authoritarianism on the Probability of Approving of President
Bush, at Various Levels of Perceived Threat, 2006
0
0.25
0.5
0.75
1
0 0.25 0.5 0.75 1
Authoritarianism
Prob
abili
ty o
f Sup
port
Very Worried
Somewhat Worried
Not Very Worried
Not Worried at All
41
Chapter 6
From Issue Evolution to Worldview Evolution
The notion of issue evolution, initially developed by Carmines and Stimson
(1981, 1986, 1989), outlines a plausible means by which issues emerge as central to
political debates and, in the process, divide the parties. They argue that “most issues most
of the time lie dormant” and therefore do not make an impact with the public or on the
political system (Carmines and Stimson 1986, 902). Every so often, however, an issue
that evokes a strong emotional response emerges and has the power to redefine the lines
of political conflict. Importantly, changes in elite behavior are at the core of this
understanding of political change, and they drive mass partisan response. For the mass
response to occur, the public must recognize a difference in the positions of the parties on
the new issue and come to care about that difference.
The issue evolution framework is relevant to our work for two reasons. First,
scholars have produced ample evidence that the necessary polarization of opinion on the
elite level has already taken place on a range of issues in which authoritarianism
structures opinions, namely race (Carmines and Stimson 1989), feminism (Wolbrecht
1999), and gay rights (Lindaman and Haider-Markel 2002). Our discussion about torture,
the rights of enemy combatants, and the War in Iraq make clear the distinctions extend to
these areas as well. Importantly, scholars have shown that the mass response to this elite
polarization had already occurred in certain areas (e.g. race and feminism), and we have
shown in Chapter 4 that the same process has more recently occurred for gay rights, the
disposition toward force and Iraq, and preferences for tradeoffs between civil liberties
1
and security. Republican survey respondents were significantly to the right of
Democrats, even after controlling for authoritarianism. Second, all these issues have
been of interest to scholars in the past specifically because of their ability to evoke a
strong emotional response.
We extend this understanding of political change to that of a worldview evolution.
By worldview, we mean a set of connected beliefs animated by some fundamental,
underlying value orientation that is itself, connected to a visceral sense of right and
wrong. In this case, we argue, the newly relevant issues along which America is dividing
politically can be explained by authoritarianism. What connects the issues in the
worldview we describe is a need for order, whether in shaping interpersonal relations or
in response to knotty international problems and a requisite hostility toward those people
or ideas who appear to challenge order.
The First Step: Voting Behavior
Since party identification is a deeply held psychological attachment to a centrally
important political group, changes in it are slow to come. For example, even though the
party system evolved from one structured by the New Deal to one structured by race and
the civil rights movement in the 1960s (Carmines and Stimson 1989), it took another
twenty years for durable changes in party identification to take root, particularly in the
South (Green, Palmquist and Schickler 2002). Many who lived through this tumultuous
period found it difficult to identify themselves with the party of Lincoln even though their
sensibilities on race matched those of the contemporary Republican party.
2
Even if party identification did not change quickly, voting behavior did. The first
rumblings of a realignment in southern voting behavior, if not identification, occurred in
1952 when Dwight Eisenhower won Virginia, Tennessee, and Florida and then added
Louisiana to these three in 1956. In 1964, anti-integration forces delivered Barry
Goldwater, the GOP nominee, five southern states, the only states that he won nationally
other than his native Arizona. Former Georgia governor, Jimmy Carter, nearly swept the
region in 1976 for the Democrats, but Ronald Reagan dominated Carter in the
incumbent’s home region, with Carter only hanging on to Georgia in 1980. Even so,
most southern whites continue to think about themselves as Democrats well into the
1980s (Green, Palmquist, and Schickler 2002).
We expect to find a similar chronology for authoritarianism. Changes in party
identification might take time to occur, but such changes ought to be presaged by changes
in voting behavior. It is not as though gay rights and the proper response to terrorism are
the only issues that might divide the more authoritarian from the less authoritarian.
Given that Republican and Democratic elites were taking clear positions on issues like
race, feminism, and an assortment of “culture wars” issues, we expect to find some
indication of worldview evolution emerging in presidential voting well before the
beginning of the 21st Century.
This might manifest itself in two ways. First, it seems likely that authoritarianism
might create an asymmetry to whether Republicans or Democrats decided to vote or
abstain. Specifically, as the Republican position on issues for which preferences are
structured by authoritarianism became friendlier to those who score high and as the
Democrats took a clear and opposing position, Democrats who score high in
3
authoritarianism might become less likely to participate in elections than Republicans
who score high. Second, among those who turn out to vote, authoritarianism ought to do
more to explain vote choice as more issues on the authoritarian dimension become more
salient. Indeed, the use of these issues in election contests is apparently designed to
attract swing voters. Hillygus and Shields (2008) show that Democrats are particularly
vulnerable to them because a significant number of Democratic partisans do not share
their party’s position on things like race, gay rights, and the like. In the short run, these
issue appeals may attract them to the Republican candidate. In the long run, these voters
will be the prime candidates for party identification change in coming years.
Vote or Abstain
It is well established that those scoring high in authoritarianism tend to feel
alienated from many things, including politics. As a result, they tend to vote at much
lower rates. Table 1, which tracks voter turnout among Republican and Democrats
broken down by the number of authoritarian responses they provide to the child rearing
battery, provides further support for this finding. We confine this analysis and those that
follow in this chapter to non-black respondents. African-Americans are, in fact, the most
authoritarian racial group in the U.S. by far.4 Yet, for obvious historical reasons, they
remain an overwhelmingly Democratic group (see also Bartels 2006 in focusing on non-
blacks). Although it is plausible to think that the Republican issue agenda might be
attractive to African-Americans in the future, it is a group that is clearly tethered to the
Democratic party for now.
(Table 1 About Here) 4 The mean authoritarianism score for blacks is .75 in 2004. For non-blacks it is .55.
4
For the three years that we have data on authoritarianism – 1992, 2000, and 2004
– those who score at the scale’s maximum are significantly less participatory, regardless
of party. For example, roughly 80 percent of Republicans and Democrats claimed to
have voted overall, yet only about 65 percent of those scoring at the maximum of the
authoritarianism battery did. The 1992 data are particularly important for our purposes
because they show that those scoring high in authoritarianism regardless of party were
about equally likely to say they voted.
After 1992, however, an interesting, and we argue predictable, new dynamic
develops. As the Republicans adopted a larger number of issue positions friendly to
those with an authoritarian worldview and Democrats took the other side, self-identified
non-black Democrats who score high in authoritarianism began to turn out at lower rates
while self-identified Republicans who score high in authoritarianism started to vote at
higher rates. Specifically, the voting rate among Republicans who scored at the
maximum of the authoritarianism index increased from 65 percent in 1992 to well over
70 percent in both 2000 and 2004. For Democrats, the percentage of reported voters fell
from 63 percent in 1992 to 56 percent in both 2000 and 2004.
Among those who scored .75 on the authoritarianism scale, the change in
behavior was stark between 2000 and 2004, specifically. Among Democrats, self-
reported turnout among this group dropped by five percentage points, from 75 to 70.
Among Republicans, self-reported turnout surged from 79 to 90 percent. We conclude
from this pattern of results that Republicans who score high in authoritarianism, typically
a politically disaffected group, feel more enthusiasm about politics because of the recent
5
tack of the Republican party. Democrats with a similarly authoritarian worldview feel
the reverse.
Presidential Vote Choice
In addition to guiding decisions about voter turnout, we suspect authoritarianism
will have started to guide decisions about vote choice by the 1990s. Table 2 provides the
evidence. In the table, we present the mean authoritarianism score among people who
voted for major party presidential candidates over the three elections we have data on
authoritarianism, 1992, 2000, and 2004. We also track the degree to which people who
defected from their party identification in voting differ from those who voted consistent
with their party identification. To the degree that differences between defectors and loyal
partisans exist, it suggests that partisan changes might soon be in the offing.
(Table 2 About Here)
Our data reveal some evidence of such a pattern with authoritarianism. In 1992,
there was a modest, although statistically significant difference, in the authoritarianism of
George H.W. Bush voters and Bill Clinton voters, with Bush voters scoring about eight
percentage points higher in authoritarianism. It is also worth noting that, in a campaign
kicked off in some respects by Pat Buchanan’s fiery culture war speech at the Republican
National Convention, authoritarianism among Democrats who voted for Bush was about
thirteen percentage points higher than authoritarianism among Democrats who voted for
Clinton.
Between 1992 and 2000, the difference in authoritarianism between Republican
and Democratic presidential voters increased by nearly 50 percent from 8 to about 12
6
percentage points. Once again we see authoritarianism driving defections among
Democrats with the mean among those who voted for Gore significantly lower than the
mean among those who voted for George W. Bush in 2000. This time, Republicans who
defected from Bush were also about 14 points less authoritarian than Republicans who
stayed loyal to Bush.
We find the largest differences in authoritarianism between major party
presidential candidate voters in 2004. Bush voters scored 14.5 percentage points higher
in authoritarianism than Kerry voters. In 2004, however, we see a return to the
asymmetry to party defections we observed in 1992. Specifically, Democrats who
defected to Bush were about 15 points higher in authoritarianism than Democrats who
stayed loyal to Kerry. There was no difference in authoritarianism between Republicans
who defected or remained loyal.
In our view, the generally asymmetric patter to defections suggests the success of
the Republicans’ campaign strategy. The Bush campaign’s micro-targeting efforts were
mostly directed at cross-pressured voters, those who identify as Democrats but have
policy preferences that run counter to that party’s elites (Hillygus and Shields 2008).
Since the issues on which most Democrats were cross-pressured were authoritarian
issues, such as gay rights and combating terrorism, evidence that Republicans had
successfully peeled off such voters would be a large gap in authoritarianism between
loyal and defecting Democrats, exactly what we find. On gay rights and dealing with
terrorism, specifically, Democratic elites have been much less aggressive in using these
issues to peel away non-authoritarians who identify with the GOP, probably (rightly)
fearing that they would risk repelling more authoritarian Democrats..
7
Voting at the Senatorial Level
Presidential voting might not reflect general trends because the characteristics of
specific candidates and themes of specific campaigns can play a vital role. The pattern of
results above might reflect a particular set of candidacies. Examining results at the
Senate level can help mitigate this concern. Presumably Senate elections offer a broad
sample of candidates and campaigns across contexts. To the extent that authoritarianism
seems to structure vote choice at this level, too, we would be more confident about our
findings at the presidential level. Again, using race as a parallel, many anti-civil rights
Democrats, who had voted for Republicans from Goldwater to Reagan, continued to vote
down the ballot for Democrats because these candidates were generally less pro-civil
rights than the party’s standard bearers. Race based voting filtered down to lower levels
as older Democratic members of Congress retired.
In Table 3, we replicate the presidential analysis for Senate vote choice. The
Senate results follow a similar pattern, but they depart in ways that are theoretically
pleasing. In 1992, Republican Senate voters were slightly more authoritarian than
Democratic Senate voters, but even less so than at the presidential level. Similarly,
Democrats who defected from their party’s candidate were also only slightly more
authoritarian than Democrats who voted for their party’s candidates. The story was
basically the same in 2000, although the difference in authoritarianism between
Republican and Democratic voters increased to some degree.
In 2004, however, we see a fundamental change to the relationship. Whereas the
difference in authoritarianism between Republican and Democratic voters was nine
8
percentage points in 2000, it increased to just over 14 percentage points in 2004. Even
more dramatic, however, was the nearly 19 percentage point difference between
Democrats who stayed loyal to the Democratic Senate candidate and Democrats who
defected for the Republican candidate. We read this as further evidence of a winning
Republican electoral strategy.
The results from our part of the 2006 CCES study, which we referenced in
Chapter 4, also support the worldview evolution hypothesis. The authoritarianism
difference between Republican and Democratic voters reached its maximum at 23
percentage points. Moreover, authoritarianism seems to be at the heart of both
Republican and Democratic defections. Loyal Democrats were 17 percentage points less
authoritarian than Democratic defectors, and, in this case, Republican defectors were
about 15 percentage points less authoritarian than loyal Republicans. This is the only
year in which the decision of Republicans to stay loyal to or defect from their party’s
candidate was influenced by authoritarianism.
A new attitude structuring vote choice can often be a harbinger of a change in the
ingredients of party identification. This is the pattern of results we find in the turnout and
vote choice analyses. We should add that the results for defections in the later year are
particularly impressive, if we are correct that party identification is now, in part,
structured by authoritarianism. If people are already sorted into the correct party on this
cleavage, it decreases the percentage whose party and authoritarianism are poorly
matched. The fact that the results seem to sharpen in these later years is particularly
impressive. We turn next to examining whether party is indeed now a function of
authoritarianism as well.\
9
Party Sorting on Issues Structured by Authoritarianism
When party elites take divergent positions and people perceive these differences,
ordinary Americans can align their preferences on emerging issues with their favored
party elites, which ought to result in mass partisan polarization (Carmines and Stimson
1989). Indeed, Carmines and Stimson’s theory is central to understanding the party
sorting that Fiorina (2005) uncovers. Importantly, the results presented in Figure 1
suggest that this is, indeed, occurring on issues that we have demonstrated in Chapter 4
are in part structured by authoritarianism. We focus here on non-black respondents.
Take gay rights.5 Even before gay adoption and gay marriage received much
attention from elites, party differences among non-blacks were obvious. When the gay
adoption question debuted in the 1992 NES, Democrats were 16 percentage points more
supportive than Republicans. By 2004, that percentage had doubled to 32 points. With
the increase in emphasis on the elite level, mass support for gay marriage has also
experienced a similar partisan polarization. In 1996, when the gay marriage question was
introduced by Gallup, 18 percentage points divided partisans. By 2004, the difference
had increased to 29 percentage points.
It is more difficult to find items that have been asked consistently over time about
the use of force. Here we focus on items asked in the NES about the military: support for
defense spending and the Military feeling thermometer. Similar to the gay rights issues,
both exhibit a marked recent increase in mass party sorting. From 1984 to 2000,
Democrats and Republicans never differed by more than about 5 degrees in their average
5 One indication that we are correct in asserting that gay adoption and gay marriage occupied little space on the issue agenda is that survey houses did not even ask questions about them until 1992 (gay adoption) and 1996 (gay marriage), respectively (see Geer 2006, for a similar use of survey questions).
10
feelings about the military. In 2004, however, that difference more than doubled to about
11 degrees. Support for defense spending follows roughly the same pattern. To make
this seven point scale item comparable to the feeling thermometer and the percentage
supporting gay marriage and gay adoption, we map it onto a (0, 1) interval by subtracting
one and dividing by six. We then multiply this by 100, so we can interpret the
differences between Republicans and Democrats as percentage differences. From 1988
to 2000, the percentage difference between Republican and Democratic preferences on
defense spending was about 10 points. In 2004, however, that percentage nearly doubled
to 19 points.
Compare these results with those on a range of issues for which preferences are
not structured by authoritarianism. We draw on seven point scale items that the NES
regularly asks about health care, government services and spending, and whether or not
the government ought to provide a job and ensure a minimum standard of living. Figure
2 tracks the percentage difference between self-identified Republicans and Democrats on
these issues. Although we see a sharpening of party differences from the late 1980s to
the mid-1990s, there is no such movement more recently. Our analysis very clearly
suggests that sorting is occurring, but only on the issues that are structured by an
authoritarian worldview.
(Figure 2 About Here)
Taken together, these results suggest the potential for a new and important role for
authoritarianism is structuring party identification. That party adherents are moving
further apart on these specific issues suggests that authoritarianism is providing some
connective tissue between these attitudes. We are not suggesting that other factors are no
11
longer important. In fact, the results in Figure 2 suggest that New Deal issues remain
important, insofar as the differences between Republicans and Democrats are still quite
large. The key, however, is that these differences have not been increasing during this
period of perceived polarization while the differences for issues structured in part by
authoritarianism have.
Explaining Partisanship
To test whether authoritarianism now structures party identification, we estimate a
regression model explaining party identification at several points over time. Again, we
focus on non-black respondents. Specifically, we regress the seven point partisanship
scale on the range of social characteristics, including education, Age, Income, gender,
race (whether or not the respondent is Hispanic) religious denomination, and church
attendance, along with authoritarianism. In addition, we need to take into account the
traditional left-right dimension in American politics. Hence we also include the
respondent’s preference for how much the government ought to spend on a range of
programs.6 In addition, we control for moral traditionalism to tap the fact that people
might have a strong principled reason for choosing a party based on culture war issues.7
By including a measure of principled social conservatism on the right hand side, we want
to separate out the effects of being principled in support of socially conservative causes
from being intolerant toward groups that are perceived different.
6 We calculate this as the mean score of people’s spending preferences on three issues: public schools, Social Security and child care. These are the three issues that the NES asked in all three election studies that we would not expect authoritarianism to affect. Although the seven point scale questions are also attractive, the NES only asked them to a half sample in 2000, while the other half-sample received branching items in phone interviews. 7 We calculate this as the mean score of people’s preferences for abortion and a woman’s proper role in society.
12
Theoretically, we feel strongly that authoritarianism is causally prior to
partisanship. Indeed some research suggests that it may be an inherited trait (Altemeyer
1996). Although theory is sometimes undermined by measurement, we believe that is
unlikely in this case. One great advantage of the authoritarianism battery is that it asks
about child rearing preferences, which are not a specific part of the political dialogue.
Indeed, these preferences seem to capture a worldview that is applicable to scores of
developed and less developed countries no matter the party or political system (Feldman
2003). Moreover, if we assume simultaneity and estimate an instrument for party
identification using two stage least squares, it is not significant in a model explaining
authoritarianism.8 If we find a significant effect for authoritarianism, it suggests that
causation flows from it to party identification, not the other way around.
Results
The NES has only irregularly asked the authoritarianism battery that we use in our
analysis, so our inquiry necessarily focuses on three election studies, 1992, 2000, and
2004. We are also able to make some use of a fourth study, the 2006 NES Pilot Study.
In 2006, the NES conducted 675 interviews with people who participated in the 2004
NES. Although the NES did not ask its authoritarianism battery in 2006, these questions
were asked in 2004. Provided responses to these items are reliable over time, we can use
8 The model that we specified for authoritarianism using 2004 NES data controlled for gender, ethnicity, income, education, age, church attendance, and a belief in Biblical inerrancy, in addition to the party identification instrument. We created the party identification instrument using the following variables: religious denomination (dummy variables for Protestants, Catholics, and Jews), principled social conservatism, economic evaluations, preferences for government spending, opinions on tax cuts, the death penalty, Social Security privatization, school vouchers, and the Iraq War as well as racial resentment. Of course, the party identification instrument also included each of the exogenous regressors in the authoritarianism equation.
13
the 2004 responses to explain variance in partisanship as measured in 2006.
Unfortunately, the NES asked only a random half sample its partisanship questions, so
our analysis of 2006 data includes fewer than 300 cases. Hence we must be more
conservative about the conclusions we draw from these data. To the extent that we find
significant relationships, however, it does suggest they are particularly robust given the
small number of cases.
The results from our models appear in Table 4. Most important for our purposes
is the changing effect of authoritarianism. In 1992 the effect of authoritarianism did not
even approach conventional levels of significance. By 2000, the effect of
authoritarianism had increased such that it brushed up against the boundary of statistical
significance, but its magnitude was not substantively very large at .071. This estimate
means that, in moving from least to most authoritarian in 2000, our model predicts that a
person’s party identification would move about seven percentage points in a Republican
direction on average.
(Table 4 About Here)
Of course, the importance of issues like gay rights, the role of Fundamentalist
Christians in politics, the war in Iraq, and the tradeoffs required by the war on terrorism
increased exponentially after 2000. As a result, we should – and do – find that the effect
of authoritarianism increases dramatically. In fact, its parameter estimate more than
doubles in the four years between 2000 and 2004. Since all the variables are mapped
onto (0,1) intervals, these effects can be interpreted easily. In 2004, when one moves
from least to most authoritarian, placement on the party identification scale moves in a
Republican direction by .169 points, or something about one-sixth of the scale’s range.
14
Of course, such a change represents a full point on the NES’s partisanship scale, a
substantively significant effect to say the least.
It is not just that this increase in effect is impressive. Its effect relative to other
variables is at least as impressive. Although class as measured by income has become an
increasingly important predictor of party identification (Stonecash 2000), the effect of
authoritarianism goes from being less than half that of income in 2000 to being larger in
2004, other things being equal. Indeed, authoritarianism’s effect in 2004 is larger than all
the demographic variables in the model.
We do not mean to suggest that authoritarianism has rendered unimportant the
traditional cleavage that divides into parties those who prefer smaller government that
spends less and those who prefer larger government that spends more. Indeed, between
1992 and 2004, the effect of preferences for government spending consistently exerts a
larger effect than authoritarianism. Even in 2004, with authoritarianism’s effect
increasing dramatically, the effect of preferences for government spending is nearly twice
that of our variable of interest. However, the effect of authoritarianism was less than
one-sixth that of preferences for government spending in 2000. By 2004, the effect of
authoritarianism was little more than one half smaller, a remarkable change in four years.
The results from 2006 appear in the last column in Table 4. Again, we reiterate
the need to be conservative in our interpretation of results because of the small sample
size and the nature of the data collection.9 With those caveats in mind, the results for
authoritarianism are remarkable. Despite the fact that all the independent variables,
including authoritarianism are measured in 2004 while party identification is measured in
9 Although we employ a range of statistical controls, we still use the panel weight for the multivariate analysis. This has the effect of actually decreasing the estimate for authoritarianism slightly and increasing the effect of income greatly.
15
2006, the effect of authoritarianism in the 2006 model is more than double what it was in
the 2004 model when both variables were measured at roughly the same time.10
Although the standard errors are too large to make too much of it, authoritarianism
actually has a larger estimated effect than any other variable in the model, including
preferences for government spending and moral traditionalism. It is not as though these
variables are not important in 2006. In fact, their effects are roughly what they were in
2000 and 2004. The important change is that the effect of authoritarianism has grown so
much larger.
We believe the pattern of these results square well with our theory and the results
presented in the previous two chapters. It is first important to have issues for which
preferences are structured by authoritarianism find their way to the issue agenda. This
process has been building over time. With the introduction of terrorism on the U.S.
homeland, the war in Iraq, and the increased importance of gay rights, it appears that the
political dialogue became saturated with such issues by 2004. It is also likely that the
increased effect of authoritarianism between 2004 and 2006 is the result of decreasing
levels of threat people feel from both terrorism and gays and lesbians. Unfortunately, this
hypothesis is impossible to test using NES data because the NES did not ask about how
threatened people felt by terrorism at all and only asked how threatened people felt by
gays and lesbians only in 2004.11 We suspect that those scoring lower in
authoritarianism felt more threat from these things in 2004 than in 2006 for fairly obvious 10 Indeed the simple correlation between authoritarianism and partisanship measured in 2004 among non-black respondents was .17, which is relatively strong for survey data. But the correlation between authoritarianism measured in 2004 and partisanship measured in 2006 is a much stronger .25. 11 Our CCES data provide us some indication that the negative interaction between authoritarianism and threat holds for partisanship as well. Although we cannot estimate a fully specified model of party identification because too many variables, such as moral traditionalism, are not available, we could estimate one that included most of the demographic controls. If we use the threat from terrorism measure to tap threat, we do uncover the familiar negative interaction between threat and authoritarianism.
16
reasons. On terrorism, the country was two more years removed from September 11.
And, on gay rights, the trend since the 1980s has been decreasing. If we are correc
if the negative interaction between threat and authoritarianism exists, it suggests tha
preferences of those scoring lower in the authoritarianism would move to the left as a
result while those scoring high in authoritarianism would remain about the same. Other
things being equal, that would lead to a polarization of opinion and, with it, a greater
effect for authoritarianism.
t, and
t the
Analysis of Panel Data
As a further test, we can also use panel data to test whether authoritarianism is
structuring change in party identification among individuals. Panel data are rare in the
social sciences, but they can be very useful. In regular cross-sectional data, different
samples are taken for each reading, so none of the respondents are actually the same
people. Panel data are different in that the same people are asked the same questions at
multiple points in time. Hence it allows researchers to track how a cross-section of the
same individuals behaves over time.
In Table 5, we present the average party identification score among those who
responded to both the 2000 and 2004 waves of the American National Election Studies
2000, 2002, and 2004 panel study. Party identification is coded from 1 to 7, anchored by
strong Democrat at the minimum of the scale and strong Republican at the maximum.
Hence negative differences between two readings of party identification, which appear in
the last column, suggest people are moving toward the Democrats the period in question.
Of course, positive differences suggest movement toward the Republicans.
17
The results, for the most part, conform to expectations. Consistent with the
results in the multivariate model, it is worth noting the increasingly strong linear
relationship between the authoritarianism and party identification. The average
difference between those scoring at the minimum of the authoritarianism scale and those
scoring at the maximum increases from under a point in 2000 to 1.3 points in 2004. This
increase is statistically significant at conventional levels of significance. More important
for our purposes, we see the expected directional change occurring in all categories. For
those who provided either 0 or 1 authoritarian response to the child rearing battery, we
find negative signs, suggesting movement toward the Democrats. Among those who
provided 3 or 4 authoritarian responses, we see positive signs, indicating movement
toward the Republicans.
(Table 5 About Here)
We should make clear that these changes in individual categories are small, and
only those at the extremes of the scale graze statistical significance. But it is important to
realize that we are tracking change over time in party identification, which is, by far the
most stable of political attitudes (see e.g. Campbell et al. 1960; Krosnick 1991), and the
time frame we are constrained by is only four years. Hence, the pattern of change across
categories is probably more important in this case than the raw magnitude of the change
over time.
An Apparent Asymmetry
The conventional scholarly wisdom about authoritarianism would suggest that
changes in the relative attractiveness of the Republican and Democratic parties under the
18
contemporary conditions might reflect more authoritarian individuals abandoning the
Democratic party because they view it as too weak to cope with internal and external
threats. The data we presented earlier in the chapter seem to suggest this as it relates to
voting behavior. And, our panel analysis provides some evidence for this thinking as
well.
Most theories, however, are silent on what non-authoritarians might do. Our
theory of political change suggests that non-authoritarians might also be an important
group to watch. Indeed, the data on change in party identification using panel data
suggests this is the case, as we seen those scoring low in authoritarianism moving toward
the Democrats. Another way to examine the question is to examine people’s feelings
about the parties over time rather than just their identification with the parties.
Fortunately, the NES regularly asks Americans to rate both major parties on what
they call a feeling thermometer. People are asked to rate people or groups on a scale
from 0 to 100 degrees, where 0 to 50 means they feel negatively, 50 to 100 means they
feel positively, and 50 means they feel neither positively nor negatively. Including
among them are “The Republican Party” and “The Democratic Party.” Unfortunately,
the NES did not ask these questions to the panel respondents in 2004. Hence we will
have to compare the results from the two cross-sections that participated in the 2000 and
2004 NES surveys, respectively. We focus on these two years because the marked
increase in authoritarianism’s effect on party identification occurred between these two
presidential election years.
We first segment our sample by party identification. The conventional scholarly
wisdom about authoritarianism would suggest that self-identified Republicans, who are
19
increasingly authoritarian, would increasingly rally around their own party and against
the other, which would manifest itself as a higher Republican mean and a lower
Democratic mean among Republican identifiers. This story is only half correct. We find
that, among Republicans, opinions of the Democratic party remained constant between
2000 and 2004. It is true, however, that, in 2004, Republicans’ evaluation of the
Republican party increased by a statistically significant 3 degrees.
Evaluations by Democratic partisans, who became decreasingly authoritarian over
the period, have changed as well. While Democrats’ evaluations of their own party have
remained constant, their evaluations of the Republican party have dropped significantly.
In 2000, the mean score that Democrats gave the Republican party was 42.26 degrees. In
2004, it was only 37.72 degrees, a statistically significant drop of about 4.5 degrees.
Taking these results together with the analysis of Republican identifiers, the difference
between how Republicans feel about the Republican party and how Democrats feel about
it increased by more than 7.5 degrees between 2000 and 2004, which is a substantively
important change.
This increase in the relative polarization of opinion about the Republican party is
reflected in Figure 3. To be clear, we do not argue that this is a picture of popular
polarization. Such a picture would feature two peaks at the poles of the distribution with
few people providing answers in the middle. Still, we do find a marked increase in
respondents scoring the Republican party in the lower and upper thirds of the
thermometer. In 2000, better than 50 percent of Americans scored the party in the middle
third, but only about 40 percent did in 2004. The percentage of people scoring the
Republicans in the lower third of the thermometer increased by more than a third, from
20
15 to 21 percent. We also find a six percentage point increase in the percentage of
Americans providing responses in the warmest third of the distribution. Moreover, given
that Republicans like their party more in 2004 than 2000 and Democrats like it less, it is
not surprising to see a large increase in the standard deviation from 22.92 to 26.32.
Our central interest is how peoples’ levels of authoritarianism affected their
evaluations. Again we focus on responses to the Republican thermometer because there
was no change in the Democratic thermometer over time. Specifically, we compare how
feelings about the Republican party changed between 2000 and 2004 at various levels of
authoritarianism. The results appear in Table 5. Consistent with the scholarly
conventional wisdom about authoritarianism, we find significant increases in positive
affect among those who provide either 3 or 4 authoritarian responses to the child rearing
battery. Both these groups move from a mean in the high 50s to one in the low 60s. But,
it is those who provide no authoritarian responses whose evaluations change the most.
The mean for this group in 2000 was 44.73 degrees, but it dropped dramatically to 37.54
degrees in 2004, which is more than a seven point drop.
Explaining the Polarization in Feelings about the Republican Party
Why would non-authoritarians take such a dim view of the Republican party in
2004? One way to gain insight on this question is to test what is on people’s minds when
they are asked to evaluate the Republican party. To do this, we compare the correlations
between peoples’ answers to the Republican party feeling thermometer and their answers
to feeling thermometers for a number of groups in society. Our approach follows Miller,
Hildreth, and Wlezien (1991), who performed a similar analysis in their effort to explain
21
the Democrats’ sagging fortunes in the 1980s. They found that the correlations between
the Democratic party thermometer and feelings about controversial groups like feminists
and black militants had increased dramatically, while the correlation between the
Democratic party thermometer and universally embraced groups like the working class
had decreased.
We find a similar transformation in the minds of non-authoritarians with respect
to the Republican party when we compared the correlation between non-authoritarians’
feeling thermometer scores for the Republican party and a wide range of feeling
thermometers for social groups, political groups, and political institutions in 2004 with
the same correlations in 2000. In most cases, the correlations that were strong in 2000
were about equally strong in 2004. For example, the correlation between the Republican
party and “conservatives” was .52 in 2000 and .51 in 2004. Similarly, the correlation
between the Republican party and the military was .43 in 2000 and .42 in 2004.
The correlation between the Republican party and “Christian Fundamentalists”,
however, skyrocketed. In 2000, the correlation was a moderately strong .26. In 2004, it
had nearly doubled to .51. This suggests that, when non-authoritarians are thinking about
the Republican party, they are inclined to have Christian fundamentalists on their mind.
As we noted in Chapter 4, this change is important because Christian fundamentalists are
a deeply and increasingly unpopular group among non-authoritarians. Between 2000 and
2004, the mean Christian Fundamentalists feeling thermometer score for people who
provided no authoritarian responses to the four item battery of questions dropped from
35.48 degrees to 29.46 degrees.
22
Of even greater consequence, non-authoritarians felt more coldly by far toward
this group than every single one of the more than 30 groups that the NES asked about in
2004. The next closest was “Big Business”, with a mean just over 42. Of course, if these
non-authoritarians have Christian Fundamentalists on their mind when asked to evaluate
the Republican party, they are going to provide the Republican party much lower marks
than they would if they were thinking about any other group in American public life.12
This provides further evidence that those at the bottom of the authoritarianism scale are
centrally responsible for increased perceptions of polarization in American political life.
The Future of Partisan Polarization on Authoritarian Issues
These findings about the relationship between authoritarianism and party
identification have important implications for the scholarly debate on party polarization.
It follows from Fiorina’s argument that less polarizing cues from political elites will lead
to less polarization along party lines on the issues of the day. In that sense, it is relevant
that George W. Bush and John Kerry really were polar opposites in the 2004 presidential
campaign, a traditional Texas conservative squaring off against a typical Massachusetts
liberal. Indeed, Fiorina and Levendusky (2008) rightly note that the evidence
Abramowitz (2008) finds for increased party polarization is driven disproportionately by
data gathered in 2004. Moreover, citing data gathered from the late 1980s through the
early 2000s by the Pew Foundation, Fiorina (2006) argues that even these increased
12 It is possible that the apparent polarizing effect on feelings about the Republican party are driven by another variable. To guard against this concern, we estimated a multivariate model similar to the one we estimated for partisanship above, but this time using the Republican party feeling thermometer as the dependent variable. Our model provides controls for other potential causes of affect for the Republican party. As we expected, the effect of authoritarianism more than doubles between 2000 and 2004 from 7.321 to 16.526, ceteris paribus.
23
differences are not very large, with the average difference between Republican and
Democratic attitudes about 15 percentage points in 2003. Adding more fuel to Fiorina’s
argument, the Pew Center’s most recent update in 2007 shows these differences holding
steady at around 14 percentage points.
The implications for the future of polarization that we draw are at odds with
Fiorina’s. We do not dispute that partisans are, in large part, reacting to the stimuli that
they receive from their elites. But one important consequence of this is that
authoritarianism has become an important new ingredient in party identification in early
21st Century America, suggesting that people have internalized party differences on
issues that are structured in part by authoritarianism. This has been the case for the
traditional left-right dimension for decades, which means that the sorting process on this
dimension is much further along. Since it is relatively new for the authoritarian
dimension, it ought to lead to a deepening of party differences on these issues at least for
the foreseeable future, other things being equal.
The fact that the Pew data do not suggest such a deepening of party differences
between 2003 and 2007 seems to undermine our argument. However, it is important to
recall that our argument does not imply increased polarization on all issues. Instead it
implies that we ought to see greater polarization only on issues that are structured in part
by authoritarianism. By aggregating all the issues into one construct, the Pew researchers
miss this potential line of variation. The reason that party differences overall might not
have increased between 2003 and 2007 is that on many issues the party differences have
decreased or remained roughly the same. This would offset any increase in the party
differences on authoritarianism-structured issues.
24
To test our hypothesis, we reanalyzed the Pew data, comparing the party
differences in 2003 with those in 2007. We focus on change between these two years
because our analysis above demonstrates that authoritarianism became an increasingly
important ingredient in party identification during this time frame. As those scoring high
in authoritarianism increasingly sorted themselves into the Republican party and those
scoring low into the Democratic party, the average differences between partisans on these
issues ought to rise.
In terms of measurement, our analysis departs slightly from Pew’s and Fiorina’s
use of these data. For all the items, people were read a series of statements and asked to
place themselves in one of four response categories: completely agree, mostly agree,
mostly disagree, and completely disagree. Although it is rarely a good idea to discard
information, we collapse these four point scales into a dichotomous measure of
agreement or disagreement. Certainly the distance between completely and mostly agree
is substantially smaller than the distance between mostly agree and mostly disagree.
Hence treating these variables as interval scale and calculating a mean difference between
groups makes little sense. Moreover, we believe that some people by disposition might
be more or less likely to categorize themselves as “completely” in agreement or
disagreement whether or not differences in people’s attitudes really exist.
Table 7 presents our results. The top half of the table includes items for which
preferences are plausibly structured by authoritarianism. The bottom half includes items
in which we would not expect authoritarianism to play a role. The first two columns
present the percentage difference in preference between self-identified Republicans and
Democrats in 2003 and 2007, respectively. The last column is the difference between the
25
years. A positive difference suggests that party differences grew between the two years,
and a negative difference suggests that party differences shrunk. As before, we confine
our analysis to non-black respondents.
(Table 7 About Here)
The results conform largely to expectations. On the issues for which
authoritarianism likely structures preferences, we find mostly positive signs and, given
the short time frame, substantively large differences. Of the fourteen items, ten reveal
increases in the difference between Republicans and Democrats of five or more
percentage points. This is generally true across the authoritarian concerns from
difference (sexual orientation, immigration) to civil liberties to a preference for force.
For example, we find a five percentage point increase in whether or not school boards
should fire gay teachers, a nine point increase in whether or not newcomers threaten
traditional American customs, a seventeen point increases in whether or not the police
should be able to conduct a search of a known drug dealer without a court order, and six
point increase in whether or not strength is the best way to ensure peace. We should add
that not all the differences grow, with matters involving African-Americans generally
holding steady. In most cases, however, we are encouraged to find the expected pattern.
For preferences and values that we would not expect to be structured by
authoritarianism, the story is quite a lot different. Of these fourteen items, none of the
differences increased by as much as five percentage points. Three items showed four
percentage point increases, which grazes conventional levels of statistical significance.
When differences between 2003 and 2007 were large, all suggested a narrowing rather
than a widening. Self-identified Republicans and Democrats in 2007 were much closer
26
together on fears about nuclear war, government regulation of business, and the federal
government’s role in policy making. These latter two items, which saw double digit
decreases between 2003 and 2007, are central to understanding the traditional New Deal
cleavage.
Overall, the average difference on the fourteen authoritarian structured issues
increased from about 15 points to about 20, roughly a five percentage point change,
which is statistically significant. For the traditional issues, the average difference across
all issues held relatively steady, dropping from about 22.5 points to about 20.5 which is a
statistically insignificant change. It is noteworthy that, in 2007, Republicans and
Democrats were about as divided on the authoritarian issues as they were on the
traditional issues. In 2003, the cleavage was significantly deeper on the traditional issues
than on the issues where preferences are structured by authoritarianism, further evidence
of the increased importance of authoritarianism in understanding what divides
Republicans from Democrats.
One could argue that some of these items from the Pew survey are not sufficiently
concrete to be confident that political relevant sorting is taking place on the hot button
issues that politicians actually talk about. However, we uncover the same pattern of
results as it relates to perhaps the most divisive of cultural issues in the early 21st
Century, gay marriage. Starting in October 2004, various survey houses have asked
respondents to place themselves in one of three categories: supporting the legality of gay
marriage, supporting civil unions, and opposing both. The October 2004 survey, which
was conducted by the Los Angeles Times, found that, among non-blacks, Republicans
were 22 percentage points less likely to support legal gay marriages than Democrats and
27
20 percentage points more likely to oppose both gay marriage and civil unions. By April
2005, according to a survey taken by ABC News and the Washington Post, those
differences had both grown to 24 percentage points. Most recently, Newsweek in
conjunction with Princeton Research Associates asked the same question in March 2007.
By then, Republicans were fully 31 percentage points less likely to support gay marriage
and 29 percentage points more likely to oppose both. To put it another way, party
differences on the question of same sex marriage have deepened by nine percentage
points between late 2004, in the midst of a presidential election that highlighted the issue,
and early 2007. To us, this is a remarkable change over such a short period of time.
In sum, it understanding party differences in the electorate, it is important to
disaggregate them by issue type. On traditional issues, differences between partisans did
not grow between 2003 and 2007. On issues structured by authoritarianism, they did.
Now that authoritarianism is an important dividing line between Republicans and
Democrats, we expect these differences to at least persist and perhaps deepen until one
party or the other moderates their position on these matters, something we have seen little
inclination for even in the presidential candidacy of the relatively moderate Sen. John
McCain.
Conclusion
Consistent with the issue evolution framework, a coalitional reconfiguration of
the parties is in the works, with authoritarians increasingly gravitating toward the
Republican Party, and non-authoritarians increasingly gravitating toward the Democratic
Party. This first manifested itself in voter turnout and vote choice and later in party
28
identification. As Carmines and Stimson (1989) note, the consequence of such an
evolution need not be an increase in aggregate support for one party (though it can).
Thus, if scholars are looking for evidence of a tectonic re-alignment as opposed to the
less dramatic impact of evolution-driven change, they miss “the effects of erosion and
drift…even though the end result can be at least as substantial” (Adams 1997, 735). This
is consistent with our own findings – there has been no aggregate increase in
authoritarianism and only a modest increase in Republican identification.
The parties, however, have sorted more clearly along authoritarian/non-
authoritarian lines, with substantial consequences for understanding the nature of the
political divide. For example, the increased importance of authoritarianism on
partisanship coincides with a period when people are more strongly tied to their party
than in previous decades. The test-retest correlation between partisanship as measured in
2002 and partisanship measured in 2004 is significantly higher than that taken from
previous panel studies conducted by the NES. In the 1974-76 panel, the test-retest
correlation was .72. In the 1990-92 panel, it increased to .80. In the 2002-2004 panel, it
increased even further to .88. We believe that the centrality of a worldview like
authoritarianism is an important part of why people are more strongly tied to their party.
In addition, it helps us understand the issues that elites decide to highlight. We do
not mean to suggest that all Republicans are authoritarian and all Democrats are not, but
it is certainly true that party elites seem to recognize that sorting has occurred on this
dimension. In 2006, as the solidity of President Bush’s support waned among
conservatives, Republicans turned to a steady diet of issues that engaged
authoritarianism. These efforts included the introduction of constitutional amendments to
29
ban flag burning and gay marriage, postponing the extension of the Voting Rights Act
due to concerns about multi-lingual ballots, discussing English as the nation’s official
language, congressional resolutions resisting withdrawal from Iraq, and a security first
approach to illegal immigration that would feature hundreds of miles of fences between
the United States and Mexico. In 2008, Democratic presidential hopefuls responded in
ways that would be attractive to their decreasingly authoritarian base of support. None of
the candidates supported a continued presence in Iraq, often favoring instead timetables
for precipitous withdrawal. All the major candidates criticized the use of waterboarding
and the detention facility and Guantamamo Bay. And all expressed a good deal of
support for the gay rights agenda.
Finally, our results are significant because they suggest that the growing
polarization in American politics may reflect fundamental dispositional orientations to
politics and authority. It further suggests that polarization may be persistent and sustain
an increasingly intense and acrimonious political divide. Our results suggest that the
differences between authoritarians and non-authoritarians explain an important piece of
that conflict which, in turn, has become increasingly central to the nature of political
conflict more generally in American today.
30
Table 1 Authoritarianism and Percent Voter Turnout – 1992, 2000, 2004, non-Black Voters,
Leaners Included as Partisans
Authoritarianism Score
1992 2000 2004
Republicans Democrats Republicans Democrats Republicans Democrats 0 89 93 81 90 86 93
0.25 89 88 85 85 89 88
0.50 81 86 84 80 89 76
0.75 80 75 79 75 90 70
1 65 63 79 56 73 56
Overall 80 79 82 77 86 77
Source: American National Election Studies, 1992, 2000, 2004
31
Table 2 Mean Authoritarianism and Presidential Vote Choice - 1992, 2000, 2004, non-black
Voters, Leaners Included as Partisans 1992 2000 2004 Loyal Democrat .502 .493 .436 Defecting Democrat .636 .620 .583 Difference .134 .127 .147 Loyal Republican .583 .611 .592 Defecting Republican .526 .469 .580 Difference .057 .142 .012 All Republican Presidential Voters
.590 .613 .589
All Democratic Presidential Voters
.505 .491 .454
Difference .085 .122 .145 Source: American National Election Studies, 1992, 2000, 2004
32
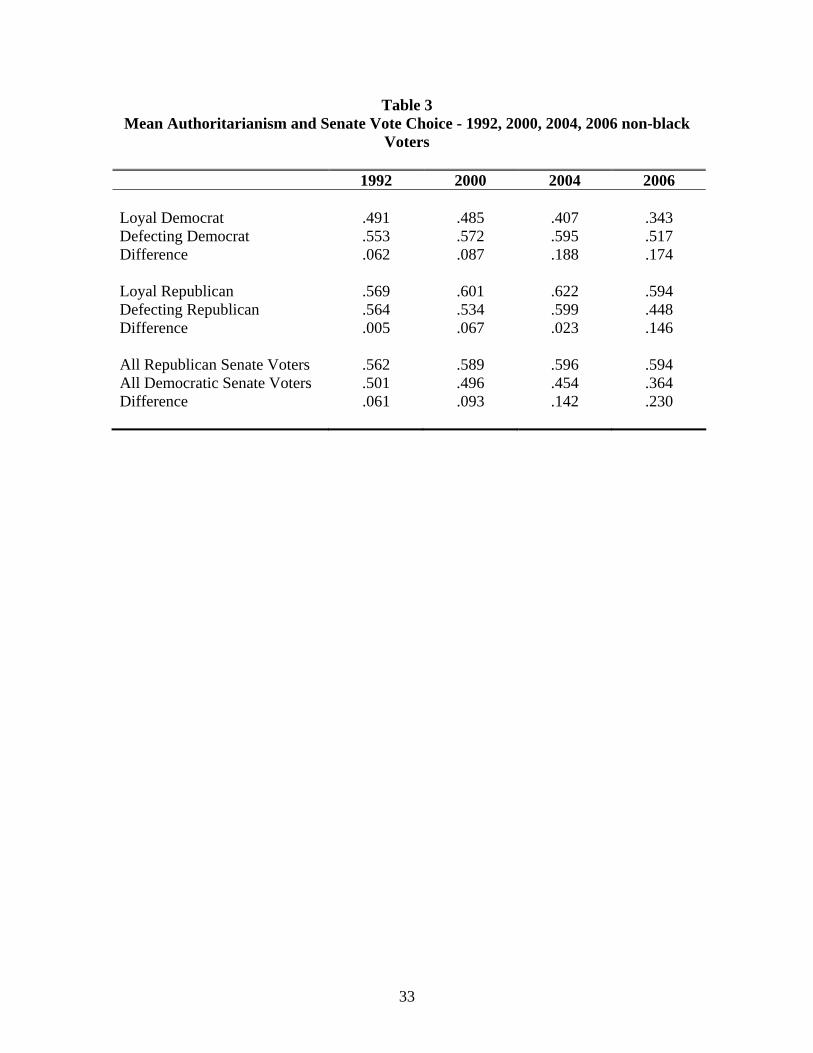
Table 3 Mean Authoritarianism and Senate Vote Choice - 1992, 2000, 2004, 2006 non-black
Voters 1992 2000 2004 2006 Loyal Democrat .491 .485 .407 .343 Defecting Democrat .553 .572 .595 .517 Difference .062 .087 .188 .174 Loyal Republican .569 .601 .622 .594 Defecting Republican .564 .534 .599 .448 Difference .005 .067 .023 .146 All Republican Senate Voters .562 .589 .596 .594 All Democratic Senate Voters .501 .496 .454 .364 Difference .061 .093 .142 .230
33
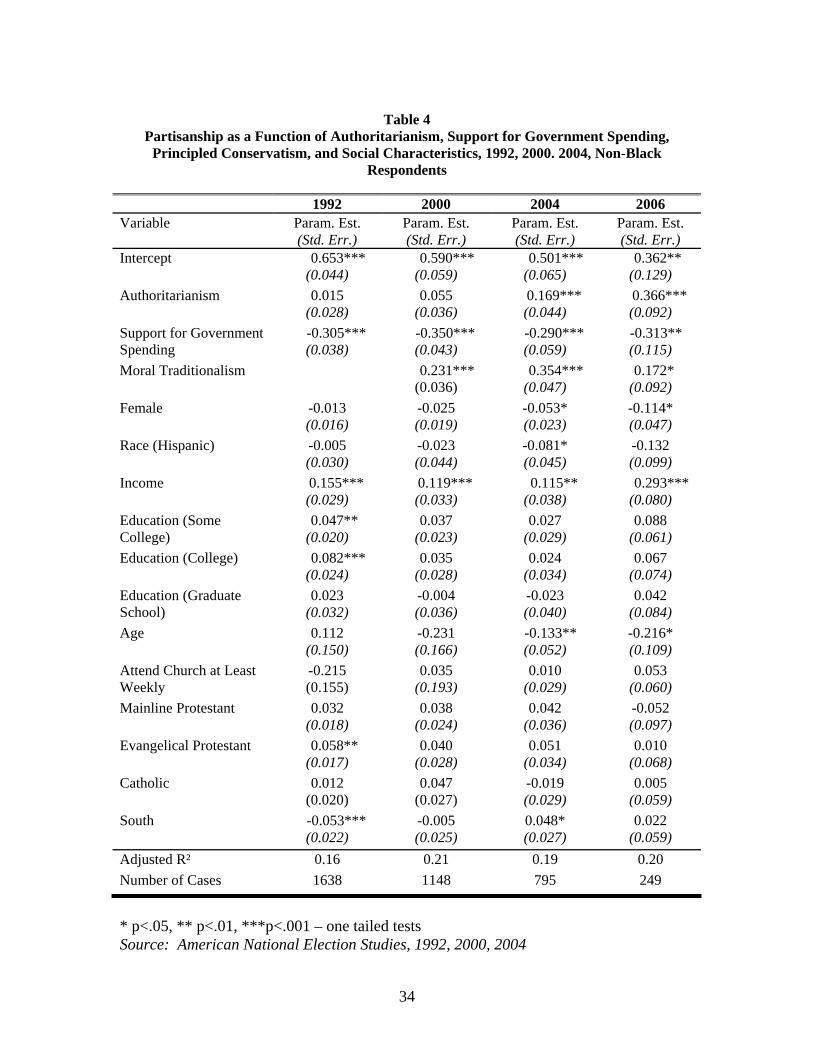
Table 4
Partisanship as a Function of Authoritarianism, Support for Government Spending, Principled Conservatism, and Social Characteristics, 1992, 2000. 2004, Non-Black
Respondents 1992 2000 2004 2006 Variable Param. Est.
(Std. Err.) Param. Est. (Std. Err.)
Param. Est. (Std. Err.)
Param. Est. (Std. Err.)
Intercept 0.653*** (0.044)
0.590*** (0.059)
0.501*** (0.065)
0.362** (0.129)
Authoritarianism 0.015 (0.028)
0.055 (0.036)
0.169*** (0.044)
0.366*** (0.092)
Support for Government Spending
-0.305*** (0.038)
-0.350*** (0.043)
-0.290*** (0.059)
-0.313** (0.115)
Moral Traditionalism
0.231*** (0.036)
0.354*** (0.047)
0.172* (0.092)
Female -0.013 (0.016)
-0.025 (0.019)
-0.053* (0.023)
-0.114* (0.047)
Race (Hispanic) -0.005 (0.030)
-0.023 (0.044)
-0.081* (0.045)
-0.132 (0.099)
Income 0.155*** (0.029)
0.119*** (0.033)
0.115** (0.038)
0.293*** (0.080)
Education (Some College)
0.047** (0.020)
0.037 (0.023)
0.027 (0.029)
0.088 (0.061)
Education (College) 0.082*** (0.024)
0.035 (0.028)
0.024 (0.034)
0.067 (0.074)
Education (Graduate School)
0.023 (0.032)
-0.004 (0.036)
-0.023 (0.040)
0.042 (0.084)
Age 0.112 (0.150)
-0.231 (0.166)
-0.133** (0.052)
-0.216* (0.109)
Attend Church at Least Weekly
-0.215 (0.155)
0.035 (0.193)
0.010 (0.029)
0.053 (0.060)
Mainline Protestant 0.032 (0.018)
0.038 (0.024)
0.042 (0.036)
-0.052 (0.097)
Evangelical Protestant
0.058** (0.017)
0.040 (0.028)
0.051 (0.034)
0.010 (0.068)
Catholic 0.012 (0.020)
0.047 (0.027)
-0.019 (0.029)
0.005 (0.059)
South -0.053*** (0.022)
-0.005 (0.025)
0.048* (0.027)
0.022 (0.059)
Adjusted R² 0.16 0.21 0.19 0.20 Number of Cases 1638 1148 795 249
* p<.05, ** p<.01, ***p<.001 – one tailed tests Source: American National Election Studies, 1992, 2000, 2004
34
Table 5 Change in Partisanship Among Panel Respondents by Authoritarianism, 2000-2004
Number of Authoritarian Responses
Mean Party Identification in
2000
Mean Party Identification in
2004
Difference (2004-2000)
0 3.57 3.36 -0.21 1 4.12 4.05 -0.07 2 3.88 3.92 0.04 3 4.12 4.25 0.13 4 4.41 4.66 0.25 Source: National Election Studies, 2000-2004 Panel Study
35
Table 6 Change in Feelings About the Republican Party by Authoritarianism, 2004 Versus
2000 Number of Authoritarian Responses
Mean Feeling Thermometer –
Republican Party 2000
Mean Feeling Thermometer –
Republican Party 2004
Difference 0 44.73 37.54 -7.19 1 50.39 50.33 -0.06 2 55.20 55.90 0.70. 3 57.99 61.77 3.78 4 58.25 61.89 3.64 Source: American National Election Studies, 2000, 2004
36
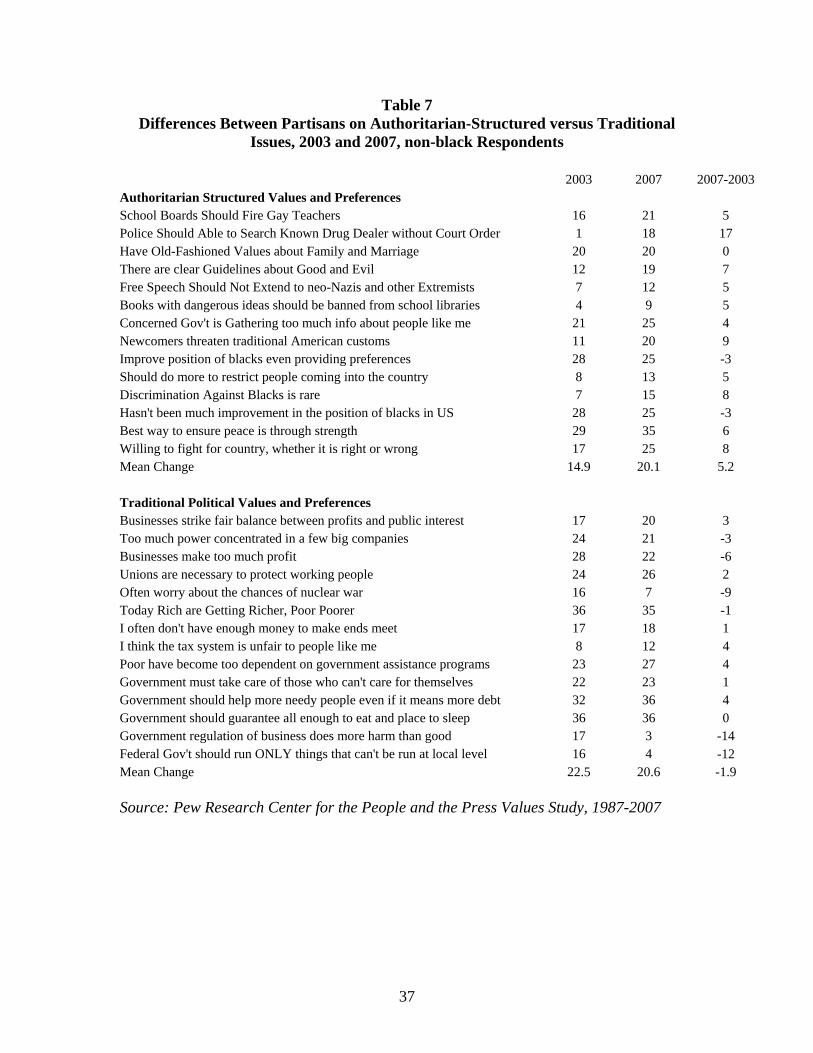
Table 7 Differences Between Partisans on Authoritarian-Structured versus Traditional
Issues, 2003 and 2007, non-black Respondents
2003 2007 2007-2003 Authoritarian Structured Values and Preferences School Boards Should Fire Gay Teachers 16 21 5 Police Should Able to Search Known Drug Dealer without Court Order 1 18 17 Have Old-Fashioned Values about Family and Marriage 20 20 0 There are clear Guidelines about Good and Evil 12 19 7 Free Speech Should Not Extend to neo-Nazis and other Extremists 7 12 5 Books with dangerous ideas should be banned from school libraries 4 9 5 Concerned Gov't is Gathering too much info about people like me 21 25 4 Newcomers threaten traditional American customs 11 20 9 Improve position of blacks even providing preferences 28 25 -3 Should do more to restrict people coming into the country 8 13 5 Discrimination Against Blacks is rare 7 15 8 Hasn't been much improvement in the position of blacks in US 28 25 -3 Best way to ensure peace is through strength 29 35 6 Willing to fight for country, whether it is right or wrong 17 25 8 Mean Change 14.9 20.1 5.2 Traditional Political Values and Preferences Businesses strike fair balance between profits and public interest 17 20 3 Too much power concentrated in a few big companies 24 21 -3 Businesses make too much profit 28 22 -6 Unions are necessary to protect working people 24 26 2 Often worry about the chances of nuclear war 16 7 -9 Today Rich are Getting Richer, Poor Poorer 36 35 -1 I often don't have enough money to make ends meet 17 18 1 I think the tax system is unfair to people like me 8 12 4 Poor have become too dependent on government assistance programs 23 27 4 Government must take care of those who can't care for themselves 22 23 1 Government should help more needy people even if it means more debt 32 36 4 Government should guarantee all enough to eat and place to sleep 36 36 0 Government regulation of business does more harm than good 17 3 -14 Federal Gov't should run ONLY things that can't be run at local level 16 4 -12 Mean Change 22.5 20.6 -1.9
Source: Pew Research Center for the People and the Press Values Study, 1987-2007
37
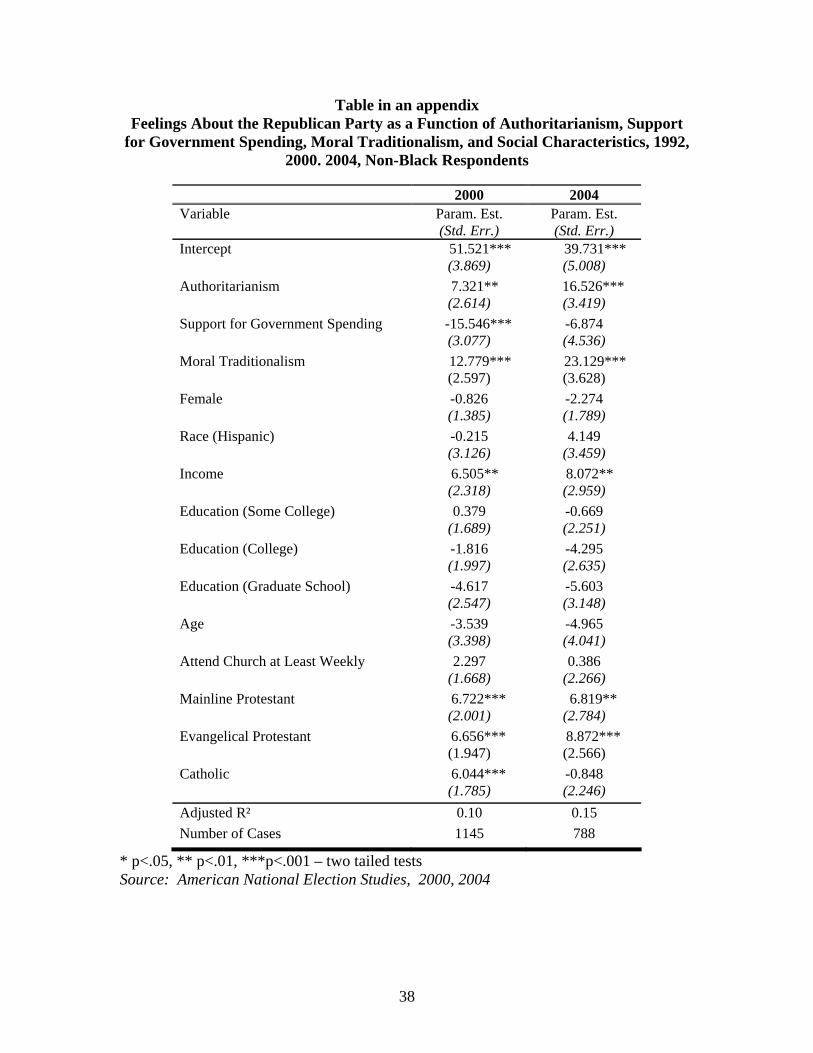
38
Table in an appendix Feelings About the Republican Party as a Function of Authoritarianism, Support
for Government Spending, Moral Traditionalism, and Social Characteristics, 1992, 2000. 2004, Non-Black Respondents
2000 2004 Variable Param. Est.
(Std. Err.) Param. Est. (Std. Err.)
Intercept 51.521*** (3.869)
39.731*** (5.008)
Authoritarianism 7.321** (2.614)
16.526*** (3.419)
Support for Government Spending -15.546*** (3.077)
-6.874 (4.536)
Moral Traditionalism
12.779*** (2.597)
23.129*** (3.628)
Female -0.826 (1.385)
-2.274 (1.789)
Race (Hispanic) -0.215 (3.126)
4.149 (3.459)
Income 6.505** (2.318)
8.072** (2.959)
Education (Some College) 0.379 (1.689)
-0.669 (2.251)
Education (College) -1.816 (1.997)
-4.295 (2.635)
Education (Graduate School) -4.617 (2.547)
-5.603 (3.148)
Age -3.539 (3.398)
-4.965 (4.041)
Attend Church at Least Weekly 2.297 (1.668)
0.386 (2.266)
Mainline Protestant 6.722*** (2.001)
6.819** (2.784)
Evangelical Protestant
6.656*** (1.947)
8.872*** (2.566)
Catholic 6.044*** (1.785)
-0.848 (2.246)
Adjusted R² 0.10 0.15 Number of Cases 1145 788
* p<.05, ** p<.01, ***p<.001 – two tailed tests Source: American National Election Studies, 2000, 2004
Figure 1 Differences Between Self-Identified Democrats and Republicans on "Authoritarian
Issues", non-Black Respondents
0
5
10
15
20
25
30
35
1984 1988 1992 1996 2000 2004
Year
Perc
ent
Military FT DifferenceRacial Resentment DifferenceGay Adoption DifferenceGay Marriage DifferenceDefense Spending Difference
39
Figure 2Differences Between Self-Identified Democrats and Republicans on "Non-
Authoritarian" Issues, non-black Respondents 1988-2004
0
0.05
0.1
0.15
0.2
0.25
0.3
0.35
1988 1992 1996 2000 2004
Year
Perc
ent Health Care Difference
GovJob DifferenceGovServ Difference
40
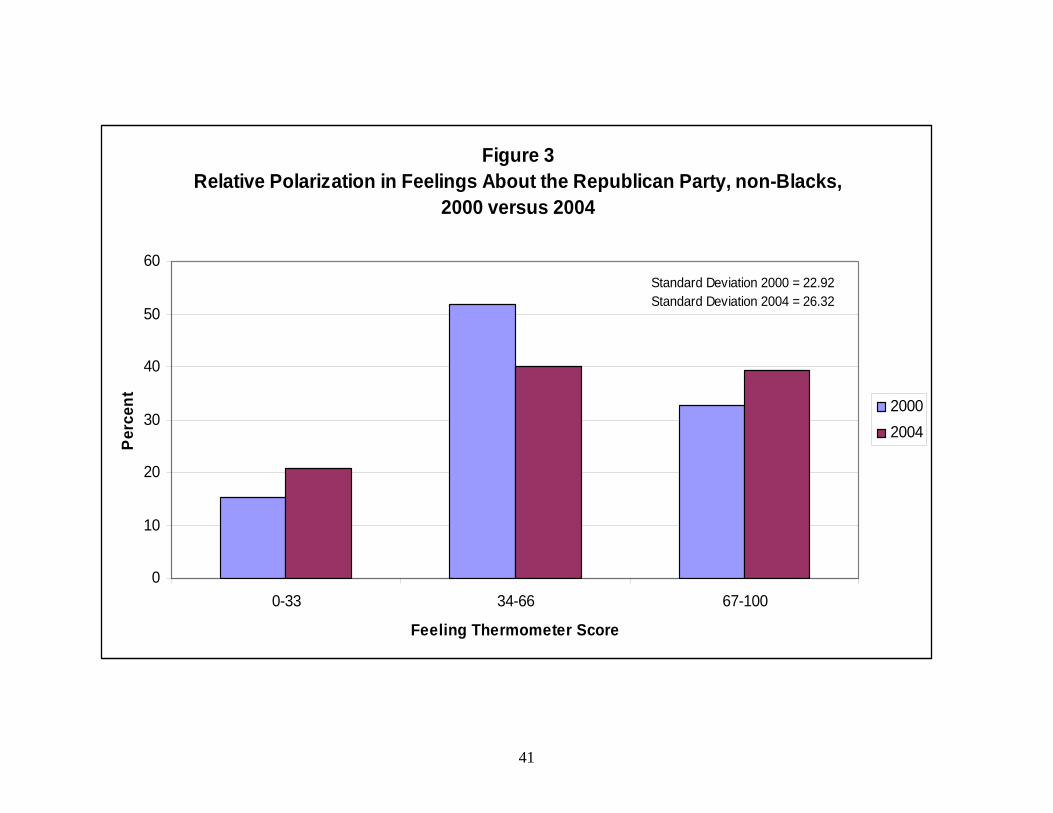
Figure 3Relative Polarization in Feelings About the Republican Party, non-Blacks,
2000 versus 2004
0
10
20
30
40
50
60
0-33 34-66 67-100
Feeling Thermometer Score
Perc
ent
20002004
Standard Deviation 2000 = 22.92Standard Deviation 2004 = 26.32
41