Embed Size (px)
Citation preview
Chapter 5
The Regional Distribution of Risks

Contents
Page
Introduction . . . . . . . . . . . . . . . . . . . . . . . . . . . . . . . . . . . . . . . . . . . . . . . . . . . . . . . . . . . . . . 79
No Congressional Action . . . . . . . . . . . . . . . . . . . . . . . . . . . . . . . . . . . . . . . . . . . . . . . . . . . . 80Aquatic Ecosystems. . . . . . . . . . . . . . . . . . . . . . . . . . . . . . . . . . . . . . . . . . . . . . . . . . . . . . . . . . . . . . 80Terrestrial Ecosystems . . . . . . . . . . . . . . . . . . . . . . . . . . . . . . . . . . . . . . . . . . . . . . . . . . . . . . . . . . . 82
Other Risks . . . . . . . . . . . . . . . . . . . . . . . . . . . . . . . . . . . . . . . . . . . . . . . . . . . . . . . . . . . . . . . 91Materials . . . . . . . . . . . . . . . . . . . . . . . . . . . . . . . . . . . . . . . . . . . . . . . . . . . . . . . . . . . . . . . . . . . . . . 91Visibility . . . . . . . . . . . . . . . . . . . . . . . . . . . . . . . . . . . . . . . . . . . . . . . . . . . . . . . . . . . . . . . . . . . . . . 91Risk of Health Effects . . . . . . . . . . . . . . . . . . . . . . . . . . . . . . . . . . . . . . . . . . . . . . . . . . . . . . . . . . . 94
If Further Emissions Reductions Are Mandated . . . . . . . . . . . . . . . . . . . . . . . . . . . . . . . . 92Rates of Pollutant Emissions . . . . . . . . . . . . . . . . . . . . . . . . . . . . . . . . . . . . . . . . . . . . . . . . . . . . . . 94Utility Control Costs . . . . . . . . . . . . . . . . . . . . . . . . . . . . . . . . . . . . . . . . . . . . . . . . . . . . . . . . . . . . 95Risk to the Utility Industry. . . . . . . . . . . . . . . . . . . . . . . . . . . . . . . . . . . . . . . . . . . . . . . . . . . . . 95
Risks of Shifts in Coal Production . . . . . . . . . . . . . . . . . . . . . . . . . . . . . . . . . . . . . . . . . . . . . . . . . 97
FIGURES
Figure No , Page
23. Estimated Percentages of Lakes Vulnerable to Acid Deposition in Sensitive Regionsof the Eastern United States . . . . . . . . . . . . . . . . . . . . . . . . . . . . . . . . . . . . . . . . . . . . . . . . . . . 80
24. Estimated Percentages of Streams Vulnerable to Acid Deposition in Sensitivc Regionsof the Eastern United States . . . . . . . . . . . . . . . . . . . . . . . . . . . . . . . . . . . . . . . . . . . . . . . . . . . 81
25. Freshwater Recreational Fishing— Relative Economic Importance . . . . . . . . . . . . . . . . . . . 8326. Production of Corn and Soybeans in 1978 . . . . . . . . . . . . . . . . . . . . . . . . . . . . . . . . . . . . . . . 8427. Percent of Land Area Capable of Commercial Timbcr Production . . . . . . . . . . . . . . . . . . 8528. Estimated Gains in 1978 Corn and Soybean Yields From Reducing Ozone
Concentrations to “Natural” Levels, . . . . . . . . . . . . . . . . . . . . . . . . . . . . . . . . . . . . . . . . . . . 8629. Soil Sensitivity to Acid Deposition . . . . . . . . . . . . . . . . . . . . . . . . . . . . . . . . . . . . . . . . . . . . . . 8730. Agriculture— Relative Economic Importance . . . . . . . . . . . . . . . . . . . . . . . . . . . . . . . . . . . . . 8831. Forestry— Relative Economic Importance . . . . . . . . . . . . . . . . . . . . . . . . . . . . . . . . . . . . . . . . 8932. Median Yearly Visual Range for Suburban and Nonurban Areas . . . . . . . . . . . . . . . . . . . 9033. Population Exposure to Airborne Sulfate . . . . . . . . . . . . . . . . . . . . . . . . . . . . . . . . . . . . . . . . 9134. Average 1980 Emission Rates for Sulfur Dioxide From Utility and Industrial Sources . 9335. Average 1980 Emission Rates for Nitrogen Oxides From Utility and
Industrial Sources. . . . . . . . . . . . . . . . . . . . . . . . . . . . . . . . . . . . . . . . . . . . . . . . . . . . . . . . . . . . 9336. Cost of Reducing Sulfur Dioxide Emissions 10 Million Tons per Year, Nationwide
Increases in Annual-Average Electricity Bills for a Typical Residential Consumer . . . . . 9637. Cost of Reducing Sulfur Dioxide Emissions 6 Million Tons per Year,
Eastern 31 States Increases in Annual-Average Electricity Bills for aTypical Residential Consumer . . . . . . . . . . . . . . . . . . . . . . . . . . . . . . . . . . . . . . . . . . . . . . . . . 97
38. Expenditures for Residential Electricity —Relative Economic Importance . . . . . . . . . . . . . 9839. Electric Utilities-Selected Financial Indicators of Sensitivity to Control Expenditures . 9940. Quantities and Sulfur Content of Coals Produced for Electric Utilities,
by State—1980 . . . . . . . . . . . . . . . . . . . . . . . . . . . . . . . . . . . . . . . . . . . . . . . . . . . . . . . . . . . . . . 10041. Coal—Relative Economic Importance. . . . . . . . . . . . . . . . . . . . . . . . . . . . . . . . . . . . . . . . . . . 101

Chapter 5
The Regional Distribution of Risks
INTRODUCTION
Chapter 3 presented the risks of controlling andnot controlling transported air pollutants for theEastern 3 l-State region overall. However, the waysin which these risks are distributed throughout theregion arc of prime significance to the policy debate.Most importantly, considerable variation is foundin:
s
●
●
the distribution of pollution sources, andhence, the distribution of potential controlcosts ;the distribution and extent of resources at risk,their levels of exposure, and their inherent sen-sitivity to transported pollutants; andthe relative importance of the economic sec-tor at risk to each State’s economy.
Scientific uncertainties complicate the task ofdescribing the distribution of risk. However, evenif scientists attained ‘ ‘perfect knowledge’ of thecauses and consequences of transported air pollut-ants, different groups and regions of the countrywould bear these risks. Thus, while it is impossi-ble to precisely specify these groups and regions atpresent, the distributional aspects of transportedpollutants are inherently part of the policy problem.
This chapter describes how the risks associatedwith three pollutants —acid deposition, ozone, andairborne sulfate— are distributed. The order of dis-cussion closely follows the presentation in chapter3 of the aggregate risks to the Eastern 31 -State re-gion. This chapter, however, focuses on the region-al distribution of these risks, and is extensivelyillustrated with maps.
Two situations are described: 1) the risk of re-source damage and adverse health effects if Con-
gress maintains the status quo for pollutant emis-sions, and 2) the costs and economic effects ofadditional pollution-control measures that might beadopted.
Some of the risks of controlling or not control-ling transported air pollutants can be thought ofas ‘ ‘localized’ risks. For example, fewer than halfthe States contain deposits of high sulfur-contentcoal; only in these States could current coal pro-duction be lost due to additional pollution-controlrequirements. Similarly, only parts of the EasternUnited States contain lakes and streams consideredpotentially sensitive to acid deposition. Other riskscan be characterized as ‘ ‘distributed’ ‘—risks thatare present in Virtually all States in the Eastern re-gion, For example, crops are grown in all States.Three factors determine the relative importance ofozone-caused crop damage: 1 ) the concentrationof ozone in a State, 2) the sensitivities of a Statescrops to ozone, and 3) the importance of agricul-ture to the State economy. Likewise, the effects ofutility pollution-control costs depend both on theamount of the State income spent on electricity andon a State pollutant emissions.
In addition to describing the geographic patternsof risk from transported air pollutants, this chapterassesses the relative importance of five economicsectors of concern: agriculture, forestry and forestproduct-related industries, freshwater recreationalfishing, coal mining, and electricity generation. Thefirst four sectors vary considerably in economic im-portance from State to State—from a small percent-age of the regional average to several times thataverage. The last sector, electricity generation, ismuch more uniformly distributed.
79
80 ● Acid Rain and Transported Air Pollutants: Implications for Public Policy
NO CONGRESSIONAL ACTION
Aquatic Ecosystems
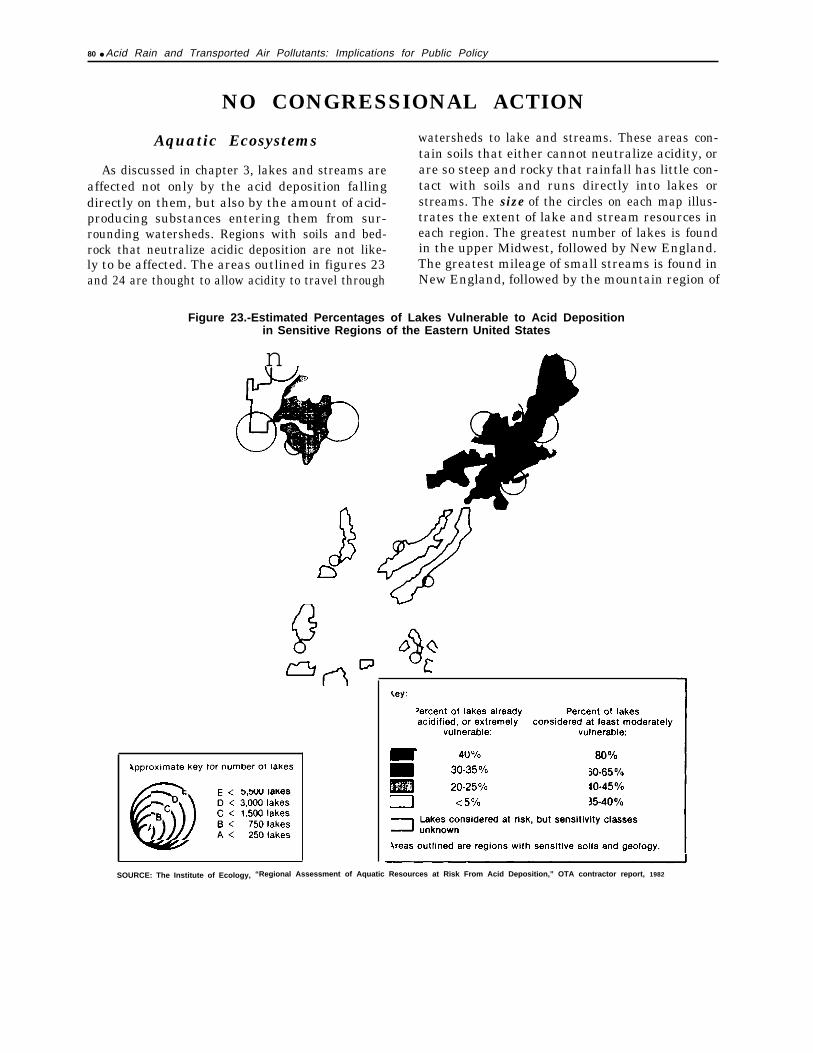
As discussed in chapter 3, lakes and streams areaffected not only by the acid deposition fallingdirectly on them, but also by the amount of acid-producing substances entering them from sur-rounding watersheds. Regions with soils and bed-rock that neutralize acidic deposition are not like-ly to be affected. The areas outlined in figures 23and 24 are thought to allow acidity to travel through
watersheds to lake and streams. These areas con-tain soils that either cannot neutralize acidity, orare so steep and rocky that rainfall has little con-tact with soils and runs directly into lakes orstreams. The size of the circles on each map illus-trates the extent of lake and stream resources ineach region. The greatest number of lakes is foundin the upper Midwest, followed by New England.The greatest mileage of small streams is found inNew England, followed by the mountain region of
Figure 23.-Estimated Percentages of Lakes Vulnerable to Acid Depositionin Sensitive Regions of the Eastern United States
n
SOURCE: The Institute of Ecology, “Regional Assessment of Aquatic Resources at Risk From Acid Deposition,” OTA contractor report, 1982

Ch. 5—The Regional Distribution of Risks . 81
Figure 24.—Estimated Percentages of Streams Vulnerable to Acid Depositionin Sensitive Regions of the Eastern United States
Do
SOURCE: The Institute of Ecology, “Regional Assessment of Aquatic Resources at Risk From Acid Deposition, ” OTA contractor report, 1982.
West Virginia, Kentucky, western Virginia, North numbers of moderately vulnerable lakes are foundCarolina, and eastern Tennessee.
However, because of local variation in soil andwatershed characteristics, not all the lakes andstreams within these regions will be vulnerable toacidic deposition. The intensity of shading withineach outlined area indicates the percentage of lakesand streams estimated to be vulnerable to acid dep-osition, based on water quality characteristics. Thenortheastern regions have the greatest percentagesof ‘extremely’ vulnerable lakes and streams—weestimate about 30 to 40 percent of the over 5,000lakes and 10 to 20 percent of the 65,000 streammiles in the area. These regions also receive highlevels of acidic deposition. In addition, large
in the upper Midwest, and extensive mileages ofmoderately vulnerable streams are found in the cen-tral Appalachian/Blue Ridge regions.
Directly comparing current conditions to histor-ical data, only a small number of surface watersin North America are known to have acidified. Datafrom several decades ago are sparse; in addition,differences in sampling and measurement tech-niques make comparisons with current data dif-ficult. A review of the available evidence foracidification found significant changes in waterbody chemistry in studies of: 250 lakes in Maine,94 lakes in New England, 40 lakes in the Adiron-dacks, and two streams in the New Jersey Pine Bar-

82 ● Acid Rain and Transported Air Pollutants: Implications for Public Policy
rens, as well as in 16 lakes near Halifax, NovaScotia, 22 lakes in the LaCloche Mountains, On-tario, and Clear Lake, Ontario. Changes in waterchemistry over time have also been reported for 38North Carolina streams, 6 Nova Scotia rivers, and314 surface waters in Pennsylvania; however, firmconclusions cannot be drawn from these studies. 1
In the Adirondack Mountains, the only U.S. lo-cation in which scientists have documented fishpopulation declines, the New York State Depart-ment of Environmental Conservation has reportedthe disappearance of fish populations in about 180lakes. Researchers have found correlations betweenacidity levels and survival of fish in Adirondacklakes and streams. Four other areas are known tohave experienced losses of fish populationsassociated with surface water acidification: 1 ) theLaCloche Mountain region of Ontario, 2) NovaScotia, 3) Southern Norway, and 4) SouthernSweden.
Acid deposition may not be the sole cause of thechanges discussed above. Other man-inducedstresses and natural processes can also alter surfacewater chemistry. However, the largest numbers ofacidified and extremely sensitive lakes and streamsare located in regions currently receiving the highestlevels of acid deposition.
Though the economic value of these particularsensitive resources cannot yet be estimated, the Fishand Wildlife Service has estimated that about 21million people spent $6.3 billion on all recreationalfreshwater fishing activities in the Eastern UnitedStates during 1980. Figure 25 illustrates how theseexpenditures vary by State, displaying the impor-tance of recreational fishing to each State’s economyrelative to the 3 1-State regional average.
‘R. A. 1,inthurst, J P. Ilakt, r, and A. M 13art uska, 4‘ F; f’fccts of
.Acidic Deposition A Ilricf’ Review, ” Proct’eding-s of the .4PCA Special-(}’ (~onfi’rencc on Atnmspheri( Dt’posltiorr, Air Pollution Control Asso-( iat ion, Ncr\cmber 1982, rei.lew ing I ntcrnat ional Electric ResearchF,xchange, Efk-ts of S02 ,and 1[s Deri\ati\e.s (m Hea/th and EC (]]o,~,(kmtral Electricity Generatin~ Board, Leathcrhead, England; NationalResearch Counci] of’ Canada, Acidification in the Canadian Aquaticf~n~ironment: .%lentilic Criteri,i ftir .4ssessing the IW&ts of .4cidlcI)cposirion on AquarJc Ecos)sfcms, Associated Committee on Scien-tific Criteria for En\’ironmentat Quality, National Research Council[Jf’Canada, NRC(; ISO. 18475, 1981 ; and J Baker, ‘ ‘Effects on AquaticBiology, Drafi Critical Asst’ssn]ent Lhcunlcnt: 7Yle rlcidlc Lkposi-
tion Phenomenon and 1[s Ef]it(.s, Ch,ipter E-5, 5.6 Fisht.s (Octobcr
1982)
Because there are few data to determine wheth-er lakes and streams sensitive to acid deposition arethose preferred for recreational fishing, OTA can-not estimate potential regional economic lossesresulting from the elimination of fish populations.One local-scale study, however, has estimated lossesto New York resident anglers of approximately $1.7(1982 dollars) million annually from lost fishing op-portunities in about 200 acidified Adirondack lakesand ponds. 2 Potential losses to individuals whoselivelihoods depend on the recreational fishing in-dustry were not estimated. On a regional scale, theStates at greatest economic risk are those with: 1)the greatest numbers of sensitive lakes, 2) thehighest levels of acid deposition, and 3) the highestrelative expenditures for recreational fishing.Among these are the New England States of Maine,Vermont, and New Hampshire; the Appalachianregion of West Virginia and eastern Kentucky; andparts of the Midwestern States of Wisconsin andMinnesota.
Terrestrial Ecosystems
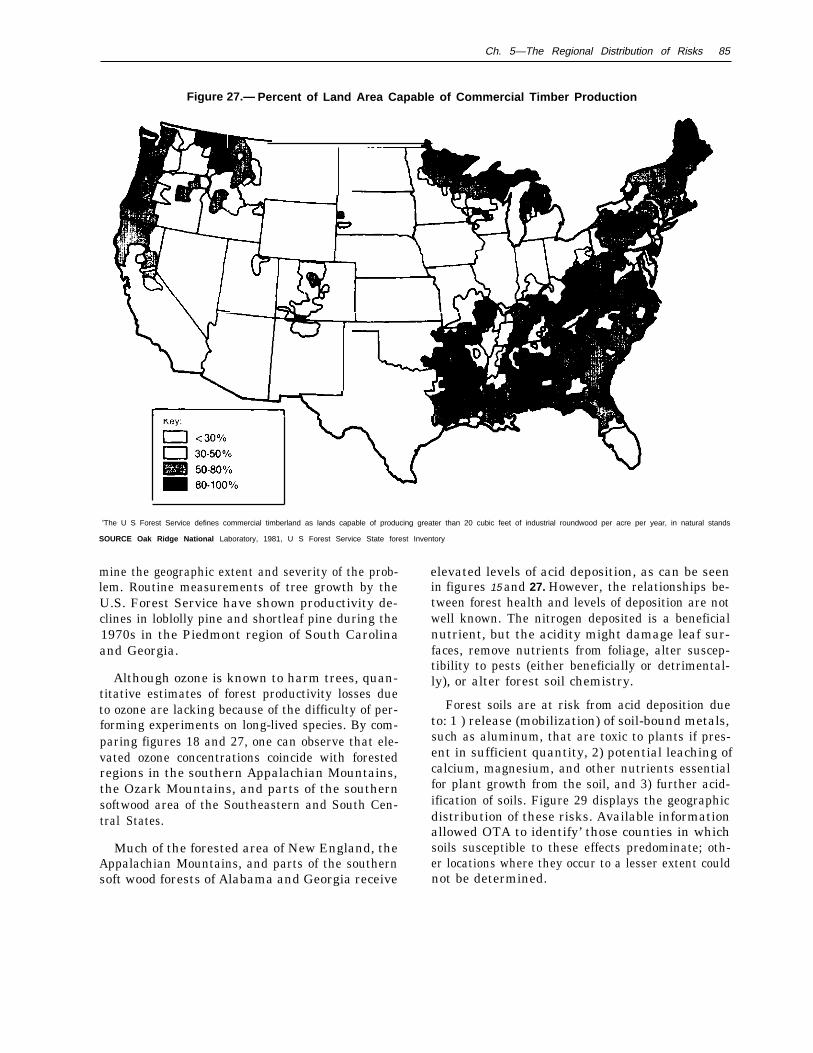
Figure 26 shows major agricultural productionareas for two major crops, corn and soybeans.Figure 27 presents the location of forests.
Figure 28 illustrates the crop yield gains thatmight occur if ozone concentrations were loweredto estimated natural background levels. The regionsof highest crop production—an area slightly northof the peak ozone concentrations—show the greatestimprovement. Here, in the corn and soybean beltof the Midwest, even moderate levels of ozone cancause substantial crop damage. For Iowa, Indiana,and Illinois, reducing ozone concentrations tobackground levels might cause both soybean andcorn yields to increase by about 20 to 40 millionbushels per year in each State. (See app. B forpotential productivity gains in wheat and peanutswith decreased ozone concentrations. )
Comparing figures 15 (patterns of acidity) and 26(current corn and soybean yields) indicates thatelevated levels of acid deposition occur withinseveral major crop-producing States, includingIllinois, Indiana, and Ohio. Reductions in both soy-— . .—
‘F. (;, hlenz and J. K. hlullen, ‘ ‘Ac edification Impact on Fish-eries: Substitution and the t’aluatlon of Re( reat ional Resources, Eco-n(mji[ Pcrspt’cti\w on Acid Deposition, ‘1’.11. Cro(ker (cd ) (Ann Ar-tmr: Butter-worth Press, 1984).

Ch. 5—The Regional Distribution of Risks ● 8 3- .
Figure 25.—Freshwater Recreational Fishing— Relative Economic Importance
1980 recreational fishing expenditures by State (expenditures on freshwater recreational fishing, scaledby State income, compared to regional average)
SOURCE: Office of Technology Assessment, from U.S. Census Bureau and U.S. Fish and Wildlife Service data
bean and corn productivity have been observed infield experiments with simulated acid rain, butother experiments have yielded contradictoryresults.
Scientists have recently discovered productivitydeclines in several tree species throughout the East-ern Unitcd States from New England to Georgia.Acid deposition, ozone, heat)-metal deposition,
drought, severe winters or a combination of theseare possible causes under investigation.
By coring trees and measuring the thickness of’annual growth rings, scientists have observed markedreductions in productivity beginning about 1960in red spruce, shortleaf pine and pitch pine, Cor-ings from about 30 other species at 70 sites through-out the East are currently being analyzed to deter-

Ch. 5—The Regional Distribution of Risks 85
Figure 27.— Percent of Land Area Capable of Commercial Timber Production
aThe U S Forest Service defines commercial timberland as lands capable of producing greater than 20 cubic feet of industrial roundwood per acre per year, in natural stands
SOURCE Oak Ridge National Laboratory, 1981, U S Forest Service State forest Inventory
mine the geographic extent and severity of the prob-lem. Routine measurements of tree growth by theU.S. Forest Service have shown productivity de-clines in loblolly pine and shortleaf pine during the1970s in the Piedmont region of South Carolinaand Georgia.
Although ozone is known to harm trees, quan-titative estimates of forest productivity losses dueto ozone are lacking because of the difficulty of per-forming experiments on long-lived species. By com-paring figures 18 and 27, one can observe that ele-vated ozone concentrations coincide with forestedregions in the southern Appalachian Mountains,the Ozark Mountains, and parts of the southernsoftwood area of the Southeastern and South Cen-tral States.
Much of the forested area of New England, theAppalachian Mountains, and parts of the southernsoft wood forests of Alabama and Georgia receive
elevated levels of acid deposition, as can be seenin figures 15 and 27. However, the relationships be-tween forest health and levels of deposition are notwell known. The nitrogen deposited is a beneficialnutrient, but the acidity might damage leaf sur-faces, remove nutrients from foliage, alter suscep-tibility to pests (either beneficially or detrimental-ly), or alter forest soil chemistry.
Forest soils are at risk from acid deposition dueto: 1 ) release (mobilization) of soil-bound metals,such as aluminum, that are toxic to plants if pres-ent in sufficient quantity, 2) potential leaching ofcalcium, magnesium, and other nutrients essentialfor plant growth from the soil, and 3) further acid-ification of soils. Figure 29 displays the geographicdistribution of these risks. Available informationallowed OTA to identify’ those counties in whichsoils susceptible to these effects predominate; oth-er locations where they occur to a lesser extent couldnot be determined.

86 . Acid Rain and Transported Air Pollutants: Implications for Public Policy
Figure 28.—Estimated Gains in 1978 Corn and Soybean Yields From ReducingOzone Concentrations to “Natural" Levels
Corn yield gains (bushels/acre) with ozone reductions
based on 1978 agriculture census and 1978 EPA ozone data.
SOURCE Oak Ridge National Laboratory, “An Analysis of Potential Agriculture and Forest Impacts of Long-Range Transport Air Pollutants, ” OTA contractor report1983

Ch. 5—The Regional Distribution of Risks ● 8 7
Figure 29.-Soil Sensitivity to Acid Deposition (nonagricultural)
Forested and range areas with soils thought to be susceptible to the effects of acid deposition. Shaded areas represent countiesin which a susceptible soil type predominates. The three levels of shading correspond to different soil types, and potentialeffects, rather than to degrees of susceptibility.
Legend
SOURCE: Oak Ridge National Laboratory, “An Analysis of Potential Agriculture and Forest Impacts of Long-Range Transport Air Pollutants,” OTA contractor report, 1983.
99-413 0 - 84 - 7 : QL . 3

88 ● Acid Rain and Transported Air Pollutants: Implications for Public Policy
Figure 30.-Agriculture— Relative Economic Importance
elative importance of agriculture-related income to State income, 1978-80
SOURCE: Office of Technology Assessment, from U.S. Census Bureau data.
Soils must already be acidic—about pH 5 orlower—to release aluminum in the presence of thestrong acids in acid deposition. Regions where nat-urally acid soils predominate are shown as themedium and light gray areas in figure 29. However,the soils in the light gray areas trap sulfate in theirlower layers, which somewhat reduces the amountof this strong acid available for releasing aluminum.
Soils that are both acidic and do not impede theflow of sulfate (shaded a medium gray in fig. 29)
predominate in New England and northern NewYork State, and parts of the upper Midwest andFlorida. These regions are considered most suscep-tible to the toxic effects of aluminum; however,whether resulting aluminum concentrations will behigh enough to significantly alter forest productivityis not yet known.
Figure 29 also displays regions of the EasternUnited States where nutrient loss is of concern. Thedark patches are areas with moderately acid soils.

Ch. 5—The Regional Distribution of Risks . 89
Figure 31.— Forestry -Relative Economic importance
Relative importance of forestry-related income to State income, 1978-80
Key:
SOURCE: Office of Technology Assessment, from U.S. Census Bureau data.
Loss of calcium, magnesium, and other nutrientsfrom these relatively uncommon soils throughdecades of exposure to acid deposition might causethese soils to further acidify. Nutrients can also belost from more acidic soils—typically already nu-trient poor—but probably at a slower rate. Mostsusceptible are those regions (shaded medium gray)with nutrient-poor acid soils that allow sulfate tomove freely, potentially carrying away nutrientsfrom the soil, plant canopy, and decaying plant
material. However, whether the rate of nutrient lossfrom these soils is more rapid than replacement byweathering is unknown.
Both agriculture and forestry are important tothe overall economy of the Eastern United States,each providing about 3.7 percent of the total re-gional income. Agriculture and related services areresponsible for about $22 billion of the region’s in-come; forestry, wood, lumber, paper, and allied
90l Acid Rain and Transported Air Pollutants: Implications for Public Policy— — —
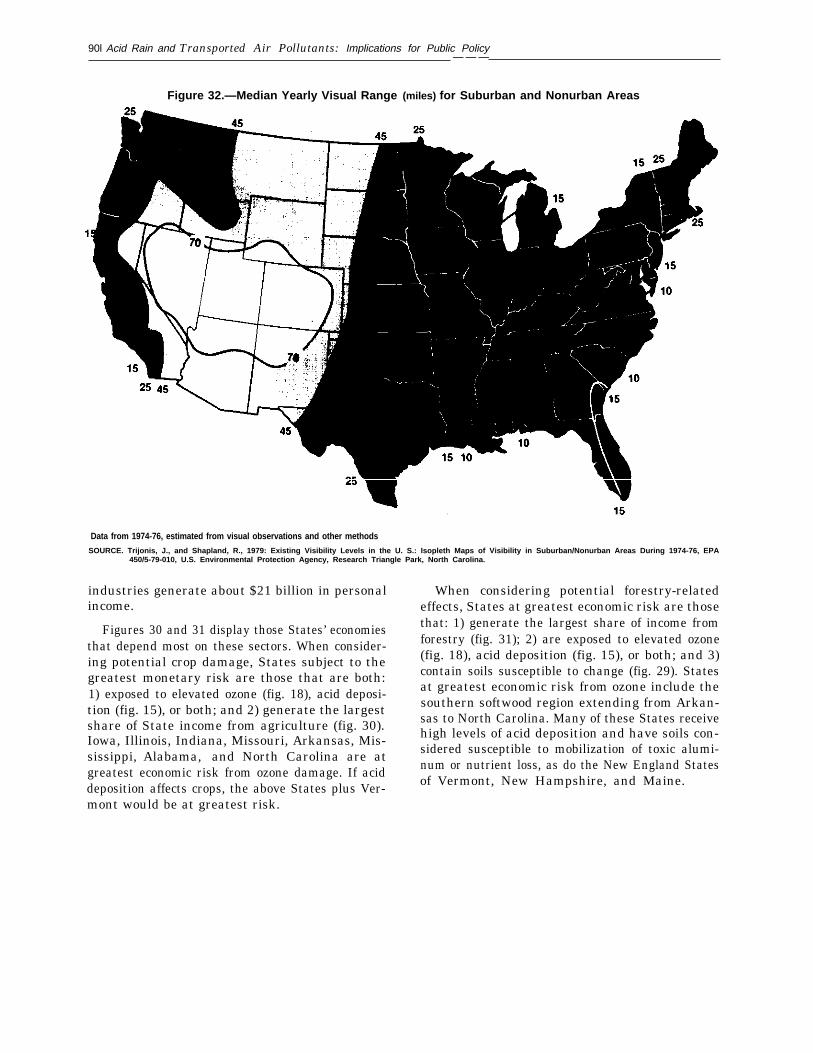
Figure 32.—Median Yearly Visual Range (miles) for Suburban and Nonurban Areas
Data from 1974-76, estimated from visual observations and other methods
SOURCE. Trijonis, J., and Shapland, R., 1979: Existing Visibility Levels in the U. S.: Isopleth Maps of Visibility in Suburban/Nonurban Areas During 1974-76, EPA450/5-79-010, U.S. Environmental Protection Agency, Research Triangle Park, North Carolina.
industries generate about $21 billion in personalincome.
Figures 30 and 31 display those States’ economiesthat depend most on these sectors. When consider-ing potential crop damage, States subject to thegreatest monetary risk are those that are both:1) exposed to elevated ozone (fig. 18), acid deposi-tion (fig. 15), or both; and 2) generate the largestshare of State income from agriculture (fig. 30).Iowa, Illinois, Indiana, Missouri, Arkansas, Mis-sissippi, Alabama, and North Carolina are atgreatest economic risk from ozone damage. If aciddeposition affects crops, the above States plus Ver-
When considering potential forestry-relatedeffects, States at greatest economic risk are thosethat: 1) generate the largest share of income fromforestry (fig. 31); 2) are exposed to elevated ozone(fig. 18), acid deposition (fig. 15), or both; and 3)contain soils susceptible to change (fig. 29). Statesat greatest economic risk from ozone include thesouthern softwood region extending from Arkan-sas to North Carolina. Many of these States receivehigh levels of acid deposition and have soils con-sidered susceptible to mobilization of toxic alumi-num or nutrient loss, as do the New England Statesof Vermont, New Hampshire, and Maine.
mont would be at greatest risk.

Ch. 5—The Regional Distribution of Risks ● 9 1
Figure 33.—population Exposure to Airborne Sulfate (an indicator of potential health effects from sulfatesand other airborne particulate in each State)
concentration in micrograms per cubicmeter). Model estimates based on1978 data.
SOURCE Brookhaven National Laboratory, Biomedical and Environmental Assessment Division, “Long Range Transport Air Pollution Health Effects, ” OTA contractorreport, May 1982
OTHER RISKS
Materials
Materials at greatest risk from exposure to acidicdeposition include metals, such as steel and zinc,and stone masonry. Regions at greatest risk cor-respond to those with the greatest population den-sities and areas with historically significant buildingsand monuments, Scientists estimate that the bulkof materials damage is caused by local-scale pol-lutants, and that sulfur dioxide emissions are re-sponsible for a major share of pollutant-induced
damages to a broad range of materials, Elevatedozone concentrations are harmful to such materialsas paint on home exteriors and rubber. The dis-tribution of materials sensitive to air pollutants isnot well known, since inventories have been takenin very few areas.
●
Visibility
For the Eastern United States, sulfate is the singlemost important contributor to visibility degrada-

92 ● Acid Rain and Transported Air Pollutants: Implications for Public Policy
tion; patterns of impairment in the region correlatefairly well to airborne sulfate concentrations (pre-sented earlier as fig. 17). Sulfate is currentlyestimated to account for 50 percent of visibilitydegradation annually, and 70 percent of summervisibility degradation in the East. In the West,nitrates may play a larger role than sulfates invisibility impairment. Figure 32 shows annual aver-age risibilities throughout the Nation for the mid-1970’s, the most recent information available toOTA. Visibility in the Eastern United States hasimproved slightly over the past decade, but is stillless than pre-1960 levels.
Current Eastern visibility levels are generally farlower than those in the West. However, it shouldbe noted that unimpaired Eastern visibility levelswould be significantly lower than in the West, dueto higher Eastern humidity levels. In addition,where visibility is already low, an increment of ad-ditional sulfate may not reduce visibility much fur-ther; in more pristine areas, the same incrementof additional sulfate may significantly decreasevisibility.
Risk of Health Effects
The health risk to any individual is thought tobe correlated to sulfate concentrations in the atmos-phere. However, whether premature mortality ob-served in statistical studies actually results fromsulfate in air pollution, from different componentsof the sulfate-particulate mix, or from other fac-tors not considered, is unknown. This risk variesfrom increases of less than 1 percent in excess mor-tality in the West to about 4 percent (a range fromabout O to 10 percent) in the regions of highest sul-fate concentration. The health risk to a State is de-termined both by the potential increase in mortalityand by the State’s population. Some of the North-eastern States with the highest population densities(e.g., New York, Pennsylvania, and Ohio) are alsoexposed to the highest airborne sulfate concentra-tions, and are therefore at greatest risk. Figure 33displays the total exposure of each State’s popula-tion to airborne sulfate, an indicator of the relativerisk of premature mortality in each State.
IF FURTHER EMISSIONS REDUCTIONSARE MANDATED
Rates of Pollutant Emissions
The regional patterns of pollutant emissions areperhaps the best indicator of how costs to controltransported air pollution might be distributed. Fig-ures 12 and 13 in chapter 4 display maps of emis-sions densities (in tons per square mile) for sulfurdioxide and nitrogen oxides. This section discussesanother measure of pollutant emissions more direct-ly related to potential control costs—emission rates,expressed as pounds of pollutants per quantity offuel burned.
To date, the major legislative proposals to con-trol acid deposition have focused primarily on sulfurdioxide emissions. Though emissions reductionscan be allocated to States in many ways, most ofthese bills propose reductions based on emissionrates. This approach avoids penalizing areas emit-ting large quantities of sulfur dioxide because of
high electrical or industrial productivity; instead,reductions are concentrated in areas that emitgreater-than-average amounts of sulfur dioxide fora given amount of production.
Sulfur dioxide emission rates vary widely amongStates. Emission rates can be decreased either byusing: 1) a lower sulfur fuel, or 2) technologicalmeans, such as capturing the sulfur dioxide gas with‘‘scrubbers’ after the fuel is burned.
Figure 34 displays estimates of statewide averagesulfur dioxide emission rates from utilities and in-dustrial boilers. Within the Eastern 31-State region,utilities account for about 70 to 75 percent of sulfurdioxide emissions, and industrial boilers for about10 to 15 percent.
The Midwestern States have the highest utilityemission rates, and are therefore at greatest riskfrom additional pollution control regulations. In-

Ch. 5—The Regional Distribution of Risks 93
Figure 34.—Average 1980 Emission Rates for Sulfur Dioxide From Utility and Industrial Sources (lb SO2/MMBtu)
SOURCE: E. H. Pechan & Associates, from Energy Information Administration data (EIA forms 4 and 423), and EPA National Emissions Data System (NEDS).

94 ● Acid Rain and Transported Air Pollutants: Implications for Public Policy
Figure 35.—Average 1980 Emission Rates for Nitrogen Oxides From Utility and Industrial Sources (lb NO 2/MMBtu)
I
SOURCE: E. H. Pechan & Associates, from Energy Information Administration data (EIA forms 4 and 423), and EPA National Emissions Data System (NEDS)

Ch. 5—The Regional Distribution of Risks ● 9 5
dustrial boiler emission rates are more evenly dis-tributed, with highest average rates occurring inthe Midwestern and Central Atlantic States.
Nitrogen oxides are both a component of aciddeposition and a precursor to ozone. Reducingnitrogen oxides emissions from existing sources hasnot been proposed to date, although some bills haveprohibited further increases in nitrogen oxides emis-sions or allowed reductions to substitute for sulfurdioxide reductions.
The three major sources of nitrogen oxides inthe 31 -State region are mobile sources (45 percent),utilities (35 percent), and industrial boilers (15 to20 percent). Highway vehicles account for about75 percent of the emissions from mobile sources,or about one-third of total Eastern U.S. nitrogenoxides emissions.
Figure 35 displays State-average nitrogen oxidesemission rates from utilities and industrial boilers,respectively. As with sulfur dioxide emissions, pro-posals for controlling nitrogen oxides might allocatereductions on the basis of emission rates. Emissionrates are more evenly distributed for nitrogen ox-ides than for sulfur dioxide. Additional mobile-source controls would regionally distribute costs ac-cording to patterns of new vehicle purchases.
Utility Control Costs
Figure 36 displays the effects of further pollutioncontrol on the cost of electricity. Annual increasesin a typical residential consumer’s electricity billsare estimated for a 10-million-ton reduction in sul-fur dioxide emissions from existing utility sources.Total costs of such a program would be about $3to $4 billion per year (1982 dollars), assuming eachutility chooses the most cost-effective method of re-ducing emissions. Emissions reductions are allo-cated to States on the basis of 1980 utility emis-sion rates. (Similar to several legislative proposals,reductions are based on each State’s share of sulfurdioxide emitted in excess of 1.2 lb per million Btuof fuel burned. ) For this hypothetical pollution-control plan, the reduction formula applies to thecontiguous 48 States; however, reductions, in theEastern 31 States would be quite similar if the for-mula applied only to these Eastern States. * The
“W’estern sulfur dioxide cm]ssions in excess of 1.2 lb per millionBtu are less than 5 percent of the allocated reductions.
highest rate increases occur in the MidwesternStates and a few Southeastern and New EnglandStates.
Figure 37 displays the cost of a smaller pollutioncontrol program. About 6 million tons of sulfur di-oxide could be eliminated annually in the Eastern31 States by limiting utility emission rates to 2 lbper million Btu, at a cost of about $1 to $1.5 bil-lion per year. If the control program was confinedto the 22-State region receiving the highest levelsof acid deposition, about 4.8 million tons per yearcould be eliminated for annual costs of $1 billionor less.
These cost estimates assume that all requiredemissions reductions would come from utilities, andthat additional emissions coming from new utilityplants or increased use of existing plants are notoffset by further reducing existing plant emissions.In addition, these cost estimates assume that theuse of control technology (e. g., scrubbers) is notrequired.
Similar to the maps presented earlier depictingthe relative economic importance of recreationalfishing, agriculture, and forestry, figure 38 displaysthe relative share of State income spent on residen-tial electricity. For the region as a whole, about 2.3percent of personal income, or $26 billion, is spenton electricity. The distribution of these expendituresby State is much more uniform than for the sec-tors discussed above, but is somewhat higherthroughout the South.
Risk to the Utility Industry
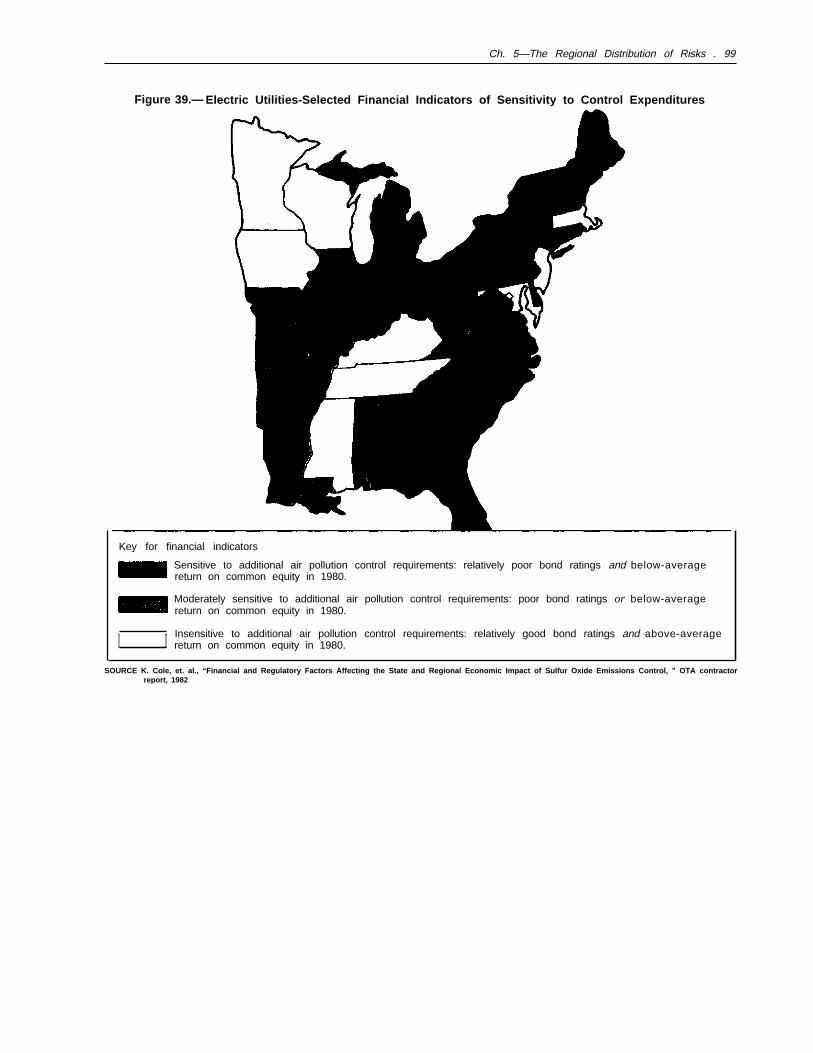
Additional expenditures to control emissionscould potentially affect the financial health of in-dividual utilities. Three major factors determine theextent to which utility companies could be affected:1) the extent of emissions reductions required undera given control program, 2) the utility’s financialposition, and 3) State-level regulatory policies thataffect a utility’s short- and medium-term ability topass on the costs of pollution control to consumers.OTA did not attempt to analyze how these factorswould affect the financial health of the more than100 major publicly owned utilities in the 31 EasternStates, but drew on available information to assessthe relative sensitivity of each State utility sectorto further emissions control.

96. Acid Rain and Transported Air Pollutants: Implications for Public Policy
Figure 36.-Cost of Reducing Sulfur Dioxide Emissions 10 Million Tons per Year, Nationwide Increases in Annual”Average Electricity Bills for a Typical Residential Consumer
Figure 39 displays patterns of utility earnings andbond ratings for 1980 in each State, two indicatorsof the financial health of a State’s utility sector. Fig-ure 34 shows statewide average 1980 utility emis-sion rates for sulfur dioxide—the best indicator ofthe extent of utility-sector reductions likely to berequired under most of the control proposals in-troduced in the 97th and 98th Congresses.
Comparing figures 34 and 39 shows that fewStates both: 1) had high emission rates, and 2) fell
into the least favorable financial category, in 1980.However, several Midwestern States with highemission rates (and, therefore, potentially subjectto extensive control requirements) fell into the mod-erately favorable financial categories.
Policies established by State public utility com-missions can affect an individual utility’s near-termability to pass on the costs of pollution control toconsumers. For example, for coal-burning utilitiesthat might choose to use scrubbers, the State’s pol-

Ch. 5—The Regional Distribution of Risks ● 9 7
Figure 37.—Cost of Reducing Sulfur Dioxide Emissions 6 Million Tons per Year, Eastern 31 States Increasesin Annual-Average Electricity Bills for a Typical Residential Consumer
Key:
SOURCE Office of Technology Assessment, based on analyses by E. H. Pechan & Associates, Inc.
icies regarding capital investment, in combinationwith the utilities’ current financial ratings, deter-mine the burden of raising capital for constructingscrubbers. Results of a survey of current State reg-ulatory policies, and a discussion of their relativeimportance, are presented in appendix A. How-ever, these policies might change considerably ifa major Federal program to further limit pollutionemissions is enacted.
Risks of Shifts in Coal ProductionBecause switching to lower sulfur fuel is often
a cost-effective way to reduce sulfur dioxide emis-sions, emission-reduction schemes could cause coalproduction to shift from high-sulfur coal regionsto low-sulfur coal regions.
Figure 40 displays coal production by State forboth high- and low-sulfur coal. The size of each

98 ● Acid Rain and Transported Air Pollutants: Implications for Public Policy
Figure 38.—Expenditures for Residential Electricity—Relative Economic Importance
Relative share of State income spent for residential electricity, 1980
ffice of Technology Assessment, from U.S. Census Bureau and Edison Electric Institute data.
circle indicates the magnitude of State coal produc-tion. The shading indicates the average sulfur con-tent of the coals mined, using the darkest shadingsfor the highest sulfur coal. Midwestern and north-ern Appalachian high-sulfur coal States incur thegreatest risk of production losses, However, totalcoal production is projected to be unaffected; pro-duction gains of similar magnitudes would occurin the low-sulfur coal regions of Central Appalachiaand the West.
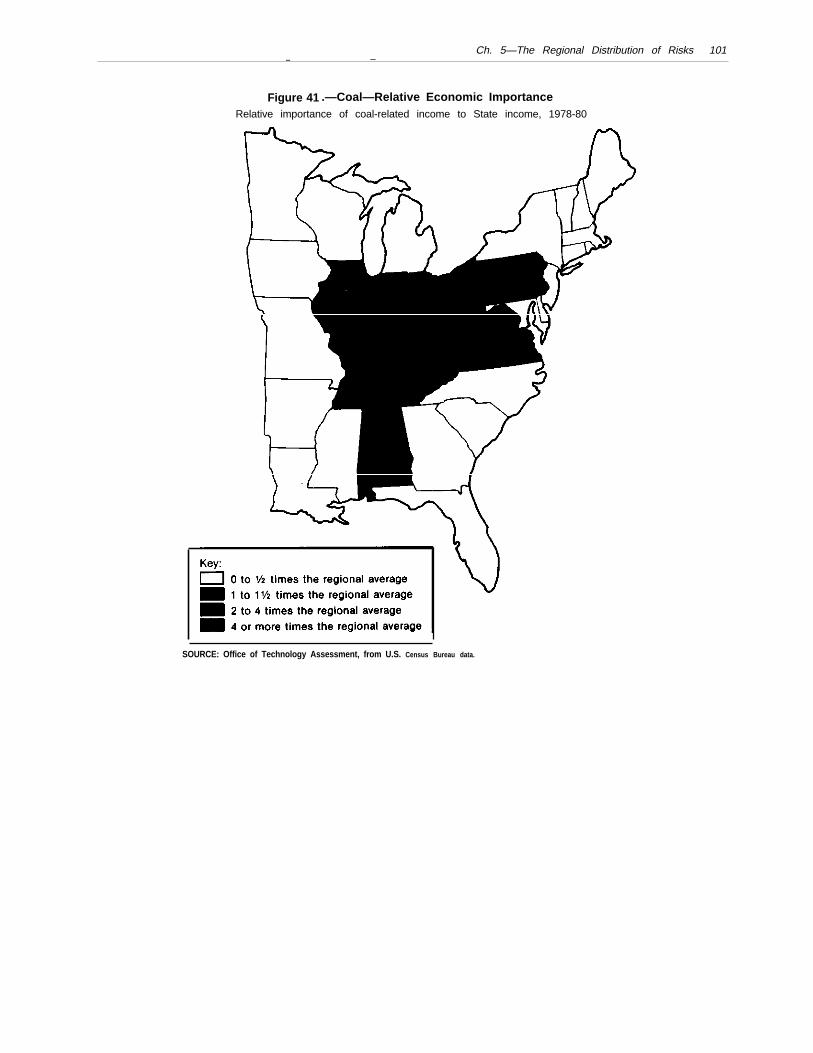
Of all the economic sectors at risk, coal miningis the least evenly distributed across the Eastern re-
gion. The approximately $7 billion of regional in-come from coal mining in the Eastern 31 States isconcentrated in 9 States, as shown in figure 41.States at greatest economic risk are those in which:1) a large share of State income comes from coalmining (fig. 41), and 2) most of the coal producedis of relatively high-sulfur content (fig. 40). Statesmeeting these criteria include West Virginia, Ken-tucky, Pennsylvania, Alabama, and Virginia. Forthese States, the income from coal mining is morethan twice the regional average, and more than 80percent of the coal produced emits greater than 1.2lb sulfur dioxide per million Btu when burned.
Ch. 5—The Regional Distribution of Risks . 99
Figure 39.— Electric Utilities-Selected Financial Indicators of Sensitivity to Control Expenditures
Key for financial indicators
Sensitive to additional air pollution control requirements: relatively poor bond ratings and below-averagereturn on common equity in 1980.
Moderately sensitive to additional air pollution control requirements: poor bond ratings or below-averagereturn on common equity in 1980.
I I Insensitive to additional air pollution control requirements: relatively good bond ratings and above-averagereturn on common equity in 1980.
SOURCE K. Cole, et. al., “Financial and Regulatory Factors Affecting the State and Regional Economic Impact of Sulfur Oxide Emissions Control, ” OTA contractorreport, 1982

100 . Acid Rain and Transported Air Pollutants: Implications for Public Policy
Figure 40.–Quantities and Sulfur Content of Coals Produced for Electric Utilities, by State–1980
Ch. 5—The Regional Distribution of Risks 101— —
Figure 41 .—Coal—Relative Economic ImportanceRelative importance of coal-related income to State income, 1978-80
SOURCE: Office of Technology Assessment, from U.S. Census Bureau data.