Embed Size (px)
Citation preview
Chapter 5 Review
AP Statistics
Question #1
40
50
60
70
80
90
100
110
50 55 60 65 70 75 80 85 90 95 100 105
T1
test grades Scatter PlotA. r = 0.40
B. r = 0.90
C. r= 1.00
D. r = -0.10
E. r = -0.85
Question #2A. r = 0.40
B. r = 0.90
C. r= 1.00
D. r = -0.10
E. r = -0.85
40
50
60
70
80
90
100
110
50 55 60 65 70 75 80 85 90 95 100 105
T1
test grades Scatter Plot
Question #3A. r = 0.40
B. r = 0.90
C. r= 1.00
D. r = -0.10
E. r = -0.85
40
50
60
70
80
90
100
110
50 55 60 65 70 75 80 85 90 95 100 105
T1
test grades Scatter Plot
Question #4A. r = 0.40
B. r = 0.90
C. r= 1.00
D. r = -0.10
E. r = -0.85
40
50
60
70
80
90
100
110
50 55 60 65 70 75 80 85 90 95 100 105
T1
test grades Scatter Plot
Question #5A. r = 0.40
B. r = 0.90
C. r= 1.00
D. r = -0.10
E. r = -0.85
40
50
60
70
80
90
100
110
50 55 60 65 70 75 80 85 90 95 100 105
T1
test grades Scatter Plot
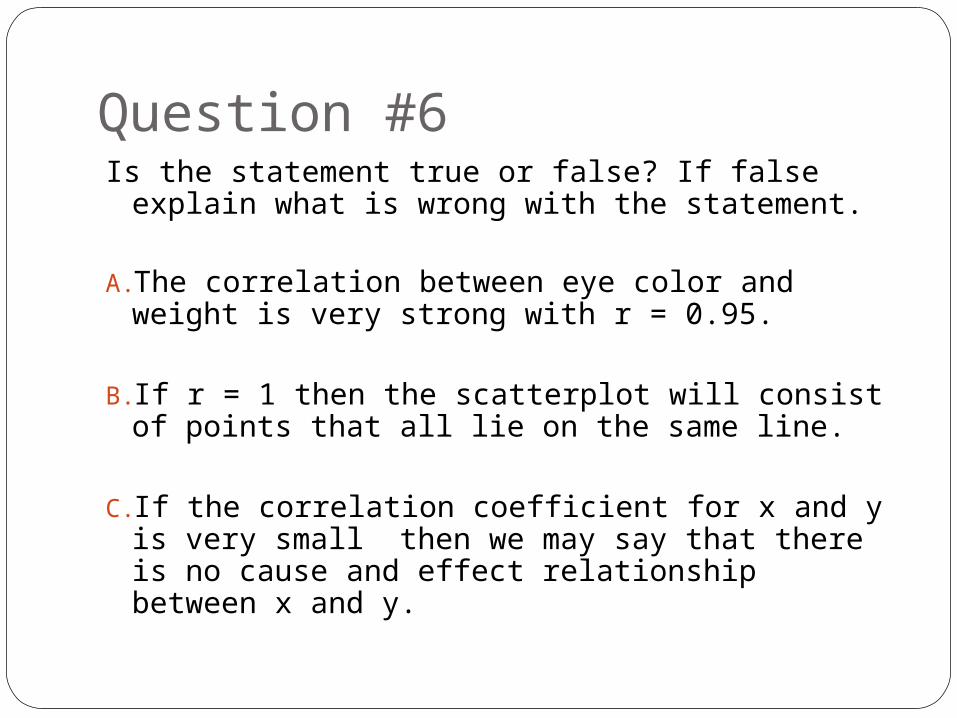
Question #6Is the statement true or false? If false explain
what is wrong with the statement.
A.The correlation between eye color and weight is very strong with r = 0.95.
B.If r = 1 then the scatterplot will consist of points that all lie on the same line.
C.If the correlation coefficient for x and y is very small then we may say that there is no cause and effect relationship between x and y.
Question #7Suppose the LSRL for hours of sleep the night
before the ACT and score on the ACT is given by
(Score) = 19.55 + 0.4558(Hours of sleep)
If Joy had 7 hours of sleep the night before she took the ACT and her residual is 2, then her ACT score was ___________.
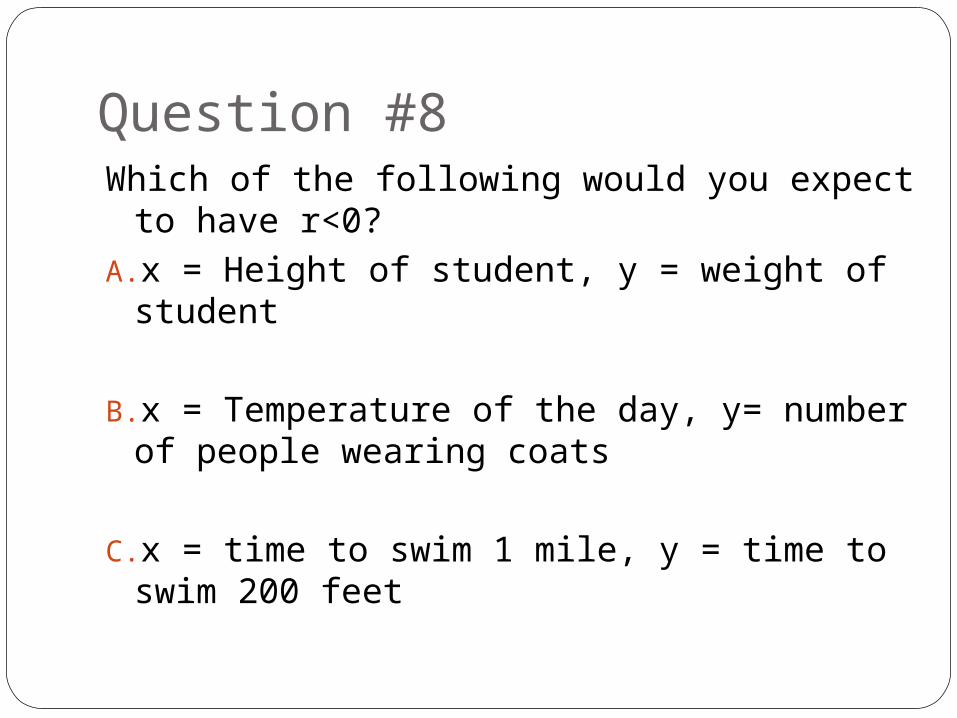
Question #8Which of the following would you expect to
have r<0?A.x = Height of student, y = weight of student
B.x = Temperature of the day, y= number of people wearing coats
C.x = time to swim 1 mile, y = time to swim 200 feet
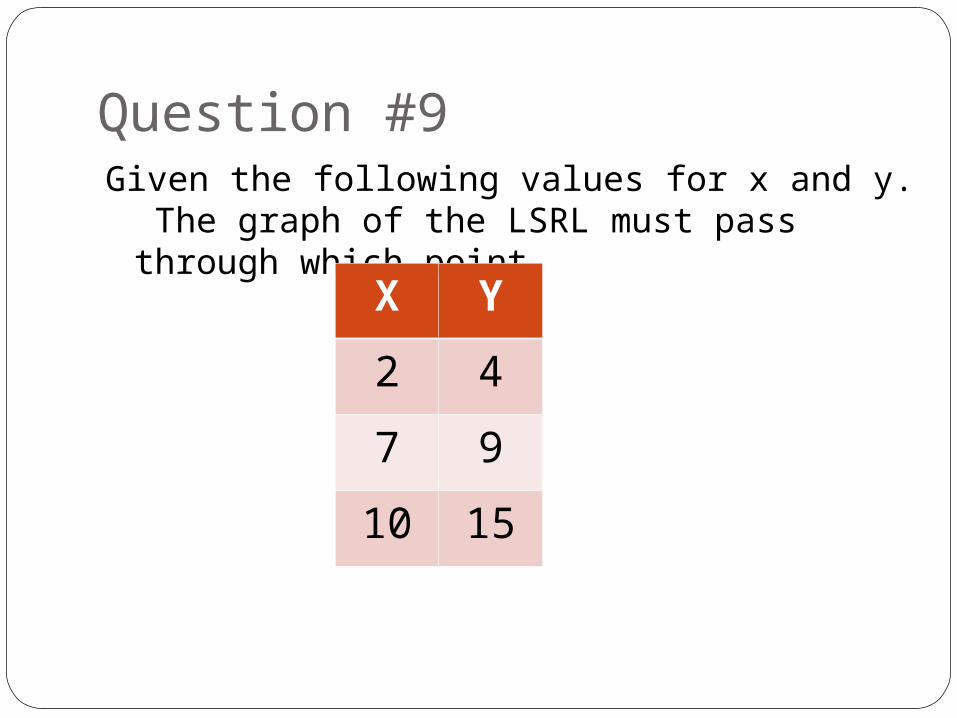
Question #9Given the following values for x and y. The
graph of the LSRL must pass through which point.
X Y
2 4
7 9
10 15
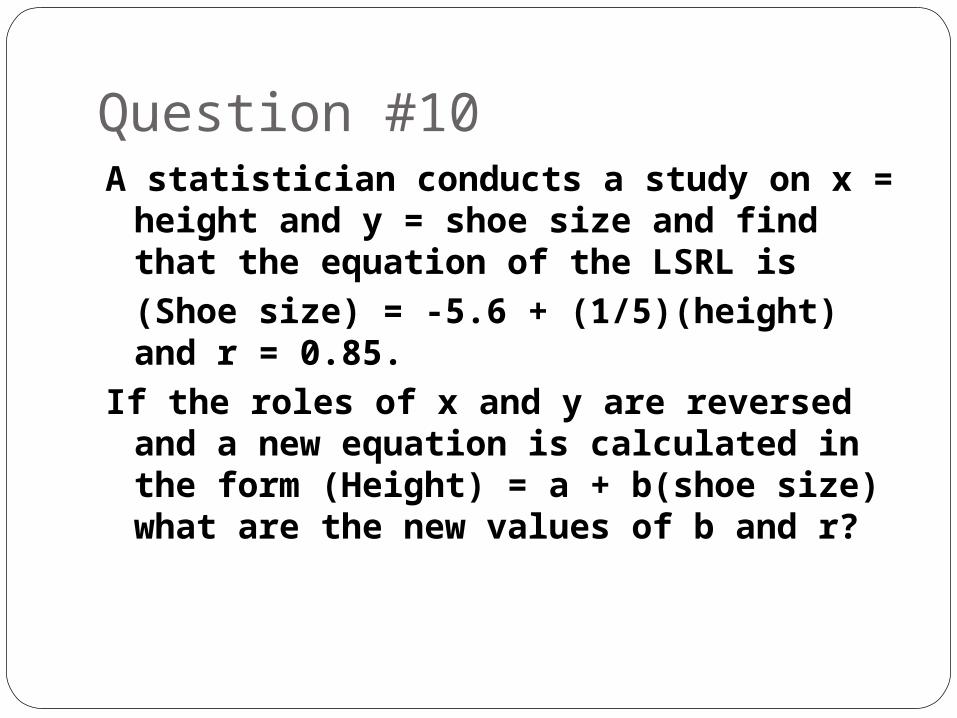
Question #10A statistician conducts a study on x =
height and y = shoe size and find that the equation of the LSRL is (Shoe size) = -5.6 + (1/5)(height) and r = 0.85.
If the roles of x and y are reversed and a new equation is calculated in the form (Height) = a + b(shoe size) what are the new values of b and r?
Question #11See Fathom…..


![B.r. cohn charity_musical_festival_sm_r1[1]](https://img.pdfslide.us/doc/110x75/553833d14a795971788b46b0/br-cohn-charitymusicalfestivalsmr11.jpg)