Embed Size (px)
Citation preview

CHAPTER 5 Water Quality
Previous sections of this report have discussed the quantity of water
available within the Okanagan Basin. Of equal importance is the quality of
this resource in the tributary streams, lakes, and rivers as it flows
through the basin. The term quality refers not only to the condition of
water for drinking purposes and other consumptive uses, but also to the
condition of bodies of water as a suitable habitat for aquatic life and for
recreation (non-consumptive uses).
Under the Okanagan Basin Agreement, studies were carried out to
determine: the present quality of the tributary streams and main valley lakes;
the sources and amounts of nutrients and other chemical constituents entering
the water of the basin; the extent and range of possible future sources and
levels of pollution; and to test and evaluate methods for the control of
nutrient discharges through the treatment of municipal and industrial wastes.
The purpose of this chapter is to present the results of these quality
studies. The results of studies on the main valley lakes, known collectively
as limnological studies, are presented in a separate section because of the
complex nature of lakes and the different types of studies required to assess
their condition. The extent and range of possible future sources and levels
of pollution are presented in Chapter 15.
5.1 WATER QUALITY FOR CONSUMPTIVE AND OTHER BENEFICIAL USES
During the period 1969 to 1972 a number of monitoring programs were
carried out to determine the concentrations of various chemical constituents
in the streams and lakes of the Okanagan Basin, and the number of coliform
bacteria as a measure of the presence of pathogenic (disease causing)
bacteria. The results of these monitoring programs have been used to evaluate
the present condition and suitability of these waters for such designated uses
as domestic water supplies, irrigation, recreation, and aquatic life, as well
as for estimating present and future loadings to the main valley lakes.
5.1.1 Water Quality Criteria
In water quality the term 'Criteria' may be generally defined as a
scientific requirement on which a decision or judgement may be based
concerning the suitability of a water to support a designated use. A severe
short coming in determining these scientific requirements, as related to water
quality, is the lack of adequate knowledge concerning many of the quality
characteristics upon which criteria should be based.
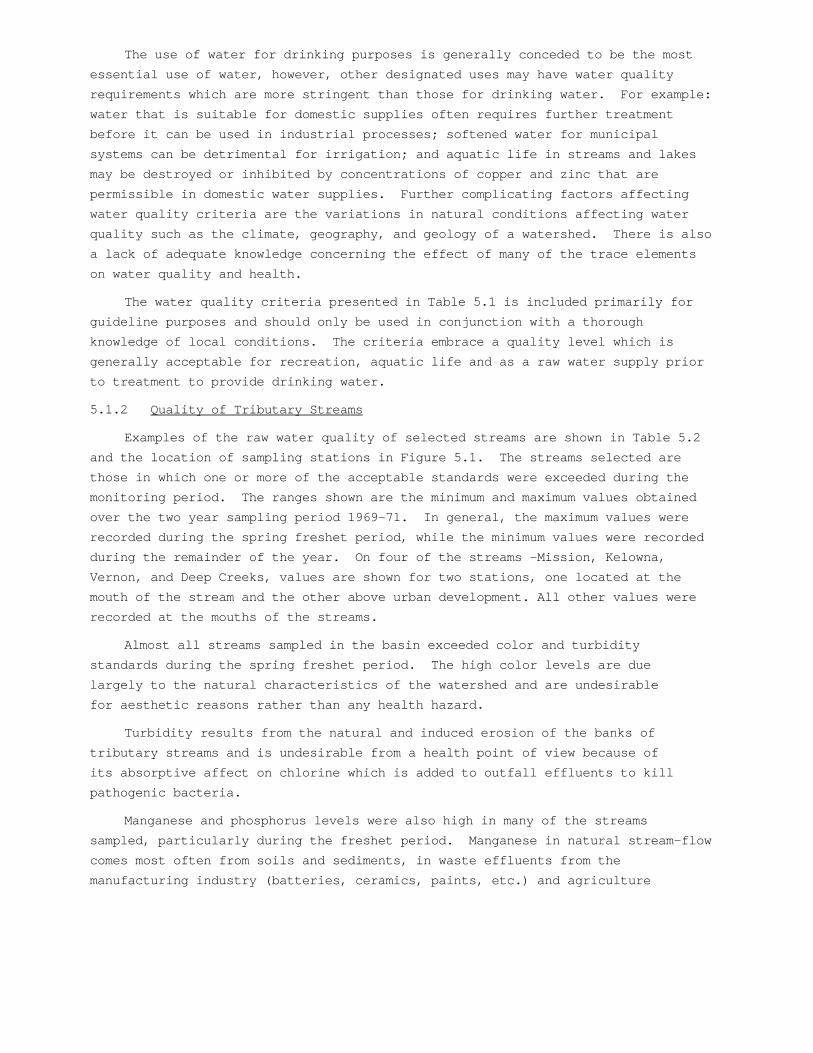
The use of water for drinking purposes is generally conceded to be the most
essential use of water, however, other designated uses may have water quality
requirements which are more stringent than those for drinking water. For example:
water that is suitable for domestic supplies often requires further treatment
before it can be used in industrial processes; softened water for municipal
systems can be detrimental for irrigation; and aquatic life in streams and lakes
may be destroyed or inhibited by concentrations of copper and zinc that are
permissible in domestic water supplies. Further complicating factors affecting
water quality criteria are the variations in natural conditions affecting water
quality such as the climate, geography, and geology of a watershed. There is also
a lack of adequate knowledge concerning the effect of many of the trace elements
on water quality and health.
The water quality criteria presented in Table 5.1 is included primarily for
guideline purposes and should only be used in conjunction with a thorough
knowledge of local conditions. The criteria embrace a quality level which is
generally acceptable for recreation, aquatic life and as a raw water supply prior
to treatment to provide drinking water.
5.1.2 Quality of Tributary Streams
Examples of the raw water quality of selected streams are shown in Table 5.2
and the location of sampling stations in Figure 5.1. The streams selected are
those in which one or more of the acceptable standards were exceeded during the
monitoring period. The ranges shown are the minimum and maximum values obtained
over the two year sampling period 1969-71. In general, the maximum values were
recorded during the spring freshet period, while the minimum values were recorded
during the remainder of the year. On four of the streams -Mission, Kelowna,
Vernon, and Deep Creeks, values are shown for two stations, one located at the
mouth of the stream and the other above urban development. All other values were
recorded at the mouths of the streams.
Almost all streams sampled in the basin exceeded color and turbidity
standards during the spring freshet period. The high color levels are due
largely to the natural characteristics of the watershed and are undesirable
for aesthetic reasons rather than any health hazard.
Turbidity results from the natural and induced erosion of the banks of
tributary streams and is undesirable from a health point of view because of
its absorptive affect on chlorine which is added to outfall effluents to kill
pathogenic bacteria.
Manganese and phosphorus levels were also high in many of the streams
sampled, particularly during the freshet period. Manganese in natural stream-flow
comes most often from soils and sediments, in waste effluents from the
manufacturing industry (batteries, ceramics, paints, etc.) and agriculture

TABLE 5.1
GENERALLY ACCEPTED ALLOWABLE CRITERIA - RAW WATER SOURCES
FOR DRINKING WATER, AQUATIC LIFE AND RECREATION - FOR
SIGNIFICANT WATER QUALITY PARAMETERS IN THE OKANAGAN BASIN


where it is used to spray manganese deficient trees. Manganese in
concentrations in excess of 0.2 parts per million may cause undesirable tastes,
stain kitchen utensils and plumbing fixtures, and foster the growth of some
micro-organisms in reservoirs, filters and distribution systems. A level of one
part per million in raw water supplies is lethal to fish and other aquatic life.
The element phosphorus does not occur free in nature but is found in the.
form of phosphates in minerals and soils. Phosphorus is a key nutrient in
animal and plant life and is extremely important in processes involving the
transfer of energy in all living cells.
The high levels of total phosphorus in streams are the result of a combin-
ation of natural and urban sources. Watershed deforestation and erosion un-
doubtedly increase the amount of total phosphorus in streams although most of
this is in the form of suspended debris rather than in the soluble orthophos-
phorus form (Table 6.3 Chapter 6). Industrial and municipal outfalls, and
groundwater return flows add to the concentration of phosphorus in the lower
reaches of the streams as indicated by the increases in total phosphorus between
the upper and lower stations of Mission, Deep, and Kelowna Creeks. The reduc-
tion in phosphorus content between the upper and lower station on Vernon Creek
is due to the water passing through Ellison, Wood, and Kalamalka Lakes where
much of it is deposited or assimilated, before reaching Okanagan Lake. The
major problem associated with phosphorus is excessive algae and aquatic plant
growth, which can result in undesirable tastes and odors in drinking water.
Low oxygen contents were recorded in Shuttleworth, Ellis, Brandts, Bellevue,
Lambly and Deep Creeks. Brandts Creek and Deep Creek are affected by industrial
and urban waste discharges which reduce oxygen levels. Most of the other creeks
however are in relatively undeveloped areas and the reason for these low
readings is not known. Dissolved oxygen concentrations of less than 5 parts per
million are lethal to some fish. The high total nitrogen recorded at the mouth
of Vernon Creek may be attributed to municipal waste effluent discharge from the
City of Vernon.
Other chemical standards exceeded, included iron in Penticton, Ellis and
Brandts Creeks, alkalinity in Lambly Creek and hardness in Brandts and Deep
Creeks. These represent relatively isolated conditions however, and are not
considered a major problem at this time.
One of the most important criteria for raw water supplies, the limits of
which are exceeded in many streams, is the presence of pathogenic bacteria
(bacteria causing or capable of causing disease). For many years the coliform
group of bacteria has been used to indicate the presence of pathogenic bacteria.

Coliform bacteria are themselves harmless to humans, but if present in
sufficient numbers, generally indicate the presence of pathogenic bacteria of
intestinal origin. The absence of coliform bacteria is the best available
evidence that a drinking water is bacteriologically safe. Of thirty streams
tested for coliforms levels, 10 exceeded the acceptable criteria for both
total coliform and fecal coliform including those of Inkaneep, Westbank,
Brandts, Equesis, and Kelowna Creeks as shown in Table 5.2. With the
exception of Inkaneep and Equesis Creeks all those shown are affected by urban
development and associated waste discharges. Other streams which exceeded
acceptable coliform standards include McLeans, BX, and Coldstream Creeks, the
latter two of which drain confined farm animal operations. The median values
shown are based on approximately 20 or more tests taken over the two year
sampling period 1969-71.
In summary the quality of many streams in the lower reaches is not
generally acceptable as raw water supply (untreated) for drinking water
purposes, due to excess concentrations of color, turbidity, manganese,
phosphorus, and particularly coliform densities. The quality of water in the
upper reaches of most streams was not determined, but on the basis of the few
streams sampled above major urban developments, would appear to be of a higher
quality than in the lower reaches. Except for coliform and turbidity, the
standards exceeded render the water undesirable for aesthetic and household
use purposes, rather than as a health hazard.
5.1.3 Quality of Main Valley Lake Water (a)
Drinking water and Aquatic Life
Examples of the raw water quality of the main valley lakes and Okanagan
River are shown in Table 5.3. Some information on water quality was also
obtained for a few of the headwater lakes, and five of these are included for
comparison purposes. Osoyoos and Wood Lake have high phosphorus
concentrations and Wood Lake has oxygen deficiencies at certain times of the
year, but otherwise the water quality of the main valley lakes is generally
acceptable for consumptive use purposes.
Ellison Lake, which is a very shallow lake, exceeds most of the limits for
acceptable water quality.
It is interesting to note that four of the five headwater lakes shown in
Table 5.3 exceed color and total phosphorus criteria. The high color content
is considered to be a natural condition of the watershed and indicates the
source of the high color content in most of the streams. The total phosphorus
is considered to be largely organic matter in the insoluble form.
Okanagan River, which joins the main lakes downstream of Okanagan Lake
exceeds acceptable limits for color, turbidity, iron, and total phosphorus

TABLE 5.2
RAM WATER QUALITY OF SELECTED STREAMS IN THE OKANAGAN BASIN (1969-1971 DATA)
NOTE: Values underlined exceed acceptable criteria

TABLE 5.3
ALITY OF - OKANAGAN RIVER AND SELECTED LAKES IN THE OKANAGAN BASIN (1969-1971 DATA)
xygen content refers to the bottom waters only.
underline exceed acceptable criteria

content during the freshet period. Most of the parameters that are exceeded
reflect the discharges of tributary streams in the vicinity of the sampling
area. For example the high iron content in Okanagan River at the entrance to
Skaha Lake is probably a result of the high iron content in Ellis Creek which
joins Okanagan River just above the sampling point.
(b) Recreational Bathing Areas
Because of the importance of water-based recreation in the Okanagan Basin,
to both residents and tourists, and public concern regarding the quality of
bathing areas, a separate study on the coliform levels at three major beaches in
the Okanagan was carried out between July and September, 1971. The major
objectives of the study were to determine the coliform levels at these beaches;
the minimum number of samples required to calculate a meaningful coliform
count for closing or opening bathing areas; and the probably source of such
coliforms.
The three beaches selected for this study were Kin Beach at Vernon, on the
north end of Okanagan Lake; Okanagan Beach at Penticton at the south end of
Okanagan Lake; and Skaha Beach at Penticton, on the north end of Skaha Lake.
Each beach front was sampled on a grid pattern with sixty sampling sites at
three different distances from the shore. These points encompassed the whole
swimming area of each beach from the shore to the farthest swimming points,
usually marked by buoys. Initially, samples were taken at three different
depths; surface, one foot, and mid-depth, but as the results of the initial
sampling indicated that coliform levels tended to be higher for the surface
samples, the remaining ones were all collected at the surface. Skaha Lake was
the only beach area sampled in September.
The results of this study showed all tests for fecal coliform to be less
than the B.C. Health Branch standard of 200 organisms per 100 milliliters, and
for all samplings of total coliform at Okanagan and Skaha beaches the median
coliform levels were less than the standard of 240 organisms per 100
milliliters, At Kin Beach, the acceptable level of total coliform was exceeded
in two out of the four sampling periods. It was also found that to obtain a
reliable coliform count for any one beach, more than ten random samples
encompassing the entire beach area are required for each sampling. Below this
number the results become too erratic, and are not representative of the beach
area as a whole.
A second test used for the presence of pathogenic bacteria in the Skaha
Beach areas was "Moore's Gauge Swab Test" (Ref. No.11). Test installations were
secured at various locations in the bathing area. In all cases the swab samples
submitted for examination of pathogenic organisms yielded negative results.
This is supported by similar studies by Geldrich (12) which showed

that there was little evidence of pathogenic organisms in water samples
that had fecal coliform tests of approximately 200 organisms per 100
milliliters.
An examination of coliform test on streams and outfalls indicate the main
contributors of fecal coliform to be those centers with sewage treatment
outfalls as shown in Table 5.4. The contribution from streams was relatively
small in comparison to these outfalls. The City of Vernon Sewage Treatment
Plant, Dutch Dairies at Armstrong, and the City of Armstrong Lagoons
contribute fecal coli-form to the Kin Beach area at Vernon, and the City of
Penticton Sewage Treatment Plant contribute fecal coliform to Skaha Beach at
Penticton.
Insufficient data were obtained in this study to evaluate all of the
factors contributing to changes in coliform levels of bathing beaches. Future
studies should consider such factors as bathing population, the circulation
pattern of lake water in beach areas, and the weather, on coliform densities.
TABLE 5.4
COLIFORM RESULTS - OUTFALL SAMPLING LOCATIONS

5.1.4 Pesticides and Trace Metals
Studies on the use of pesticides within the Okanagan Basin, and on the
levels of mercury and the pesticide D.D.T. in fish, were carried out to obtain
some preliminary information on this aspect of water quality.
A review of the use of pesticides in the Okanagan Basin over the past 10
years show that the sales of D.D.T. declined from a 10 year peak of 836,000
pounds in 1965 to 27,700 pounds in 1970. The most serious problem associated
with D.D.T. and related compounds was their persistance in the environment and
accumulation in the food chain, culminating in a provincial (British Columbia)
ban on this type of pesticide in 1971. Although a number of new pesticides
have appeared in the past 10 years. Entomologists have recognized that pesti-
cides are not the final answer to insect control, and that other forms of
control are desirable along with the intelligent use of less persistent pesti-
cides. The recommended use of pesticides in the tree fruit industry and esti-
mated sales are detailed for the period 1960 to 1970 in Technical Supplement
IV "Water Quality in the Okanagan Basin".
Levels of the pesticide D.D.T and the trace element mercury, found in
the flesh of fish from the main valley lakes, are compared to standards of the
Canada Food and Drug Directorate in Figure 5.2. Acceptable levels for mercury
are exceeded in squawfish and to a lesser extent in large rainbow trout in
Okanagan Lake. Squawfish and large rainbows owe their accumulation of mercury
to their heavy utilization of other fish for food. High levels of D.D.T. were
also found in rainbow trout and kokanee from Kalamalka Lake.

5.1.5 Summary of Stream Water Quality Problems
Those streams in which major quality problems are evident are reviewed
below:
(i) Vernon Creek
Vernon Creek above Ellison Lake had excessive loadings of phosphorus and
manganese during the spring runoff period. The amount of total phosphorus in the
soluble orthophosphorus form did not at any time exceed a concentration of 0.1
parts per million even though the total phosphorus concentrations reached levels
of 6 to 7 parts per million. This indicates most of this was in the form of
organic leaves and twigs carried down by runoff in the spring of the year. The
source of the high levels of manganese in this and other headwater streams is not
known.
Vernon Creek between Kalamalka Lake and Okanagan Lake exceeded the criteria
for manganese, phosphorus, nitrogen and total coliform. This portion of the
Vernon Creek Watershed includes the drainage from BX Creek. The whole area is
highly developed either for agriculture or urban use. The City of Vernon also
discharges its treated waste effluent into this section of Vernon Creek.
(ii) Coldstream Creek
This stream drains a large agricultural area before discharging into
Kalamalka Lake. Those constituents which exceed acceptable levels include
phosphorus and both total and fecal coliforms. Both phosphorus and coliform
probably result from the dairy and beef cattle enterprises along this stream
which carry some 1200 head.
(iii) Deep Creek
Constituents in this stream that exceeded acceptable levels included
manganese, phosphorus, and total coliform. The Deep Creek watershed basically
drains the north end of the valley proper and is not representative of other
creek basins. The area is extensively farmed with over 50% of the drainage area
in cropland or pasture. The City of Armstrong also discharges its treated
effluent from lagoons to Deep Creek along with a number of other agriculturally
orientated industries. Deep Creek is one of the few creeks that had dissolved
oxygen concentrations of less than 5 parts per million, indicative of the lack of
good conventional waste treatment practices in this sub-basin.
(iv) Westbank Creek
This stream had particularly high levels of both fecal and total coliform,
due primarily to the discharge of treated effluent from the Westbank sewage
treatment plant.

(v) Kelowna Creek
The lower portion of the Kelowna Creek watershed is highly developed
(Figure 5.3) for both farm land and urban development. Very high levels of
both total and fecal coliform were recorded at its mouth, in addition to
excesses of phosphorus and manganese. Two quality stations were located on
this stream, one at the mouth and the other above the main urban development.
While the creek at the station above the urban area exceeded criteria for
fecal coliform, probably as a result of livestock enterprises, this number
increases five fold as the stream traversed the urban area of Kelowna as shown
by the following results:
This
indicates the effect of urbanization on the contamination of streams
traversing highly populated. areas.
(vi) Brandt's Creek
This is a small creek that passes through the industrial area adjacent to
the City of Kelowna and receives most of its waste loadings from industrial
sources. The water quality in Brandt's Creek is the lowest in the basin with
extremely high coliform densities very low oxygen content, and high
concentrations of phosphorus, manganese, and iron. An industrial waste
treatment plant is now being constructed in this area which should
significantly improve the water quality of this tributary.
(vii) Inkaneep Creek
This creek is a tributary of Osoyoos Lake with cattle grazing and feed-
lots in the lower reaches on Indian Reserve land. Phosphorus and coliform
levels in this stream exceeded acceptable water quality standards.
In summary, most of the water quality problems in the tributaries occur
either because of the natural characteristics of the watershed, or from point
source loadings from municipal waste treatment plants, industries and agricul-
tural operations. Logging operations in the tributary headwaters also contri-
bute excess loadings of total phosphorus to many streams, although only a
small percentage of this is normally in the soluble orthophosphorus form.

5.2 EFFECT OF LAND USE ON HATER QUALITY
During the period of July to October, 1972 a detailed but brief water quality
survey was carried out on Kelowna and Lambly Creeks to provide a preliminary
assessment of the effect of various forms of land use on stream water quality.
The choice of these two Creeks was made on the basis of the number of existing
hydrometric stations, prior information from water quality monitoring programs and
accessibility.
The watersheds of the two creeks are situated directly across Okanagan Lake
from one another. Lambly Creek, on the west side of the lake drains an area of 95
square miles and is the more rugged of the two. It is essentially undeveloped
except for logging. In contrast the Kelowna Creek watershed, which has a drainage
area of 86 square miles, is highly developed in its lower reaches. Although their
drainage areas are approximately equal, the quantity of runoff during 1972 from
Lambly Creek (58,800 acre feet) was about three times that of Kelowna Creek
(18,700 acre feet). Of these total runoffs, 16% or 3,000 acre feet were recorded
at the mouth of Kelowna Creek during the study period (July to October) as
compared to 7% or 3,900 acre feet from Lambly Creek. This difference is largely
due to the storage of water in the Kelowna Creek headwaters in the spring for
release as irrigation water in the summer months.
The results presented below should be interpreted with care because of the
short monitoring period and low volume of annual runoff which occurred during this
period. Larger differences might be expected during the spring freshet or on a
yearly basis.
The land use of these two basins, and the sub-divisions used for studying the
effect of land use activities on water quality, are shown in Figures 5.3 and 5.4.
In general these landuse activities may be summarized as follows:
Kelowna Creek - Range grazing in the upper reaches
- Irrigation for orchards in the lower reaches
- Industry between Rutland and Kelowna
- Domestic discharge to the ground below Rutland Lambly
Creek - Logging in the headwaters of Terrace Creek
- No activity in the remainder of the watershed
The estimated loadings of selected chemical constituents and their drainage
area coefficients are shown in Tables 5.5 and 5.6. The drainage area coefficients
were obtained by dividing the change in loading between monitoring stations by the
area contributing to the creek. The accuracy of these results is largely
dependent on the accuracy of stream flow measurements which in many


TABLE 5.5
KELOWNA CREEK - INCREMENTAL LOADINGS AND DRAINAGE AREA COEFFICIENTS FOR SELECTED CHEMICAL CONSTITUENTS FROM
VARIOUS LAND USE DRAINAGE SUB-DIVISIONS


TABLE 5.6 LAMBLY CREEK - INCREMENTAL LOADINGS AND DRAINAGE AREA COEFFICIENTS FOR SELECTED CHEMICAL
CONSTITUENTS FROM VARIOUS LAND USE DRAINAGE SUB-DIVISIONS
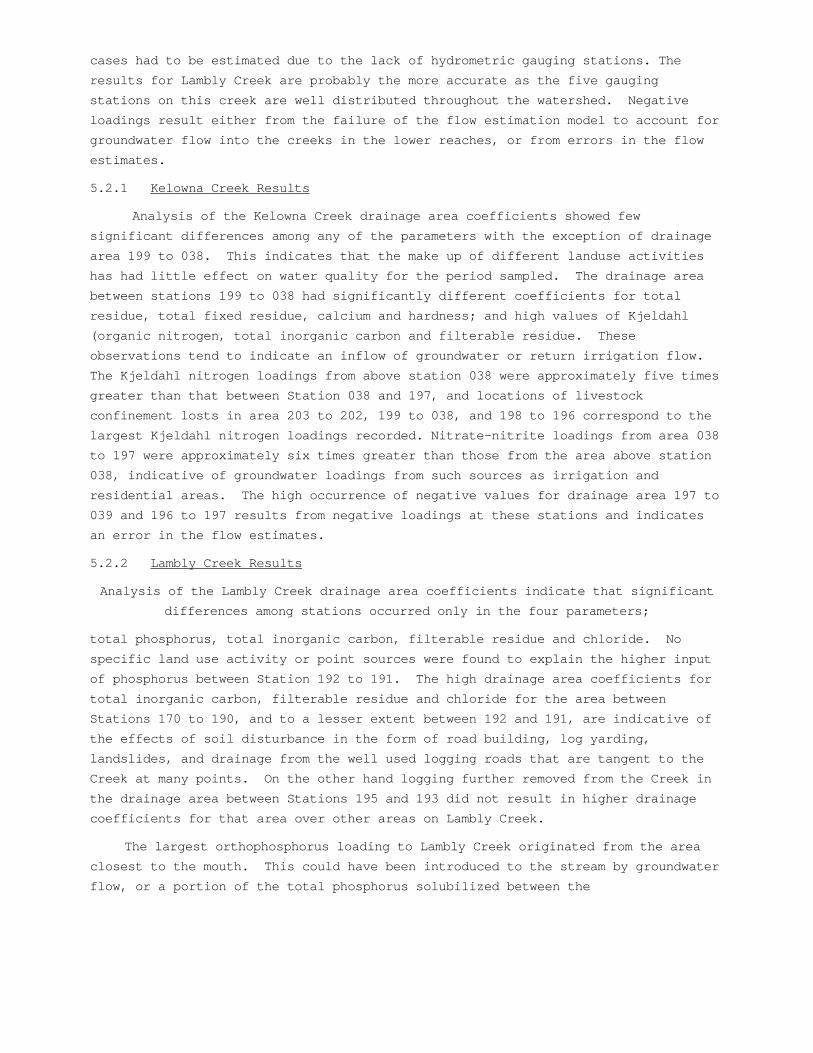
cases had to be estimated due to the lack of hydrometric gauging stations. The
results for Lambly Creek are probably the more accurate as the five gauging
stations on this creek are well distributed throughout the watershed. Negative
loadings result either from the failure of the flow estimation model to account for
groundwater flow into the creeks in the lower reaches, or from errors in the flow
estimates.
5.2.1 Kelowna Creek Results
Analysis of the Kelowna Creek drainage area coefficients showed few
significant differences among any of the parameters with the exception of drainage
area 199 to 038. This indicates that the make up of different landuse activities
has had little effect on water quality for the period sampled. The drainage area
between stations 199 to 038 had significantly different coefficients for total
residue, total fixed residue, calcium and hardness; and high values of Kjeldahl
(organic nitrogen, total inorganic carbon and filterable residue. These
observations tend to indicate an inflow of groundwater or return irrigation flow.
The Kjeldahl nitrogen loadings from above station 038 were approximately five times
greater than that between Station 038 and 197, and locations of livestock
confinement losts in area 203 to 202, 199 to 038, and 198 to 196 correspond to the
largest Kjeldahl nitrogen loadings recorded. Nitrate-nitrite loadings from area 038
to 197 were approximately six times greater than those from the area above station
038, indicative of groundwater loadings from such sources as irrigation and
residential areas. The high occurrence of negative values for drainage area 197 to
039 and 196 to 197 results from negative loadings at these stations and indicates
an error in the flow estimates.
5.2.2 Lambly Creek Results
Analysis of the Lambly Creek drainage area coefficients indicate that significant
differences among stations occurred only in the four parameters;
total phosphorus, total inorganic carbon, filterable residue and chloride. No
specific land use activity or point sources were found to explain the higher input
of phosphorus between Station 192 to 191. The high drainage area coefficients for
total inorganic carbon, filterable residue and chloride for the area between
Stations 170 to 190, and to a lesser extent between 192 and 191, are indicative of
the effects of soil disturbance in the form of road building, log yarding,
landslides, and drainage from the well used logging roads that are tangent to the
Creek at many points. On the other hand logging further removed from the Creek in
the drainage area between Stations 195 and 193 did not result in higher drainage
coefficients for that area over other areas on Lambly Creek.
The largest orthophosphorus loading to Lambly Creek originated from the area
closest to the mouth. This could have been introduced to the stream by groundwater
flow, or a portion of the total phosphorus solubilized between the

last two stations. The differences in nitrogen loadings did not reflect any
specific land use activities, the largest loadings occurring in the largest
drainage areas.
5.2.3 Comparison of Lambly and Kelowna Creeks
For every parameter the maximum drainage area coefficients for Lambly Creek
are lower than the maximums for Kelowna Creek. This is indicative of the
different nature of the Creeks in terms of slopes, accessibility, population
density, agriculture and near-creek activities. Coefficients for the upper
reaches of Kelowna Creek were comparable to those for Lambly Creek where both
areas are relatively similar in topography and land use.
5.2.4 Summary
While some general findings can be drawn from the study of land use on Lambly
and Kelowna Creeks, it has not been possible to identify specific land use
activities with specific coefficients that could be used to predict the effect of
future economic growth on water quality in the basin as a whole. Conclusions that
can be made within the limitations of the study period data are as follows:
(i) That forest-harvesting outside the immediate area of Lambly
Creek watercourse has had little effect on stream water quality.
(ii) That logging-road construction and logging activity close to
Lambly Creek has caused deterioration of stream water quality, as evidenced by
significantly higher drainage area coefficients and high concentrations of
indicator parameters.
(iii) That specific point-sources of pollution on Kelowna Creek have
more effect on water quality than general land use activities, and sources near
the creek have a more direct effect than those located at a greater distance.
5.3 NUTRIENT LOADINGS TO THE MAIN VALLEY LAKES
Monitoring of significant sources of nutrients to the main valley lakes over
the three study years has provided the estimate of mean total annual loadings
shown in Table 5.7. The term 'nutrients' in this report refers to the elements
nitrogen and phosphorus which are considered the most important elements in
respect to the enrichment of the lake waters in recent years, and the resulting
increase in biological productivity in the form of algal blooms and aquatic plant
growth.
This estimate indicates that tributary streams and municipal outfalls together
account for over 55% of the total nitrogen and 75% of the total phosphorus
entering the main valley lakes. A brief description of each of these sources is
presented below.

TABLE 5.7
SOURCES AND ESTIMATED ANNUAL INPUT OF THE NUTRIENTS NITROGEN AND PHOSPHORUS
TO THE MAIN VALLEY LAKES
5.3.1 Tributary Streams
The stream monitoring program carried out over the two year period of
July, 1969 to August, 1971 included only those streams considered to be
representative of the major streams tributary to the main valley lakes. To
provide an estimate of the total contribution of nutrients from all streams,
loadings were pro-rated on the basis of monitored and total drainage basin
areas for a given lake. A comparison of the number and drainage area of
monitored streams, to the total for each of the main valley lakes is shown in
Table 5.8.
Streams influenced by municipal and industrial waste discharges to sur-
face waters (Vernon, Deep, Brandt, and Westbank Creeks) and those which con-
nect the main Valley Lakes (Vernon Creek and Okanagan River), were not con-
sidered as representative tributary streams in respect to watershed quality
and were omitted for this pro-rating procedure.
The annual input or loadings of nitrogen and phosphorus were estimated by
first averaging all quality and quantity data obtained for each stream for the
two year sampling period. The averaged flow and nutrient concentrations were
then used to compute the average annual input (loading) from the stream in
question. The loadings to each of the main valley lakes were obtained by

TABLE 5.8
COMPARISON OF STREAMS MONITORED FOR WATER QUALITY TO TOTAL FOR BASIN
totalling individual stream inputs to the lake including estimates for
unmonitored streams as obtained from the above pro-rating procedure.
To provide an estimate of the accuracy of these methods and results, a
study was carried out on the variation in annual loadings with runoff for
eight major tributaries using 1969-71 data and additional information
obtained in 1972. The results of this study (Figure 5.5) indicate that
loadings may vary from one half to two and a half times the mean loading
between a dry year and a wet year. The nutrient input, based on average
stream flows however, varies only by 7 to 12 percent from the 1969-71
estimates used in this report. The estimated annual loadings for tributary
streams are therefore considered to be a reasonably accurate presentation of
the long term contribution assuming 1971 development conditions.
The nutrient input of individual streams was also assessed to determine
the relative importance of each stream in the future control of nutrients.
Nutrients and other chemicals in streams originate from plant and animal
organic matter in the watershed, soil erosion, and dissolved minerals from
bedrock and soil formations. Deforestation and other activities in a
watershed will affect the rate of snowmelt and runoff to a stream and the
amount of organic matter of erodable soils in the stream waters. Groundwater
return flows and industrial and urban development will also contribute to
stream loadings in the lower reaches.
A review of the estimated annual loadings of the major tributary streams
(Figure 5.6) indicates that those streams with larger drainage areas generally
contribute higher amounts of nutrients. The eight streams Mission, Trout,
Shorts, Lambly, Deep, Kelowna, Whiteman and Coldstream - contributed over 60%
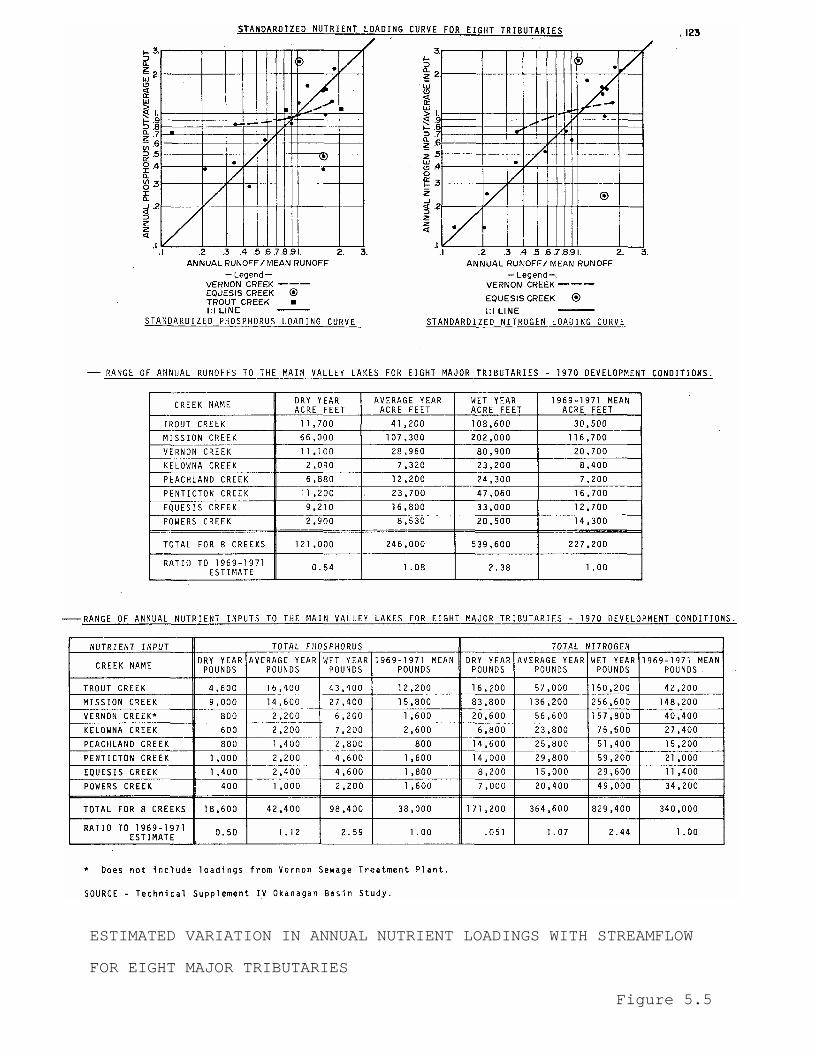
ESTIMATED VARIATION IN ANNUAL NUTRIENT LOADINGS WITH STREAMFLOW
FOR EIGHT MAJOR TRIBUTARIES
Figure 5.5

ESTIMATED ANNUAL LOADINGS OF NUTRIENTS TO THE MAIN VALLEY LAKES
FROM TRIBUTARY STREAMS Figure 5.6

of the total input of nitrogen and phosphorus to the main valley lakes between
1969-71. Those creeks in sparsely developed areas - Shorts, Whiteman,
Naswhito, etc, contributed significant amounts of total phosphorus, but less
than 20% of this was in the soluble orthophosphorus form.
Estimates of the portion of loadings to streams that occur from
agricultural and septic tank sources are shown in Tables 5.9a and b. These
loadings are primarily from surface runoff or groundwater which enters the
tributary streams and has been measured as a part of the total stream loading.
TABLE 5.9a
ESTIMATED LOADING OF NITROGEN TO STREAMS FROM NATURAL, AGRICULTURAL AND SEPTIC TANK SOURCES
Pounds Per Year
5.3.2 Municipal Outfalls
Six municipalities currently (1971) discharge treated waste effluent into
the surface waters of the basin. The estimated annual inputs of nutrients
from these municipal discharges is shown in Table 5.10. The figures are based
on a two-year monitoring period, the mean concentrations of nutrients from all
samples taken, and the mean annual discharge from each treatment plant.
Orthophosphorus loadings, which represent the soluble portion of total
phosphates, have been included to show the high percentage of this element
that is in the soluble form following secondary (biological) treatment as
compared to the low percentage that is in the soluble form in tributary stream
discharges (Figure 5.6).

TABLE 5.9b
ESTIMATED LOADING OF PHOSPHORUS TO STREAMS FROM NATURAL, AGRICULTURAL AND SEPTIC TANK SOURCES
Pounds Per Year
TABLE 5.10
ESTIMATED ANNUAL INPUT OF NUTRIENTS TO SURFACE
WATERS FROM MUNICIPAL OUTFALLS

The accuracy of the figures shown in Table 5.10 is dependent primarily on
the accuracy of the flow measurements and is considered to be within 10% of
the values shown.
During the summer and fall of 1971 the City of Vernon diverted
approximately 50% of its treated discharge to a pilot spray irrigation
project. This was taken into account when determining the mean annual
discharge of nutrients to Vernon Creek from this municipal outfall. In 1971
the City of Penticton completed a chemical tertiary treatment unit for the
removal of phosphorus, but this unit was not in operation during the
monitoring period and the effect of this facility is not reflected in the
values shown. The amount of phosphorus removed by this tertiary unit in 1972-
73 has been estimated at 50 to 60%.
5.3.3 Industrial Outfalls
Thirteen major industrial outfalls (waste effluent discharged to surface
waters) were monitored on a monthly basis between August, 1969 and July, 1971.
These outfalls included all the major industrial waste discharges in terms of
volume and organic loads, and several of the small industrial establishments
considered to be representative of numberous other plants of the same
category. In addition, 36 minor outfalls were sampled at least twice during
the monitoring period. Data collected on those industries with positive
discharges to surface waters were used to estimate the annual nutrient
loadings from each industrial source as shown in Table 5.11. Those industries
which discharge their waste effluent into ground disposal systems are
considered as groundwater sources. As in the case of streams and municipal
outfalls mean concentration's and mean discharges were used to estimate annual
loadings for industrial outfalls.
The total contribution of nutrients from industrial outfalls represents
less than two percent of the total annual input of nutrients from a11 other
sources and except for local problems which they may cause, are not currently
of prime importance in the control of nutrients to surface waters.
The accuracy of the loadings from industrial outfalls is almost directly
proportional to the accuracy of flow measurements which could be in error by a
factor or 50%. The flows of these outfalls were not monitored on a continuous
basis, but rather were estimated at the time of sampling. This percentage
error will not seriously affect the results because of the negligible amounts
involved under 1971 development conditions.
5.3.4 Storm Sewers
A study to determine the amount of nutrients and other impurities discharging
into the surface waters of the Basin from the storm sewers of the cities

TABLE 5.11
ESTIMATED ANNUAL INPUT OF NUTRIENTS TO SURFACE WATERS FROM INDUSTRIAL OUTFALLS
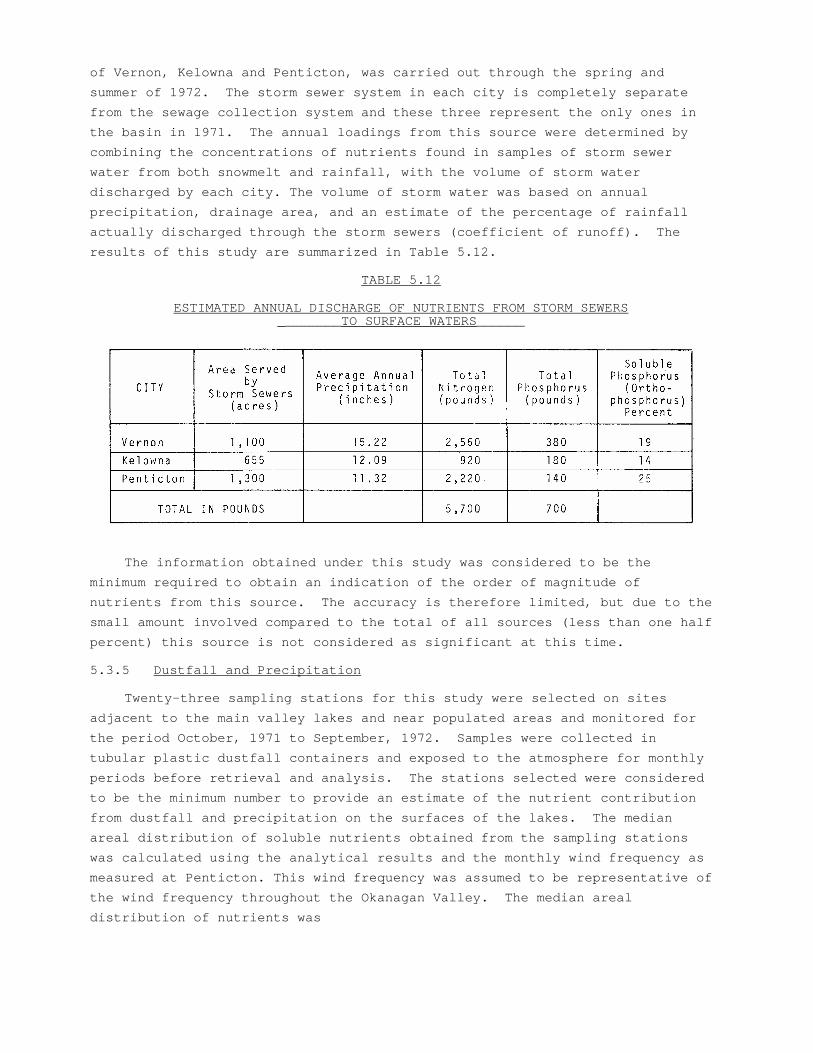
of Vernon, Kelowna and Penticton, was carried out through the spring and
summer of 1972. The storm sewer system in each city is completely separate
from the sewage collection system and these three represent the only ones in
the basin in 1971. The annual loadings from this source were determined by
combining the concentrations of nutrients found in samples of storm sewer
water from both snowmelt and rainfall, with the volume of storm water
discharged by each city. The volume of storm water was based on annual
precipitation, drainage area, and an estimate of the percentage of rainfall
actually discharged through the storm sewers (coefficient of runoff). The
results of this study are summarized in Table 5.12.
TABLE 5.12
ESTIMATED ANNUAL DISCHARGE OF NUTRIENTS FROM STORM SEWERS _______TO SURFACE WATERS______
The information obtained under this study was considered to be the
minimum required to obtain an indication of the order of magnitude of
nutrients from this source. The accuracy is therefore limited, but due to the
small amount involved compared to the total of all sources (less than one half
percent) this source is not considered as significant at this time.
5.3.5 Dustfall and Precipitation
Twenty-three sampling stations for this study were selected on sites
adjacent to the main valley lakes and near populated areas and monitored for
the period October, 1971 to September, 1972. Samples were collected in
tubular plastic dustfall containers and exposed to the atmosphere for monthly
periods before retrieval and analysis. The stations selected were considered
to be the minimum number to provide an estimate of the nutrient contribution
from dustfall and precipitation on the surfaces of the lakes. The median
areal distribution of soluble nutrients obtained from the sampling stations
was calculated using the analytical results and the monthly wind frequency as
measured at Penticton. This wind frequency was assumed to be representative of
the wind frequency throughout the Okanagan Valley. The median areal
distribution of nutrients was

then combined with the surface area of each respective lake to provide an
estimate of the annual input of nitrogen and phosphorus from dustfall and
precipitation.
The results of this study indicate that this source of nutrients
represents a significant input (10%) to the lake system (Table 5.13). The
accuracy of these results is considered as acceptable for providing order of
magnitude figures only, although they are generally in agreement with other
published data on dustfall and precipitation for other lake basins in Canada
and the United States. One of the problems encountered with some sampling
stations was contamination because of their accessiblity to the public. While
the samples were filtered prior to analysis and only the soluble portion of
the sample analysed, some error may have been introduced into the results
because of foreign material being deliberately introduced into some of the
sample containers.
TABLE 5.13
ESTIMATED ANNUAL INPUT OF TOTAL SOLUBLE NITROGEN AND PHOSPHORUS INTO
THE MAIN VALLEY OKANAGAN LAKES FROM DUSTFALL AND PRECIPITATION
5.3.6 Groundwater
Groundwater sources encompass all nutrients transported to the surface
water system by groundwater flows. These nutrient sources include
agriculture, septic tanks, and other unidentified sources including those
which occur naturally through the dissolving of various elements by moving
water. These groundwater sources in general represent the greatest unknown of
all nutrient sources due primarily to the difficulty in measuring groundwater
flows. Part of the water that falls as precipitation on the watershed
percolates through the soil

to the groundwater table and eventually finds its way to the surface waters of
tributary streams and the main valley lakes. In the Okanagan Basin this is
augmented by groundwater return flows from irrigation. Studies of the latter
indicate that up to 50% of the water applied for irrigation purposes eventually
returns to the lake system, and is considered to make up the largest portion of
the total groundwater flow in irrigated areas. The transport of this water
through the ground is very slow however, and it's ultimate destination very
difficult to determine. Part of the return flow from irrigation water applied
during April to November, for example, may not return to the surface water system
for 6 to 12 months. Therefore while estimates of the concentrations of nutrients
in the groundwater can be determined fairly accurately, the groundwater flow and
resulting loadings are much more difficult to assess.
Four studies were undertaken in an attempt to provide order of magnitude
figures on the amounts of nutrients entering the main valley lakes via ground-
water. These groundwater sources include both direct drainage to the lakes as
well as groundwater flows to tributary streams. The studies included a
theoretical analysis of all potential source loadings, augmented by pilot studies
on septic tanks, land fills, and spray irrigation-lysimeter tests. The study on
source loadings involved the documentation of all nutrients that might ultimately
reach receiving waters in the ground. These included such sources as irrigation
water, fertilizers, agricultural animals, wildlife, dustfall and decaying organic
matter. A larger percentage of these groundwater loadings return to the
tributary streams themselves and therefore have been measured as part of the
stream loadings. The remaining groundwater enters the main valley lakes
directly. The pilot studies on septic tanks, land fills, and spray irrigation-
lysimeter tests were carried out in conjunction with the waste treatment section.
Briefly, they provide information on the transport of water and nutrients through
various soil types under controlled conditions.
Estimates of the position of groundwater source loadings that return to the
tributary streams were presented in Table 5.9. Groundwater source loadings that
return directly to the main valley lakes are shown in Tables 5.14a arid 5.14b.
These results indicate that groundwater contributes approximately 26% of the
total nitrogen and 12% of the total phosphorus entering the main valley lakes.
Nitrogen is a transient element which is readily transported by water through the
soil, while phosphorus becomes bonded with the soil particles and is transported
only when conditions of excess phosphorus occur. Most of the phosphorus that is
transported however, is in the soluble (orthophosphorus) form, and the
orthophosphorus loadings may be considered equal to the total phosphorus
loadings.
The overall accuracy of these results is considered to be correct to within
one order of magnitude, but greater variations may occur within the basin as a

TABLE 5.14 a
ESTIMATED ANNUAL INPUT OF TOTAL NITROGEN TO THE MAIN __________VALLEY LAKES FROM GROUNDWATER_________
TABLE 5.14_b
ESTIMATED ANNUAL INPUT OF TOTAL PHOSPHORUS TO THE MAIN ___________VALLEY LAKES FROM GROUNDWATER__________
whole. Further, since phosphorus has been considered as the key element in
controlling lake enrichment, this degree of error will not have the same
importance on the overall results as it would had nitrogen been indicated as
the controlling element.
5.3.7 Summary
A series of studies were carried out to determine the sources- and
amounts of the nutrients nitrogen and phosphorus entering the main valley
lakes. The results of this study are summarized in Table 5.7 and Table 5.15.
The main purpose of these investigations was to identify significant sources
of these nutrients and to determine if these can be controlled to maintain or
enhance the water quality of the main valley lakes for consumptive use,
recreations, and aesthetic enjoyment. Based on limnological findings and
recommendations,

TABLE 5.15
MAJOR NUTRIENT LOADINGS TO THE MAIN VALLEY LAKES
phosphorus was subsequently determined to be the element which should be
limited to control lake enrichment and biological growth. Studies on loading
sources of these nutrients support this choice. The estimated amount of
nitrogen entering the main valley lakes is about seven times greater than that
of phosphorus, and only about 30% of this loading can be considered as
controllable by current technological methods.
Approximately 60% of the phosphorus loadings are considered controllable,
the major portion of which comes from municipal outfalls and septic tanks.
Further, the evaluations presented later in this report indicate that the
control of these two sources will probably meet the desired objective of
maintaining or enhancing the quality of the main valley lakes over and in some
cases beyond the study horizon of 2020. This does not infer that long-term
measures to control other sources of nutrients should not be examined, tested
and if feasible, implemented. Tributary streams, for example, represent the
second largest source of phosphorus and the protection of major streams by
permanent green belts could significantly reduce phosphorus loadings. The
implementation and assessment of such a program however, could take a number
of years and the effects may take much longer to materialize.
5.4 WASTE TREATMENT PILOT PROJECTS
Waste collection and treatment systems are used to process urban wastes
for public health and aesthetic reasons. These wastes are ultimately
discharged to the streams and lakes of the valley where they are assimilated
as food by plant and animal life. The waters of the basin therefore play an
essential role as receiving waters for man's wastes. The assimilative
capacity of these lakes however, is limited and increasing levels of treatment
are often required to offset increased waste loadings and maintain an
acceptable balance of food and biological productivity in the lake
environment.
A number of pi lot studies and test installations were undertaken as part
of the water quality studies to determine the feasibility and value of
advanced waste treatment processes for the control of nutrient discharges, and
problems associated with waste disposal. These included:
- A review and Evaluation of Advanced wastewater Treatment Methods.
- A Lysimeter Spray Irrigation Study
- Monitoring of Spray Irrigation of Sewage Treatment Plant Effluent at Vernon.
- Phosphorus Removal by Lime Treatment
- Influence of Septic Tank Effluent on Receiving water Nutrient Gain from
Groundwater
- Nutrient Contributions from Refuse Disposal Sites.
The results of each of these studies are summarized in this section.

5.4.1 Review of Present Treatment Practices
Of an estimated 115,000 people in the basin (1971) 56,000 (50%) were on
municipal collection and sewage treatment systems, leaving 59,000 (50%) on septic
tank installations. Of a known 52 industrial producers of waste products, 9
discharge through ground filtration systems, 12 are primarily cooling water effluent,
and the balance are untreated.
Municipal sewage treatment systems in the Okanagan Basin include secondary
treatment plants or lagoons. The primary purpose of both types of systems is to
separate the solid wastes from the liquid wastes by biological treatment and settling
ponds, so that the clarified effluent can be disposed of to surface waters. The
liquid waste represents by far the largest portion of sewage and comes primarily from
the water used to transport the solid wastes to the treatment plant. Secondary
treatment also reduces organic loadings in the treated effluent which otherwise would
reduce or deplete the dissolved oxygen content of surface waters. Before
discharging, the clarified effluent is chlorinated to remove pathogenic bacteria.
The above is referred to as secondary or 'conventional' treatment in this report, as
compared to advanced or tertiary treatment which is primarily for the removal of
nutrients. Tertiary treatment for the removal of phosphates has recently been
installed in Penticton, and Vernon has initiated an experimental program of spray
irrigation, using secondary effluent as an advanced form of treatment.
While the present level of waste treatment in the Okanagan is equal to or better
than that of most other parts of Canada or North America, certain problems do exist
in the conventional treatment processes that require correction before advanced or
tertiary treatment can really be effective. These include the age and in some cases
outdated forms of conventional treatment, and the overloading of the plants in the
summer months due to the heavy influx of tourists. The studies and findings on
advanced treatment in this report assume that a high standard of conventional
treatment is maintained at all times.
5.4.2 Review and Evaluation of Advanced Wastewater Treatment Methods
A literature review of advanced wastewater treatment methods with emphasis on
removal of nutrients, was carried out as a prelude to selecting those that seemed
most appropriate for testing under local conditions. This review included an
assessment of the efficiency, cost and ease of operation of each nutrient removal
method. A comparison of these nutrient removal processes and their costs is included
in Table 5.16. Based on this review, and the consideration of these processes by a
group of consulting engineers on waste treatment for the major urban centers in the
Valley, it was recommended that the pilot studies include the monitoring of a pilot
spray irrigation system being installed by the City of Vernon, a lysimeter study at
Penticton to determine the suitability of Okanagan soils for wastewater treatment,
and a pilot study in-

TABLE 5.16
COMPARSION OF NUTRIENT REMOVAL PROCESSES*

volving lime addition to raw sewage for the purpose of phosphorus removal in the
City of Kelowna treatment plant. The latter involved an evaluation of the
feasibility for adapting existing facilities in Kelowna to handle this advanced
treatment process.
Pilot installations for the removal of nitrogen were considered, but not
included because of similar studies being carried out by the Canada Centre for
Inland Waters, and because of expected difficulty in controlling sufficient amounts
of this element in the basin to warrant its removal from waste effluents only.
5.4.3 Lysimeter Spray Irrigation Study at Penticton B.C.
This study was designed to provide information concerning the ability of three
typical Okanagan Basin soils to act as conditioners of secondary effluent from
sewage treatment plants, when crops are grown as an integral part of the operation.
It was considered that if spray irrigation of treated sewage is to be used as a
method of preventing nutrients from reaching the surface waters of the basin, then
it must be determined in advance that this is a viable method in those areas of the
basin that have nutrient problems. A. lysimeter consists of an enclosed unit of
soil which permits tests to be carried out under controlled conditions (Figure
5.7).
The parameters considered the most important in these tests were soil type,
crop type, and rate of wastewater application. Thirty individual lysimeters were
installed in a block on a site of the Penticton Sewage Treatment Plant to provide
for the testing of these various parameters. Duplicate lysimeters were used for
each set of conditions. The three soil types chosen were considered representative
of the soil textures found in the Valley, particularly for locations where full
scale spray irrigation projects might be implemented in the near future. These
included:
Enderby silt-loam: a fairly prevalent soil type in the valley north of Vernon, and similar to silt loams in the Penticton area.
Armstrong gravelly sandy loam: similar to soils found in all areas of the valley. It is probably representative of the soil type most prevalent in the Okanagan Basin. The collection site is immediately adjacent to the Vernon spray irrigation site.
Osoyoos sandy loam: indicative of the soil commonly found in the area from Okanagan Falls to the United States border. A similar soil is also found in the O'Keefe Ranch area near Vernon.
The two crops used in this study provided extremes in nitrogen utilization, Reed Canary grass being a relatively high nitrogen user, while alfalfa produces most of its own nitrogen through root nodules. Both crops were expected to be about equal in terms of phosphorus uptake.


Two different rates of effluent application were used, the first being the
'normal' rate as recommended for each soil type, which provides sufficient
water to ensure that some passes through, the soil column to prevent the
buildup of undesirable constituents in the root zone. The second rate was
arbitrarily chosen at 2 1/2 times the normal rate, to determine the effect of
high rates of application, since the possibility exists that effluent disposal
on land may involve higher rates of application than 'normal' due to economic
and land availability aspects.
The treated effluent from the secondary clarifiers of the City of
Penticton Sewage Treatment Plant was used for most of the tests. In addition,
six of the lysimeters were selected as control units for comparison purposes,
and irrigated with water from the City domestic supply system.
The testing program was carried out between May and October, 1972.
Quantity and quality data were obtained on both the applied liquid and the
liquid passing through the soil columns (leachate) to the bottom of the lysi-
meters, where it was collected. The nutrient uptake by the crops was also
measured to provide a nutrient budget for each experiment. Because the sur-
vival of pathogenic bacteria in the water passing through the soil column
could be of concern to users of groundwater near such a project, monitoring of
total and fecal coliform was included as part of the testing procedure.
The results of this study are summarized in Figure 5.7. The values shown
under the column 'residual' represent the nutrients which are not removed in
the leachate or the crops, and are therefore accounted for by soil storage.
These results indicate only a small fraction of the applied nutrients are
carried through the soil column in the leachate water.
Phosphorus storage in the Osoyoos sand and Vernon loam amounted to
between 50% and 80% of the phosphorus applied in the secondary effluent. The
results for the Enderby silt were not considered reliable because of apparent
short circuiting (flow of water between the soil column and side of the
lysimeter rather than through the soil column) of the applied liquid through
the lysimeter. Phosphorus in the leachate from the Osoyoos sand amounted to
less than 1.4% of the total applied, and for the Vernon loam, less than o.1%.
For Enderby silt, the amount was higher (2 to 4%) due to the higher initial
phosphorus content of the Enderby silt, and the apparent short circuiting that
occurred in these units. The percentage of phosphorus taken up by the crops
was 12 to 22% for the high rate of application, and 26 to 46% for the low rate
of application.
with the exception of one set of lysimeters containing Enderby silt, the
total nitrogen in the leachate was 4% or less of the total applied.

Results obtained on coliform tests showed levels in the leachate for both
the total and fecal types to be less than 10 per 100 millileters for all
lysimeters following correction of the short circuiting in the Enderby silt
units.
In general, the following conclusions have been reached from these
lysimeter tests.
(i) The use of spray irrigation for the reconditioning of secondary
effluent appears to be a very acceptable practice for all three types of soils
tested. This statement is true for both application rates tested, but is
evident that significant leaching of impurities would occur sooner at higher
application rates.
(ii) Both Reed canary grass and alfalfa are useful crops for removing
nutrient forms from the secondary effluent. With time, the alfalfa will pro-
bably allow a larger amount of nitrogen to escape to groundwater because of
nitrogen fixing nodules on the roots.
(iii) Storage of excess nitrogen and phosphorus is evidently occurring in
the soil. To maintain a balance of nutrients applied vs. nutrients harvested,
in the crops, would require the use of a short irrigation season, and hence
reduce the effectiveness of this proposed method of nutrient control in the
Okanagan Valley.
(iv) The finer soils have a higher storage capacity for the various nut-
rient forms due to their higher adsorptive capacities.
(v) Good correlation was obtained between the lysimeter study and the
full-scale irrigation project at Vernon discussed in the following section.
Consequently, the results of the lysimeter investigations of the other soil
types should be useful in predicting results from fullscale irrigation of these
soils.
(vi) Coliform concentrations in groundwater return flow are very low after
passing through four feet of any of the three soil types tested. Hence, there
is no apparent concern in full-scale facilities where the travel distances will
be much greater before any water is withdrawn from the groundwater regime for
use.
5.4.4 Monitoring Spray Irrigation of Sewage Treatment Plant Effluent at Vernon, B.C.
Prior to the beginning of the Okanagan Basin Study, the City of Vernon had
elected to initiate a pilot spray irrigation project in an attempt to find and
acceptable solution for the disposal of its treated waste effluent. Vernon
currently (1973) discharges its treated wastewater into Vernon Creek which flows
into the Vernon Arm of Okanagan Lake. The high nutrient input associated

with this discharge has resulted in problems of weed and algal growth. The pilot
project involved the irrigation of 75 acres of alfalfa and a tract of native
hillside located southeast of Vernon. The area is on a high slightly sloping
tract of land, has well drained sandy to silty loam soil and was considered ideal
for this type of wastewater disposal.
Based on the recommendations arising out of the report on advanced wastewater
treatment methods, the monitoring of this project was undertaken by the Study. It
was considered complementary to the lysimeter study discussed in 5.5.3, and
provided comparative results under actual field conditions. Monitoring of the
project was carried out over the two irrigation seasons of 1971 (June 21 to
October 26) and 1972 (May 4 to October 25). The irrigation rate for the alfalfa
crop was 3.2 inches of water every ten days, however because of shut down periods
for harvesting, pump repairs, etc., the average application rate over the entire
irrigation season was somewhat less.
To provide the necessary data for calculating a nutrient budget, analyses. of
samples were carried out on the liquid being applied to field, the excess water
not used by the crops (leachate), and the crops themselves. Analyses of the
applied liquid and the crops were carried out in the same manner as for the
lysimeter study. To monitor the excess water or leachate, small wells (well
points) were installed around the lower periphery of the irrigated areas, to the
full depth of the soil with the screened bottom of the pipe resting on the
impervious glacial till. Selected shallow wells in the Vernon Creek Valley were
also monitored to ascertain if the excess irrigation water would measurably affect
the quality of groundwater in the Valley. The location of these wells and the
results of the monitoring program are detailed in Figures 5,8 and 5.9.
The long term usefulness of spray irrigation as a means of disposal for
treated wastewater is dependent upon the amount of impurities that are leached
through the soil and upon the change or build-up of nutrient levels and other
impurities in the soil. The former is important for estimating the potential
pollution of groundwater, while the latter may affect the health of the crops
being grown, and their usefulness after harvest.
The results shown in Figure 5.9 indicate only 6% of the nitrogen applied, and
0.3% of the phosphorus are being leached through the soil column to the
groundwater table. The percentage losses on native grass hillsides are about the
same, but can be expected to increase substantially as slope water wells did not
provide any conclusive results on the effect of leachate water on the downslope
groundwater, due in part to the small quantity of leachate from the irrigation
site. A comparison of concentrations in the leachate from the irrigation site and
the downslope groundwater did indicate the only nutrient with a significantly
higher concentration in the irrigation leachate is one of the nitrogen forms -
kjeldahl nitrogen (Table 5.17). From this it may be

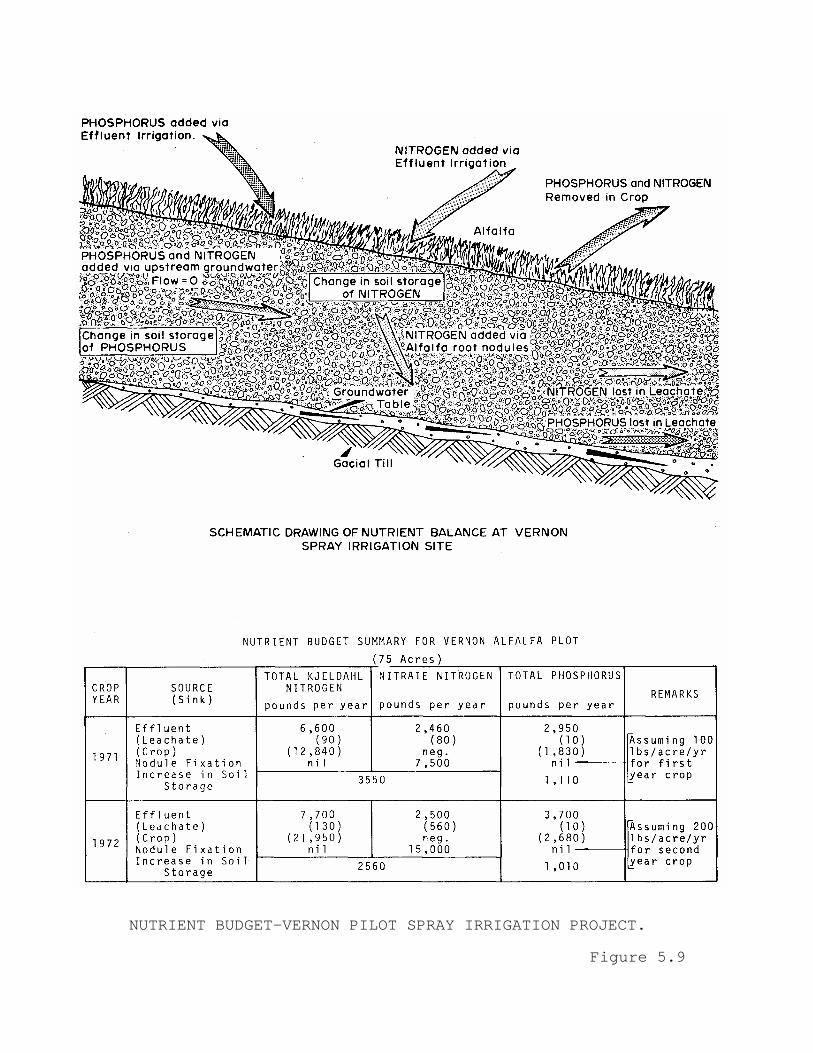
NUTRIENT BUDGET-VERNON PILOT SPRAY IRRIGATION PROJECT.
Figure 5.9

TABLE 5.17
COMPARISON OF NUTRIENT CONTENT OF IRRIGATION
LEACHATE WATER AND DOWNSLOPE GROUNDWATER
IN PARTS PER MILLION
assumed that pollution of the groundwater in the area will not occur unless
a substantial imbalance of nutrients applied versus nutrients harvested
occurs.
Soil storage of both nitrogen and phosphorus increased over the two year
study period, although at a slow rate when considered on a per acre basis.
This build-up of nutrients was due in part to irrigating the area after the
growing season was over. For an irrigation season of six months, the annual
phosphorus buildup in the soil was calculated at 13 pounder per acre, or about
25% of that applied in the effluent. The percentage of buildup of nitrogen is
considered to be about the same (25% of nitrogen applied), but was difficult
to estimate accurately because of the ability of alfalfa root nodules to fix
their own nitrogen. No precise estimate of the useful life of the Vernon soil
type can be made from the two years of testing, but experience elsewhere over
a fourteen year period has indicated no detrimental deterioration of similar
soils and crops sprayed with secondary effluent.
The alfalfa crop grown with secondary effluent was found to be more than
satisfactory from a nutritional point of view, and tests for coliform survival
in the hay indicated these to be very low within three weeks of baling
provided the moisture content of the cut alfalfa was not too high.

5.4.5 Phosphorus Removal by Chemical Treatment at Kelowna
The purpose of this study was to evaluate the chemical process for the
removal of phosphorus, in which lime or alum is added to the sewage prior to
treatment, in terms of its applicability to the existing Kelowna sewage treat-
ment plant facilities. This type of treatment was investigated because of its
economic attractiveness compared to other methods of phosphorus removal.
A pilot scale facility was set up at the Kelowna Pollution Control Centre
to enable a controlled investigation of this form of treatment without dis-
rupting the normal day to day operation of the Kelowna Plant. The study it-
self consisted of the operation of a constant flow primary treatment plant
with lime additions, storage of the organic and chemical sludge produced in
the pilot treatment unit, and the intermittent disposal of this sludge in the
full scale incineration system. Raw sewage from the main plant was used in
all tests. Operational data were gathered over the five month period of May
to October 1972.
The results of adding lime during primary treatment are presented graphi-
cally in Figure 5.10, and show the addition of lime to raw sewage to be
effective in removing phosphorus, especially that portion in the soluble form.
For example a lime dosage of 250 milligrams per liter resulted in a pH of 10.5
and reduced the total phosphorus concentration from 8.3 to 2.5 milligrams per
liter. This dissolved phosphorus for the same dosage was reduced from 5.5
milligrams per liter to 0.4 milligrams per liter.
LIME DOSAGE,pH,and PHOSPHORUS REMOVAL RELATIONSHIPS
Figure 5.10

The second part of the test operation involved the disposal of the lime
sludge in the full scale dewatering and incineration system of the Kelowna
Treatment Plant to determine the operational characteristics of the lime sludge.
During the initial run it became apparent that special precautions would have to
be taken to prevent excessive drying of the lime sludge and the attendant
possibility of binding and plugging the centrifuge.
These precautions included diluting the lime sludge prior to dewatering to
reduce the solids content to between 5% and 8%, and adjusting the centrifuge feed
rate during the dewatering process to compensate for a dewatered sludge being
either too wet or too dry.
The quantity of phosphorus that can be said to be completely removed from the
system is that contained in the settled portion of the incinerator ash. For the
test runs this varied from 37% to 80% of the phosphorus initially present in the
lime sludge feed. This indicates that phosphorus removal is dependent on the
efficiency of the sludge disposal portion of the plant and greater efficiency
with respect to particulate removal would result in better phosphorus removal.
One of the problems encountered in this lime treatment process was the
accumulation of calcium carbonate in surfaces throughout the pilot facility. This
scaling problem could be detrimental to certain parts of the main plant including
sewage lift pumps, piping, and trickling filters, and suitable precautions would
be required to counteract this effect.
A broad comparison of this type of treatment (pre-recipitation) to that of
tertiary treatment (post-precipitation as constructed at Penticton) is as
fol1ows:
(i) Pre-Precipitation
- Less capital investment required to convert an existing treatment facility.
Post-precipitation requires a duplication of facilities, i.e., additional
clarifiers; pre-precipitation utilizes the existing primary facilities.
- Less chemical costs. The amount of lime required to remove phosphorus
generally increases exponentially with decreasing phosphorus residual. With pre-
precipitation, the activated sludge system can be depended upon to remove a
further 1 to 1.5 milligrams per liter of phosphorus and thus as established by
this study a final effluent phosphorus concentration of between 1 and 1.5
milligrams per liter could be obtained with a lime dosage of 250 milligrams per
liter. Tertiary treatment would probably require a greater lime dose, perhaps
350-450 milligrams per liter, to effect a similar overall removal.
- The removal of organics in the primary stage of treatment is enhanced, thus
effectively increasing the capacity of the secondary system. No such advantage
is possible with tertiary treatment.

- Less sludge is produced because of the smaller quantity of lime used to
remove an equivalent amount of phosphorus.
(ii) Tertiary Treatment
- No chance of upsetting the secondary treatment system. Black (4) reports
that pH levels above 9.5 - 10.0 prior to the activated sludge process may result
in biological upset with a downgrading of the degree of treatment with respect to
biological oxygen demand (B.O.D.) and suspended solids(S.S.).
- Sludge disposal can be kept separate from that used for the normal primary
and secondary sludges if desired.
5.4.6 Nutrient Contributions from Septic Tanks
Over 50 % of the population in the Okanagan Valley are serviced by septic
tank installations (1972) which contribute to the nutrient loadings of the
surface waters of the basin. A septic tank is a simple form of waste treatment
unit which primarily conditions sewage for disposal through a field of drain
tiles into the ground. Transport of these nutrients involves a downward
movement through unsaturated soils to the water table, and then horizontal
movement with the groundwater to a surface water course.
To estimate the influence of this nutrient source on the basin, studies were
carried out; to determine the relative density of septic tanks throughout the
basin; to assess the parameters that affect the vertical movement of nutrients
through unsaturated soil; and to estimate the nutrient loadings that actually
reach the main valley lakes and tributary streams. To estimate the nutrient
contribution from septic tanks, a test facility was constructed at the site of
the Vernon sewage treatment plant, utilizing three different soil types typical
of conditions in areas of the Valley where large numbers of septic tanks have
been installed. A separate study was alos carried out by the Province of British
Columbia on the suitability of soils in the Wood-Kalamalka Lake sub-basin for
septic tanks and available results of this work have also been considered in
estimating the nutrient contribution from septic tank sources.
An enumeration of the number and location of 'equivalent single family
units' that are serviced by septic tanks in the valley has provided the infor-
mation shown in Figure 5.11 and Table 5.18. An 'equivalent single family unit'
is defined as that concentration of activity that produces the same annual
nutrient loading to a soil as a single family residence. This method was
employed to allow the inclusion of apartment blocks, motels, and campsites, etc.
The total population figures shown in Table 5.18 include the equivalent average
annual tourist population that contributes to septic tank discharges,


TABLE 5.18
HIGH DENSITY AREAS SERVICE BY SEPTIC TANK INSTALLATIONS
TABLE 5.19
FRACTION OF NUTRIENT LOADINGS APPEARING IN LEACHATE FROM SOIL COLUMNS

and the sewered areas of Rutland and Osoyoos because ground disposal of effluent
is practices in both cases. The figures do not include houses and septic tank
units in the outlying areas of the basin where population is sparse and the
distances to ground water or surface water are great.
The test facility constructed at Vernon indicated the two most important
factors affecting the vertical movement of nutrients through unsaturated soil
were soil type and depth to groundwater. Measurement of the nutrients from
septic tank effluent passing through a four foot soil column for three different
soil types provided the data shown in Table 5.19.
All of the factors shown in Table 5.19 are based on the more or less steady
state conditions that were evident after six months of testing. The results
indicate that the Summerland sand had exhausted its adsorptive capacity within
three to four months (i.e. through 4 feet of soil depth) and that most of the
nutrients were passing through the soil column to the groundwater table. The
Kelowna loamy sand also showed a partial breakthrough of phosphorus after about
four months at a depth of two and a half feet, while the leachate from the finer
silty loam had no appreciable concentration of phosphorus in it after the five
months of testing. The question of how long each of the soils would continue to
absorb nutrients is difficult to answer although it is obvious the finer soils
were fairly effective over the duration of the test period, while the medium and
course soils were not. It is also interesting to note that the majority of
septic tanks in the valley are located in coarse or intermediate soil areas, and
in the shallow or medium depth to groundwater areas.
Results of the more detailed studies on the Wood-Kalamalka Lake sub-basin
by the Province of British Columbia support these findings. Most soils in this
sub-basin are considered to have only limited suitability for the subsurface
disposal of septic tank effluent because of high water tables, proximity to
surface waters, imperivous layers, coarse textured subsoils, steep slopes, and
seepage water. Based on a classification of the suitability of various soils in
this sub-basin for septic tank effluent, only two areas, one at Enderby, and one
at Hulcar near Armstrong, met Class 1 standards. Class 1 standards include a
depth of greater than 6 feet to the water table and/or impermeable layer, a
ground slope of 0 to 5% for single dwellings, a distance of greater than 200
feet to surface water and a soil type consisting of silt loam, clay loam, sandy
loam, fine sand or clay.
Selection of coarse soils for septic tank installations has historically
been recommended to avoid potential health problems, although the results of
this study show that such soils are much less desirable than fine soils when the
problem of nutrient transport is considered. Further, because most of the
population and development is located in the main valley near surface waters,
the depth to groundwater is not great.

Based on the above studies and those of the Province in the Mood-
Kalamalka Lake area estimates were made of the total amount of nutrients
reaching the groundwater table. To determine the amount of nutrients actually
reaching surface waters via groundwater, these assumptions were made:
(i) 100% of all nutrients that reach groundwater within 500 feet of a surface water course will find their way to the surface water;
(ii) 70% of nitrate N that reaches groundwater farther than 500 feet from a surface water course will find its way to that water course; and
(iii) 30% of the other nutrient forms that reach groundwater farther than 500 feet from a surface water course will find their way to that water course.
These assumptions make the results approximate at best, but relatively
accurate estimates would have required detailed and expensive studies of the
groundwater regime which were not possible within the time limits and resource
of this study.
The estimated amount of nutrients reaching surface waters from septic
tank sources via groundwater are 25,000 pounds of phosphorus per year and
275,000 pounds of nitrogen per year. While these estimates may be in error by
as much as 50%, much more intensive and costly surveys would be required to
improve the accuracy of these results.
While septic tank loadings may be small in comparison to municipal
loadings, they will have a significant effect on the quality of local waters
adjacent to septic tank effluent sources, and consequently may affect adjacent
recreational beach areas.
One of the other parameters measured in these septic tank studies was
coliform and the efficiency of the three soil types in removing conform organ-
isms. The application liquid had an average total coliform count greater than
2,400,000 bacteria per 100 milliliters, and a fecal coliform count in excess
of 1,000,000 per 100 milliliters. Efficiencies of the three selected soil
types in removing coliform organisms fluctuated from day to day, but the fol-
lowing more important long term trends were established:
(i) The removal efficiences of both total and fecal coliforms is in excess of 99.7% for all three soil types;
(ii) The finer textured soil in lysimeter #3 is consistently better than the coarser soils in its ability to remove coliforms; and
(iii) The trends in all four lysimeters is toward an increase in leachate coliforms content with lime.

In summary these studies indicate that most soils in the valley have limited
suitability for removing nutrient loadings from high density septic tank areas,
because of their coarse nature and the shallow depth to groundwater. While these
conditions could be improved by more stringent regulations and installation
techniques, existing statutes do not provide for the control of these installations
in respect to nutrient loadings to surface waters.
5.4.7 Nutrient Contributions from Refuse Disposal Sites
The final study of a pilot nature involved refuse disposal sites (garbage
dumps). The purpose of this investigation was to characterize the potential of a
representative site, which had been used for some years, as a source of groundwater
contamination, and to estimate the nutrient input to groundwater from this source.
The study included both a laboratory scale landfill leaching experiment which was
conducted at the Vernon Sewage Treatment Plant, and an onsite investigation of an old
disposal site about one half mile north east of the City of Vernon, which had been
operated as a burning dump over a period of 75 years.
(a) Refuse Disposal Site
The on-site investigation involved the monitoring of two existing down-slope
wells, two well points installed immediately above the site and two well points
directly below the site. (Figure 5.12). Monitoring commenced in July 1971 and
continued on a once a month sampling schedule to October 1972. The existing well
immediately downslope of the disposal site (Ogasawara Well) was selected to reflect
any changes in groundwater quality due to contamination from the disposal site. The
Geistlinger well located 3,500 feet north of the site was selected to indicate the
natural quality conditions of the area for comparison purposes.
The average concentrations recorded over the monitoring period are also shown in
Figure 5.11. During the winter of 1971-72, 95 inches of snow, or twice the annual
average of 48 inches fell in the Vernon Area, and early snow-cover prevented the
ground from freezing. This had the effect of allowing a greater than normal
proportion of spring melt to infiltrate the ground rather than to run off the
surface. This was evident at the disposal site where there was very little surface
runoff in the area during the spring thaw. Water levels rose in all wells with the
exception of wellpoint D in which there was never any water. Nitrate was found to be
the dominant form of nitrogen with average concentrations varying from a low of 1.2
milligrams per liter in Wellpoint A to a high of 63 milligrams per liter (parts per
million) in Wellpoint C. The average concentrations of phosphorus ranged from .024
milligrams per liter in the Ogasawara Well to 0.61 milligrams per liter in Wellpoint
A. Concentrations of various water quality parameters in the Ogasawara Well (1)
remained fairly constant throughout the monitoring period, and the quality of the
last sample taken from Well point C corresponds closely to that occurring year round
in the Ogasawara Well.

MONITORING RESULTS FOR THE VERNON REFUSE DISPOSAL SITE
Figure 5.12

Some contamination of groundwater by the refuse disposal site did occur
in the spring of the study period when groundwater levels were at their
highest. This contamination was most likely caused by the intrusion of
groundwater into a portion of the bottom of the dump rather than by surface
water percolating through the fill. The nutrient input from this occurrence
was all in the form of nitrate nitrogen and was estimated at 4,900 pounds. No
phosphorus contamination was recorded. The quality of water in the existing
domestic well 6,000 feet downslope of the dump site was only minimally
affected by this contamination.
(b) Column Leaching Experiment
Eight leaching columns were set up at the Vernon Sewage treatment plant
to simulate refuse disposal site conditions, and ascertain quality and
quantity characteristics of water percolating through refuse material. Eight
inch clear tubing was used under the experimental conditions shown in Table
5.20.
TABLE 5.20
EXPERIMENTAL CONDITIONS FOR LEACHING COLUMNS

The fill from the refuse disposal site was a composite excavated from
three locations to a depth of six feet. It was considered to be
representative of a fairly homogeneous mixture of ash and decomposed refuse
and did not contain any fresh refuse. Large material was screened out, with
rocks and large pieces of metal being discarded, and tins and bottles were
broken up and returned to the composite. The fresh refuse was composited
based on reference material on the makeup of such composites. The results of
this column leaching experiment are summarized in Table 5.21.
TABLE 5.21
DATA RESULTS FROM LEACHING EXPERIMENTS
No leachate was collected from the columns exposed to the atmosphere (V
and VI) over the period of the study during which these columns received
approximately 15 inches of natural precipitation. Leaching from Column I
began after the application of 3.5 inches of water; from Column II after 6
inches, from Column III after 16 inches and from Column VIII after 9.5 inches.
The leachate from Column VII was added to Column VIII to provide a greater
column depth test.
These tests indicate that no leaching of pollutants from refuse disposal
sites occurs from the percolation of rain water through the dump material.
Since garbage dumps and sanitary land fills in the Okanagan Valley are all
subject to about the same or less precipitation than the Vernon area, it is
concluded that the potential input of nutrients and other contaminants from
refuse disposal sites to groundwater, and hence to surface waters, is
negligible. The tests also showed that water percolating through fresh
refuse had higher concentrations of organic carbon, total nitrogen, total
phosphorus and dissolved heavy metals than did water percolating through an
equal depth of decomposed refuse material.