Embed Size (px)
Citation preview
The Role of Terrestrial Vegetation in the Global Carbon Cycle:Measurement by Remote SensingEdited by G. M. Woodwell
@ 1984 SCOPE. Published by John Wiley & Sons Ltd
CHAPTER 5
Remote Sensing to Measure the Distributionand Structure of VegetationR. M. HOFFER
Department of Forestry and Natural Resources, Purdue University,West Lafayette, Indiana, USA
ABSTRACT
Three types of primarily aircraft-based remote sensing systems are described withreference to global vegetation monitoring. The advantages, constraints and analysis ofaerial photography, multispectral scanning systems, including LANDSAT, and radarsystems are discussed. Each system provides information not obtainable from the others.Used in combination under clearly defined conditions, these systems can be applied toassess distribution and structural characteristics of the global vegetation.
5.1 INTRODUCTION
A substantial amount of study of various remote sensing systems during thepast decade has shown that no single data collection platform (satellite oraircraft), remote sensing instrument system (camera, scanner or radar), oranalysis technique (computer-aided analysis or manual interpretation) isadequate to meet all of the needs of various users. It appears that use ofcombinations of instrument systems, data collection platforms and analysistechniques will meet most needs, especially when these techniques are coupledwith ancillary data. It is the purpose of this paper to examine some of thecharacteristics of the various instruments and techniques available formeasuring the distribution and structure of the world's vegetation.
5.2 AERIAL PHOTOGRAPHY
5.2.1 Introduction
Aerial photographs have been used for many years to identify and mapvegetation,to measure their area and to characterizeform,sizeand condition
131
132 The role of terrestrial vegetation in the global carbon cycle
of plants and plant communities. Four typesof film are commonly used; blackand white panchromatic, black and white infra-red, colour, and colour infra-red.
5.2.2 Black andWhite Films
Black and white panchromatic is the most commonly used film for aerialphotography. There are many types of panchromatic film, each having its ownemulsion characteristics, but as a group, panchromatic films have the bestresolution of any of the film types. High resolution makes it particularly usefulfor such measurements as heights of trees or diameters of crowns.
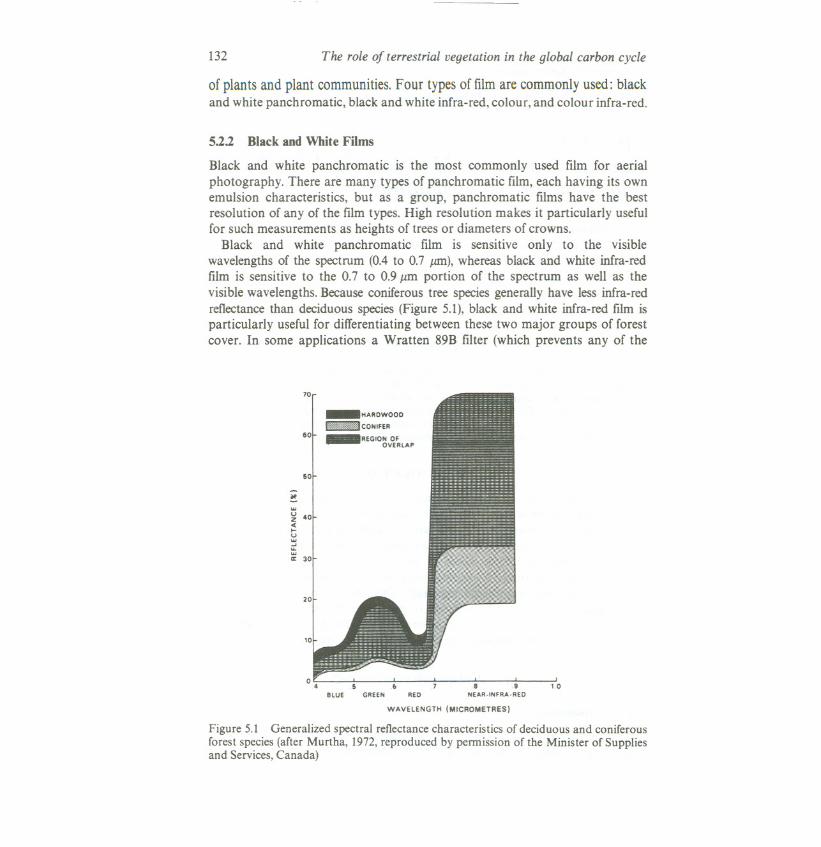
Black and white panchromatic film is sensitive only to the visiblewavelengths of the spectrum (0.4 to 0.7 JlID),whereas black and white infra-redfilm is sensitive to the 0.7 to 0.9 pm portion of the spectrum as well as thevisible wavelengths. Because coniferous tree species generally have less infra-redreflectance than deciduous species (Figure 5.1), black and white infra-red film isparticularly useful for differentiating between these two major groups of forestcover. In some applications a Wratten 89B filter (which prevents any of the
70
20
BLUE REO.B .9
NEAR-INFRA-REO1.0
_HARDWOOD
E!!!!DJ CONIFER
60~ _REGIO~V~~LAP
50
~w
~ .0«...uw
~II: 30
WAVELENGTH (MICROMETRES)
Figure 5.1 Generalized spectral reflectance characteristics of deciduous and coniferousforest species (after Murtha, 1972, reproduced by permission of the Minister of Suppliesand Services, Canada)
Remote sensing to measure vegetation 133
visible wavelengths from reaching the film) is used, to provide contrastbetween deciduous and confierous forests. In other cases a Wratten 25 (red)filter is preferred, so that the film is sensitized by both the red visible andreflective infra-red wavelengths. The result is a photograph with less contrast.Such 'modified black and white infra-red' photos are commonly used by the USForest Service.Because the resolution of black and white infra-red film is not asgood as that of panchromatic, the latter film is preferred for mensurationalpurposes.
Since black and white infra-red film is sensitive to the visible as well as to the
infra-red wavelengths, it is the film used for multiband photography. Aconsiderable amount of research was conducted in the late 1960s usingmultiband cameras, most of which had four lenses, but some of which had asmany as nine (Lowe et aI., 1964; Yost and Wenderoth, 1967; Colwell, 1968;Lauer, 1971; Reeves, 1975). Different filters on each lens allow only certainwavelengths to impinge on the film. Through the use of a special viewingdevice and appropriate filters, it is possible to combine images from the blue,green and red visible wavelengths, for example, to create a standard colourimage of the scene; or the green, red and reflective infra-red wavelength bandscan be combined to create a 'colour infra-red' image. Other combinations canalso be defined to enhance a particular feature of interest. Although thesemethods provide a relatively inexpensive research tool, they have seldom beenused on an operational basis.
5.2.3 ColourFilms
Black and white photos are generally not as useful as colour or colour infra-redphotos for identifying individual species of trees, shrubs, grasses and forbs.This is not surprising, since the human eye can distinguish far more hues andtones of colour than it can distinguish shades of grey (Heller, 1970). Colourfilms have three emulsion layers that are sensitive to the blue, green and redvisible wavelength portions of the spectrum. Some colour films, such asKodachrome and Ektachrome, are colour reversal films that are developedinto a positive emulsion (or transparency) suitable for direct viewing. Othercolour films, such as Kodacolor and Ektacolor, produce a film negative fromwhich positive prints are made. The resolution of such prints is not as good asthat of the transparencies, but prints are easier to use in the field. There is alsoa colour film called Aero-neg, which can be developed into either a positive ornegative emulsion. Developed as a negative, this film can then produce positiveprints, transparencies or diapositive plates in either black and white or colour(Smith,1968).
134 The role of terrestrial vegetation in the global carbon cycle
5.2.4 ColourInfraredFilm
Colour infra-red film (i.e., Kodak Aerochrome Infrared Film, Type 2443) hasbeen tested and used extensively for mapping vegetation and assessing itscondition. Because the film is sensitive to wavelengths to which our eyes arenot sensitive, it is more difficult to interpret than regular colour film. Colourinfra-red is similar to regular colour film, however, in that both types havethree emulsion layers. The main difference is that the three emulsion layers ofproperly filtered infra-red film are sensitive to the green, red and reflectiveinfra-red wavelengths. Since all three emulsion layers of colour infra-red are alsosensitive to the blue wavelength portion of the spectrum, it is used with a yellow(or 'minus-blue') filter (usually a Wratten 12 or Wratten 15) to obtain a goodimage. Thus, regular colour film has a sensitivity range of about 0.4 to 0.7 pmwhereas properly filtered colour infra-red film is sensitized to wavelengthsbetween 0.5 and 0.9 pm (Kodak, 1976).
It should be pointed out that photographic films used in remote sensing arelimited to the ultraviolet, visible and reflective infra-red wavelengths up to0.9 pm. The thermal infra-red portion of the spectrum, however, extends fromapproximately 3 to 14 pm. Hence, colour infra-redfilm is not sensitive to thethermal infra-red portion of the spectrum, and cannot be used to detect thermalphenomena, such as heated water discharged from hydroelectric plants intorivers or lakes, or heat loss from buildings (Fritz, 1967). Thermal infra-redscanner systems must be used to detect energy in the thermal infra-red portionof the spectrum.
One of the major advantages of colour infra-red film is its ability to enhancesubtle differences in reflectance that are barely discernible in the visiblewavelengths (Reeves, 1975). Frequently, spectral differences due to variationsin plant species or to stress conditions will exist but will be so subtle that theyare difficult to see on regular colour film. Although spectral differences may bevery small in the visible wavelengths, they may be very distinct in the nearinfra-red wavelengths and therefore will show up clearly on colour infra-redfilm. Examination by the author of a large number of colour infra-red photosand corresponding colour photos obtained at the same time, and a carefulreview of the literature indicate that there are relatively few cases in whichspectral differences in vegetation, soils or water that are visible on colourinfra-red film cannot be detected on properly exposed colour film. However,there are many cases where the spectral differences are so subtle that theywould be missed if the photo interpreter relied only on regular colour film.
A second major advantage of colour infra-red film is its ability to penetrateatmospheric haze better than normal colour film. This is because atmosphericscattering of light is more pronounced in the shorter wavelengths, and theyellow filter normally used with colour infrared film prevents these stronglyscattered blue wavelengths from reaching the film.
Remote sensing to measure vegetation 135
5.2.5 Interpretationof Colourand Colour Infra-redFilms
Whereas the cyan emulsion layer of colour infra-red film is sensitive to the 0.7to 0.9 /lm reflective infra-red wavelengths, the other two emulsion layers aresensitive to the visible wavelength portion of the spectrum (green and red).This implies that spectral variations in either the visible or the reflectiveinfra-red wavelengths, or a combination of both, will cause colour differenceson colour infra-red film. Thus, even though different objects have differentcolours on colour infra-red film, it does not necessarily follow that a differencein infra-red reflectance is present. The difference in colour may be caused solelyby differences in reflectance in the visible wavelengths. Frequently, however,differences in colour on the colour infra-red film are caused by spectralvariations in both the visible and infra-red wavelengths. This makes colourinfra-red film difficult to interpret unless something is known about the spectralcharacteristics of the material of interest, both in the visible and infra-redwavelengths.
A considerable amount of research has been conducted into the usefulness ofcolour and colour infra-red films for mapping vegetative types and conditions.Distinguishing between deciduous and coniferous trees can be done veryeffectivelywith colour infra-red film, since the higher near infra-red reflectanceof the deciduous species cause them to have a much brighter red appearancethan the conifers. Determining the amount of vegetative cover present in anarea is also much easier with colour infra-red film, which enhances theappearance of vegetation against a soil background. Colour film is muchbetter than black and white panchromatic film for identifying individualspecies of trees (Heller et aI., 1966)and colour infra-red has been shown to bemore effective than colour film for identifying a variety of grasses, forbs andshrubs (Driscoll and Coleman, 1974). The effectiveness of colour or colourinfra-red film for differentiating species is often dependent on the phenology ofthe vegetation as well as the scale and quality of the photos used. Because ofthe increased information content and interpretability of colour and colourinfra-red films, efficiency of interpretation is increased significantly (Lauer,1971). In one study, the time required to classify 50000 acres offorest land wascut from 44 to 21 hours through the use of small-scale colour infra-red filmrather than black and white panchromatic (Lauer and Benson, 1973). Theadvantages of regular colour film have led the US Forest Service to adopt1:15840 colour photography for National Forest mapping activities.
When plants are affected by stress, such as that caused by disease or insectdamage, changes occur in the spectral reflectance characteristics of the foliage.Colwell (1956) reported previsual detection of wheat rust using colour infra-redfilm, provided the photos were obtained under certain conditions ofdevelopment of the disease, illumination and film exposure. Manzer andCooper(1967)showedthat colour infra-redfilmcanbe an effectivetool for
136 The role of terrestrial vegetation in the global carbon cycle
detecting late blight in potatoes. There have been many other studiesconcerning the use of colour infra-red film, as well as other film types andremote sensing systems, to detect stress (Colwell, 1960; Heller, 1971; Bauer etal., 1971; Murtha, 1972; Reeves, 1975; Aldrich, 1979). The enhancementcapabilities of colour infra-red film clearly make it a very useful tool formonitoring plant diseases and insect infestations. Such conditions cause adifference in tone that makes the stressed vegetation distinguishable from thenormal red tone of healthy surrounding vegetation. However, it would appearthat there are very few well-documented cases of true previsual stress detectionusing colour infra-red film. Aldrich (1979) stated that there was no evidence toindicate that previsual stress could be detected in either coniferous ordeciduous trees.
To assess the state of the art concerning the capabilities of remote sensingfor assessing vegetation damage, a special symposium was sponsored by theAmerican Society of Photogrammetry in 1978, the proceedings of which areavailable from ASP. The theory and use of remote sensing for vegetationdamage assessment are summarized very well in papers by Murtha (1978) andHeller (1978).
5.2.6 Scale of Photography
In addition to the type of film used, the scale of aerial photography affects itsutility for vegetation mapping and monitoring. Most activities involvingremote sensing to map and characterize vegetative cover are concerned withfloristic mapping, physiognomic mapping or stress detection and monitoring.For these purposes, medium to large-scale photos are generally needed toachieve accurate and reliable results. In the United States, foresters havetraditionally utilized a scale of 1:15840 (four inches equals one mile), whileagronomists and soil scientists have preferred 1:20000 scale photos (Colwell,1960). Improved film resolution, cameras and aircraft capabilities now allowsmaller scale photos to be used for some purposes, and 1:40000 is currentlythe standard scale used by USDA in many states for crop surveys and soilsmapping.
The particular scale and the type of film to be used depend on the degree ofmapping detail involved and the accuracy required. For most types ofquantitative measurement, as photo scale decreases so does the accuracy ofmeasurement. For example, 1:15840 is an effective scale for mapping forestcover types, but identification of individual trees by species and measurementsof height and crown diameter to obtain volume estimates require stereophotos that have a much larger scale, such as 1:1000 to 1: 5000 (Heller et aI.,1966; Sayn-Wittgenstein and Aldred, 1967; Avery, 1977; Aldrich, 1979).Crown closure estimates can be obtained from somewhat smaller scale photos,such as 1: 5000 to 1:15000 (Avery, 1977). Rangeland managers require very
Remote sensing to measure vegetation 137
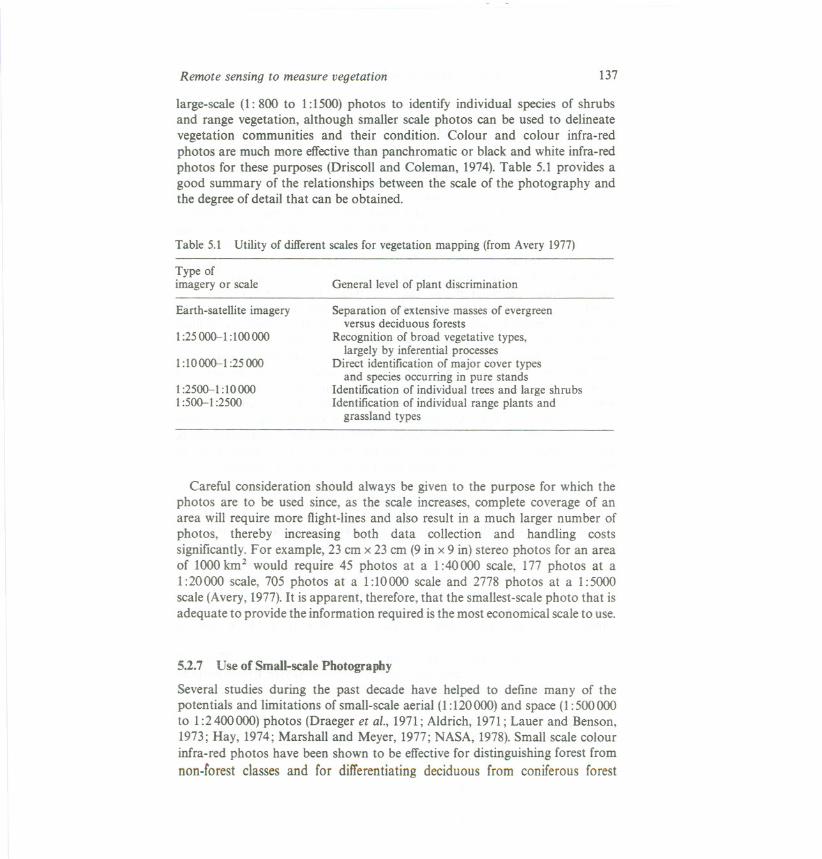
large-scale (1: 800 to 1:15(0) photos to identify individual species of shrubsand range vegetation, although smaller scale photos can be used to delineatevegetation communities and their condition. Colour and colour infra-redphotos are much more effectivethan panchromatic or black and white infra-redphotos for these purposes (Driscoll and Coleman, 1974).Table 5.1 provides agood summary of the relationships between the scale of the photography andthe degree of detail that can be obtained.
Table 5.1 Utility of different scales for vegetation mapping (from Avery 1977)
Type ofimagery or scale General level of plant discrimination
Earth-satellite imagery
1:25000-1 :100000
Separation of extensive masses of evergreenversus deciduous forests
Recognition of broad vegetative types,largely by inferential processes
Direct identification of major cover typesand species occurring in pure stands
Identification of individual trees and large shrubsIdentification of individual range plants and
grassland types
1 :10 000-1 :25 000
1:2500--1 :100001:500--1 :2500
Careful consideration should always be given to the purpose for which thephotos are to be used since, as the scale increases, complete coverage of anarea will require more flight-lines and also result in a much larger number ofphotos, thereby increasing both data collection and handling costssignificantly. For example, 23 em x 23 em (9 in x 9 in) stereo photos for an areaof 1000 km2 would require 45 photos at a 1:40000 scale, 177 photos at a1:20000 scale, 705 photos at a 1:10000 scale and 2778 photos at a 1:5000scale (Avery, 1977).It is apparent, therefore, that the smallest-scale photo that isadequate to provide the information required is the most economical scale to use.
5:1..7 Use of Small-scale Photography
Several studies during the past decade have helped to define many of thepotentials and limitations of small-scale aerial (1:120000) and space (1:500000to 1:2400 000) photos (Draeger et al., 1971; Aldrich, 1971; Lauer and Benson,1973; Hay, 1974; Marshall and Meyer, 1977; NASA, 1978).Small scale colourinfra-red photos have been shown to be effective for distinguishing forest fromnon-forest classes and for differentiating deciduous from coniferous forest
138 The role of terrestrial vegetation in the global carbon cycle
cover.Individualforest cover types (i.e., species associations) generally couldnot be identified directly, but in some cases the boundaries of different covertypes could be delineated, and through comparison with larger scale aerialphotos or existing reference data, the type could be identified. The degree ofdetail that could be defined depended on the season and the characteristics ofthe forest and other vegetative cover types present.
Time of year has been shown to be particularly critical in agriculturalapplications of small scale aerial and space photographs, since crops developrapidly and different species are often at different stages of development at anyparticular time. Most studies of agricultural applications have concluded thatdata are needed at more than one time during the growing season, and thatdates when photos are needed are a function of the crop calendars for thevarious species (Colwell, 1960; Reeves, 1975; Bauer, 1975; NASA, 1978).
When using medium to large scale photos from aircraft altitudes, theinterpreter generally utilizes many (if not all) of the commonly definedprinciples of photo interpretation to identify cover types. These principlesinclude size, shape, tone and colour, texture, shadow, pattern and association(including site). However, when using the very small-scale photos obtainedfrom spacecraft altitudes the interpreter finds himself much more dependent ontone or colour, because such characteristics as shadow and texture or the sizeand shape of individual trees cannot be discerned. Dependence on the colourof various cover types, and the variability of the colour as a function of time ofyear and geographic location, also make the interpreter much more aware ofthe need to be knowledgeable about the spectral reflectance characteristics ofvarious cover types and how such spectral characteristics vary, both as afunction of time and of geographic location.
One of the major advantages of spacecraft data is its synoptic view. Hence,the use of small-scale photos to cover an entire area and to delineate or stratifymajor cover types at a generalized level, in combination with statisticallydefined samples of medium and large-scale photos to identify individual covertypes and their characteristics, seems to be a logical approach to obtainreliable resource information. Such an approach, often referred to as'multistage' or 'multilevel' sampling, allows one to take advantage of thecapabilities of the various scales (Langley et al., 1969; Heller, 1978; Aldrich,1979).
One obvious limitation of photographs obtained in space is the difficulty ofreturning them to earth. Other than the Apo1l0-9 and Skylab EREP projects,there have been relatively few photographic studies of earth resources fromspace. However, these two projects did create a great deal of interest inmapping and monitoring vegetation and other earth resources from space.Thus, the launch of LANDS AT-l and the capability to telemeter this type ofdata received considerable interest from resource managers.
Remote sensing to measure vegetation 139
5.3 MUL TISPECfRAL SCANNER SYSTEMS (MSS)
5.3.1 Introduction
The launching of the LANDSAT-l (originally ERTS-l) Earth ObservationTechnology Satellite in 1972 greatly increased the use of multispectral scannerdata. Prior to 1972, multispectral scanner systems (MSS) had been flown ataircraft altitudes, and the possibility of identifying various features of theearth's surface on the basis of spectral reflectance patterns had been shown(Lowe et al., 1964; Hoffer, 1967). The first MSS capable of obtaining datathroughout the optical portion of the spectrum and recording the data on tapewas developed at the University of Michigan in 1966, and the first single-aperture system became available in 1971 (Hasel, 1972).Early work with MSSdata indicated that the increased range of wavelengths in which data could beobtained offered significant potential, but that manual interpretation of subtledifferences in reflectance or emittance among many different images was notan effective method for analysing such data (Hoffer, 1967). The concept ofapplying pattern recognition techniques to the analysis of multispectralscanner data was then developed and in 1967 it was demonstrated that suchan approach was feasible (Landgrebe and Staff, 1967; Holter et aI., 1970).Sincethat time, many techniques for computer-aided analysis of MSS data havebeen developed.
5.3.2 Multispectral Scanner Systems
Multispectral scanner systems differ from photographic systems in severalways, including the optical-mechanical mechanisms for collecting data, thequantitative character of the data collected, and the range of frequencies towhich the detectors are sensitive.
In multispectral scanner systems the energy reflected or emitted from a smallarea on the earth's surface (the resolution element or instantaneous viewingarea) at a given moment is reflected from a rotating or oscillating mirrorthrough an optical system which disperses the energy spectrally on to an arrayof detectors. The motion of the mirror allows the energy along a scan line(which is perpendicular to the direction of flight) to be measured, while theforward movement of the aircraft or spacecraft brings successive strips ofterrain into view. The detectors, carefully selected for their sensitivity to energyin the various portions of the spectrum, and appropriately filtered,simultaneously measure the energy in the different wavelength bands. Theoutput signal from the detectors is amplified and recorded on magnetic tape.
The quantitative format of MSS data makes it ideally suited for telemeteringto earth and for processing by computer-aided analysis techniques, whereas
140 The role of terrestrial vegetation in the global carbon cycle
photographic data are qualitative in format and best suited for manualinterpretation. The spatial resolution of scanner data (i.e., the instantaneousviewing area on the ground) is a function of both the characteristics of thescanner and its altitude. Since the data from scanner systems generally do nothave spatial resolution as good as can be obtained from photographic systemsat the same altitude, small objects cannot be resolved as well. However, thespectral resolution of MSS systems can be much better (i.e., energy from muchnarrower wavelength bands can be accurately measured). Of perhaps evenmore importance is the fact that scanners can record data throughout the 0.3 to14Jlm wavelength region, but photographic systems cannot effectively recorddata at wavelengths longer than 0.9 Jlm.
5.3.3 SpectralReflectanceCharacteristicsof Vegetation
The data collected by multispectral scanners represent the spectral reflectanceand emittance characteristics of various cover types. It has been determinedthat different cover types reflect and emit varying amounts of energy in a singlespectral band, and that a single object reflects and emits varying amounts ofenergy as a function of wavelength (Gates et al., 1965; Hoffer and Johannsen,1969; Howard, 1971; Sinclair et al., 1971; Hoffer, 1978).Therefore, the properinterpretation of multispectral scanner data or other remote sensor data (suchas colour infra-red film) requires a knowledge of the spectral characteristics ofvegetation, soil, water and other earth surface features.
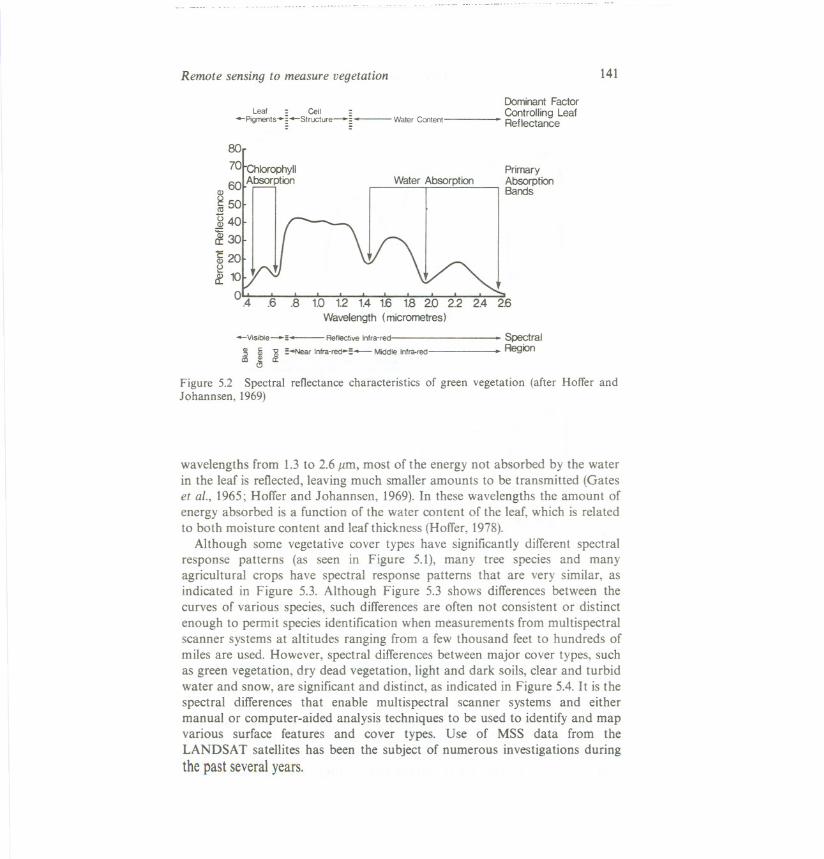
Figure 5.2 is an example of the spectral reflectance characteristics of typicalgreen vegetation. This curve shows the low reflectance due to chlorophyllabsorption bands at approximately 0.45 and 0.65 Jlm in the visiblewavelengths, the typical high reflectance in the 0.72 to 1.3 Jlm (near infra-red)region, and the distinct water absorption bands at approximately 1.45 and1.95Jlm in the middle infra-red wavelengths. Minor water absorption bands arealso evident at about 0.96 and 1.2.urn.
In the visible and reflective infrared portions of the spectrum, the energyincident (f) upon an object that is not reflected (R) by the object must beeither absorbed (A) or transmitted (T) through the object. Thus, for anyparticular wavelength (A):
f).=R).+ A).+ r.
For turgid green vegetation, most of the energy in the visible wavelengths(below about 0.72 Jlm) is absorbed by chlorophyll, with less absorption andhigher reflectance in the green wavelengths (about 0.55 Jlm) between the twochlorophyll absorption bands. Very little energy in the visible wavelengths istransmitted through a leaf, but in the near infra-red wavelengths (from about0.72 to 1.3Jlm) only very small amounts of energy are absorbed, and nearly allenergy not reflected is transmitted through the leaf. In the middle infra-red
Remote sensing to measure vegetation 141
Leaf : Cell :
--Pigments-~-Structure-~- Water Content
Dominant FactorControlling Leaf. Reflectance
8q
7°r-chIorOP~YIIIAbsorptoo60
(J)
~ so.<0 :~40
~301
Water AbsorptionPrimaryAbsorptionBands
.6 .8 to 1.2 1.4 1.6 1.8 2.0 2.2 2.4 26Wavelength (micrometres)
.Spectral.Region-Visible-S- Reflective Infra-red
3 ~ -g=_r Infra-,oo.:- Middle Infra.tedii! <'3 a:
Figure 5.2 Spectral reflectance characteristics of green vegetation (after Hoffer andJohannsen, 1969)
wavelengths from 1.3 to 2.6 /.lm,most of the energy not absorbed by the waterin the leaf is reflected, leaving much smaller amounts to be transmitted (Gateset al., 1965; Hoffer and Johannsen, 1969). In these wavelengths the amount ofenergy absorbed is a function of the water content of the leaf, which is relatedto both moisture content and leaf thickness (Hoffer, 1978).
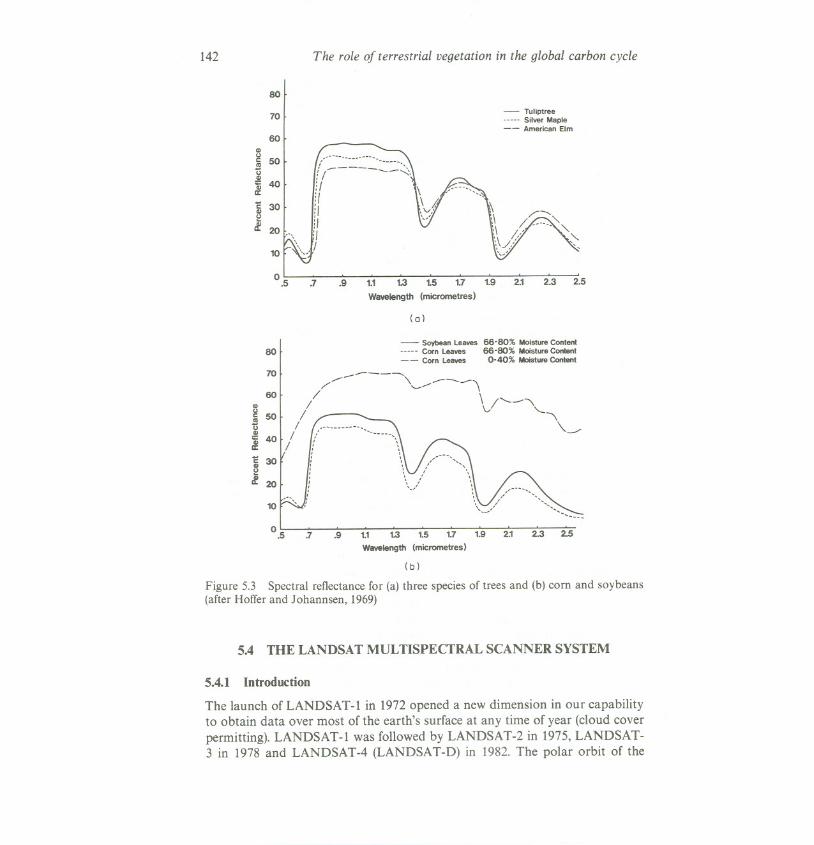
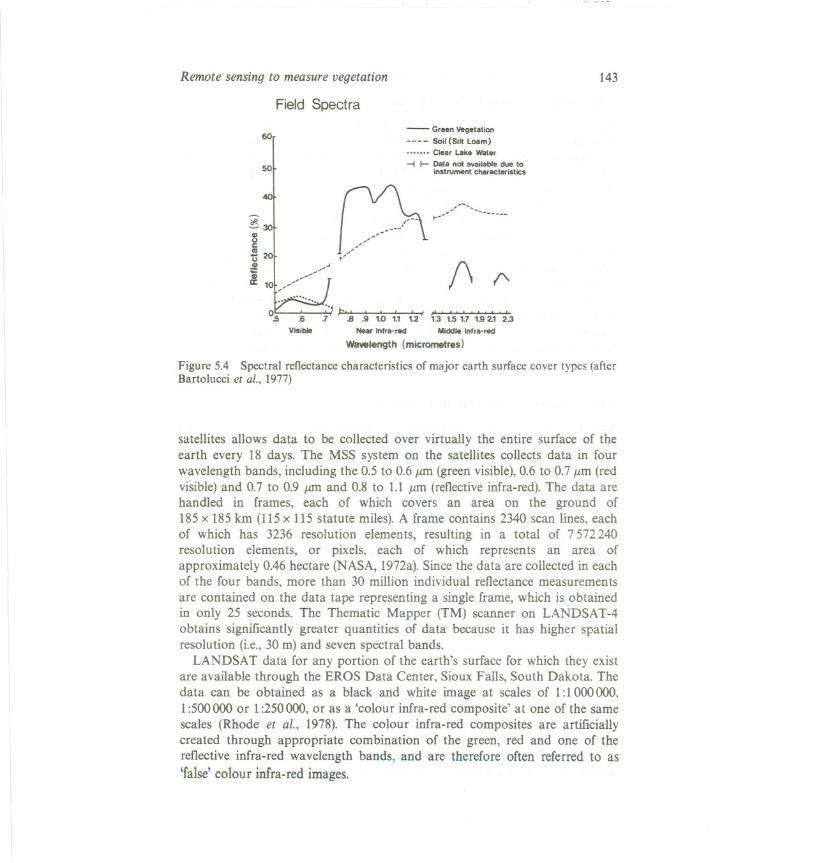
Although some vegetative cover types have significantly different spectralresponse patterns (as seen in Figure 5.1), many tree species and manyagricultural crops have spectral response patterns that are very similar, asindicated in Figure 5.3. Although Figure 5.3 shows differences between thecurves of various species, such differences are often not consistent or distinctenough to permit species identification when measurements from multispectralscanner systems at altitudes ranging from a few thousand feet to hundreds ofmiles are used. However, spectral differences between major cover types, suchas green vegetation, dry dead vegetation, light and dark soils, clear and turbidwater and snow, are significant and distinct, as indicated in Figure 5.4. It is thespectral differences that enable multispectral scanner systems and eithermanual or computer-aided analysis techniques to be used to identify and mapvarious surface features and cover types. Use of MSS data from theLANDSAT satellites has been the subject of numerous investigations duringthe pastseveralyears.
142 The role of terrestrial vegetation in the global carbon cycle
80
70 - Tuliptree-- no Silver Maple-- American Elm
60
(;:'~==~"u_-":/ ~ ::.
~ 30!1 ,. ~
e:l ~& 20 !I ,,/1
".. :1 ',,"
10 ~ ~"'/ /
0.5 .7 .9 1.1 1.3 1.5 1.7 1.9Wavelength (micrometres)
2.1 2.3 2.5
(a)
80- SoybeanLeaves 66-80% MoistureContent--_uCorn Leaves 66-80% MoistureContent- - Corn Leaves 0-40% MoistureContent
70 ---~'\ ,/' ,-/',
60 / \ /' ,
~ / ~ ~~i 50 / ~ \.----~ j' '--
~40/~30e&20
10
0.5 .7 .9 1.1 1.3 1.5 1.7 1.9
Wawlength (micrometres)
2.1 2.3 2.5
(b)
Figure 5.3 Spectral reflectance for (a) three species of trees and (b) corn and soybeans(after Hoffer and Johannsen, 1969)
5.4 THE LANDSAT MULTISPECTRAL SCANNER SYSTEM
5.4.1 Introduction
The launch of LANDSAT-1 in 1972 opened a new dimension in our capabilityto obtain data over most of the earth's surface at any time of year (cloud coverpermitting). LANDSAT-1 was followed by LANDSAT-2 in 1975, LANDSAT-3 in 1978 and LANDSAT-4 (LANDSAT-D) in 1982. The polar orbit of the
Remote sensing to measure vegetation 143
Field Spectra
60- Green vegetation
Soil (Silt Loam)Clear Lake Water
~ I- Data not availabledue toinstrumentcharacteristics50
~ 301
I W
l/,/,-,GI "
a: 10,/
~ ,/-"--------
l/""",fl. ," f\ f'
40
1':2' ':3 1.5 1:7 19 2.1 2.3Visible Near Infra-red Middle Infra-red
Wavelength (micrometres)
Figure 5.4 Spectral reflectance characteristics of major earth surface cover types (afterBartolucci et aI., 1977)
satellites allows data to be collected over virtually the entire surface of theearth every 18 days. The MSS system on the satellites collects data in fourwavelength bands, including the 0.5 to 0.6}lm (green visible), 0.6 to 0.7 }lm (redvisible) and 0.7 to 0.9 J1ffiand 0.8 to 1.1 }lm (reflective infra-red). The data arehandled in frames, each of which covers an area on the ground of185 x 185 km (115 x 115 statute miles). A frame contains 2340 scan lines, eachof which has 3236 resolution elements, resulting in a total of 7572 240resolution elements, or pixels, each of which represents an area ofapproximately 0.46 hectare (NASA, 1972a). Since the data are collected in eachof the four bands, more than 30 million individual reflectance measurementsare contained on the data tape representing a single frame, which is obtainedin only 25 seconds. The Thematic Mapper (TM) scanner on LANDSAT-4obtains significantly greater quantities of data because it has higher spatialresolution (i.e., 30 m) and seven spectral bands.
LANDSAT data for any portion of the earth's surface for which they existare available through the EROS Data Center, Sioux Falls, South Dakota. Thedata can be obtained as a black and white image at scales of 1:1000 000,1:500000 or 1:250000, or as a 'colour infra-red composite' at one of the samescales (Rhode et al., 1978).The colour infra-red composites are artificiallycreated through appropriate combination of the green, red and one of thereflective infra-red wavelength bands, and are therefore often referred to as'false' colour infra-red images.
144 The role of terrestrial vegetation in the global carbon cycle
5.4.2 Interpretation of LANDSAT Data
Manual interpretation of LANDSAT data has been used in many studiesthroughout the world to map various types of vegetation and itscharacteristics (NASA, 1972b, 1973a, 1973b, 1975; Heller, 1975; Aldrich, 1975,1979; Adrien and Baumgardner, 1977; Hooley et al., 1977; Hsu, 1978). Ingeneral, these studies have indicated that the colour infra-red composite at ascale of 1:250000 is most effective. At this scale and in this format, majorcover types--such as deciduous forest, coniferous forest, rangeland,agricultural lands, tundra, areas of exposed soil or rock and water (both clearand turbid)---generally can be delineated and mapped with a reasonabledegree of accuracy. Disturbed forest lands, such as clear-cuts, can also bereliably defined (Lee, 1975; Aldrich, 1975).However, work by Hsu (1978) andthe author with LANDSAT data in Bolivia, Taiwan and Thailand indicatesthat it is difficult to define brushland areas, such as those that develop afterclear-cutting, unless the clear-cut is relatively recent. After that, the spectralresponse from brush land is very similar to the response from jungle canopy.
5.4.3 Computer-Aided Analysis Techniques
Since LANDSAT data are obtained in digital form, and because such a formatis well-suited to quantitative data processing, there has been considerableinterest in applying computer-aided analysis techniques (CAAT) toLANDSAT data.
Two basic types of computer processing techniques can be applied:enhancement and classification. Enhancement techniques are directed atproducing an image which is manually interpreted. This may involveenhancing the spectral characteristics in the data or digitally enlarging thedata to allow more effective interpretation of spatial features (Kourtz andScott, 1978).It may also involve superimposing two sets of data and enhancingthe temporal differences.
Classification generally involves a series of steps including data reformattingand preprocessing, definition of training statistics, computer classification ofthe data, information display and tabulation, and evaluation of the results.These are discussed in more detail below.
5.4.3.1 Data Reformatting and Preprocessing
Data reformatting and preprocessing involves such activities as reformattingscanner clata to place a full frame on a single data tape, digital filtering toimprove data quality (signal-to-noise ratio), geometrically correcting andscaling the data to a common map base, and digital registration of multiple
Remote sensing to measure vegetation 145
sets of scanner and other data. Such procedures do not involve analysis of thedata. They simply allow data analysis to be carried out in a more etTectivemanner.
5.4.3.2 Definition of Training Statistics
Analysis of MSS data involves a series of steps designed to enable thecomputer to identify various cover types or earth surface features. The keyelement is that the computer is 'trained' to recognize the particularcombinations of numbers (the reflectance measurements in each of thewavelength bands) that characterize the cover types of interest. This trainingprocess involves scanner data from a limited geographic area. After a good setof training statistics has been developed, the computer is programmed toclassify the reflectance values for each resolution element in the entire data set.In this way the computer can be used to map and tabulate cover types over alarge geographic area at a much faster rate than is possible by using standardimage interpretation techniques.
One of the major considerations in developing training statistics is thedefinition of the classes of material that the computer should be trained torecognize. There are two conditions which must be met by each class in ananalysis of multispectral scanner data:
(1) The class must be spectrally separable from all other classes.(2) The class must be of interest to the user or have informational value
(HotTer,1976a).
One often finds that the classes of interest to the user cannot be spectrallyseparated at certain times of the year. Quite often, ditTerent species of greenvegetation have very similar spectral characteristics, even though theirmorphological characteristics are quite ditTerent.Because a class must both beseparable and have informational value, two quite ditTerent approaches areused in training the computer system.
The first approach is referred to as the 'supervised technique' and involvesthe use of a system of X-Y coordinates to designate to the computer systemthe locations of known earth surface features that have informational value.For example, a certain X - Y location is designated as a stand of ponderosapine, another as a stand of aspen, and others as grassland, water, etc. Thistechnique has been used quite etTectively for agricultural mapping, butexperience has shown that it is not as reliable for wildland areas, where thecover types of interest are not as spectrally homogeneous. The primary reasonfor this is the difficulty of defining locations that are representative of all thevariations in spectral response for every cover type of interest (HotTer andFleming, 1978).
A second approach is the 'clustering technique' (sometimes referred to as the
146 The role of terrestrial vegetation in the global carbon cycle
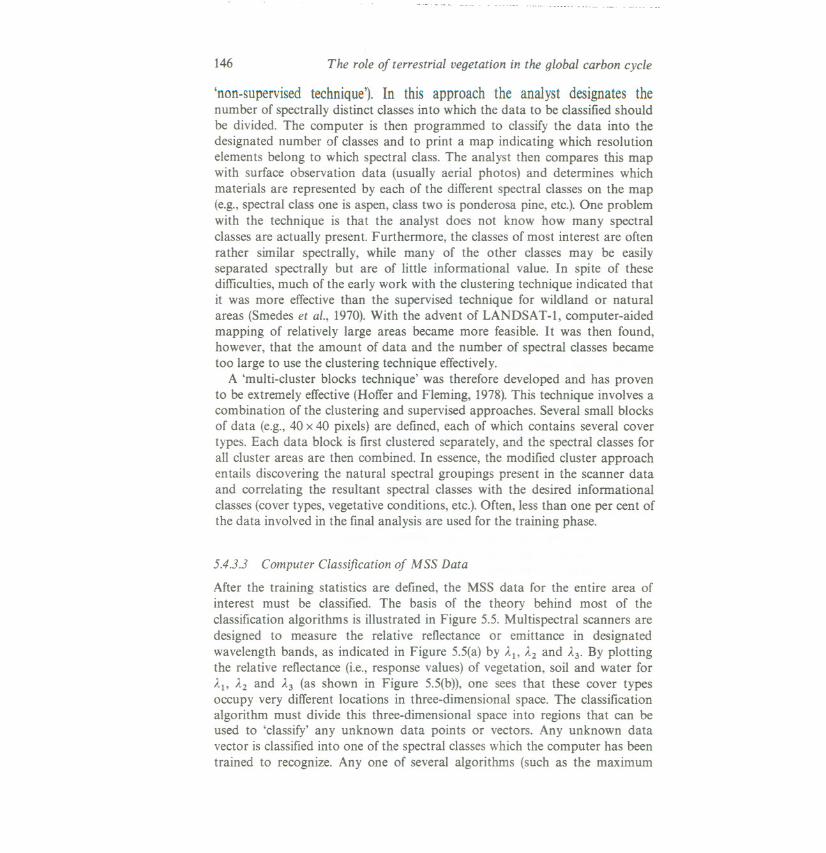
'non-supervised technique'). In this approach the analyst designates thenumber of spectrally distinct classes into which the data to be classified shouldbe divided. The computer is then programmed to classify the data into thedesignated number of classes and to print a map indicating which resolutionelements belong to which spectral class. The analyst then compares this mapwith surface observation data (usually aerial photos) and determines whichmaterials are represented by each of the different spectral classes on the map(e.g.,spectral class one is aspen, class two is ponderosa pine, etc.). One problemwith the technique is that the analyst does not know how many spectralclasses are actually present. Furthermore, the classes of most interest are oftenrather similar spectrally, while many of the other classes may be easilyseparated spectrally but are of little informational value. In spite of thesedifficulties, much of the early work with the clustering technique indicated thatit was more effective than the supervised technique for wildland or naturalareas (Smedes et al., 1970).With the advent of LANDSAT-I, computer-aidedmapping of relatively large areas became more feasible. It was then found,however, that the amount of data and the number of spectral classes becametoo large to use the clustering technique effectively.
A 'multi-cluster blocks technique' was therefore developed and has provento be extremely effective (Hoffer and Fleming, 1978).This technique involves acombination of the clustering and supervised approaches. Several small blocksof data (e.g., 40 x 40 pixels) are defined, each of which contains several covertypes. Each data block is first clustered separately, and the spectral classes forall cluster areas are then combined. In essence, the modified cluster approachentails discovering the natural spectral groupings present in the scanner dataand correlating the resultant spectral classes with the desired informationalclasses (cover types, vegetative conditions, etc.). Often, less than one per cent ofthe data involved in the final analysis are used for the training phase.
5.4.3.3 Computer Classification of MSS Data
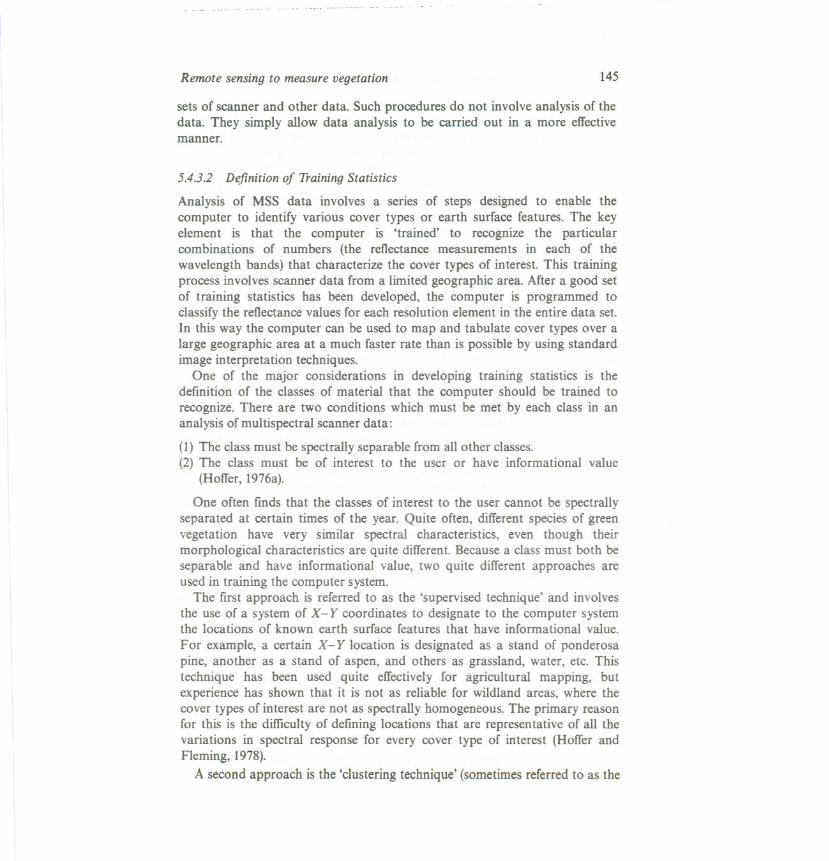
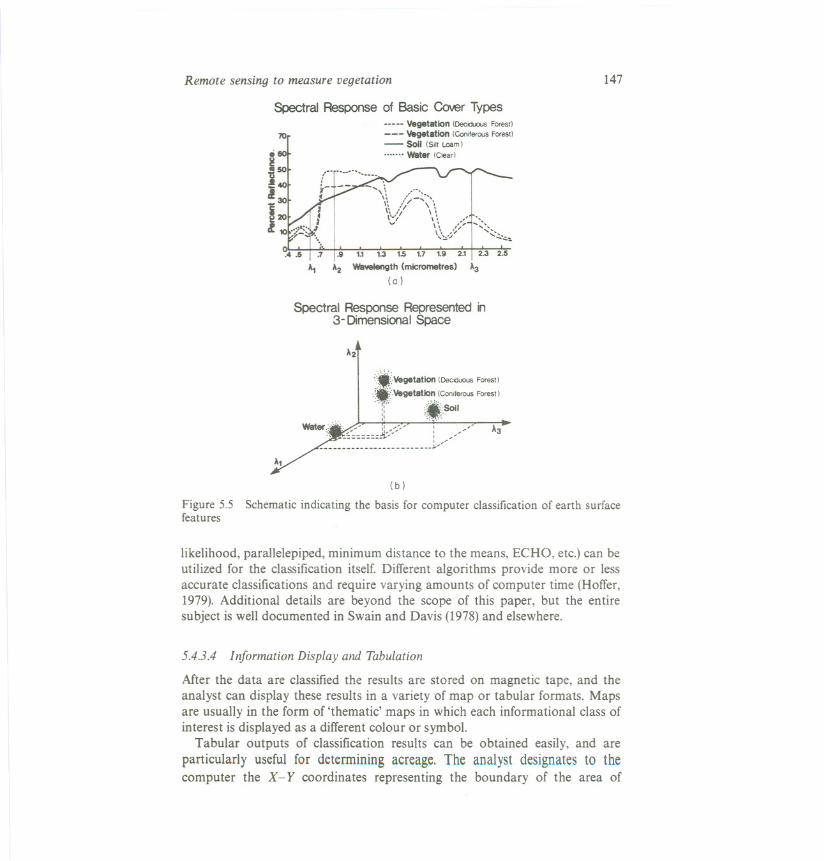
After the training statistics are defined, the MSS data for the entire area ofinterest must be classified. The basis of the theory behind most of theclassification algorithms is illustrated in Figure 5.5. Multispectral scanners aredesigned to measure the relative reflectance or emittance in designatedwavelength bands, as indicated in Figure 5.5(a) by AI' A2 and A3. By plottingthe relative reflectance (i.e., response values) of vegetation, soil and water forAI' A,2and A,3(as shown in Figure 5.5(b», one sees that these cover typesoccupy very different locations in three-dimensional space. The classificationalgorithm must divide this three-dimensional space into regions that can beused to 'classify' any unknown data points or vectors. Any unknown datavector is classified into one of the spectral classes which the computer has beentrained to recognize. Anyone of several algorithms (such as the maximum
Remote sensing to measure vegetation 147
Spectral Response of Basic Cover Typesun- Vegetation (DecidJousForest!--- Vegetation (Coniferous Forest!-Soli (Si~ Loam)
Water (Clear)
70,
,\ "':::':'-'"\\ // '\I. 'I \. '
i"
1\ /1 \ \ ..~ ""~',I> 11\ ..;/ ""':"'.::.~..""""/
:..5 1.7 ,.9 1.1 1.3 1.5 1.7 1.9 2.1 I 2.3 2.5
~ A2 Wawlength (micrometres) A3
(0 )
Spectral Response Represented in3- Dimensional Space
Ai
:,':1;:' Vegetation (Deciduous Forest)
'.~~::,Vegetat~,(Ccnlferous Forest)T '.:5011:: '~.
I /': ,/, /1-'--- -- --------_.-
-'3
(b)
Figure 5.5 Schematic indicating the basis for computer classification of earth surfacefeatures
likelihood, parallelepiped, minimum distance to the means, ECHO, etc.) can beutilized for the classification itself. Different algorithms provide more or lessaccurate classifications and require varying amounts of computer time (Hoffer,1979). Additional details are beyond the scope of this paper, but the entiresubject is well documented in Swain and Davis (1978)and elsewhere.
5.43.4 Information Display and Tabulation
After the data are classified the results are stored on magnetic tape, and theanalyst can display these results in a variety of map or tabular formats. Mapsare usually in the form of 'thematic' maps in which each informational class ofinterest is displayed as a different colour or symbol.
Tabular outputs of classification results can be obtained easily, and areparticularly useful for determining acreage. The analyst designates to thecomputer the X - Y coordinates representing the boundary of the area of
148 The role of terrestrial vegetation in the global carbon cycle
interest. The computer then summarizesthe number of data points in eachofthe categories of cover types. Since each data point (or resolution element)represents a certain area of ground, it is a simple matter to determine thenumber of hectares for each cover type of interest. The percentage of the entirearea covered by each of the cover types can also be rapidly calculated.
5.4.3.5 Evaluation of the Classification Results
Classification of large geographic areas can be accomplished very rapidly. It isthen desirable, however, to verify the accuracy of the classification. Severaltechniques have been developed to do so. A qualitative evaluation can beobtained by visually comparingthe classificationwith an existingmap of covertypes with aerial photos. Although this method is subjective, it does provide aquick, rough estimate of the accuracy of the classification.
Quantitative evaluation techniques, on the other hand, allow more definitiveevaluations.One quantitative techniqueinvolvesa sampleof individualareasof knowncover typeswhichare definedas 'test areas'.The X- Y coordinatesofa statistical sample of test areas are designated, and the computer tabulates thecover types. These results are then compared to the cover type known to beactually present on the ground. It should be noted that the use of test areascan produce rather biased results if proper statistical procedures are notfollowed in defining the sample (Hoffer, 1975; Hord and Brooner, 1976).
A second quantitative method is to compare acreage estimates obtainedfrom computer classification of satellite data with estimates obtained by someconventional method, such as manual interpretation of aerial photos. If anadequate number of relatively large areas are summarized, a statisticalcorrelation can be obtained.
5.5.4 Results of CAAT for Vegetation Mapping
Computer classificationof LANDSATand Skylab MSS data has shown thatforestland, rangeland and agricultural lands can be distinguished from othercover types, and identified and mapped with a fairly high degree of accuracy,i.e., 80 to 95 per cent (NASA, 1972b, 1973a, 1973b, 1975, 1978; Heller, 1975;Hoffer, 1975; Hoffer and Staff, 1975; Dodge and Bryant, 1976; Williams andHaver, 1976; Hoffer and Fleming, 1978; Miller and Williams, 1978).LANDSAT classification estimates of total forest acreage were generallywithin:!: 10 per cent of those obtained by forest survey of the US ForestService (Dodge and Bryant, 1976; Aldrich, 1979). In one study, estimates offorest acreage for the state of Michigan obtained by classification ofLANDSATdata werewithin two per cent of thoseobtained by the US ForestService (Hoffer et aI., 1978).Roberts and Merritt (1977)obtained a forestacreage estimate for a nine-county area in Virginia that was within one per
Remote sensing to measure vegetation 149
cent of the Forest Survey estimate. Thus, it would appear that quite accurateacreage estimates of forestland can be achieved by computer classification, atleast over reasonably large areas. Such estimates were less accurate on smallerareas in each study.
In addition to being able to identify forested versus non-forested areas quiteaccurately, computer classification has the capability to differentiate betweendeciduous and coniferous cover types unless they occur in mixed stands, inwhich case the scanner system gives a spectral response that is approximatelyproportional to the mixture of cover types present but that also is influenced byvariations in stand density (Dodge and Bryant, 1976; Williams and Haver,1976; Hoffer and Fleming, 1978). Identification and mapping of individualforest species generally has been significantly less accurate, with results varyingconsiderably (Hoffer and Staff, 1975; Hoffer, 1975; NASA, 1978). Spectralsimilarity among species often causes confusion, and variations in standdensity as well as topographic effects cause significant differences in spectralresponse (Hoffer and Staff, 1975; Hoffer, 1975; Williams and Haver, 1976;Strahler et al., 1978).
LANDSAT data can be obtained at regular intervals throughout the yearand over a period of years on a worldwide basis, cloud cover permitting. Thissequential coverage has made it possible to monitor the 'green wave' in theUnited States (Ashley and Rea, 1975; Blair and Baumgardner, 1977).Temporal differences in spectral response have also led to significantimprovements in the classification of forest cover types (Williams, 1975;Kalensky and Scherk, 1975).Temporal changes in spectral response have beenshown to be particularly important in identifying agricultural species (Steiner,1970). Many studies have reported quite high (80 to 95 per cent) accuracy inclassifying individual agricultural species (NASA, 1972b, 1973a, 1973b, 1975,1978; Bauer, 1975; MacDonald and Hall, 1978). It should also be noted,however, that in many of these studies there were relatively few cover typespresent and field sizes were large, thereby providing a spectrally simplesituation. The LACIE (Large Area Crop Inventory Experiment) projectshowed that temporal differences in spectral response are particularlyimportant in accurately identifying wheat (MacDonald and Hall, 1978).
The availability of LANDSAT MSS data also raises the possibility ofmonitoring changes in the areal extent of vegetative cover. For example,Klankamsorn (1976) reported that a comparison of LANDSAT data obtainedover Thailand in 1973 with aerial photos obtained in 1961 showed that thetotal area of forestland in that country had decreased from 55 per cent to 41per cent. Miller and Williams (1978) have used LANDSAT data to evaluateland-use changes in Thailand, Taiwan, Nigeria and the Dominican Republic,particularly the conversion of forestland to agricultural use. A variety ofcomputer analysis techniques to identify areas of land-use change have beendevelopedand assessed,but the results of such 'change-detectionanalysistechniques' have been somewhat mixed (Weismiller et al., 1977).
150 The role of terrestrial vegetation in the global carbon cycle
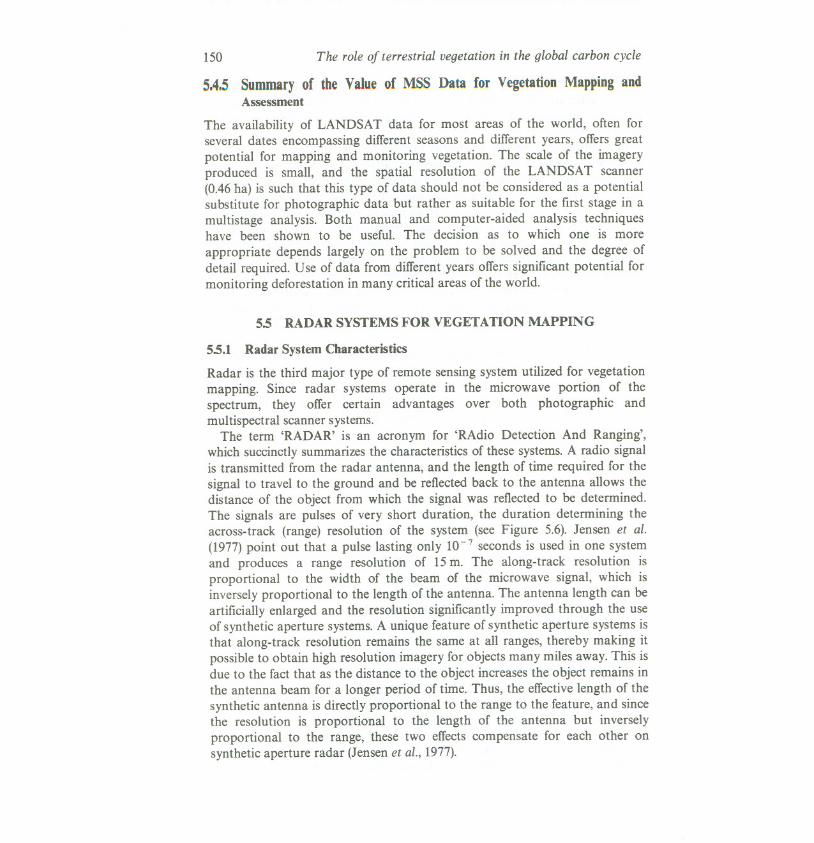
5.4.5 Summaryof the Value of MSS Data for VegetationMapping andAssessment
The availability of LANDSAT data for most areas of the world, often forseveral dates encompassing different seasons and different years, offers greatpotential for mapping and monitoring vegetation. The scale of the imageryproduced is small, and the spatial resolution of the LANDS AT scanner(0.46ha) is such that this type of data should not be considered as a potentialsubstitute for photographic data but rather as suitable for the first stage in amultistage analysis. Both manual and computer-aided analysis techniqueshave been shown to be useful. The decision as to which one is moreappropriate depends largely on the problem to be solved and the degree ofdetail required. Use of data from different years offers significant potential formonitoring deforestation in many critical areas of the world.
5.5 RADAR SYSTEMS FOR VEGETATION MAPPING
5.5.1 Radar System Characteristics
Radar is the third major type of remote sensing system utilized for vegetationmapping. Since radar systems operate in the microwave portion of thespectrum, they offer certain advantages over both photographic andmultispectral scanner systems.
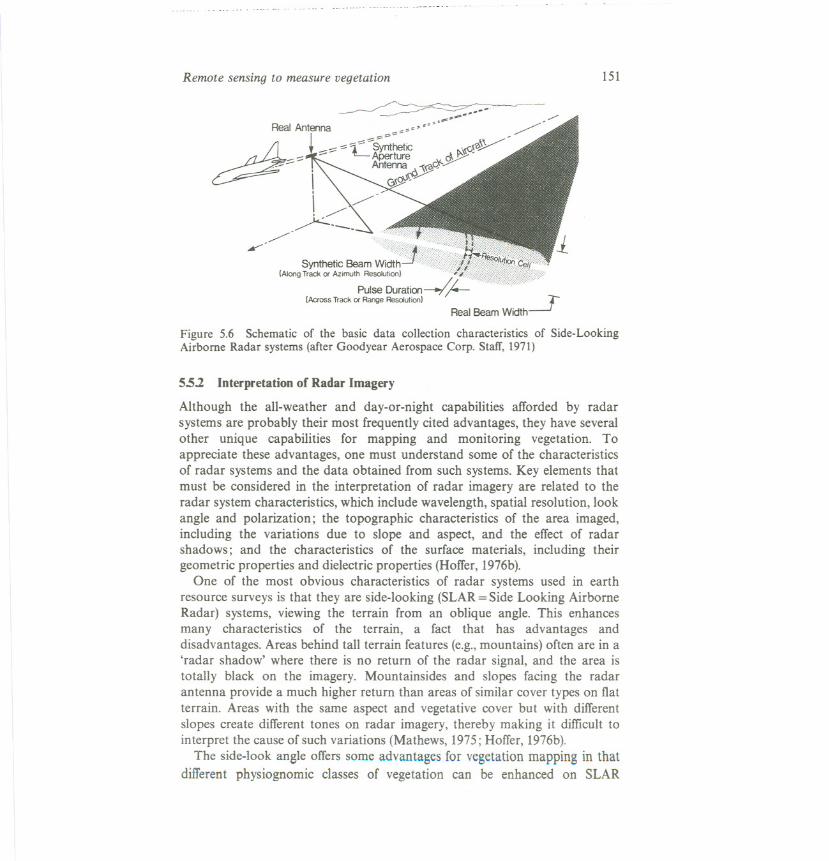
The term 'RADAR' is an acronym for 'RAdio Detection And Ranging',which succinctly summarizes the characteristics of these systems. A radio signalis transmitted from the radar antenna, and the length of time required for thesignal to travel to the ground and be reflected back to the antenna allows thedistance of the object from which the signal was reflected to be determined.The signals are pulses of very short duration, the duration determining theacross-track (range) resolution of the system (see Figure 5.6). Jensen et al.(1977) point out that a pulse lasting only 10-7 seconds is used in one systemand produces a range resolution of 15 m. The along-track resolution isproportional to the width of the beam of the microwave signal, which isinversely proportional to the length of the antenna. The antenna length can beartificially enlarged and the resolution significantly improved through the useof synthetic aperture systems. A unique feature of synthetic aperture systems isthat along-track resolution remains the same at all ranges, thereby making itpossible to obtain high resolution imagery for objects many miles away. This isdue to the fact that as the distance to the object increases the object remains inthe antenna beam for a longer period of time. Thus, the effective length of thesynthetic antenna is directly proportional to the range to the feature, and sincethe resolution is proportional to the length of the antenna but inverselyproportional to the range, these two effects compensate for each other onsynthetic aperture radar (Jensen et al., 1977).
Remote sensing to measure vegetation 151
~---=: ,... ./'
RealAntenna ,- ~-
c?+ ~~~LS;;;;t~ ~\~G~~-_""
\\>ture 0\.!:Y
--- i Aht::<pyG~/'
I ~-. /
~---~.
¥'-
Figure 5.6 Schematic of the basic data collection characteristics of Side-LookingAirborne Radar systems (after Goodyear Aerospace Corp. Staff, 1971)
5.5.2 Interpretationof RadarImagery
Although the all-weather and day-or-night capabilities afforded by radarsystems are probably their most frequently cited advantages, they have severalother unique capabilities for mapping and monitoring vegetation. Toappreciate these advantages, one must understand some of the characteristicsof radar systems and the data obtained from such systems. Key elements thatmust be considered in the interpretation of radar imagery are related to theradar system characteristics, which include wavelength, spatial resolution, lookangle and polarization; the topographic characteristics of the area imaged,including the variations due to slope and aspect, and the effect of radarshadows; and the characteristics of the surface materials, including theirgeometric properties and dielectric properties (Hoffer, 1976b).
One of the most obvious characteristics of radar systems used in earthresource surveys is that they are side-looking (SLAR = Side Looking AirborneRadar) systems, viewing the terrain from an oblique angle. This enhancesmany characteristics of the terrain, a fact that has advantages anddisadvantages. Areas behind tall terrain features (e.g.,mountains) often are in a'radar shadow' where there is no return of the radar signal, and the area istotally black on the imagery. Mountainsides and slopes facing the radarantenna provide a much higher return than areas of similar cover types on flatterrain. Areas with the same aspect and vegetative cover but with differentslopes create different tones on radar imagery, thereby making it difficult tointerpret the cause of such variations (Mathews, 1975; Hoffer, 1976b).
The side-look angle offers some advantages for vegetation mapping in thatdifferent physiognomic classes of vegetation can be enhanced on SLAR
152 The role of terrestrial vegetation in the global carbon cycle
imagery.In forestedareas,treeswith largecrownscausea rough texture on theradar imagery, as do stands having a very low canopy closure. Brushlandareas produce a finer texture. Thus, differentiation and mapping of majorvegetative cover types can be achieved. Some agricultural crops can beaccurately identified and mapped using SLAR imagery at selected times duringthe growing season (Morain and Simonett, 1966; Mathews, 1975; Bajzak,1976; Ulaby and Bums, 1977).
In addition to differences in canopy texture, differences in the moisturecontent of vegetation significantly influence the radar signal, particularly in theshorter (i.e. K and X) wavelength bands. This is because the radar signal atthese frequencies is strongly reflected by material with a high dielectricconstant, and the dielectric constant is closely correlated with the moisturecontent. Therefore, vegetation having a high moisture content, or a fairlycomplete canopy of turgid vegetation, will produce a relatively light tone onthe radar imagery (Morain and Simonett, 1966; Mathews, 1975; Rouse, 1977).The ability of radar to discriminate between agricultural fields with differentlevels of moisture is one of the primary reasons that certain crop species can beidentified at specific times during the growing season. It also offers some hopefor detecting stress conditions (Mathews, 1975).
One of the characteristics of radar which has often been misrepresented is itsability to 'see through' vegetative canopies. Longer wavelength systems, suchas L-band, do have a significant potential for penetrating surficial cover, butthe shorter wavelength systems, such as K-band, do not (Mathews, 1975).Since the spatial resolution of L-band radar is much poorer than that of theshorter wavelength K- or X-band systems, and since it has been primarily theK- or X-band systems that have been available to scientists for vegetationmapping, most of the data obtained thus far has come from K- or X-bandsystems. With these systems, in situations where the terrain does not causesignificant variations, the geometric characteristics and moisture content of thevegetation itself are the dominant factors influencing the texture and tone ofthe radar image (Morain and Simonett, 1966, 1967; Barr and Miles, 1970;Mathews, 1975).
The polarization of the radar signal can also influence significantly theappearance of different vegetative types on radar imagery. In some cases theHH polarization gives better differentiation between vegetative cover typesthan the HV; in other cases the reverse is true (Morain and Simonett, 1966;Westinghouse, 1971; Lewis, 1973).
Another characteristic of radar data is the small scale involved and theresultant capability to cover large areas rapidly. One system, for example, isflown at a height of 20000 ft, obtaining data at a scale of 1:250 000 andcovering a swath about 12 miles in width (Francis, 1976). The uniquecapabilities of synthetic aperture radar systems are of particular interest, sincerelatively high spatial resolution can be achieved from great distances-e.g.,
Remote sensing to measure vegetation 153
10m at a distance of 100 km (Jensen et al., 1977). Very complex navigationand radar recording electronics are required in such systems in order to permitthe extremely long antenna to be synthesized.
Radar systems operating in the K- and X-bands (approximately 0.83 and3.0 em wavelengths, respectively) have been the most commonly used forvegetation mapping. Such systems have been particularly useful in tropicalregions because of the unique capability of radar to penetrate cloud cover. In1968 the Darien Province of Panama was successfullymapped through the useof a K-band radar system, which obtained imagery of good quality in spite ofthe almost perpetual cloud cover over the area (Viksne et al., 1969).Syntheticaperture radar systems were released from military classification in 1970, andsince that time significant portions of the earth's surface have been mappedusing an X-band system (Jensen et al., 1977; Rouse, 1977). One of the mostnotable achievements of this system involved Project RADAM (van Roesseland deGodoy, 1974), in which SLAR data were obtained for the entireBrazilian Amazon Basin, an area of approximately 4 x 10⁶km2, in less than ayear's time. Land-use, vegetation, hydrologic, geologic and other types of mapswere prepared from this imagery. In 1976 a radar survey of the entire countryof Brazil was completed. Large portions of many other countries in Centraland South America, Southeast Asia, Africa and the Far East have also beensurveyed (Mathews, 1975; Francis, 1976; Jensen et al., 1977).
5.5.3 Summary of Radar's Potential for Vegetation Mapping
Radar has the capability of obtaining small-scale data with relatively highresolution from high-flying aircraft or from spacecraft. Such data can beobtained reliably at specific stages in the growth and development ofagricultural crops and forest vegetation types, regardless of cloud cover.Although topographic relief often causes unwanted variations in tone, manymajor vegetative cover types can still be differentiated and mapped. Thephysiognomic characteristics of vegetative cover types and the moisture contentof the vegetation are the primary causes of differences in texture and tone onradar imagery. Changes such as recent clear-cutting in tropical forest regionsare distinct on radar imagery (Mathews, 1975).
5.6 SUMMARY
It is clear that each of the three data collection systems discussed in this paperhas unique advantages. LANDSAT provides a relatively economical way ofobtaining sequential data at a scale and in a format that is appropriate formonitoring global vegetation, using computer-aided analysis. However,scanner systems operating in the optical wavelengths cannot obtain data inareas where there is persistent heavy cloud cover, whereas radar can. The
154 The role of terrestrial vegetation in the global carbon cycle
capability of radar to provide data related to plant physiognomy otTers apotential for differentiating among vegetative cover types and sizes that cannotbe distinguished through the use of spectral data alone. The advantages ofphotographic data are that they provide a degree of detail that cannot beobtained by the other types of sensors. Thus, each type of sensor provides thecapability of obtaining data that cannot be obtained in any other way. Thetype and degree of detail of the information needed must be carefully defined,after which the various sensor systems can be matched to the informationrequired. Different analysis techniques must be utilized, depending on thesensor system involved, the scale of imagery obtained, and the degree of detailrequired. Both manual and computer-aided analysis techniques have distinctadvantages and limitations that must be recognized in order to achievemaximum efficiency.
When one considers the various types of sensor systems and analysistechniques available, it is apparent that remote sensing technology offers apowerful and relatively economical tool for assessing the extent, characteristicsand condition of the vegetation resources of the world.
5.7 REFERENCES
Adrien, P. M., and Baumgardner, M. F. (1977) LANDSAT, computers, anddevelopment projects. Science, 198,466--470.
Aldrich, R. C. (1971) Space photos for land use and forestry. Photogram. Eng., 37(4),389-401.
Aldrich, R. C. (1975) Detecting disturbances in a forest environment. Photogram. Eng.and Rem. Sens., 41(1), 39-48.
Aldrich, R. C. (1979) Remote sensing of wildland resources; a state-of-the-art review,1978. U.S. Forest Service Report, Fort Collins, Colorado. 131 pp.
Ashley, M. D., and Rea, J. (1975) Seasonal vegetation differences from ERTS imagery.Photogram. Eng. Rem. Sens., 41(6),713-719.
Avery, T. E. (1977) Interpretation of Aerial Photographs. Burgess Publishing Co.,Minneapolis, Minnesota. 392 pp.
Bajzak, D. (1976)Interpretation of vegetation types on side looking airborne radar andon thermal infra-red imagery. In: Hildebrant, G. (ed), Proceedings of the RemoteSensing in Forestry Symposium held during the XVI IUFRO World Congress, Oslo,Norway, 87-99. University of Freiburg, Freiburg, Germany.
Barr, D. J., and Miles, R. D. (1970) SLAR imagery and site selection. Photogram. Eng.,36(11),1155-1170.
Bartolucci, L. A., Robinson, B. F., and Silva, L. F. (1977) Field measurements of thespectral response of natural waters. Photogram. Eng. Rem. Sens., 43(5), 595-598.
Bauer, M. E. (1975)The role of remote sensing in determining the distribution and yieldof crops. Adv. Agron., 27, 271-304.
Bauer, M. E., Swain, P. H., Mroczynski, R. P., Anuta, P. E., and MacDonald, R. B.(1971) Detection of southern corn leaf blight by remote sensing techniques.Proceedings of the 7th International Symposium on Remote Sensing of Environment.University of Michigan, Ann Arbor, Michigan.
Blair, B. 0., and Baumgardner, M. L. (1977) Detection of the green and brown wave in
Remote sensing to measure vegetation 155
hardwood canopy covers using multidate, multipspectral data from LANDSAT-I,Agron. J., 69, 808-811.
Colwell, R. N. (1956) Determining the prevalence of certain cereal crop diseases bymeans of aerial photography. Hilgardia, 26(5),223-286.
Colwell, R. N. (ed) (1960) Manual of Photo Interpretation. American Society ofPhotogrammetry, Falls Church, Virginia. 868 pp.
Colwell, R. N. (1968) Remote sensing of natural resources. Sci. Am., 218(1),54-69.Dodge, A. G. Jr., and Bryant, E. S. (1976) Forest type mapping with satellite data. J.
For., 74(8),526-531.Draeger, W. c., Pettinger, L. R., and Benson, A. S. (1971) The use of small-scale aerial
photography in a regional agricultural survey. Proceedings of the 7th InternationalSymposium on Remote Sensing of the Environment. University of Michigan, AnnArbor, Michigan.
Driscoll, R. S., and Coleman, M. D. (1974) Color for shrubs. Photogram. Eng., 40(4),451-459.
Francis, D. A. (1976) Possibilities and problems of radar image interpretation forvegetation and forest types with particular reference to the humid tropics. In:Hildebrandt, G. (ed), Proceedings of the Symposium on Remote Sensing in Forestryheld during the XVI IUFRO World Congress, Oslo, Norway, 79-86. University ofFreiburg, Freiburg, Germany.
Fritz, N. L. (1967) Optimum methods for using infra-red-sensitive color films.Photogram. Eng., 33(10), 1128-1138.
Gates, D. M., Keegan, H. J., Schleter, J. c., and Weidner, V. R. (1965) Spectralproperties of plants. Appl. Optics, 4(1), 11-20.
Goodyear Aerospace Corporation Staff (1971) Terrainimaging radar: Criteria for systemselection. Goodyear Aerospace Corp., Litchfield Park, Arizona. 64 pp.
Hasel, P. (1972) Michigan experimental scanner system. Proceedings of the 4th AnnualEarth Resources Program Review, 34-1-34-13. NASA Johnson Space Center,Houston, Texas.
Hay, C. M. (1974) Agricultural inventory techniques with orbital and high-altitudeimagery. Photogram. Eng., 40(11),1283-1293.
Heller, R. C. (1970) Imaging with photographic sensors. Remote Sensing, with SpecialReference to Agriculture and Forestry. National Academy of Science, Washington,DC. 424 pp.
Heller, R. C. (1971) Color and false color photography: its growing use in forestry.Application of Remote Sensors in Forestry, 21-36, IUFRO, Freiburg, Germany.
Heller, R. c., Technical Coordinator (1975) Evaluation of ERTS-l data for forest andrange-land survey. United States Department of Agriculture Forest ServiceResearch Paper PSW-1I2, Pacific S.W. Forest and Range Experimental Station,Berkeley, California. 67 pp.
Heller, R. C. (1978) Case applications of remote sensing for vegetation damageassessment. Photogram. £ng. Rem. Sens., 44(9),1159-1166.
Heller, R. c., Doverspike, G. E., and Aldrich, R. C. (1966) Identification of tree specieson large scale panchromatic and color aerial photographs. USDA Handbook 261.17 pp.
Hoffer, R. M. (1967) Interpretation of remote multispectral imagery of agriculturalcrops. LARS Vol. 1, Research Bulletin 831. Agricultural Experiment Station,Purdue, University, W. Lafayette, Indiana. 36 pp.
Hoffer, R. M. (1975) Computer-aided analysis of Skylab scanner data for land usemapping, forestry and water resource applications. Proceedings of the EleventhInternational Symposium on Space Technology and Science, 935-941. Tokyo,Japan.
Hoffer, R. M. (1976a) Techniques and applications for computer-aided analysis of
156 The role of terrestrial vegetation in the global carbon cycle
multispectralscannerdata. Proceedingsof XVI IUFRO WorldCongress,DivisionVI, 244-254. Oslo, Norway.
Hoffer, R. M. (1976b) Interpretation of radar imagery. Fundamentals of Remote SensingMinicourse Series, Office of Continuing Education, Purdue University, WestLafayette, Indiana. 11 pp.
Hoffer, R. M. (1978)Biological and physical considerations in applying computer-aidedanalysis techniques to remote sensor data. In: Swain, P. H. and Davis, S. M. (ed),Remote Sensing: The Quantitative Approach, Chapter 5, 227-289. McGraw-Hill, NY,NY.
Hoffer, R. M. (1979) Computer-aided analysis of remote sensor data-magic, mysteryor myth? Proceedings of Remote Sensing for Natural Resources: An InternationalView of Problems, Promises, and Accomplishments, 156-179. University of Idaho,Moscow, Idaho.
Hoffer, R. M., and Fleming, M. D. (1978) Mapping vegetative cover by computer-aidedanalysis of satellite data. Proceedings of the Workshop on Integrated Inventories ofRenewable Natural Resources, General Technical Report RM-55, Rocky MountainForest and Range Experiment Station, US Forest Service, Fort Collins, Colorado.227-237.
Hoffer, R. M., and Johannsen, C. J. (1969) Ecological Potentials in Spectral SignatureAnalysis. In: Johnson, P. (ed),Remote Sensing in Ecology, Chapter 1, 1-16. Universityof Georgia Press, Athens, Georgia.
Hoffer, R. M., Noyer, S. c., and Mroczynski, R. P. (1978) A comparison of LANDSATand forest survey estimates of forest cover. Proceedings of the Fall TechnicalMeeting of the American Society of Photogrammetry, 221-231. Falls Church,Virginia.
Hoffer, R. M. and Staff (1975) Natural resource mapping in mountainous terrain bycomputer analysis of ERTS-l satellite data. Agricultural Experiment StationResearch Bulletin 919. Purdue University, West Lafayette, Indiana. 124 pp.
Holter, M. R., Courtney, H. W., and Limperis, T. (1970) Research needs: the influenceof discrimination data processing and system design. Remote Sensing and SpecialEmphasis on Agriculture and Forestry, 354--421. National Academy of Sciences,Washington, DC.
Hooley, R., Hoffer, R., and Morain, S. (1977) Estimating agricultural production by theuse of satellite data: An experiment with Laotian data. Am. J. Agric. Econ., 59(4),722-727.
Hord, R. M., and Brooner, W. (1976) Land use map accuracy criteria. Photogram. Eng.Rem. Sens., 42, 671-677.
Howard, J. A. (1971) Reflective foliaceous properties of tree species. In: Applications ofRemote Sensors in Forestry, 127-146. IUFRO, Freiburg, Germany.
Hsu, K. S. (1978) The evaluation of LANDSAT data and analysis techniques formapping tropical forest areas. PhD dissertation, Purdue University, WestLafayette, Indiana. 176 pp.
Jensen, H., Graham, L. c., Porcello, L. J., and Leith, E. N. (1977)Side-looking airborneradar. Sci. Am., 237(4),84--95.
Kalensky, Z., and Scherk, L. R. (1975) Accuracy of forest mapping from LANDSATcomputer compatible tapes. Proceedings of the Tenth International Symposium onRemote Sensing of Environment, 1159-1167. Ann Arbor, Michigan.
Kalensky, Z., and Wilson, D. A. (1975) Spectral signatures of forest trees. Proceedingsof the Third Canadian Symposium on Remote Sensing, 155-171. Edmonton, Alberta,Canada.
Klankamsorn, B. (1976)LANDSAT-l imagery application in forestry. In: Hildebrandt,
Remote sensing to measure vegetation
G. (ed), Proceedings of the Remote Sensing in Forestry Symposium held during theXVI IUFRO World Congress, Oslo, Norway, 227-233. University of Freiburg,Freiburg, Germany.
Kodak (1976) Kodak Aerochrome Infrared Film 2443. Kodak Publication No. M-69,Eastman Kodak Company, Rochester, New York. 11 pp.
Kourtz, P. H., and Scott, A. J. (1978) An improved image enhancement technique andits application to forest fire management. Proceedings of the Fifth CanadianSymposium for Remote Sensing, Jlictoria,British Columbia.9 pp.
Landgrebe, D. A., and Staff (1967) Automatic identification and classification of wheatby remote sensing. Research Progress Report 279, Agricultural Experiment Station,Purdue University, West Lafayette, Indiana. 7 pp.
Langley, P. G., Aldrich, R. c., and Heller, R. D. (1969) Multistage sampling of forestresourcesby usingspacephotography-an Apollo9 casestudy.Proceedingsof the2nd AnnualEarthResourcesAircraftProgramReview,19-1-19-21,Volume2: Agr.Forest, and Sensor Studies. NASA MSC, Houston, Texas.
Lauer, D. T. (1971) Multiband photography for forestry purposes. In: Application ofRemoteSensorsin Forestry,21-36, IUFRO, Freiburg,Germany.
Lauer, D. T., and Benson, A. S. (1973) Classification of forest lands with ultra-highaltitude, small scale, false-color infra-red photography. Proceedings of the IUFROSymposiumonRemoteSensing,143-162.Freiburg,Germany.
Lee, Y. J. (1975) Are clear-cut areas estimated from LANDSAT imagery reliable?Proceedings of the NASA Earth Resources Survey Symposium, 105-114. Houston,Texas.
Lewis, A. J. (1973) Evaluation of multiple-polarized radar imagery for the detection ofselected cultural features. In: Holtz, R. (ed), The Surveillant Science, 297-313.Houghton Millin Co., Boston, Massachusetts.
Lowe, D. S., Polcyn, F. c., and Shay, R. (1964) Multispectral data collection program.Proceedingsof the Third InternationalSymposiumon Remote Sensingof theEnvironment,667-680.Universityof Michigan,Ann Arbor,Michigan.
MacDonald, R. B., and Hall, F. G. (1978) LACIE: An experiment in global cropforecasting. Proceedings of the LACIE Symposium, Report No. OSC-14551, 17-48.National Aeronautics and Space Administration, Johnson Spacecraft Center,Houston, Texas.
Manzer, F. E., and Cooper, G. R. (1967)Aerial photographic methods of potato diseasedetection. Agricultural Experiment Station Bulletin 646, University of Maine,Orono, Maine.
Marshall, J., and Meyer, M. (1977) A field evaluation of small-scale forest resourceaerial photography. IAFHE RSL Research Report 77-2, University of Minnesota,St. Paul, Minnesota. 16 pp.
Mathews, R. E. (ed) (1975) Active Microwave Workshop Report. NASA SP-376,National Aeronautics and Space Administration, Washington, DC. 502 pp.
Miller, L. D., and Williams, D. L. (1978) Monitoring forest canopy alteration aroundthe world with digital analysis of LANDSAT imagery. From Proceedings ISP-IUFRO InternationalSymposiumon RemoteSensingObservationand InventoryofEarthResourcesandEndangeredEnvironment,Freiburg,Germany.41 pp.
Morain, S. A., and Simonett, D. S. (1966) Vegetation analysis with radar imagery.CRES Report61-9, Universityof Kansas,Lawrence,Kansas. 18pp.
Morain, S. A., and Simonett, D. S. (1967) K-Band radar in vegetation mapping.Photogram. Eng., 33(7), 730-740.
Murtha, P. A. (1972) A guide to air photo interpretation of forest damage in Canada.CanadianForestryServicePublicationNo. 1292, Ottawa, Canada.63 pp.
157
158 The role of terrestrial vegetation in the global carbon cycle
Murtha,p, A. (1978)Remotesensingandvegetationdamage:a theoryfor detectionand assessment.Photogram.Eng.Rem.Sens.,44(9),1147-1158.
NASA(1972a)Earth ResourcesTechnologySatellite: Data UsersHandbook.NationalAeronautics and Space Administration, Goddard Space Flight Center, Greenbelt,Maryland.
NASA (1972b) Earth Resource Technology Satellite-I Symposium Proceedings.Publication X-650-73-10. National Aeronautics and Space Administration,Goddard Space Flight Center, Greenbelt, Maryland.
NASA (1973a) Symposium on significant results obtained from the earth resourcestechnology satellite-I. Publication X-650-73-127. National Aeronautics andSpace Administration, Goddard Space Flight Center, Greenbelt, Maryland.
NASA (1973b) Third earth resources technology satellite symposium. NASA SP-357.National Aeronautics and Space Administration, Goddard Space Flight Center,Greenbelt, Maryland.
NASA (1975) Proceedings of the NASA Earth Resources Survey Symposium. NationalAeronautics and Space Administration, Johnson Space Center, Houston, Texas.
NASA (1978) Skylab EREP Investigations Summary. NASA SP-399. NationalAeronautics and Space Administration, Johnson Space Center, Houston Texas.386 pp.
Reeves, R. G. (ed) (1975) Manual of Remote Sensing. American Society ofPhotogrammetry, Falls Church, Virginia. 2144 pp.
Rhode, W. G., Lo, J. K., and Pohl, R. A. (1978) EROS Data Center LANDSAT digitalenhancementtechniquesand imagery availability,1977.Can.J. Rem.Sens.,4(1),63-76.
Roberts, E. H., and Merritt, N. E. (1977)Computer-aided inventory of forestland. TypeIII Final Report, USDA Forest Service, 65-74. Rocky Mountain Forest and RangeExperimental Station, Fort Collins, Colorado.
Rouse,J. W.Jr. (ed)(1977)WorkshopReport.MicrowaveRemoteSensingSymposium,National Aeronautics and Space Administration, Johnson Space Center, Houston,Texas. 20 pp.
Sayn-Wittgenstein, L., and Aldred, A. H. (1967) Tree volumes from large-scale photos.Photogram.Engin.,33(1),69-73.
Sinclair, T. R., Hoffer, R. M., and Schreiber, M. M. (1971) Reflectance and internalstructure of leaves from several crops during a growing season. Agron. J., 63,864-868.
Smedes, H. W., Pierce, K. L., Tanguey, M. c., and Hoffer, R. M. (1970) Digitalcomputer terrain mappingfrommultispectraldata. J. SpacecraftandRockets,7(9),1025-1031.
Smith, J. T. (ed) (1968)Manual of Color Aerial Photography.American Society ofPhotogrammetry, Falls Church, Virginia. 550 pp.
Steiner,D. (1970)Time dimensionfor crop surveysfrom space.Photogram.Eng.,36(2),187-194.
Strahler, A. H., Logan, T. L., and Bryant, N. A. (1978) Improving forest coverclassification accuracy from LANDSAT by incorporating topographicinformation. Proceedings of the 12th International Symposium on Remote Sensingof the Environment, 927-942. University of Michigan, Ann Arbor, Michigan.
Swain,P. H., and Davis,S. M. (ed)(1978)RemoteSensing:The QuantitativeApproach.McGraw-Hill, Inc. NY, NY. 396 pp.
Ulaby, F. T., and Burns, G. (1977)The potential use of radar for crop classification andyield estimation. Proceedings of the Microwave Remote Sensing Symposium.National Aeronautics and Space Administration, Johnson Space Center, Houston,Texas.
Remote sensing to measure vegetation 159
van Roessel, J. W., and deGodoy, R. C. (1974) SLAR mosaics for Project RADAM.Photogram Eng., 40(5), 583-595.
Viksne, A., Listen, T. c., and Sapp, C. D. (1969) SLR reconnnaissance of Panama.Geophysics, 34, 54-64.
Weismiller, R. A., Kristof, S. J., Scholz, D. K., Anuta, P. E., and Morain, S. A. (1977)Change detection in coastal zone environments. Photogram. Eng. Rem. Sens.,43(12), 1533-1539.
Westinghouse Corp. Staff (1971) Side Look Radar. Westinghouse Corporati°!1' 46 pp.Williams, D. L. (1975)Computer analysis and mapping of gypsy moth defoliation levels
in Pennsylvania using LANDSAT-1 digital data. Proceedings of the NASA EarthResources Survey Symposium. 167-177. NASA TMX-58168, JSC-09930, Houston,Texas.
Williams, D. L., and Haver, G. F. (1976) Forest Land Management by Satellite:LANDSAT-derived Information as Input to a Forest Inventory System. NationalAeronautics and Space Administration, Goddard Spaceflight Center, Greenbelt,Maryland. 36 pp.
Yost, E. F., and Wenderoth, S. (1967) Multispectral color aerial photography.Photogram Eng., 33(9),1020-1033.