Embed Size (px)
Citation preview

Chapter 5 – Part 3
The TQM Philosophy
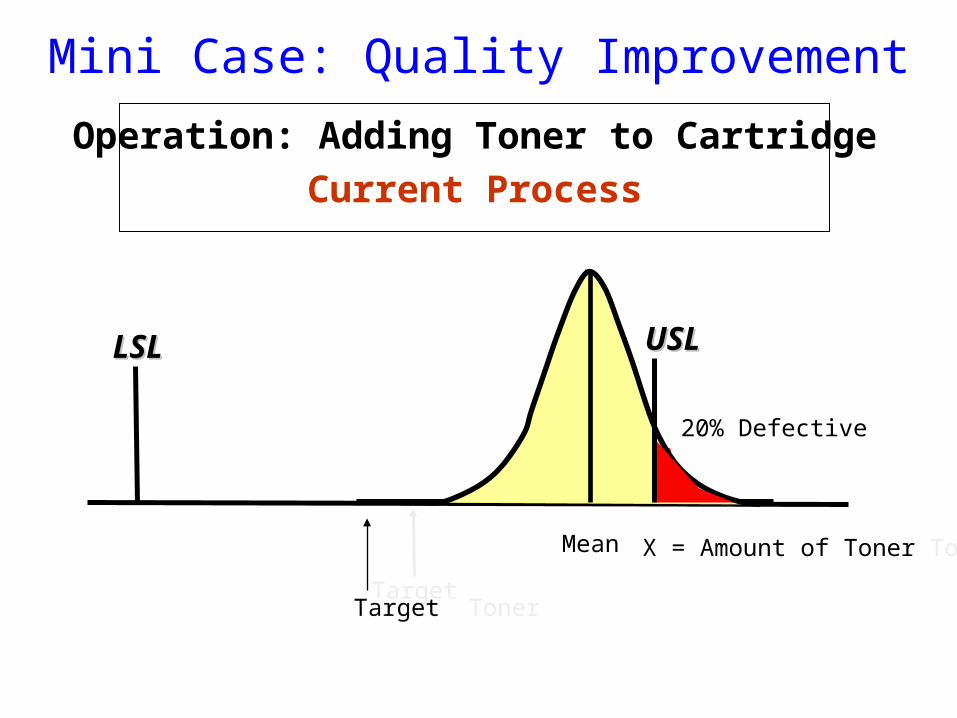
Mini Case: Quality Improvement
LSLLSL USLUSL
X = Amount of Toner Toner
Operation: Adding Toner to CartridgeCurrent Process
Target
Mean
20% Defective
Target Toner

What’s wrong with this operation?
How should it be corrected?
Why is this fix feasible?
Mini Case: Quality Improvement

LSLLSL USLUSL
Amount of Toner
New Process – Mean Shifted to left and centered on target
Target
Mini Case: Quality Improvement
Mini Case: Quality Improvement
Benefits?
Next step?

Amount of Toner
Suppose the current process looked like this. Will adjusting the mean to the target improve the process?
Mini Case: Quality Improvement
LSLLSL USLUSL
Target
20% Defective
Mean

Amount of Toner
Mean adjusted to target
Mini Case: Quality Improvement
10% Defective
LSLLSL USLUSL
Mean =Target
10% Defective

Seven Tools of Quality Control
Cause-and-Effect Diagrams Flowcharts Checklists Control Charts Scatter Diagrams Pareto Analysis Histograms

Cause-and-Effect Diagram(Fishbone Diagram)
Machines
Cause
Effect-problem
MaterialsMethods
Manpower
Environment
Cause
Cause
CauseCause
CauseCause
Cause
CauseCause
Cause
Cause
4M + E

Flowcharts
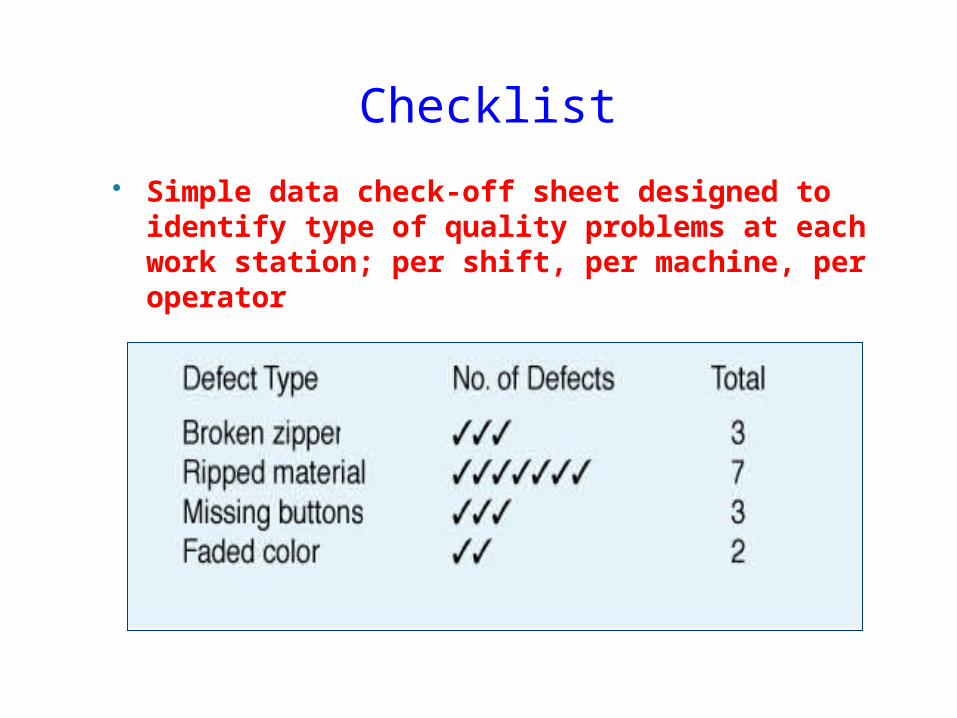
Checklist
Simple data check-off sheet designed to identify type of quality problems at each work station; per shift, per machine, per operator

Control Charts (Chapter 6)
Control charts are tools for predicting the future performance of a process.
If we can predicting performance, we can take corrective action before too many nonconforming units are produced.

Control Charts (Chapter 6)
Suppose we construct a control chart for the thickness of the gold plating of an electrical connector.
We take samples of connectors over time and compute the mean of each sample.
After several time period, we use the sample means to estimate the mean thickness.

Control Charts (Chapter 6)
We then construct two control limits:
an upper control limit (UCL) and a lower control limit (LCL)
• We do this by adding subtracting 3 standard deviations to the estimated mean:
LCL = Estimated Mean – 3(Standard Deviation)
UCL =Estimated Mean + 3(Standard Deviation)

We plot the estimated mean and the control limits on the control chart.
The result is called a control chart for the process mean.
Control Charts (Chapter 6)
Time
mean
Mea
n th
ickn
ess

Control Charts (Chapter 6)
If the sample means fall randomly within the control limits, the process mean is in control.
“In control” means that the process mean is stable and hence predictable.
If at least one sample mean fall outside of the control limits, we say the process mean is “out of control.”
In this case, the process mean is unstable and not predictable.
The goal is to find out why and remove the causes of instability from the process.

Speed vs. Yield
0
5
10
15
20
25
30
0 10 20 30 40
Speed
Yie
ld
Scatter DiagramsA graph that shows how two variables are related to one another
Optimal Speed

Pareto Diagram
Pareto Principle:
80% of the problems may be
attributed to 20% of the
causes.
Pareto Principle:
80% of the problems may be
attributed to 20% of the
causes.
Missing
Per
cen
t of
def
ects
Bubbles CracksUneven
Runs
80%

Histogram for Diameter
0
5
10
15
20
25
30
35
40
45
<=0.077 .077-.277
.277-.477
.477-.677
.677-.877
.877-1.077
1.077-1.277
1.277-1.477
1.477-1.677
1.677-1.877
1.877-2.077
>2.077
Diameter
USLLSL
Histograms

Reliability
Reliability is the probability that the product, service or part will function as expected.
Reliability is a probability function dependent on sub-parts or components.

Reliability
Reliability of a system is the product of component reliabilities:
RS = (R1) (R2) (R3) . . . (Rn)
RS = reliability of the product or system
R1 = reliability of the first component
R2 = reliability of the second component. ..
Rn = reliability of the nth component
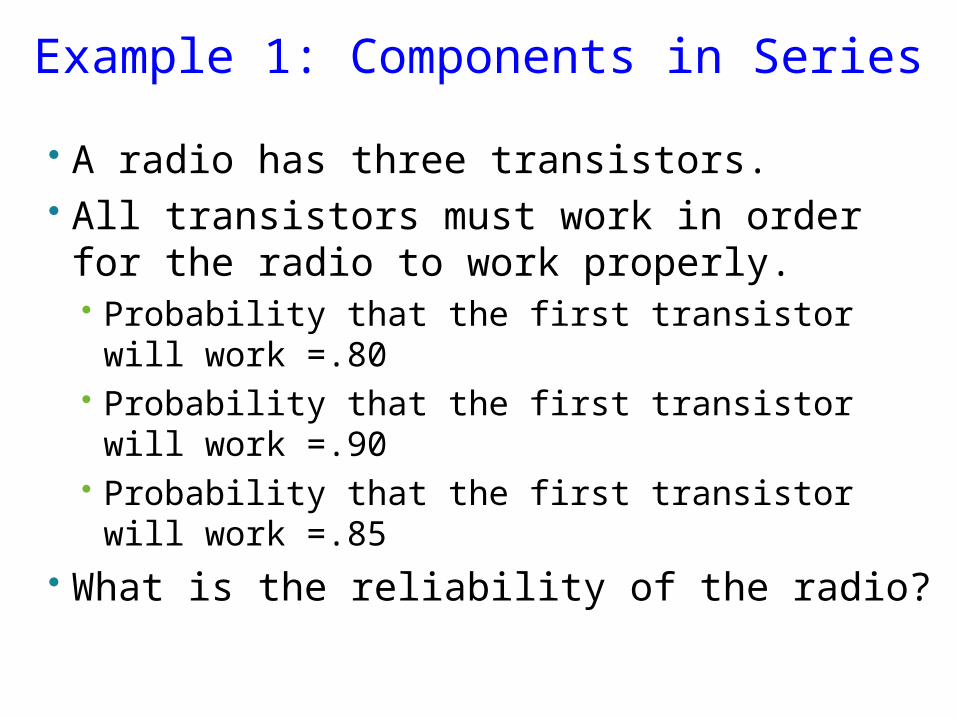
Example 1: Components in Series
A radio has three transistors. All transistors must work in order for the radio
to work properly. Probability that the first transistor will work =.80 Probability that the first transistor will work =.90 Probability that the first transistor will work =.85
What is the reliability of the radio?

Solution
RS = (R1) (R2) (R3)
RS = (.80) (.90) (.85) =.51
R1 = .80 R3 = .85R2 = .90

Example 2: Backup Components
Backup component takes over when a component fails.
Suppose only one transistor is needed for the radio to work.
In case the one transistor fails, a backup transistor has been installed.
Probability that the original transistor will work =.92
Probability that the backup transistor will work =.87

Example 2: Backup Components
The backup transistor is in parallel to the original transistor.
RBU = .87
R1 = .92

Example 2: Backup Components
Parallel components allow system to operate if one or the other fails
Increase reliability by placing components in parallel For system with one component and a BU
component:
RS = R1 + [(RBU) x (1 - R1)]
1 - R1 = Probability of needing BU component
= Probability that 1st component fails

Solution
RS = R1 + [(RBU) x (1 - R1)]
RS = .92 + [(.87) x (1 - .92)]
= .92 + [(.87) x (.08)]
= .9896
RBU = .87
R1 = .92

R1 = .80
RBU = .75
R2 = .88
Example 3: Series with Backup Components

Example 3: Series with Backup Components
• BU is in parallel to first component.• Convert to system in series.• To this by first finding reliability (probability) of
components.
A = Probability that first component or its BU works
B = Probability that second component works = R2
RS = A x B

Solution
A = R1 + [(RBU) x (1 - R1)]
= .80 + [(.75) x (1 - .80)]
= .95
B = R2 =.88
RS = A x B = .95 x .88 = .836
.95 .88
Part 1 Part 2

Reliability Over Time - Bathtub Curve
t0 Time
Fai
lure
Rat
e
Maturity
Constant Failure
Infant Mortality
t2t1

Quality Awards and Standards
Malcolm Baldrige National Quality
Award (MBNQA)
The Deming Prize
ISO 9000 Certification

MBNQA- What Is It? Award named after the former Secretary of
Commerce – Regan Administration Intended to reward and stimulate quality
initiatives Given to no more that two companies in each
of three categories; manufacturing, service, and small business
Past winners: Motorola Corp., Xerox, FedEx, 3M, IBM, Ritz-
Carlton

Baldrige Criteria
Leadership (125 points)
Strategic Planning (85 points)
Customer and Market Focus (85 points)
Information and Analysis (85 points)
Human Resource Focus (85 points)
Process Management (85 points)
Business Results (450 points)

The Deming Prize
Given by the Union of Japanese Scientists and
Engineers since 1951
Named after W. Edwards Deming who worked to
improve Japanese quality after WW II
Not open to foreign companies until 1984
Florida P & L was first US company winner
Based on how well a company applies Deming’s 14
points

ISO 9000
Set of international standards on quality
management and quality assurance, critical to
international business Data based approach to decision making Supplier relationships Continuous improvement Customer focus Leadership Employee training Process (operations) management