Embed Size (px)
Citation preview
CHAPTER 5 NONPOINT SOURCE ASSESSMENT, PRIORITIZATION, AND ACTIVITIES
This section of the Virginia Water Quality Assessment 305(b) Report includes an assessment of nonpoint source (NPS) pollution potential at the 6th level (12-digit) hydrologic units of the National Watershed Boundary Dataset (NWBD) (referred to as hydrologic units or units). It also includes indicators for prioritizing NPS corrective actions at the hydrologic unit level and a summary of NPS reduction activities currently underway. It has been prepared by the Virginia Department of Conservation and Recreation (VADCR) and the Virginia Department of Environmental Quality (VADEQ) to provide a comparative evaluation of the state's waters on a hydrologic unit basis. This comparative evaluation can be used to target limited resources and funds for NPS pollution reduction activities to areas where they are most needed. The key results of the assessment include statewide nutrient and sediment load quantification and a ranking of hydrologic units as high, medium or low priority based on those loads. The twelve pollutant based priority rankings are presented in a series of maps and tables for each major source sector including agriculture, forestry, and urban, with an additional series of maps representing the combined pollutant ranking. Some of these smaller tables and representative images of detailed downloadable maps and are shown in this chapter, while others are simply linked due to their sizes.
Collective Use Rankings
This assessment assigns sixteen total rankings to each hydrologic unit. There are twelve rankings that are for three nonpoint source pollutants (nitrogen, phosphorus, and sediment) classified by land use class (agricultural, forest, urban, and total). The four additional rankings include two for impaired waters occurrence and two for biological health. Each of these four is evaluated at six different levels (very high, high, moderate, low, none, and insufficient data); the remaining twelve rankings are evaluated at three different levels (high, medium, and low). The rankings can be used in various combinations to evaluate statewide conditions and prioritize NPS reduction activities. Which measures are included in each prioritization process and how one weighs in comparison to another depend on the activity to be prioritized. For instance, VADCR uses the agricultural NPS pollution rankings as variables in the targeting of agricultural best management practices (BMPs) (see Agricultural Cost Share Program below).
When constructing prioritization processes using these rankings, it is important to be aware of the different measures used in the rankings. Some measures are simulated NPS potential pollutant loads at the hydrologic unit of interest. Other measures reflect existing conditions at the unit of interest, such as aquatic species health, which may be partly due to pollutant loading activities occurring in upstream units. The source water concentration values directly account for the upstream effect by virtue of their being based on a designated upstream protection zone.
Another consideration is the potential to incorrectly infer cause and effect. Waters in a hydrologic unit may be impaired due to nonpoint sources, but the cause of impairment is not necessarily related to potential nitrogen, phosphorus, and sediment loadings in either the unit of concern or one upstream of it. Likewise, point source loadings may cause low biological integrity index scores and aquatic species ranks in a unit.
In the 2018 NPS Assessment and Prioritization, some units have been flagged for conditions that can be determined by comparing the rankings of measures in this report. The flags have been entered into the linked Table 5-3. The six conditions are:
1. Exceptional aquatic biodiversity. Eleven (11) units with biological integrity index scores of 24 or greater.
2. High aquatic biodiversity with high potential NPS pollutant loads. Eighteen (18) units with biological integrity index scores of 20 or greater and a total NPS pollutant load ranked “high.”
3. High public water supply protection need with high potential NPS pollutant loads. Seven (7) units with source water concentration values greater than 30 and a total NPS pollutant load ranked “high.”
Final 2018190
4. High public water supply protection need with NPS-impaired surface water at intake. Twelve (12) units with NPS-impaired waters immediately upstream of the source water intake.
5. Excessive agricultural nutrient loadings. Eight (8) units with potential agricultural nutrient unit area loads (either N or P) greater than four times the standard deviation from the mean agricultural nutrient unit area load.
6. Excessive agricultural sediment loadings. Nine (9) units with a potential agricultural sediment unit area load greater than four times the standard deviation from the mean agricultural sediment unit area load.
The 2018 NPS Assessment and Prioritization study summarizes existing sources of information, as referenced, and data provided by the following organizations: VADCR, VADEQ, Virginia Department of Forestry (VDOF), US Department of Agriculture - Natural Resources Conservation Service (USDA-NRCS), local Soil and Water Conservation Districts (SWCDs), Department of Biological Systems Engineering (BSE) at Virginia Tech (VT), Virginia Department of Health (VDH), Virginia Department of Game and Inland Fisheries (VDGIF), Virginia Department of Mines, Minerals, and Energy (VDMME), Center for Environmental Studies (CES) at Virginia Commonwealth University (VCU), US Environmental Protection Agency (EPA), Chesapeake Bay Program (CBP), US Geological Survey (USGS), Virginia Geographic Information Network (VGIN), US Department of Interior – Census Bureau, American Community Survey, and Climate Forecast System Re-analysis (CFSR).
There are four major components to the 2018 NPS Assessment and Prioritization study: I. Potential pollutant loadings, II. Water quality impairments. III. Measures of biological health, and IV. NPS reduction activities. The main focus of this chapter is the determination of potential loadings of total nitrogen (TN), total phosphorus (TP), and total sediment (TS) by hydrologic unit and agricultural, urban, and forest generalized land use classes. Table 5-1 describes the generalized land use classifications and details the contributing source areas in this assessment.
Table 5-1: Descriptions of Nonpoint Source Assessment Generalized Land UsesNonpoint Source Assessment Land Classifications
Source Data Descriptions
Forest Forest: Pine, Hardwood, MixedDisturbed Forest: Harvested forest stands
AgricultureCrop: Conventional Tillage, Conservation Tillage, HayPasture and Livestock: Unimproved Pasture, Pasture Cattle-Grazed, Pasture Poultry Litter Applied
Urban
Impervious: Pavement, Sidewalks, Roof Area, Compacted Areas, High Density ResidentialPervious: Lawns, Recreational Fields, Low to Medium Density Residential, Bare Soil, small groups of trees in urban areas
The evaluation of hydrologic units by aquatic species’ health represents water quality measures not necessarily related to the potential NPS pollutant loads. In order to prioritize clean-up and protection activities, hydrologic units related to the protection of public surface water supplies were also determined. Details of these components follow.
I. NPS Potential Pollutant Loadings
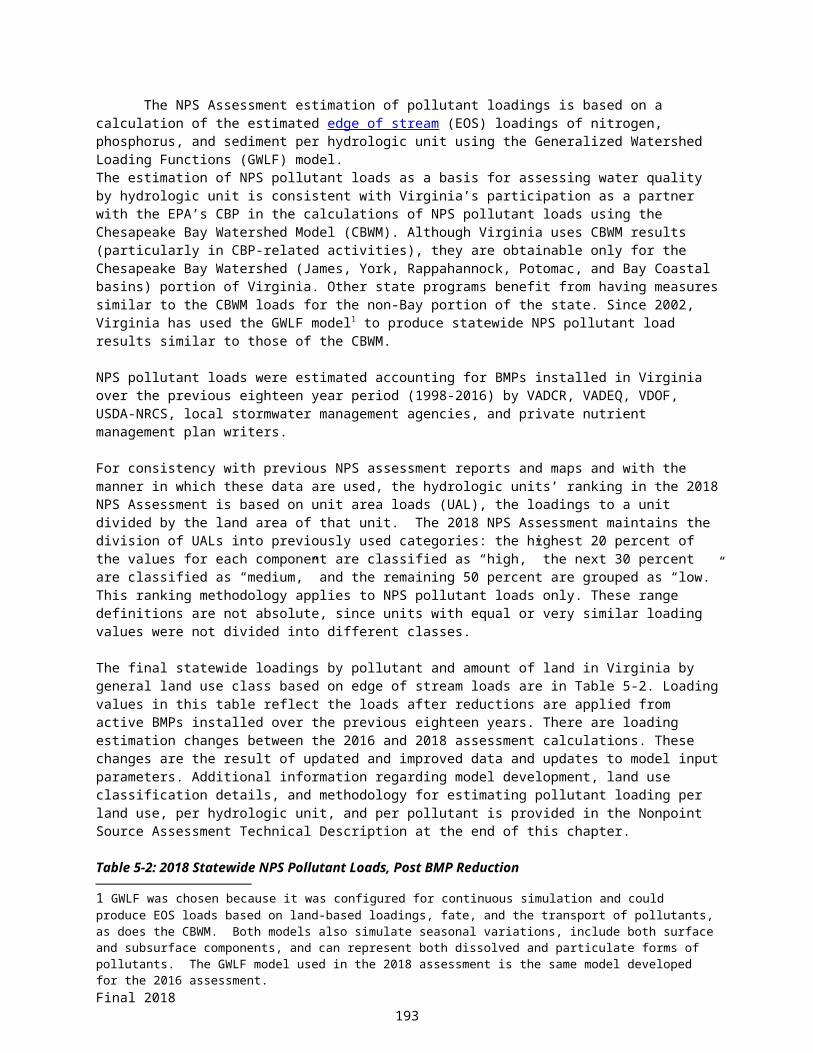
The NPS Assessment estimation of pollutant loadings is based on a calculation of the estimated edge of stream (EOS) loadings of nitrogen, phosphorus, and sediment per hydrologic unit using the Generalized Watershed Loading Functions (GWLF) model.
Final 2018191

The estimation of NPS pollutant loads as a basis for assessing water quality by hydrologic unit is consistent with Virginia’s participation as a partner with the EPA’s CBP in the calculations of NPS pollutant loads using the Chesapeake Bay Watershed Model (CBWM). Although Virginia uses CBWM results (particularly in CBP-related activities), they are obtainable only for the Chesapeake Bay Watershed (James, York, Rappahannock, Potomac, and Bay Coastal basins) portion of Virginia. Other state programs benefit from having measures similar to the CBWM loads for the non-Bay portion of the state. Since 2002, Virginia has used the GWLF model1 to produce statewide NPS pollutant load results similar to those of the CBWM.
NPS pollutant loads were estimated accounting for BMPs installed in Virginia over the previous eighteen year period (1998-2016) by VADCR, VADEQ, VDOF, USDA-NRCS, local stormwater management agencies, and private nutrient management plan writers.
For consistency with previous NPS assessment reports and maps and with the manner in which these data are used, the hydrologic units’ ranking in the 2018 NPS Assessment is based on unit area loads (UAL), the loadings to a unit divided by the land area of that unit. The 2018 NPS Assessment maintains the division of UALs into previously used categories: the highest 20 percent of the values for each component are classified as “high,” the next 30 percent are classified as “medium,” and the remaining 50 percent are grouped as “low.” This ranking methodology applies to NPS pollutant loads only. These range definitions are not absolute, since units with equal or very similar loading values were not divided into different classes.
The final statewide loadings by pollutant and amount of land in Virginia by general land use class based on edge of stream loads are in Table 5-2. Loading values in this table reflect the loads after reductions are applied from active BMPs installed over the previous eighteen years. There are loading estimation changes between the 2016 and 2018 assessment calculations. These changes are the result of updated and improved data and updates to model input parameters. Additional information regarding model development, land use classification details, and methodology for estimating pollutant loading per land use, per hydrologic unit, and per pollutant is provided in the Nonpoint Source Assessment Technical Description at the end of this chapter.
Table 5-2: 2018 Statewide NPS Pollutant Loads, Post BMP Reduction
UnitsAgricultura
l ClassUrban Class
Forestry Class
Other (Barren, Extractive,
Channel Erosion, Septic)
Total VA Land Area # Acres 4,689,438 2,898,225 17,437,340 70,267% of VA Land % 18.69 11.55 69.49 0.28
Total Nitrogen 106 Kg/year 30.10 21.36 14.37 10.37% of all NPS N ^ % 39.43 28.06 18.88 13.63
Total Phosphorus 106 Kg/year 1.43 1.01 0.65 0.27% of all NPS P ^ % 42.61 30.03 19.35 8.01
Total Sediment 106 Kg/year 1,145 194 586 427% of all NPS S ^ % 48.68 8.25 24.91 18.15
# Value does not include acres of non-forested wetlands (see Table 5-7).
1 GWLF was chosen because it was configured for continuous simulation and could produce EOS loads based on land-based loadings, fate, and the transport of pollutants, as does the CBWM. Both models also simulate seasonal variations, include both surface and subsurface components, and can represent both dissolved and particulate forms of pollutants. The GWLF model used in the 2018 assessment is the same model developed for the 2016 assessment.Final 2018
192
^ Loads from Channel Erosion and Septics, which may sometimes be attributed to other Land Use classification (e.g. urban), from hydromodification and other impacts, were separated into their own category ‘Other’ with Barren and Extractive sources.
Agricultural NPS Pollution Loads
Agriculture is a large and diverse industry in Virginia and accounted for almost 19 percent of Virginia's land use in the year being assessed. While this percentage is significantly lower than the national average and continues to decline in Virginia, agricultural activities remain the most significant source of NPS pollution in the state. As shown in Table 5-2 for 2018 and as all past assessment model results likewise suggest, agricultural land in Virginia contributes NPS pollutant loads in greater proportion to the area they comprise than do other land use classes.
Nonpoint source pollutants from agriculture originate from several different sources and have different associated impacts. Deposition to agricultural lands in the form of fertilizers and animal manures affect water quality when they reach groundwater reserves, are directly deposited to streams, or are washed into surface waters during rain events in either a dissolved state or with eroding soils. These sources produce pollutants which include bacteria (including possible pathogens) and nutrients. Farming practices can contribute to or retard runoff and can certainly affect the amount of soil lost from fields, which can potentially polluting water features.
This assessment estimated the nutrient and sediment loads from agricultural areas, but not pathogen loadings. Factors in this assessment which affect the amount of nutrient loads reaching water from agricultural lands include soil erodibility, types of agricultural practices, types and numbers of farm animals, land cover, stream density, rainfall, seasonal variations in plant growth and nutrient applications, existence and type of agricultural BMPs, soil saturation, and slope.
UALs ranked by hydrologic unit of nitrogen, phosphorus, and sediment from agricultural land uses are displayed in linked Figures 5-1, 5-2, and 5-3 , respectively. The rankings are also listed in Table 5-3 .
Figure 5-1 : Agricultural Nitrogen Unit Area Load Ranking
Final 2018193

There are a few factors that impact load calculations, and thus ranks, of the agricultural NPS pollutants between the current and past assessments. Perhaps the most significant factor is that dissolved nitrogen and phosphorus parameters were modified using updated documentation and sources (Draft Phase 6 Model Documentation). Otherwise, land use updates are once again a primary contributor to changing loads. Additional factors are noted below in the Nonpoint Source Assessment Technical Description.
Urban NPS Pollution Loads
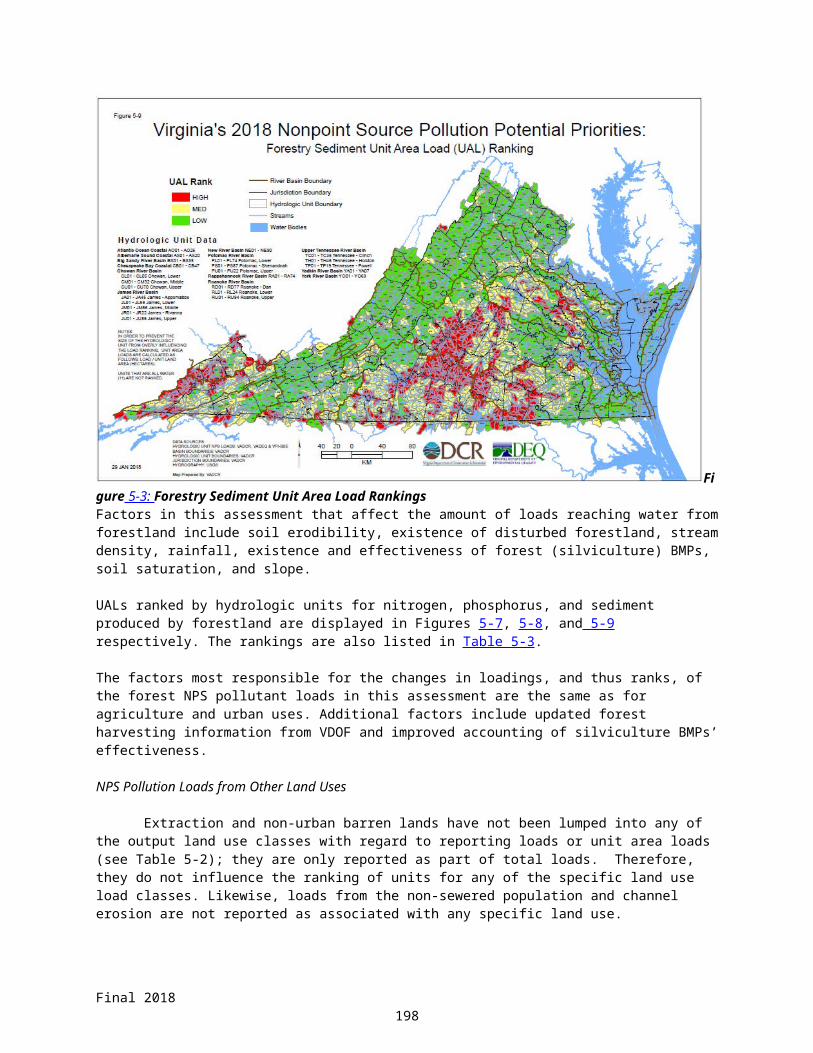
Around 11.5 percent of the land in Virginia was considered urban for the year being assessed. Urbanized land produces NPS pollutants as the result of precipitation washing nutrients, sediment, and toxic substances from the impervious surfaces found in these areas. The sources of these surface contaminants include: air and rain deposition of atmospheric pollution; littered and dirty streets; traffic by-products such as petroleum residues, exhaust products, heavy metals and tar residuals from the roads; chemicals applied for fertilization, control of ice, rodents and other pests; and sediment from construction sites. Improper industrial, commercial, and domestic connections to storm sewers also contribute various pollutants to waterways, as do inadequate and/or improperly maintained sewage disposal systems for both municipalities and individual homes.
This assessment estimated only nutrient and sediment NPS loads from urban areas. Factors that affect the amount of surface and channel erosion loads reaching water from urban lands include the degree of imperviousness, total impervious area, NPS pollutant build-up rates, stream density, rainfall, septic system use, direct discharges, soil saturation, and slope.
The main factors to causing changes in loadings, and thus ranks, of the urban NPS pollutants between the current and past assessment products are the same as for agricultural loads. These were updated land use, as well as updated model data, parameters, and procedures. Also, as in the past, septic loads were excluded from the reported urban load. Because septic loadings are not exclusive to the urban environment, they were simulated as an individual loading source in this assessment.
Figure 5-2: Urban Phosphorus Unit Area Load Ranking
Final 2018194

UALs ranked by hydrologic units for nitrogen, phosphorus, and sediment (as described in Table 5-2) from urban land uses are displayed in Figures 5-4, 5-5, and 5-6 , respectively. The rankings are also listed in Table 5-3. Urban load measures are based on pollution potential and do not compensate for many of the urban runoff pollution control measures that may be in place in some areas. Such pollutant reduction measures are often installed by the private sector or municipal and local governments.
Forestry NPS Pollution Loads
About 69.5 percent of Virginia’s land area was forested in the year being assessed. Forestland in general produces lower NPS pollutant loads2 per unit area than other land uses. Certain forest disturbing activities such as tree harvesting, site preparation, and reforesting, however, do contribute loads. As Table 5-2 shows, these activities contribute more to the sediment load than they do to other NPS pollutants.
Forestland can be harvested as part of a land use change such as residential development, clearing for agricultural fields, or surface mining. Due to the similar spectral signatures in classified land cover imagery of these land activities, as well as those of non-temporary land covers such as bare rock and beaches, it can be difficult to discern them from one another without other associated data. Fortunately, VDOF tracks forest harvesting activities to facilitate the proper management of Virginia's forest resources relative to water quality.
Agricultural activities operate on a yearly or seasonal cycle on agricultural lands, but a single cycle of forest harvesting, site-preparation, and reforestation occurs over many years. Due to temporal and spatial overlap in silviculture cycles, measurement of these forest-disturbing activities in this assessment is more of a snapshot than a trend. As such, the ranking of hydrologic units for forest-based loads varies more between NPS Assessments for forest harvesting units than do the loads of other land use classes when modeling and its parameters are kept constant.
Figure 5-3: Forestry Sediment Unit Area Load Rankings
2Airborne nutrient pollution is accounted for as part of the load of the land use it falls upon. The majority of the airborne nutrient load falls on forestland in Virginia and is therefore associated more with forestland than other uses.Final 2018
195
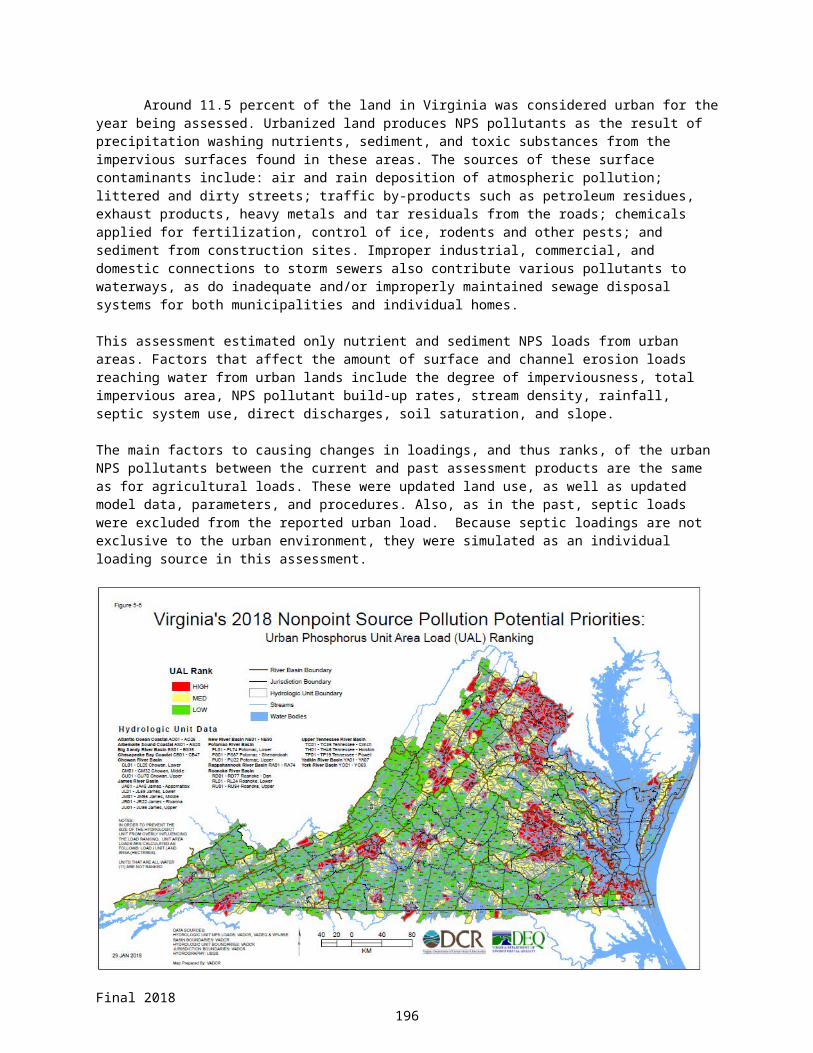
Factors in this assessment that affect the amount of loads reaching water from forestland include soil erodibility, existence of disturbed forestland, stream density, rainfall, existence and effectiveness of forest (silviculture) BMPs, soil saturation, and slope.
UALs ranked by hydrologic units for nitrogen, phosphorus, and sediment produced by forestland are displayed in Figures 5-7, 5-8, and 5-9 respectively. The rankings are also listed in Table 5-3.
The factors most responsible for the changes in loadings, and thus ranks, of the forest NPS pollutant loads in this assessment are the same as for agriculture and urban uses. Additional factors include updated forest harvesting information from VDOF and improved accounting of silviculture BMPs’ effectiveness.
NPS Pollution Loads from Other Land Uses
Extraction and non-urban barren lands have not been lumped into any of the output land use classes with regard to reporting loads or unit area loads (see Table 5-2); they are only reported as part of total loads. Therefore, they do not influence the ranking of units for any of the specific land use load classes. Likewise, loads from the non-sewered population and channel erosion are not reported as associated with any specific land use.
Resource extraction spatial data from VDMME allowed for the isolation of true extraction activities from reforesting sites, urbanization, or other land-disturbing activities. The spatial distribution of extraction land use was used in conjunction with county level recordings of extraction activity.
Approximately 8 percent of the phosphorous, 13.6 percent of the nitrogen, and 18 percent of the sediment load in the 2018 NPS Assessment was associated with loads from the non-sewered population, channel erosion, barren, and extractive land uses. The largest contributor of this group is the nitrogen load from failing septic systems and straight pipes (untreated). The most significant extraction land use loads occurred in the Big Sandy basin.
Total Loads by NPS Pollutant
Calculated total nitrogen, total phosphorus, and total sediment UAL from all land uses combined including the other uses noted above are displayed in linked Figures 5-10, 5-11, and 5-12 , respectively and listed in Table 5-3. Total nitrogen is composed of septic nitrogen, groundwater nitrogen, dissolved nitrogen from various land uses, wash-off nitrogen from impervious surfaces, and sediment-attached nitrogen. Total phosphorus is composed of septic phosphorus, groundwater phosphorus, dissolved phosphorus from various land uses, wash-off phosphorus from impervious surfaces, and sediment-attached phosphorus. Total sediment instream load is the sediment yield from all land uses plus instream erosion.
The summing of NPS pollutant loads by land use into total NPS pollutant loads in this assessment is achieved simply by the addition of values with equivalent units (kg/ha/yr of nitrogen or phosphorus, Mg/ha/yr of sediment). The relative amount of the estimated NPS pollutants coming from one land use versus another is directly comparable and this comparison shows that NPS pollutants from agricultural lands dominate the total NPS pollutant loads although barren lands can be heavy contributors where they occur in greater frequency.
II. WATER QUALITY IMPAIRMENTS
In accordance with EPA Clean Water Act (CWA) guidance and protocol, VADEQ assembled a list of the water-quality-limited riverine, lacustrine, and estuarine waters of Virginia (303d report) in 2016. That list and associated assessment geodatabase of water-quality-limited waters are the basis for the impaired waters portion of the 2018 NPS Assessment. Similar to the rankings of estimated pollutant loads, the impaired waters ranking presents a series of maps depicting, by hydrologic unit, the relative proportion of waters that appear to be impaired due to NPS pollution.
Final 2018196

Figure 5-4: Total Sediment Unit Area Load Rankings
Among the many defined attributes in the impaired waters assessment geodatabase are the names of the impaired waters, the beginning and ending spatial limits of the impaired portions, impairment causes, and impairment sources. Following is a brief overview of the generation of this prioritization ranking list and the evaluation of NPS-impacted waters, a subset of this assessment geodatabase. Included first were all the waters identified by VADEQ staff as having NPS-related pollution sources. Additionally, this ranking included impaired waters which either did not list any point-source-related causes or if sources were unknown, those in which the source was likely NPS (i.e., urban or natural),3 as corroborated by visual inspection of high resolution imagery of the surrounding watershed(s). Excluded from the ranking list are those waters listed as impaired for toxics or occurring in primarily estuarine-influenced areas.
Waters in the impaired waters layer that are suspected of being impaired due to nonpoint sources were divided by the hydrologic unit boundaries into segments to allow for the summation of impaired water lengths or areas by these units. The same process was performed on all waters in the state to determine the total miles of riverine, acres of lacustrine, and square miles of estuarine waters per hydrologic unit; this allows for comparison of the total miles with the impaired portions.
The 2018 NPS Assessment focuses on nutrients and sediment; however, most of the NPS-impaired waters from the 2016 303(d) report are listed due to the presence of excess fecal bacteria. Total Maximum Daily Load (TMDL) studies have shown that pet wastes can contribute to high pathogen counts in some urban streams. Concentrations of wildlife can have a similar effect in various land use/land cover settings. Likewise, human wastes from straight pipe disposal, failing septic systems, or malfunctioning water treatment plants and their permitted collection system infrastructure can all contribute to the impairment of waters due to high levels of fecal bacteria.
3 This included all fecal bacteria unknown sources since approximately 90% of non-urban fecal bacteria problems are surmised to be due to agricultural or natural animal loadings. Similarly, because about 85% of benthic impairments are believed to be sediment related, and because VADEQ personnel are more likely to know and document point sources of benthic impairments, all benthic impairments of unknown sources are considered to be NPS-related. Impairments with nutrient sources were also included. Final 2018
197
Based on TMDL studies completed to date, a significant number of the waters impaired due to the existence of pathogens are believed to be impaired because of farm animal wastes. The nutrient load calculation accounts for the number of farm animals by type and by unit, since most farm animal wastes are recycled back to the ground by the animals or in a more controlled mode by farmers who want to fertilize fields and/or remove wastes from confined animal sites. The controlled dispersal of wastes is a goal of nutrient management planning and a practice that VADCR cost-shares with farmers to implement. The fencing-off of streambanks and construction of alternative water sources are two such practices specifically designed to keep cattle out of and away from streams to avoid both sediment loading from eroded streambanks and direct deposition of manure and its associated bacteria load.
The following rankings of hydrologic units by water regime consider only non-shellfish NPS-associated impairments.
Riverine Impairments
The summed lengths of NPS-impaired riverine water features in 2016 as miles per hydrologic unit were compared to the total miles of riverine systems available per unit at the same scale4 to determine the percentage of the total available riverine water miles per unit that were potentially NPS-impaired. The resulting ranking of this value is based on the value itself and not on a pre-set distribution of the range of calculated percentage values. The rankings of units for impaired riverine waters are displayed in Figure 5-13 and listed in Table 5-3.
Estuarine Impairments
Most of the impaired mainstem estuarine water bodies in Virginia have listed impairment causes that are not considered to be due to practices occurring in the immediate units that they flow through. There may be very little land associated with some of these units. Estuarine waters are also tidal and may show pollution effects from multiple areas, even if they are not mainstem estuarine waterbodies. For these reasons, the estuarine waters were not used in this assessment to rank the hydrologic units they pass through. Although there are NPS-impaired estuarine waters, it is difficult to associate them with specific upland NPS pollutant sources.
Lacustrine Impairments
Summed areas of impaired lacustrine waters in 2016 as acres per hydrologic unit were compared to the total acres of lacustrine waters available per unit to determine the percentage of lake and reservoir waters in a unit that were impaired. Although the land area of these units can be a source of NPS pollutants, so too can the incoming streams.
The ranking of this value is based on the value itself and not on a pre-set distribution of the range of calculated percentage values. The vast majority of the hydrologic units in Virginia contained no impaired lake or reservoir waters in 2016. However, most of the remaining units had very high percentages of impaired lacustrine waters. This distribution is in part due to the decreased unit sizes of the 6 th level NWBD units but also attribution regarding their impairment source. The rankings of hydrologic units for impaired lacustrine waters are displayed in Figure 5-14 and listed in Table 5-3.
III. MEASURES OF BIOLOGICAL HEALTH
Additional tools for evaluating the effects of NPS pollution include the VDH public surface water sources and their protection zones and an evaluation of the health of aquatic species in the state’s waters conducted by CES at VCU. These geospatial metrics provide additional means to prioritize water quality protection, the protection of public drinking water sources and of natural aquatic communities, respectively.
44 Since 2014 the scale has been 1:24,000, augmented by the inclusion of smaller streams designated as impaired.Final 2018
198

Public Source Water Protection
As part of their Source Water Area Protection (SWAP) Program, VDH determined the area upstream of public surface water intakes that must be investigated for threats to water quality. The most immediate area of concern is referred to as Zone 1 for each intake. Zone 1 areas extend out to a five-mile radius upstream from a water supply intake or five miles around a lake containing an intake without crossing watershed boundaries, except those upstream. VADCR uses the population served by an intake (provided by VDH) and the portion of a hydrologic unit that is within a Zone 1 area to calculate the concentration of persons served per unit by these public surface water supplies. The concentration values serve as a measure of the importance of high water quality by hydrologic unit for public drinking water supply protection.
The categorized values and rankings for indicating concentration by unit are displayed in Figure 5-1 5 and listed in Table 5-3. Unlike the NPS loading variables in this assessment where high ranked units represent units of concern, the high ranking public source water units are those with a greater need for water quality protection because a significant amount of their area lies immediately upstream from surface drinking water intakes that are used by many people.
The vast majority of hydrologic units contained no Zone 1 protection zones or portions of Zone 1 protection zones. Of those with some Zone 1 content, the majority had low levels (< 10) of the calculated measure for concentrations of people served within a watershed. Of the remaining units, a few had significantly higher value measures (> 100) and were therefore classified as having a “Very High” need for source water protection. The rest were divided amongst a moderate category (10-30) and a high category (30-100).
Aquatic Species Measures
The presence or absence of certain aquatic species can serve as an indication of the overall ecological quality of a particular waterway. They can also indicate where the most biological damage can occur from water quality degradation. Accordingly, the NPS Assessment and Prioritization study provides a ranking of hydrologic units for stream-dependent living resources (including fish, mollusks, and crayfish) using a multi-metric index calculated by CES at VCU as part of their Interactive Stream Assessment Resource (INSTAR).
These indices (referred to as the mIBI - a modified version of the Index of Biological Integrity) are calculated by CES using databases originally developed by VADCR, VDGIF, and VCU.5 More than 162,000 database records from over 2,000 aquatic collections have been gathered since INSTAR’s inception. As a result, it is possible to calculate a mIBI value for more than 93 percent of the 6 th level units of the NWBD. An equally beneficial result of having more records available for any unit is the decreased likelihood of a false prioritization based on minimal information.
By associating a hydrologic unit code with each of the stream segments for which aquatic species information was available in the various databases, metric scores by unit were developed for each of six metrics. These metrics are as follows:
Metric 1 Number of Intolerant Species: refers to the total number of unique water quality intolerant species found in a unit.
Metric 2 Native Species Richness: refers to the number of indigenous (local) species present in a unit.
Metric 3 Number of Rare, Threatened, and Endangered Species: refers to the number of species that are considered rare, threatened, or endangered due to their low population levels present in a unit.
Metric 4 Number of Non-indigenous Species: refers to the number of non-native species present in a unit. These are introduced species that would not normally be found in this location.
Metric 5 Number of Critical Species: refers to the number of species found in a unit that are considered critical because of some important role they play, such as being a food source or a major recreational fishery.
55 More information about the mIBI and the other components of INSTAR can be found at INSTAR Healthy Waters.Final 2018
199

Metric 6 Number of Tolerant Species: refers to the number of species found in a unit that are tolerant of degraded stream conditions and can survive even in these sub-optimal conditions.
A score of 0 – 5 was assigned by CES for each metric based on the metric’s values. In general, high metric values were assigned high metric scores indicative of high stream health. A score of zero was given if insufficient data were available. Of the 1,251 hydrologic units, 86 (7 percent) were assigned a zero for this reason. Metrics 4 and 6 were reversed in the scoring, since a low value for either of these metrics would indicate high stream health and because a high number of non-native species and/or a high number of species that are tolerant to stream degradation are less desirable characteristics for a stream. Therefore, a high score was given for low metric values for these two measures.
Scores for each metric for each unit were totaled to give an overall mIBI score per hydrologic unit. These summed scores per hydrologic unit were then tiered relative to the summed scores of the other units in the same basin by assigning a category value of “High” (score of 5), “Medium” (score of 3), or “Low” (score of 1) on a per metric per basin basis. The resulting total mIBI scores are used to place each hydrologic unit into ranked categories reflecting biotic integrity and resource importance.
Since there were six metrics and a maximum score of 5 could be obtained for each metric, the overall maximum score a unit could receive was 30 (6 x 5). Fewer than 8 percent of the units (100) are considered to have very high biodiversity with total mIBI scores of 20 or more. Another 198 units have total mIBI scores of at least 18. At the other end of the spectrum, 24 percent of the units (301) with sufficient data have total metric scores of 12 or less, indicating low biodiversity. These units likely contain waters with some degree of degradation.
The categorization of the mIBI scores by hydrologic unit is displayed in Figure 5-1 6 , and listed in Table 5-3. In this figure and table, high mIBI scores equate to areas of high biotic integrity, which should be protected for their exceptional biodiversity. Low mIBI-ranked units represent units of concern in regard to low water quality based on aquatic species measures. There has been very little change in total mIBI scores over the past few years.
While the maintenance or enhancement of water quality for the protection of all native aquatic life is the preferred goal, these aquatic species priorities should help direct NPS pollution mitigation efforts and other water quality improvement projects toward hydrologic units with the most important aquatic resources. VADEQ collects additional fish and macroinvertebrate data that were not used in this assessment. This data is collected primarily in support of the freshwater probabilistic monitoring program. Additionally, the agency uses multimetric indices similar to the mIBI such as the Virginia Stream Condition Index, and the Virginia Coastal Plain macroinvertebrate index. These indices were developed for water quality assessment, rather than prioritization for NPS reduction planning. However, they may provide useful information for assessing potential nonpoint sources of pollution, as well. Future iterations of this report development process should include an evaluation of the usefulness of other methods and data sources for incorporating aquatic species measures.
IV. NPS REDUCTION ACTIVITIES
Efforts to reduce NPS pollution in Virginia have been undertaken by federal, state, regional, and local government agencies, as well as by citizen action. In many cases the activities are cooperatively performed and funded. Descriptions of cooperative NPS reduction activities can be found at the NPS Management Plan website and in the corresponding document. Most of these efforts target particular watersheds. Among them and elaborated upon at this site are TMDL studies and Implementation Plans, Nutrient Management, Agricultural Cost-Share incentive programs for BMP installations, and incentives for the set-aside of agricultural land.
Total Maximum Daily Loads
TMDLs, described elsewhere in this 305(b) report, are developed for waters that have been determined to be impaired and are so listed in Virginia’s EPA-approved 2016 303(d) report. Streams are
Final 2018200

not listed as impaired due to high concentrations of nitrogen, phosphorus, or sediment, but rather because they cannot support, or can only partially support, one or more of the five designated uses. This is because water quality standards do not exist for concentrations of these pollutants for free-flowing waters. Nevertheless, certain impairments are primarily caused by nitrogen, phosphorus, and/or sediment pollutants (see Section II. WATER QUALITY IMPAIRMENTS in this chapter), and VADEQ staff has often determined that there are nonpoint sources for these impairments. This section of the NPS Assessment provides an analysis and presents a map characterizing TMDLs, by hydrologic unit, where nonpoint sources appear to be dominant. Overall more than 6,695 of the 15,053 impaired river miles have been addressed by TMDLs. Likewise, TMDLs have been developed to address more than 13,224 acres of 93,125 impaired lake acres and 86 of 2,132 square miles of impaired estuaries (Categories 4A plus 5 from the 2016 305(b)/303(d) IR).
For TMDLs currently being developed, the hydrologic units were divided between those with and those without a predominant nonpoint source. Most of the water quality impairments in Virginia are due to NPS pollution. Consequently, most of the TMDLs being undertaken have a significant NPS component. These studies are focused on identifying the sources of the impairment, quantifying the loadings of these sources to waterbodies, and determining the load reduction needed to meet the designated use criteria. The development of an Implementation Plan (IP) is expected following the completion of a TMDL study for a particular watershed. Implementation of the plan’s course of action then follows.
Table 5-4a lists the NPS TMDL study reports (excluding estuarine, shellfish, and those developed for toxic pollutants), and Table 5-4b lists the NPS TMDL Implementations Plans and status as of June 30 2017. At that time, there were 87 completed, NPS-dominated TMDL Implementation Plans, addressing 683 unique riverine Category 4A assessment units (AUs) and six (6) reservoir 4A AUs, based on the 2016 303(d) list. These plans represent 3737 impaired riverine segment miles and 2975 impaired reservoir acres (ID305b Assessment Units from Virginia’s 2016 Integrated Report), and may address more than one pollutant per water segment. The number of TMDL implementation projects underway or completed is continually increasing. In addition, there were 234 NPS dominated TMDL studies that have been approved by the USEPA covering 481 unique hydrologic units with impaired segments for one or more pollutants. The number of TMDL study reports completed cannot be directly compared to Implementation Plans completed, as the geographic area and impaired waters included in each IP may vary. Implementation Plans may be developed for only a portion of a TMDL study or include areas from multiple adjacent studies with similar land uses and similar planned reduction strategies.
Though streams or waterbodies are listed as impaired in the 303(d) report, it is the watersheds of those impaired stream segments and waterbodies that are the focus of NPS pollutant reduction activities. The hydrologic units listed in Tables 5-4a and 5-4b are those in which some portion of the unit contains the listed impaired stream segment. Sometimes the entire area of the listed hydrologic unit is the watershed of the impaired stream segment, but often only a portion of that unit must be studied for a TMDL. Figure 5-17 shows the true TMDL study areas and thus gives a better indication of the geographic extent of where work is being performed. One difficulty in geographically representing the extent of multiple TMDL areas is that they often overlap; the watershed of a TMDL for a headwaters stream becomes part of the watershed of a TMDL for a larger water feature downstream, perhaps with a different pollutant/stressor. In Figure 5-17 , the latest EPA-approved TMDL coverage area is displayed by impairment type. Figure 5-18 likewise shows the true TMDL Implementation Plan areas by status, and which also include geographic overlap.
Final 2018201
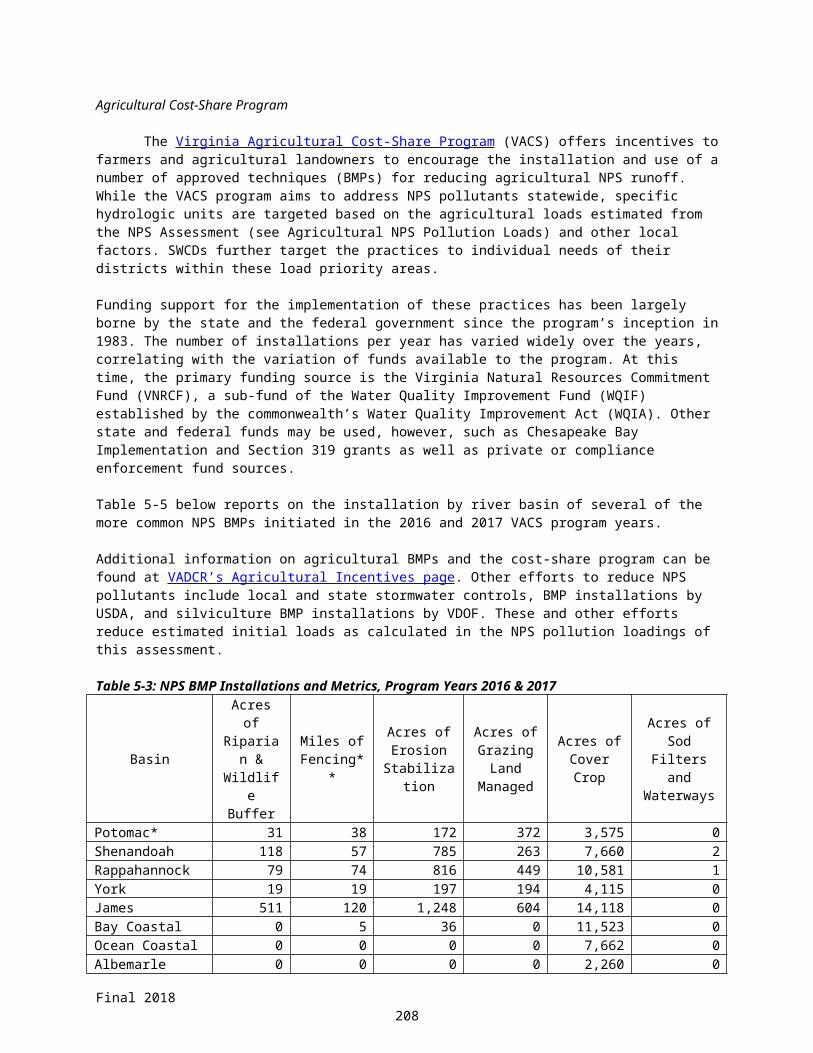
Agricultural Cost-Share Program
The Virginia Agricultural Cost-Share Program (VACS) offers incentives to farmers and agricultural landowners to encourage the installation and use of a number of approved techniques (BMPs) for reducing agricultural NPS runoff. While the VACS program aims to address NPS pollutants statewide, specific hydrologic units are targeted based on the agricultural loads estimated from the NPS Assessment (see Agricultural NPS Pollution Loads) and other local factors. SWCDs further target the practices to individual needs of their districts within these load priority areas.
Funding support for the implementation of these practices has been largely borne by the state and the federal government since the program’s inception in 1983. The number of installations per year has varied widely over the years, correlating with the variation of funds available to the program. At this time, the primary funding source is the Virginia Natural Resources Commitment Fund (VNRCF), a sub-fund of the Water Quality Improvement Fund (WQIF) established by the commonwealth’s Water Quality Improvement Act (WQIA). Other state and federal funds may be used, however, such as Chesapeake Bay Implementation and Section 319 grants as well as private or compliance enforcement fund sources.
Table 5-5 below reports on the installation by river basin of several of the more common NPS BMPs initiated in the 2016 and 2017 VACS program years.
Additional information on agricultural BMPs and the cost-share program can be found at VADCR’s Agricultural Incentives page. Other efforts to reduce NPS pollutants include local and state stormwater controls, BMP installations by USDA, and silviculture BMP installations by VDOF. These and other efforts reduce estimated initial loads as calculated in the NPS pollution loadings of this assessment.
Table 5-3: NPS BMP Installations and Metrics, Program Years 2016 & 2017
Basin
Acres of Riparian &
Wildlife Buffer
Miles of Fencing**
Acres of Erosion
Stabilization
Acres of Grazing
Land Managed
Acres of Cover Crop
Acres of Sod Filters and Waterways
Potomac* 31 38 172 372 3,575 0Shenandoah 118 57 785 263 7,660 2Rappahannock 79 74 816 449 10,581 1York 19 19 197 194 4,115 0James 511 120 1,248 604 14,118 0Bay Coastal 0 5 36 0 11,523 0Ocean Coastal 0 0 0 0 7,662 0Albemarle Sound 0 0 0 0 2,260 0Chowan 130 2 294 2 3,898 0Roanoke 195 137 804 566 2,840 7Yadkin 2 0 0 0 40 0New 170 30 66 281 1,975 0Clinch/Powell 12 23 0 354 0 0Holston 229 17 249 92 1,726 0Big Sandy 0 1 0 10 0 0TOTAL 1,496 523 4,667 3,187 71,973 10*excludes the Shenandoah** fencing may be for stream exclusion and/or grazing management
Final 2018202

Conservation Reserve Enhancement Program
The USDA’s Conservation Reserve Program (CRP) provides incentives for the removal of agricultural land from production to protect environmentally sensitive land alongside rivers and streams. The Virginia Conservation Reserve Enhancement Program (CREP) augments CRP by providing state-enhanced cost-share and rental payments for conservation practices focused on the restoration of riparian buffers and wetlands. CREP also funds the purchase of conservation easements on the restored riparian buffers.
Most, but not all areas of the state qualify for CREP assistance. Maps showing where CREP assistance is available can be found at the VADCR’s “Virginia’s CREP Areas” page. The metrics reported in Table 5-5 reflect implementation supported by CREP and CRP funding during this period.
Nutrient Management
Virginia’s Nutrient Management Program established in the Code of Virginia §10.1-104.2 and administered by VADCR is designed to develop detailed plans for the most efficient use of fertilizers and manures on farms and urban lands in the commonwealth. Plans are customized to fit a particular operation: the potential productivity of each field and crop is considered along with an inventory of available nutrients from the soil, crop residues, manures, and commercial fertilizers. Nutrient management plans are flexible, based upon crop responses to nutrients, and focus on efficiently using those nutrients.
In Virginia, nutrient management plans are created by certified plan writers including nutrient management specialists employed by VADCR. These specialists offer hands-on assistance with soil and tissue sampling, the use of soil surveys, equipment calibrations, and result interpretation to improve farm nutrient use efficiency. VADCR has 14 staff specialists who assist farmers in developing and implementing nutrient management plans statewide.
Private sector certified planners account the majority of reported planned acres each year. Statewide, there are currently 476 certified plan writers. Of these, 344 are certified to write agricultural plans, 169 are certified urban plan writers, and 37 are certified to write both agricultural and urban plans. For the period ending in 2017, there are over 914,000 acres statewide with a current nutrient management plan. Table 5-6 presents details of acres under active plans in 2017. Additional information on the commonwealth’s nutrient management program can be found at the Virginia Department of Conservation and Recreation’s Virginia’s Nutrient Management Program page .
Table 5-4: Acres Placed Under a Nutrient Management Plan, as of 9/30/2017
Basin Crop Acres Hay Acres
Pasture Acres
Specialty Crop Acres
Turf & Landscape Acres
Albemarle Sound 24,395 932 369 174 664Atlantic Coastal 21,248 0 58 711 67Big Sandy 0 44 213 0 0Chowan 121,026 4,019 979 119 1,282New 6,965 4,835 6,703 163 815Roanoke 17,546 12,052 4,225 14 2,001Clinch/Powell 481 1,917 3,519 14 45Holston 4,247 4,553 8,131 131 104Yadkin 0 0 0 0 0Non-Bay Total 195,908 28,352 24,197 1,325 4,979Bay Coastal 69,510 186 53 1,569 882James 102,036 37,736 15,583 967 6,781Potomac ** 50,325 7,511 6,406 332 3,762Shenandoah 42,954 37,028 28,407 723 535Rappahannock 113,854 14,236 9,655 1,290 1,360York 92,997 7,936 3,973 107 871
Final 2018203
Basin Crop Acres Hay Acres
Pasture Acres
Specialty Crop Acres
Turf & Landscape Acres
Bay Total 471,674 104,633 64,076 4,989 14,190Grand Total 667,582 132,985 88,273 6,314 19,169
** excludes the Shenandoah
.
Final 2018204
Nonpoint Source Assessment Technical Description
Model Development and Estimation of Pollutant Loadings
The GWLF NPSA 2018 model was calibrated for use in Virginia’s NPS Assessment by VT BSE prior to the 2016 assessment model runs. Because only two years have elapsed since major changes were made to several of the modeling parameters, the values of those parameters were reevaluated, and only a few were updated for this assessment. Explicit 2018 version revisions to GWLF modeling, calculations, and approach include:
1. A unit area load modification for dissolved nitrogen and phosphorus runoff parameters utilizing
the Chesapeake Bay Program (CBP) documentation for unit area loadings from land uses which were simulated in the new CBP phase 6 watershed model (increasing simulated N and P export from all land uses, as compared to the 2016 simulation). Table 5.7 details the changes to simulated dissolved nutrient parameters for each land use and region between the 2016 and 2018 assessments.
Model input data updates for the simulation period included:
1. Land uses from information compiled from the USDA-NASS cropland data layer, Virginia High Resolution Land Use, Ag census, VADCR, VDMME, and VDOF.
2. Farm animal numbers and distribution, as well as corresponding manure generated.3. Completed Version 5 of the 6th level hydrologic unit system for Virginia.4. Non-sewered population calculations and distribution.5. BMP generalized pass-through factors from information provided by localities, VADCR, VDH,
VDMME, and NRCS on BMP installations.
For the 2016 GWLF model, a hydrologic calibration was performed using the observed conditions at 113 monitoring sites across Virginia as assembled by the CBP Office primarily from USGS and VADEQ for the CBWM. Calibration watersheds were created that corresponded to these monitoring station points and were as consistent as possible with existing NWBD unit boundaries. However, there are portions of Virginia downstream of these monitoring sites that could not be calibrated in this manner. To calibrate the model for these portions of the state, BSE defined six physiographic regions covering Virginia. Regions were composed of aggregated 6th level NWBD units that were adjusted to coincide with the aforementioned calibration points. A limited set of parameter values were then modified by region during the calibration process of the upstream calibration watersheds until flows simulated by the GWLF model output were sufficiently similar to the observed data. Final parameter values per region were then assigned to the downstream portion of each region. The 2018 GWLF assessment model utilized the 2016 hydrologic calibration with the above mentioned modifications to model parameters and inputs. The 2018 GWLF assessment runs used and produced data for 1240 of the 1251 6th level hydrologic units in Virginia; the other 11 are exclusively water. GWLF assessment runs in 2018 used a land use/land cover data set developed by VADCR from a number of sources6 to represent 2016 conditions. The 2016 conditions were simulated to align with dates of the latest land cover data available when the 2018 NPS Assessment occurred.
6 The base spatial layer for the 2016 land use/land cover data set was the 2016 Virginia High Resolution Land Use layer. Agricultural uses were modified using the USDA NASS, as well as tillage practice surveys by VADCR (2015 and 2016). Barren classes were modified using data from VDMME. Disturbed forest was determined with the help of VDOF timber harvesting data. Additional classes were based on processes developed for VADCR by The Academy of Natural Sciences of Philadelphia (1997) using data from Virginia’s confined animal databases.Final 2018
205
Table 5-5 Dissolved Nutrient Parameter Values
2016 2018 2016 2018Land Use NPSA Region N KG/HA N KG/HA P KG/HA P KG/HA
Conventional Tillage Coastal Plain 2.20 30.91 0.18 1.30
Conventional TillageMountain and
Valley 3.08 30.79 0.35 2.65Conventional Tillage Piedmont 2.20 30.05 0.18 1.97Conservation Tillage Coastal Plain 4.20 28.78 0.90 0.98
Conservation TillageMountain and
Valley 5.51 27.59 1.13 1.28Conservation Tillage Piedmont 3.94 26.83 0.56 0.83Hay All 2.90 8.96 0.20 0.56Pasture Cattle-Grazed All 5.10 7.79 0.82 0.59Pasture with Poultry Litter All 11.50 17.56 3.00 2.16Unimproved Pasture All 2.90 4.43 0.20 0.14Forest All 0.13 1.41 0.01 0.05Disturbed Forest All 0.74 9.97 0.05 0.18Extraction/Barren All 0.74 22.32 0.05 3.24Impervious Urban All 2.05 16.79 0.25 0.76Pervious Urban All 2.05 6.28 0.25 0.88
Table 5-8 lists the land use classification system used in the GWLF assessment runs and the equivalent generalized model output land use classes. Spatially attributed BMP and nutrient management plan effects are measured as both land use changes7 to the aforementioned 2016 land use/land cover data set and as fractional reductions to the loadings by modeled land use.
7 It was not necessary to change the land use to represent land use change NPS BMPs in this assessment because they were already captured in the source data.
Final 2018206

Table 5-6: Land Use Classification
Original Source Class* Derived/Class NPS Assessment
Forest (VHRL) Forest Forest
Wetland (VHRL) - Emergent Wetland (CDL) Forest Forest
Trees (VHRL - portion) Forest Forest
Shrub/Scrub (VGIN) Disturbed Forest Forest
Barren Land (VGIN) Disturbed Forest Forest
Cropland (VHRL) Conventional Tillage Agriculture
Cropland (VHRL) Conservation Tillage Agriculture
Pasture (VHRL) Hay Agriculture
Hay (CDL) Unimproved Pasture Agriculture
Trees (VHRL - portion) Pasture Cattle-Grazed Agriculture
Farm Animals (USDA, VA) Pasture Poultry Litter Agriculture
Manure Acres Agriculture
Impervious Extracted (VHRL) Impervious Urban Urban
Impervious Local Data Impervious Urban Urban
Grass (VHRL) Pervious Urban Urban
Trees (VHRL – portion) Pervious Urban Urban
Barren Land (VHRL) Extraction/Barren Part of Total Only
Open Water (VHRL) Not Modeled
Emergent Wetland (CDL) Not Modeled
*VHRL: Virginia High Resolution Land use; CDL: USDA Cropland Data Layer; VGIN: Virginia Geographic Information Network
Output from the GWLF assessment runs are in the form of average annual loads (L) of each NPS pollutant (p: TN, TP, and TS) per modeled land use8 per unit. From this, two forms of unit area loads were calculated: (1) per hectare (h) of general output land use class (l: agriculture, urban, and forest) per hydrologic unit (w) load (luUAL) and (2) per hectare of total modeled land (a) per hydrologic unit (w) load (UAL).
8 Not all possible land uses were modeled (see Table 5-7). The area of a particular unit as used in these calculations would not include the hectares of non-modeled land uses occurring in that unit.Final 2018
207
The luUAL value is preferable to the load values themselves when comparing the loading impacts of the individual output land use classes between hydrologic units. They are normalized in that the size of the hydrologic unit does not impact this value. This measure can isolate high loading rates of the general land use classes. It is calculated as:
luUAL(plw) = L(plw) / h(lw)
While the above calculation is useful, it does not necessarily identify those hydrologic units in which NPS reduction activities should be focused.9 Therefore, the UAL was used for ranking hydrologic units in this assessment report, but significant luUAL values were used in flagging units in need of attention. The UAL per output land use class per pollutant for each hydrologic unit is calculated as follows:
UAL(plw) = L(plw) / h(aw)
The output loadings provide a statewide equivalent of the types of results that Virginia has been able to obtain from the CBWM for the Chesapeake Bay drainage area of the commonwealth over the last twenty years. Table 5-2 reports the final statewide loadings by pollutant by general land use class and the amount of land in Virginia by general land use class. Loading values in this table reflect the loads after the reductions are applied from active BMPs installed over the previous sixteen years.
Public Source Water Protection
Concentration values are the summation by hydrologic unit of all Zone 1 areas or combinations of Zone 1 areas in that unit times one one-thousandth of the effective population each serves. In cases where a municipality owned several intakes, the single recording of population served was divided amongst each intake to create an ‘effective population served.’ In cases of overlapping intake reaches, the effective population of each reach was summed for the portion of overlap.
9 For instance, units with high loading rates for agricultural land may only have a small amount of this land use and therefore small total loads of pollutants from agricultural uses. Furthermore, any action (if possible) in any year could encompass all reasonable reduction activities, thus making this hydrologic unit less worthy of further attention. Final 2018
208