Embed Size (px)
Citation preview
Chapter 5 Low Energy Prompt Neutron Radiation Phenomena
Page 5-1
5.1 Introduction In this chapter two phenomena are discussed that involve low-energy neutrons. These processes are the transmission of neutrons by penetrations and the control/prevention of neutron “skyshine". They arise at all accelerators that operate above the threshold for producing neutrons. The general behavior of both of these phenomena is nearly independent of incident particle type and energy. 5.2 Transmission of Photons and Neutrons Through Penetrations All accelerators evidence the need to control the transmission of neutrons by penetrations since all have access-ways to permit entry of personnel and equipment as well as penetrations for cables and for radio-frequency (RF) waveguides. Personnel access penetrations will typically have cross-sectional dimensions of about 1 meter by 2 meters (door-sized) while utility ducts will generally be much smaller, typically no larger than 0.2 by 0.2 m. Often the utility penetrations are partially filled with cables and other items, and even cooling water in pipes. Two general rules are advised for all penetrations of accelerator shielding: • A penetration should not be arranged so that a particle or photon beam is aimed
directly toward it. This is needed to assure that the penetrations are transmitting primarily neutrons that result from large angle scattering rather than those arising from the forward peaked neutron radiation fields or from the direct beam.
• For any labyrinth, the sum of the wall thickness between the source and the "outside"
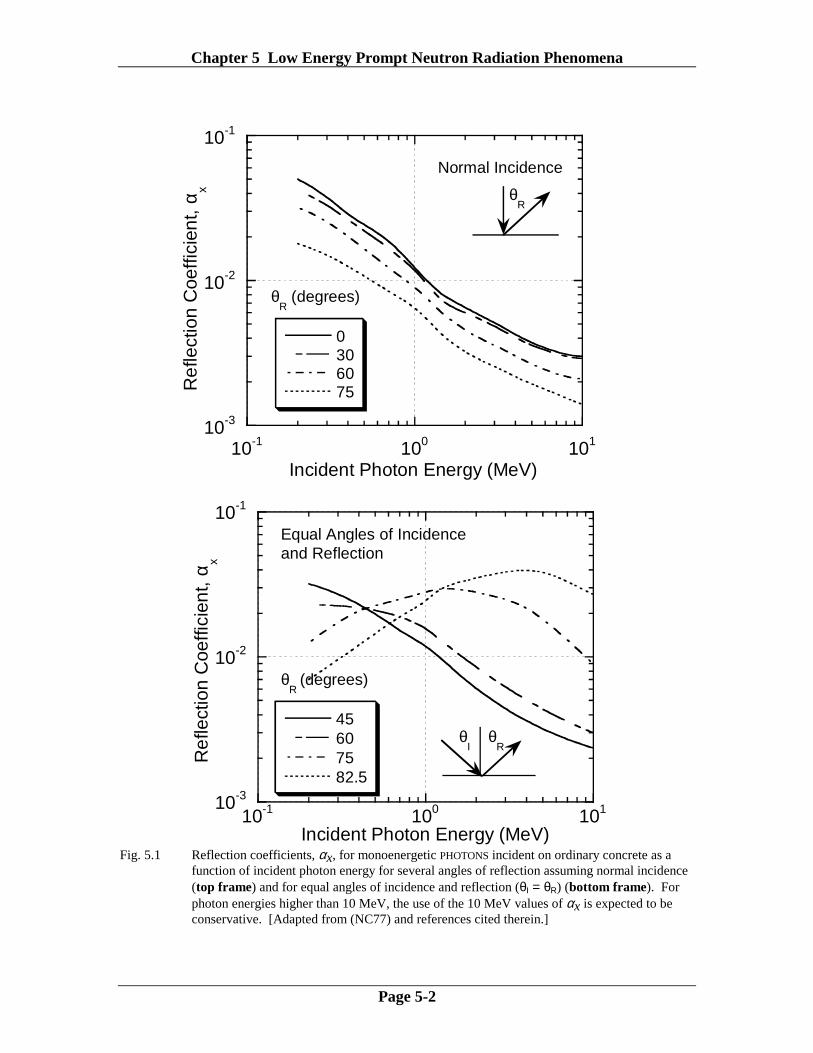
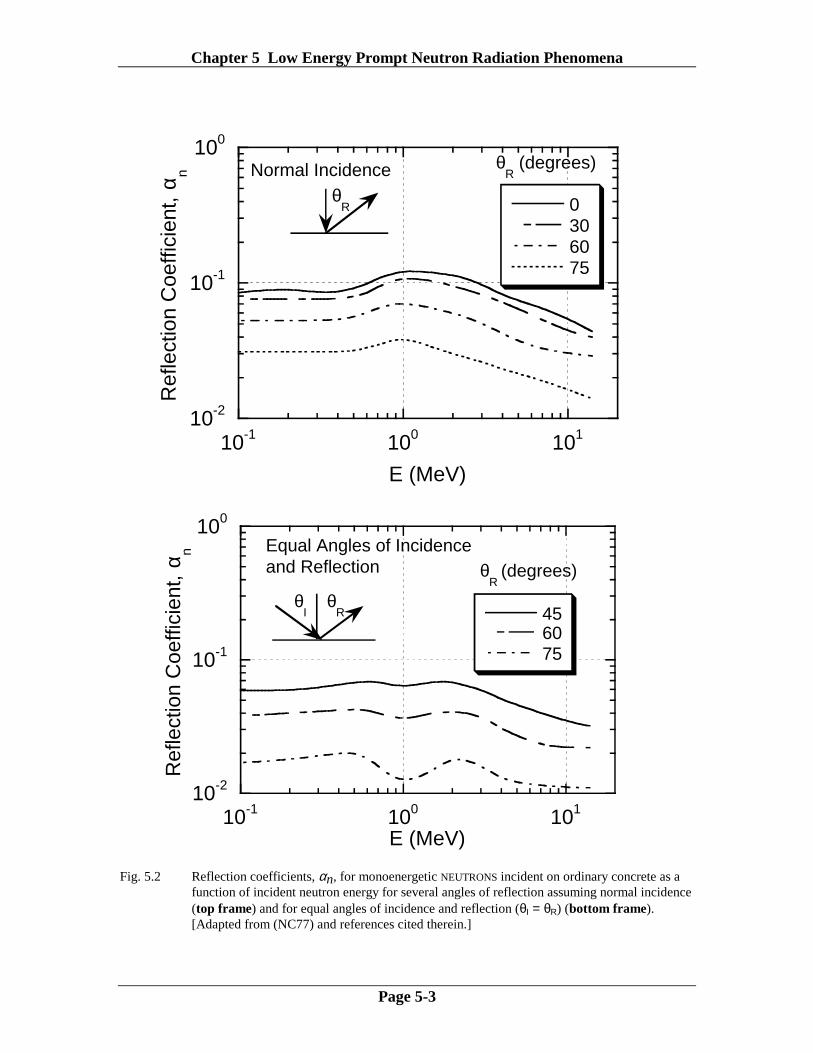
should be equivalent to that which would be required if the labyrinth were not present. 5.2.1 Albedo Coefficients Before describing the details of penetration design, one should review some simple parameterizations of the reflections of photons and neutrons. These reflections of can be treated through the use of reflection or albedo coefficients. Such coefficients account for the reflection of particles analogous to the reflection of visible light by various kinds of surfaces. They take into account the appropriate microscopic cross sections in a macroscopic way. These have applications more general than merely the design of penetrations. Figures 5.1 and 5.2 give the albedo coefficients αx and αn for monoenergetic photons and neutrons, respectively, incident on flat surfaces of infinite dimensions of concrete plotted as functions of energy for various conditions of incidence. As is obvious from these curves, the albedo of neutrons is typically larger and somewhat less strongly dependent on energy than is that of photons. Chilton et al. has given more detailed results for concrete and for other materials (Ch63, Ch64, Ch65a, Ch65b, and Ch84).
Chapter 5 Low Energy Prompt Neutron Radiation Phenomena
Page 5-2
10-3
10-2
10-1
10-1 100 101
0306075R
efle
ctio
n C
oeffi
cien
t, α x
Incident Photon Energy (MeV)
Normal Incidence
θR
θR (degrees)
10-3
10-2
10-1
10-1 100 101
45607582.5
Ref
lect
ion
Coe
ffici
ent,
α x
Incident Photon Energy (MeV)
Equal Angles of Incidenceand Reflection
θR
θR
(degrees)
θI
Fig. 5.1 Reflection coefficients, αx, for monoenergetic PHOTONS incident on ordinary concrete as a
function of incident photon energy for several angles of reflection assuming normal incidence (top frame) and for equal angles of incidence and reflection (θI = θR) (bottom frame). For photon energies higher than 10 MeV, the use of the 10 MeV values of αx is expected to be conservative. [Adapted from (NC77) and references cited therein.]
Chapter 5 Low Energy Prompt Neutron Radiation Phenomena
Page 5-3
10-2
10-1
100
10-1 100 101
0306075
Ref
lect
ion
Coe
ffici
ent,
α n
E (MeV)
θR (degrees)Normal Incidence
θR
10-2
10-1
100
10-1 100 101
456075
Ref
lect
ion
Coe
ffici
ent,
α n
E (MeV)
Equal Angles of Incidenceand Reflection θ
R (degrees)
θR
θI
Fig. 5.2 Reflection coefficients, αn, for monoenergetic NEUTRONS incident on ordinary concrete as a
function of incident neutron energy for several angles of reflection assuming normal incidence (top frame) and for equal angles of incidence and reflection (θI = θR) (bottom frame). [Adapted from (NC77) and references cited therein.]
Chapter 5 Low Energy Prompt Neutron Radiation Phenomena
Page 5-4
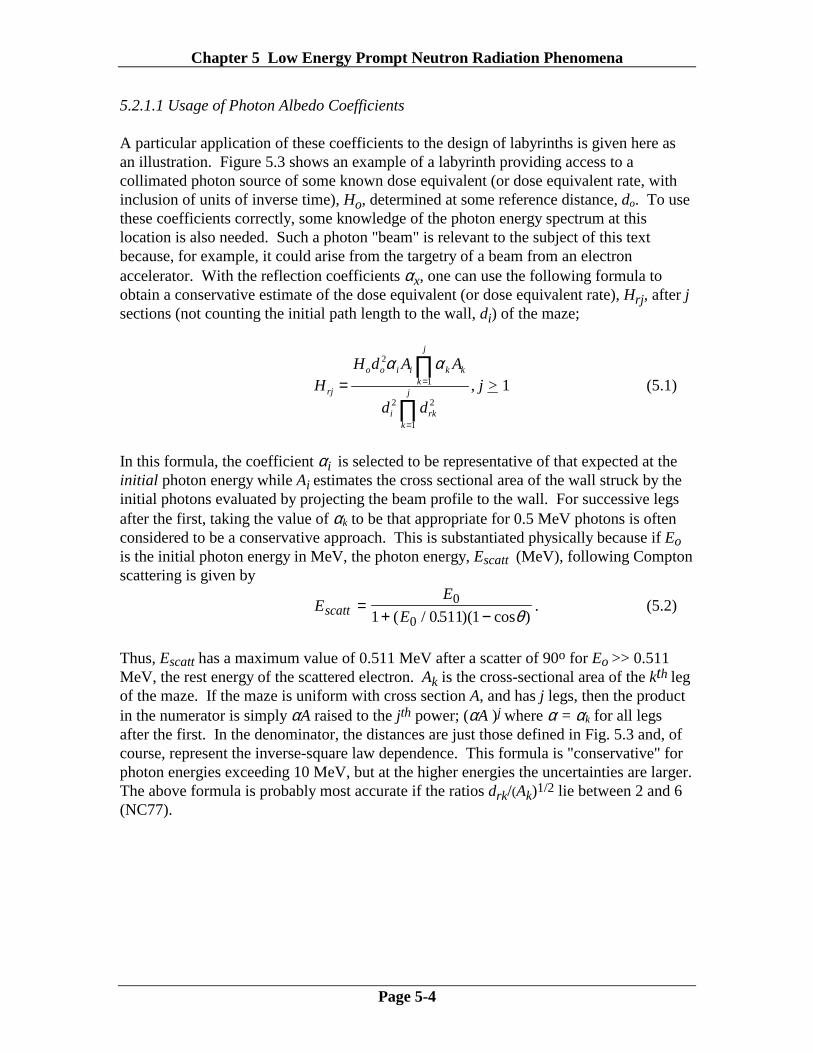
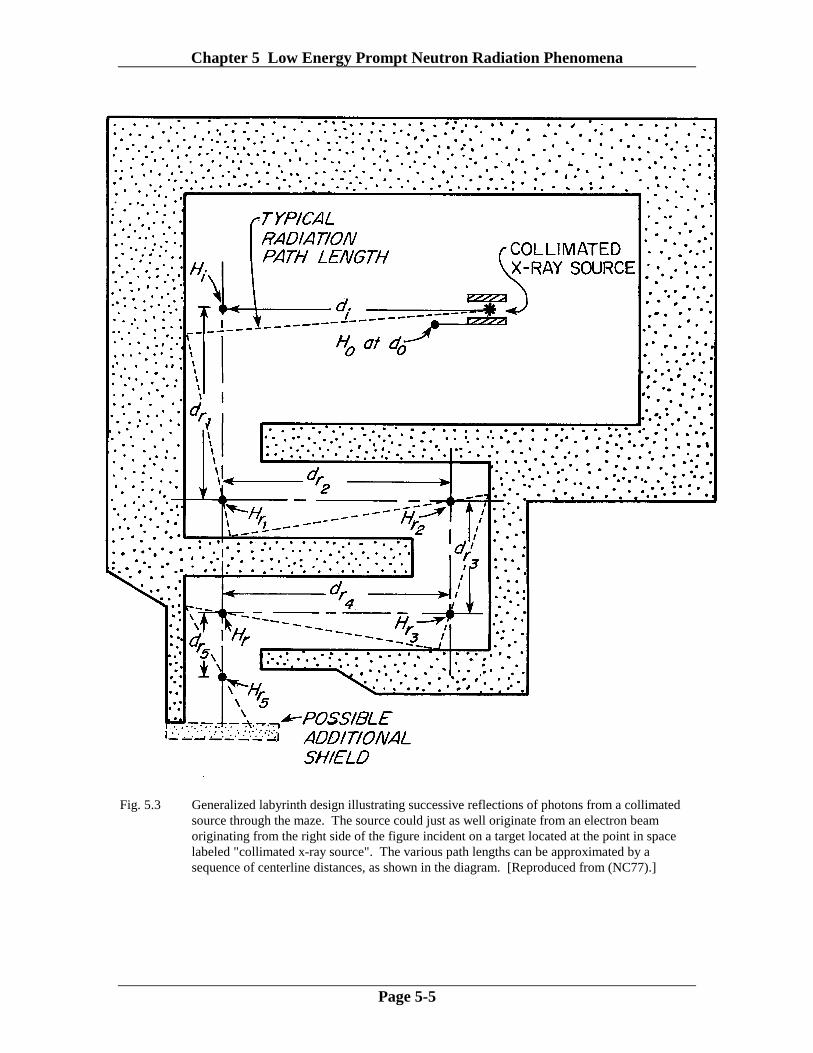
5.2.1.1 Usage of Photon Albedo Coefficients A particular application of these coefficients to the design of labyrinths is given here as an illustration. Figure 5.3 shows an example of a labyrinth providing access to a collimated photon source of some known dose equivalent (or dose equivalent rate, with inclusion of units of inverse time), Ho, determined at some reference distance, do. To use these coefficients correctly, some knowledge of the photon energy spectrum at this location is also needed. Such a photon "beam" is relevant to the subject of this text because, for example, it could arise from the targetry of a beam from an electron accelerator. With the reflection coefficients αx, one can use the following formula to obtain a conservative estimate of the dose equivalent (or dose equivalent rate), Hrj, after j sections (not counting the initial path length to the wall, di) of the maze;
2
1
2 2
1
j
o o i i k kk
rj j
i rkk
H d A AH
d d
α α=
=
=∏
∏, j > 1 (5.1)
In this formula, the coefficient αi is selected to be representative of that expected at the initial photon energy while Ai estimates the cross sectional area of the wall struck by the initial photons evaluated by projecting the beam profile to the wall. For successive legs after the first, taking the value of αk to be that appropriate for 0.5 MeV photons is often considered to be a conservative approach. This is substantiated physically because if Eo is the initial photon energy in MeV, the photon energy, Escatt (MeV), following Compton scattering is given by
EE
Escatt =+ −
0
01 0511 1( / . )( cos )θ. (5.2)
Thus, Escatt has a maximum value of 0.511 MeV after a scatter of 90o for Eo >> 0.511 MeV, the rest energy of the scattered electron. Ak is the cross-sectional area of the kth leg of the maze. If the maze is uniform with cross section A, and has j legs, then the product in the numerator is simply αA raised to the jth power; (αA )j where α = αk for all legs after the first. In the denominator, the distances are just those defined in Fig. 5.3 and, of course, represent the inverse-square law dependence. This formula is "conservative" for photon energies exceeding 10 MeV, but at the higher energies the uncertainties are larger. The above formula is probably most accurate if the ratios drk/(Ak)1/2 lie between 2 and 6 (NC77).
Chapter 5 Low Energy Prompt Neutron Radiation Phenomena
Page 5-5
Fig. 5.3 Generalized labyrinth design illustrating successive reflections of photons from a collimated
source through the maze. The source could just as well originate from an electron beam originating from the right side of the figure incident on a target located at the point in space labeled "collimated x-ray source". The various path lengths can be approximated by a sequence of centerline distances, as shown in the diagram. [Reproduced from (NC77).]
Chapter 5 Low Energy Prompt Neutron Radiation Phenomena
Page 5-6
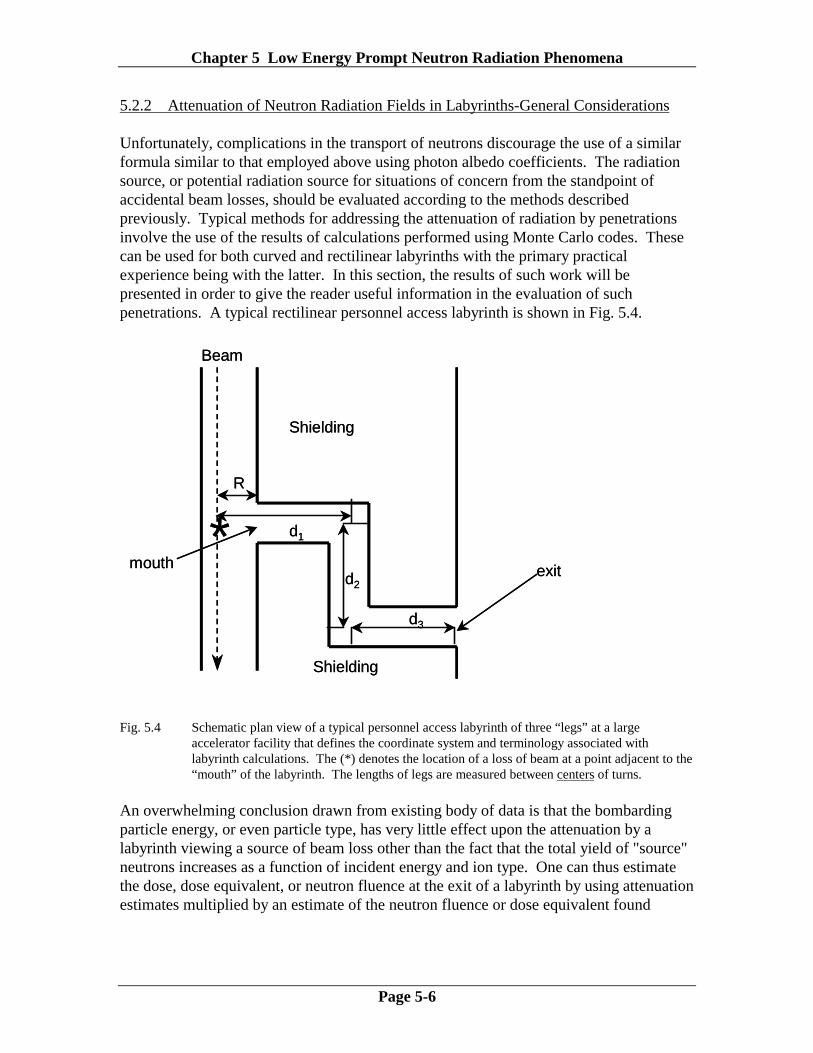
5.2.2 Attenuation of Neutron Radiation Fields in Labyrinths-General Considerations Unfortunately, complications in the transport of neutrons discourage the use of a similar formula similar to that employed above using photon albedo coefficients. The radiation source, or potential radiation source for situations of concern from the standpoint of accidental beam losses, should be evaluated according to the methods described previously. Typical methods for addressing the attenuation of radiation by penetrations involve the use of the results of calculations performed using Monte Carlo codes. These can be used for both curved and rectilinear labyrinths with the primary practical experience being with the latter. In this section, the results of such work will be presented in order to give the reader useful information in the evaluation of such penetrations. A typical rectilinear personnel access labyrinth is shown in Fig. 5.4.
Fig. 5.4 Schematic plan view of a typical personnel access labyrinth of three “legs” at a large
accelerator facility that defines the coordinate system and terminology associated with labyrinth calculations. The (*) denotes the location of a loss of beam at a point adjacent to the “mouth” of the labyrinth. The lengths of legs are measured between centers of turns.
An overwhelming conclusion drawn from existing body of data is that the bombarding particle energy, or even particle type, has very little effect upon the attenuation by a labyrinth viewing a source of beam loss other than the fact that the total yield of "source" neutrons increases as a function of incident energy and ion type. One can thus estimate the dose, dose equivalent, or neutron fluence at the exit of a labyrinth by using attenuation estimates multiplied by an estimate of the neutron fluence or dose equivalent found
Beam
*R
d1
d2
d3
Shielding
Shielding
mouth exit
Beam
*R
d1
d2
d3
Shielding
Shielding
mouth exit

Chapter 5 Low Energy Prompt Neutron Radiation Phenomena
Page 5-7
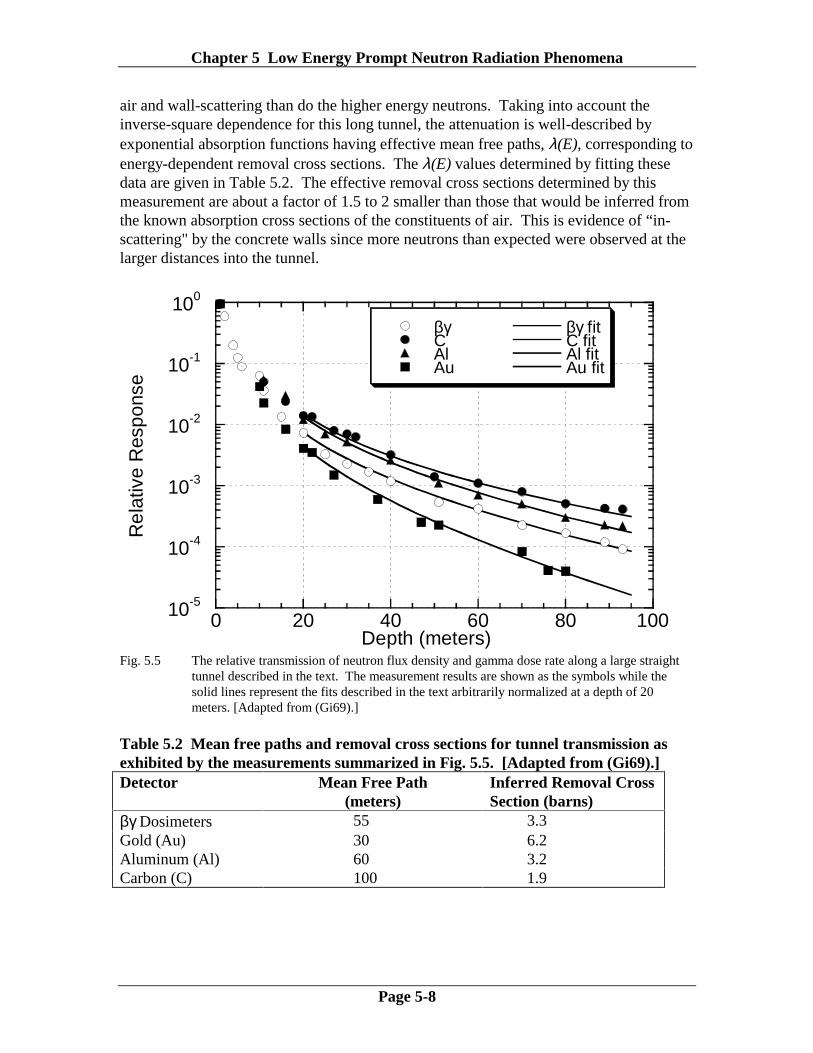
at the entrance of the penetration into the beam enclosure. This "factorization" approximation allows attenuation measurements and calculations obtained at proton accelerators to be of rather general utility. 5.2.3 Attenuation in Straight Penetrations or the First Leg of Rectilinear Penetrations For penetrations exposed to targets struck by hadrons, we first consider the straight penetration studied by Gilbert et al. (Gi69) who measured the transmission of an exceptionally long straight tunnel of dimensions 2.8 m high by 1.8 m wide and 100 m long. 14 GeV protons were incident on a target providing a good "point source" 3.2 m from the tunnel mouth. The use of a set of activation detectors having different energy thresholds made it possible to obtain some information about the neutron energy spectrum as well. The measurement technique employed will be discussed in somewhat more detail in Chapter 9. The experimental conditions did not allow an absolute normalization to beam loss. Table 5.1 gives the thresholds, or approximate sensitive ranges, of nuclear reactions used in this particular measurement (See Section 9.5.3). The dosimeters used to detect photons are also sensitive to gamma rays produced by the capture of neutrons by the nuclei in the air and in the tunnel walls. Table 5.1 Detectors and their characteristics as used in the measurements summarized in Fig. 5.5. The sensitive energy ranges are approximate [Adapted from (Gi69)]. Detector Nuclear Reaction Energy Range (MeV) βγ Dosimeters photons and charged particles all Gold (Au) 197Au(n,γ)198Au Thermal Energies Aluminum (Al) 27Al(n,α)24Na E > 6 MeV Carbon (C) 12C(n,2n)11C E > 20 MeV The results of the measurements are presented in Fig. 5.5. The “fits” to the relative response, R, as a function of depth in the penetration, d, shown in this figure were arbitrarily normalized to the measurements at a depth of 20 meters in the tunnel and assumed an exponential attenuation multiplied by an inverse square-law dependence;
2
20
20( ) exp[ / ( )]R d R d E
dλ = −
, (5.3)
where R20 is the response measured at d = 20 meters and λ(E) is an energy-dependent attenuation length. The responses as a function of depth d are quite revealing. For short tunnels (< 20 m long) the "attenuation" of the fast neutrons is almost entirely accounted for by inverse- square law considerations. For larger depths, the responses clearly illustrate that neutrons of lower energy (i.e., as illustrated by the response using Au) attenuate more rapidly by
Chapter 5 Low Energy Prompt Neutron Radiation Phenomena
Page 5-8
air and wall-scattering than do the higher energy neutrons. Taking into account the inverse-square dependence for this long tunnel, the attenuation is well-described by exponential absorption functions having effective mean free paths, λ(E), corresponding to energy-dependent removal cross sections. The λ(E) values determined by fitting these data are given in Table 5.2. The effective removal cross sections determined by this measurement are about a factor of 1.5 to 2 smaller than those that would be inferred from the known absorption cross sections of the constituents of air. This is evidence of “in-scattering" by the concrete walls since more neutrons than expected were observed at the larger distances into the tunnel.
10-5
10-4
10-3
10-2
10-1
100
0 20 40 60 80 100
βγCAlAu
βγ fitC fitAl fitAu fit
Rel
ativ
e R
espo
nse
Depth (meters) Fig. 5.5 The relative transmission of neutron flux density and gamma dose rate along a large straight
tunnel described in the text. The measurement results are shown as the symbols while the solid lines represent the fits described in the text arbitrarily normalized at a depth of 20 meters. [Adapted from (Gi69).]
Table 5.2 Mean free paths and removal cross sections for tunnel transmission as exhibited by the measurements summarized in Fig. 5.5. [Adapted from (Gi69).] Detector Mean Free Path
(meters) Inferred Removal Cross Section (barns)
βγ Dosimeters 55 3.3 Gold (Au) 30 6.2 Aluminum (Al) 60 3.2 Carbon (C) 100 1.9
Chapter 5 Low Energy Prompt Neutron Radiation Phenomena
Page 5-9
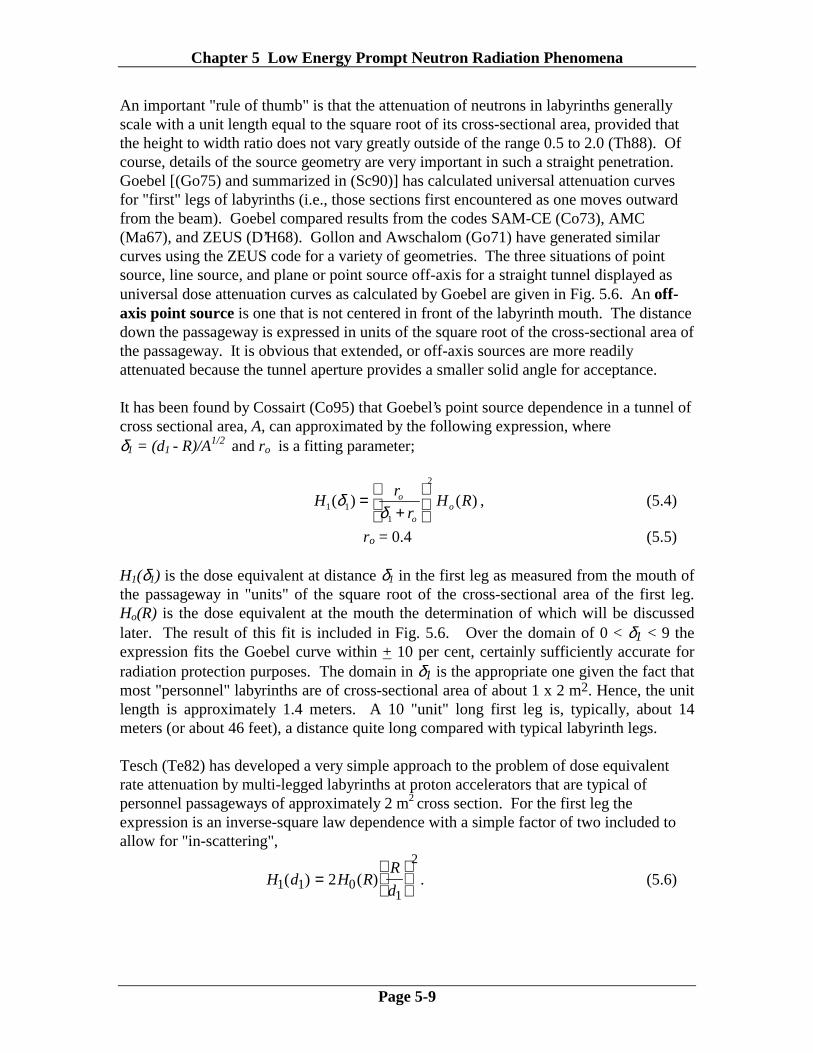
An important "rule of thumb" is that the attenuation of neutrons in labyrinths generally scale with a unit length equal to the square root of its cross-sectional area, provided that the height to width ratio does not vary greatly outside of the range 0.5 to 2.0 (Th88). Of course, details of the source geometry are very important in such a straight penetration. Goebel [(Go75) and summarized in (Sc90)] has calculated universal attenuation curves for "first" legs of labyrinths (i.e., those sections first encountered as one moves outward from the beam). Goebel compared results from the codes SAM-CE (Co73), AMC (Ma67), and ZEUS (D’H68). Gollon and Awschalom (Go71) have generated similar curves using the ZEUS code for a variety of geometries. The three situations of point source, line source, and plane or point source off-axis for a straight tunnel displayed as universal dose attenuation curves as calculated by Goebel are given in Fig. 5.6. An off-axis point source is one that is not centered in front of the labyrinth mouth. The distance down the passageway is expressed in units of the square root of the cross-sectional area of the passageway. It is obvious that extended, or off-axis sources are more readily attenuated because the tunnel aperture provides a smaller solid angle for acceptance. It has been found by Cossairt (Co95) that Goebel’s point source dependence in a tunnel of cross sectional area, A, can approximated by the following expression, where δ1 = (d1 - R)/A1/2
and ro is a fitting parameter;
2
1 11
( ) ( )oo
o
rH H R
rδ
δ
= + , (5.4)
ro = 0.4 (5.5)
H1(δ1) is the dose equivalent at distance δ1 in the first leg as measured from the mouth of the passageway in "units" of the square root of the cross-sectional area of the first leg. Ho(R) is the dose equivalent at the mouth the determination of which will be discussed later. The result of this fit is included in Fig. 5.6. Over the domain of 0 < δ1 < 9 the expression fits the Goebel curve within + 10 per cent, certainly sufficiently accurate for radiation protection purposes. The domain in δ1 is the appropriate one given the fact that most "personnel" labyrinths are of cross-sectional area of about 1 x 2 m2. Hence, the unit length is approximately 1.4 meters. A 10 "unit" long first leg is, typically, about 14 meters (or about 46 feet), a distance quite long compared with typical labyrinth legs. Tesch (Te82) has developed a very simple approach to the problem of dose equivalent rate attenuation by multi-legged labyrinths at proton accelerators that are typical of personnel passageways of approximately 2 m2 cross section. For the first leg the expression is an inverse-square law dependence with a simple factor of two included to allow for "in-scattering",
H d H RR
d1 1 01
2
2( ) ( )=
. (5.6)
Chapter 5 Low Energy Prompt Neutron Radiation Phenomena
Page 5-10
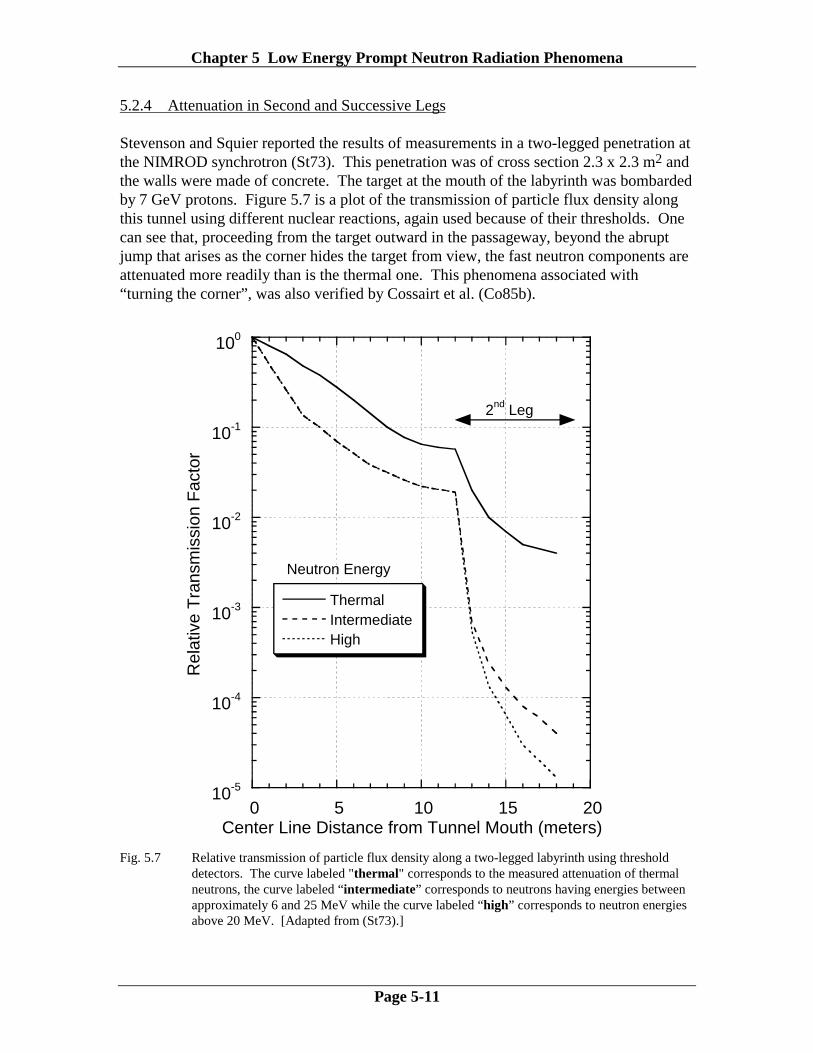
In Eq (5.6), the distance into the labyrinth, d1, is not scaled by the cross-sectional area of the passageway and, presumably, is valid only for personnel tunnels of approximately 2 m2 cross section.
10-3
10-2
10-1
100
0 1 2 3 4 5 6 7 8 9 10
Point SourceFit to Point SourceLine SourcePlane Source
Atte
nuat
ion
Fac
tor
Center Line Distance from Source Mouth, δ1,
(in units of the square root of the cross section)
FIRST LEG
Fig. 5.6 Universal transmission curves for the first leg of a labyrinth as a function of normalized
distance, δ1 from the mouth. The fit for the point source curve represented by Eq. (5.4) is also included. The curve for a plane source is also suitable to use with an off-axis point source. [Adapted from (Go75) and (Co95).]
Chapter 5 Low Energy Prompt Neutron Radiation Phenomena
Page 5-11
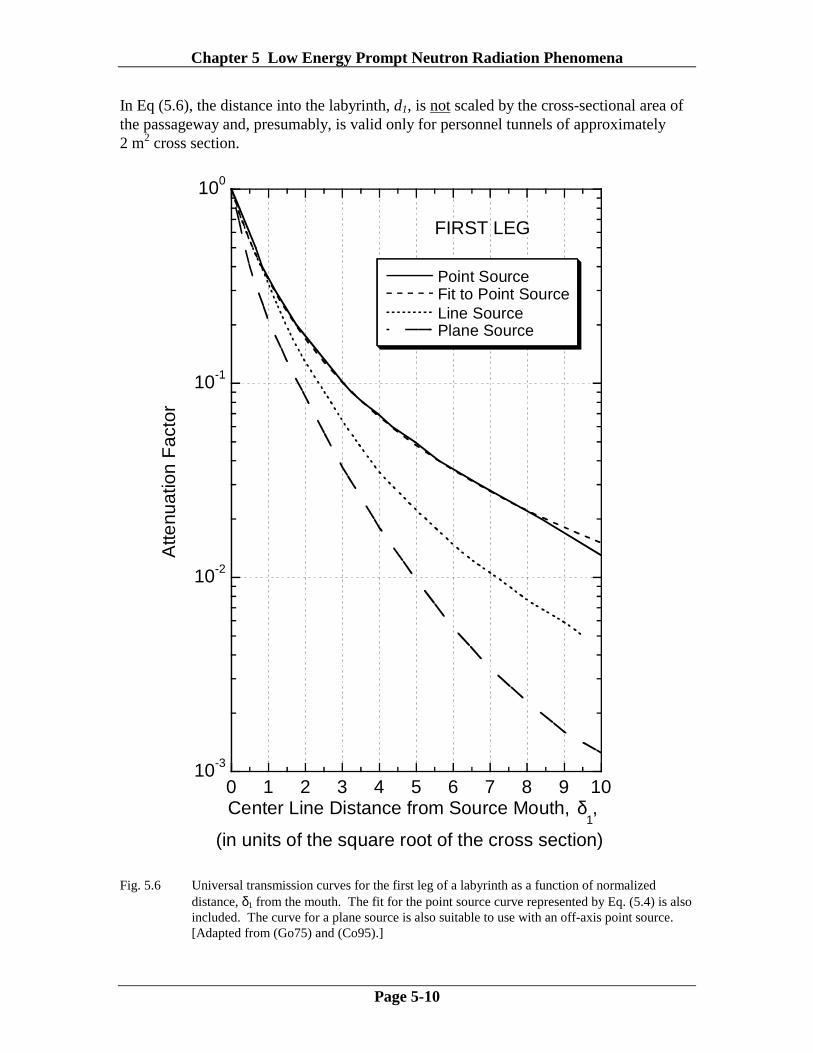
5.2.4 Attenuation in Second and Successive Legs Stevenson and Squier reported the results of measurements in a two-legged penetration at the NIMROD synchrotron (St73). This penetration was of cross section 2.3 x 2.3 m2 and the walls were made of concrete. The target at the mouth of the labyrinth was bombarded by 7 GeV protons. Figure 5.7 is a plot of the transmission of particle flux density along this tunnel using different nuclear reactions, again used because of their thresholds. One can see that, proceeding from the target outward in the passageway, beyond the abrupt jump that arises as the corner hides the target from view, the fast neutron components are attenuated more readily than is the thermal one. This phenomena associated with “turning the corner”, was also verified by Cossairt et al. (Co85b).
10-5
10-4
10-3
10-2
10-1
100
0 5 10 15 20
ThermalIntermediateHigh
Rel
ativ
e T
rans
mis
sion
Fac
tor
Center Line Distance from Tunnel Mouth (meters)
Neutron Energy
2nd Leg
Fig. 5.7 Relative transmission of particle flux density along a two-legged labyrinth using threshold
detectors. The curve labeled "thermal" corresponds to the measured attenuation of thermal neutrons, the curve labeled “intermediate” corresponds to neutrons having energies between approximately 6 and 25 MeV while the curve labeled “high” corresponds to neutron energies above 20 MeV. [Adapted from (St73).]
Chapter 5 Low Energy Prompt Neutron Radiation Phenomena
Page 5-12
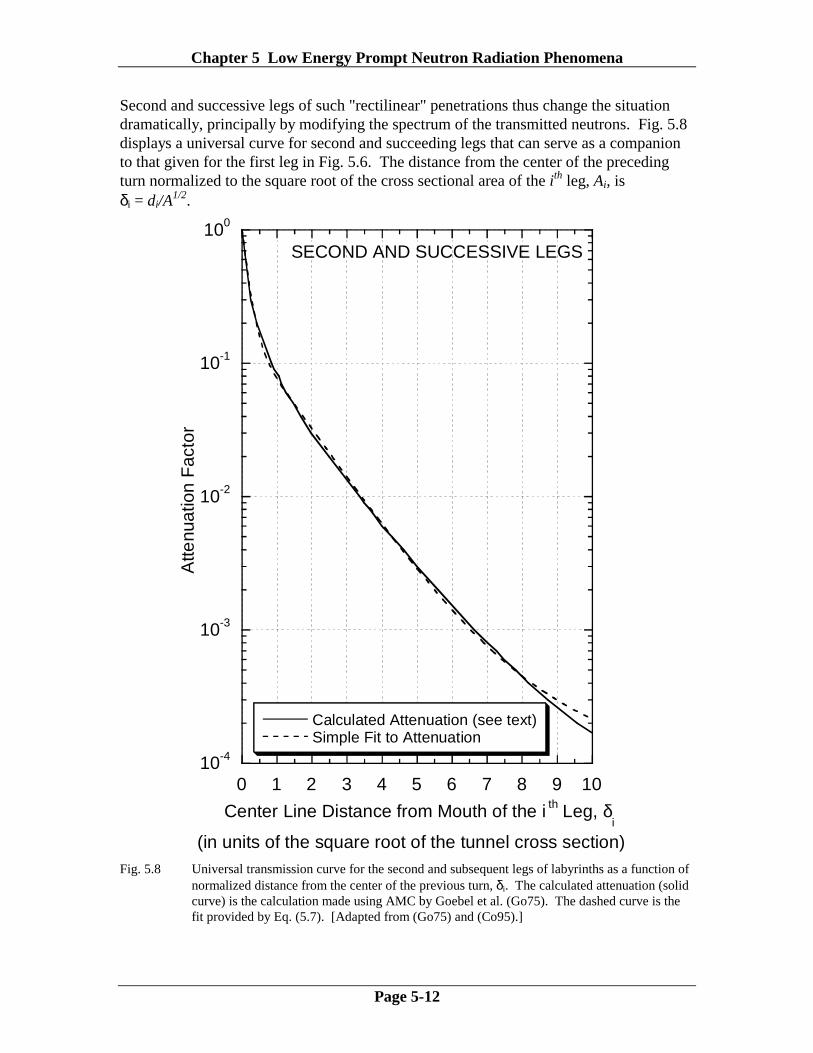
Second and successive legs of such "rectilinear" penetrations thus change the situation dramatically, principally by modifying the spectrum of the transmitted neutrons. Fig. 5.8 displays a universal curve for second and succeeding legs that can serve as a companion to that given for the first leg in Fig. 5.6. The distance from the center of the preceding turn normalized to the square root of the cross sectional area of the ith leg, Ai, is δi = di/A
1/2.
10-4
10-3
10-2
10-1
100
Calculated Attenuation (see text)Simple Fit to Attenuation
0 1 2 3 4 5 6 7 8 9 10
Atte
nuat
ion
Fac
tor
SECOND AND SUCCESSIVE LEGS
Center Line Distance from Mouth of the i th Leg, δi
(in units of the square root of the tunnel cross section)
Fig. 5.8 Universal transmission curve for the second and subsequent legs of labyrinths as a function of normalized distance from the center of the previous turn, δi. The calculated attenuation (solid curve) is the calculation made using AMC by Goebel et al. (Go75). The dashed curve is the fit provided by Eq. (5.7). [Adapted from (Go75) and (Co95).]
Chapter 5 Low Energy Prompt Neutron Radiation Phenomena
Page 5-13
It was found by Cossairt (Co95) that the following recursive expression adequately describes this curve, where again, δi is the distance in the ith leg measured in "units" of the square root of the cross-sectional area of the ith leg.
1 1
exp( / ) exp( / ) exp( / )( ) ( )
1i i i
i i i i
a A b B cH H
A B
δ δ δδ δ− −− + − + − = + +
ith leg (i > 1),
(5.7) where the fitting parameters are: a = 0.17, A = 0.21,
b = 1.17, and B = 0.00147. c = 5.25, The results of this fit are included in Fig. 5.8. Tesch (Te82) also has developed a formula for the transmission of the second and successive legs which is,
H dd A d
AHi i
i i i
ii( )
exp( / . ) . exp( / . )
.
.
.=− + −
+
−
0 45 0 022 2 35
1 0 022
13
13 1 (ith leg, i > 1) (5.8)
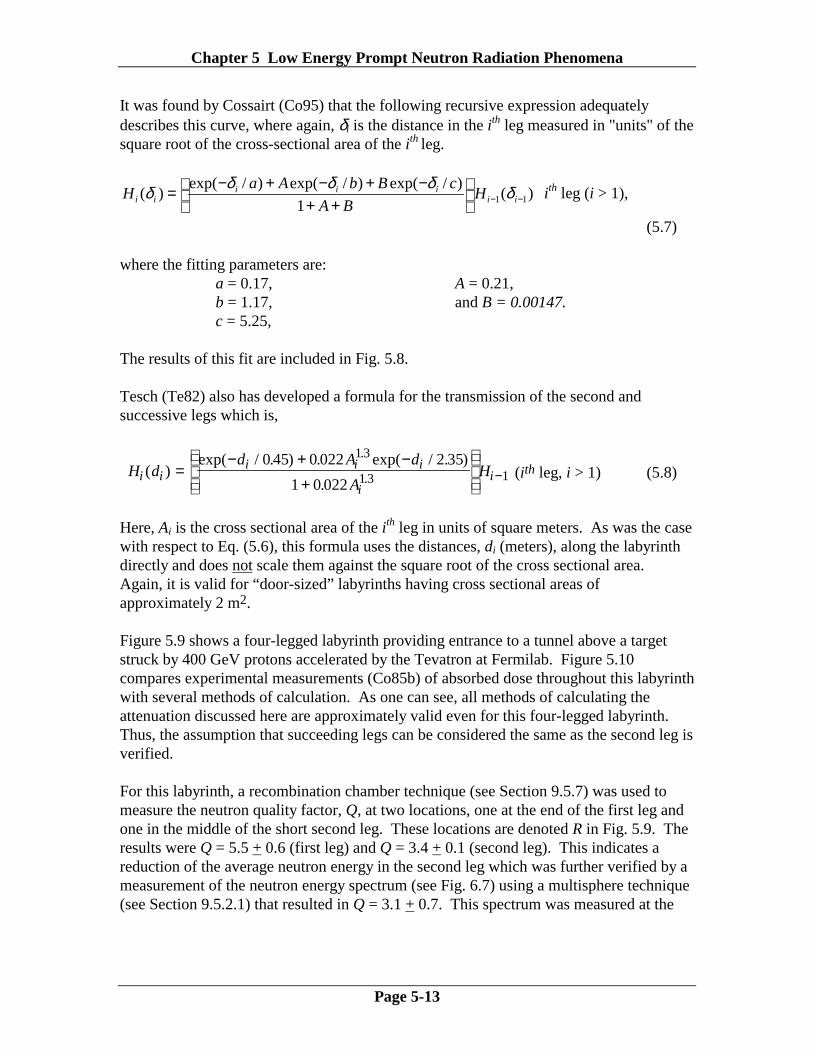
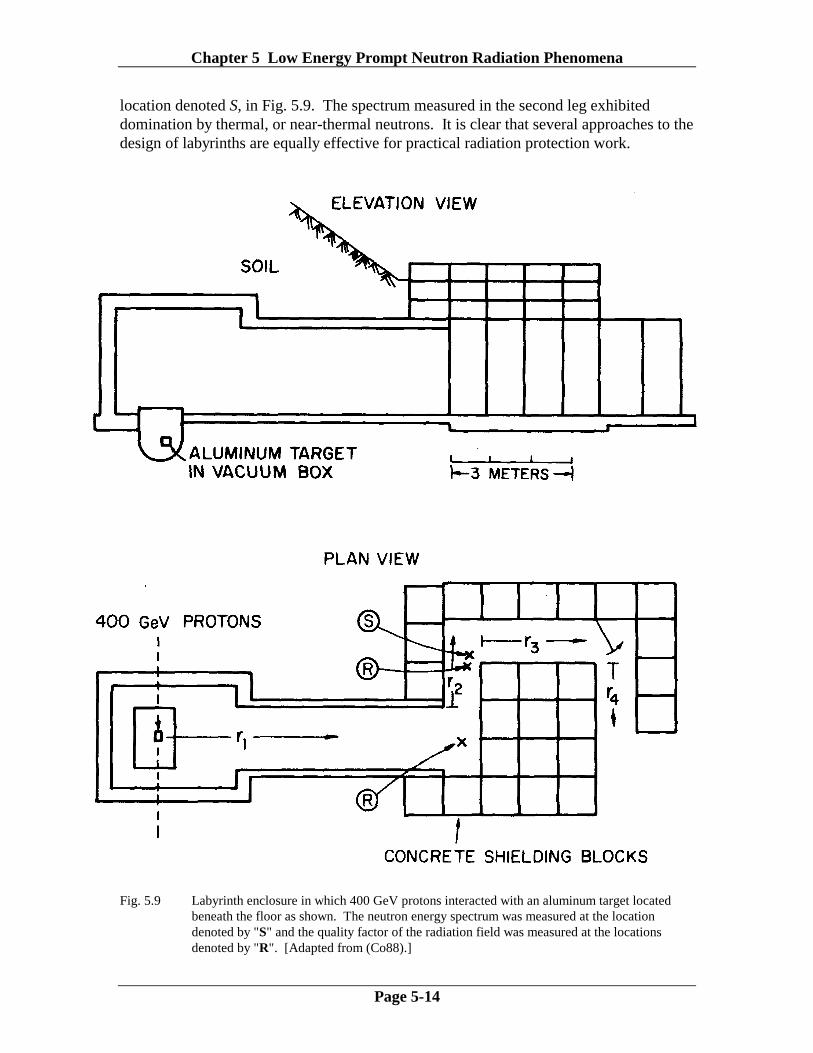
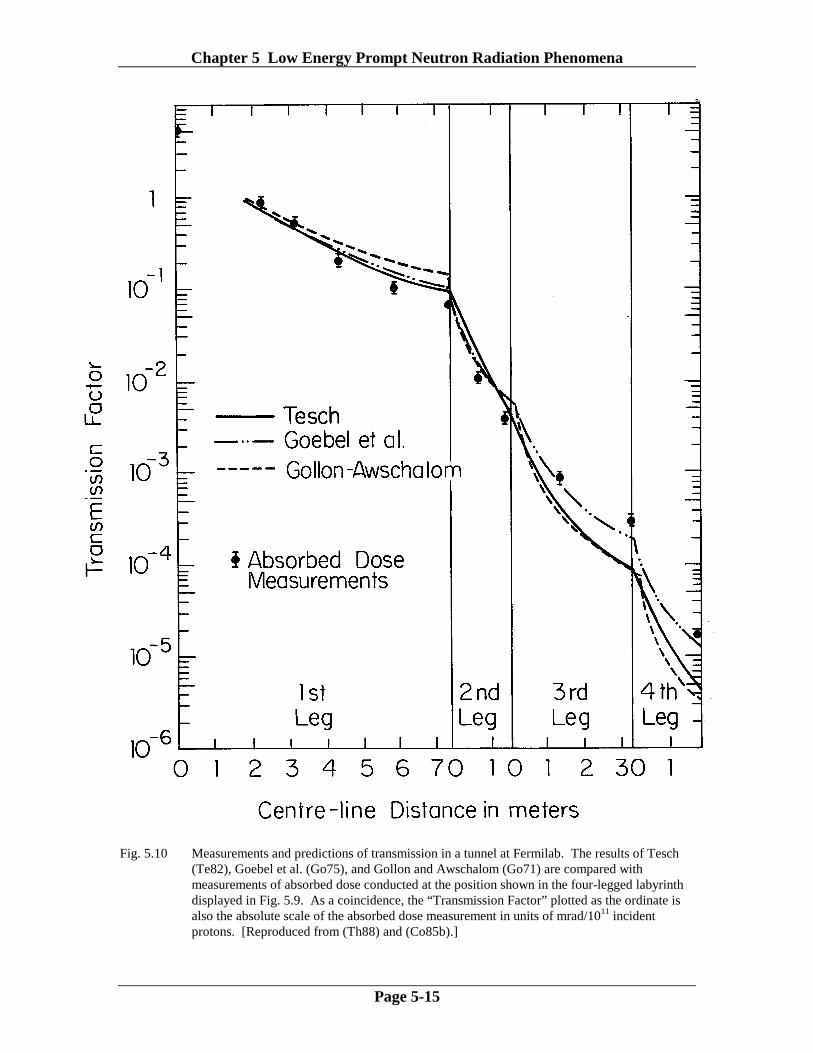
Here, Ai is the cross sectional area of the ith leg in units of square meters. As was the case with respect to Eq. (5.6), this formula uses the distances, di (meters), along the labyrinth directly and does not scale them against the square root of the cross sectional area. Again, it is valid for “door-sized” labyrinths having cross sectional areas of approximately 2 m2. Figure 5.9 shows a four-legged labyrinth providing entrance to a tunnel above a target struck by 400 GeV protons accelerated by the Tevatron at Fermilab. Figure 5.10 compares experimental measurements (Co85b) of absorbed dose throughout this labyrinth with several methods of calculation. As one can see, all methods of calculating the attenuation discussed here are approximately valid even for this four-legged labyrinth. Thus, the assumption that succeeding legs can be considered the same as the second leg is verified. For this labyrinth, a recombination chamber technique (see Section 9.5.7) was used to measure the neutron quality factor, Q, at two locations, one at the end of the first leg and one in the middle of the short second leg. These locations are denoted R in Fig. 5.9. The results were Q = 5.5 + 0.6 (first leg) and Q = 3.4 + 0.1 (second leg). This indicates a reduction of the average neutron energy in the second leg which was further verified by a measurement of the neutron energy spectrum (see Fig. 6.7) using a multisphere technique (see Section 9.5.2.1) that resulted in Q = 3.1 + 0.7. This spectrum was measured at the
Chapter 5 Low Energy Prompt Neutron Radiation Phenomena
Page 5-14
location denoted S, in Fig. 5.9. The spectrum measured in the second leg exhibited domination by thermal, or near-thermal neutrons. It is clear that several approaches to the design of labyrinths are equally effective for practical radiation protection work.
Fig. 5.9 Labyrinth enclosure in which 400 GeV protons interacted with an aluminum target located beneath the floor as shown. The neutron energy spectrum was measured at the location denoted by "S" and the quality factor of the radiation field was measured at the locations denoted by "R". [Adapted from (Co88).]
Chapter 5 Low Energy Prompt Neutron Radiation Phenomena
Page 5-15
Fig. 5.10 Measurements and predictions of transmission in a tunnel at Fermilab. The results of Tesch
(Te82), Goebel et al. (Go75), and Gollon and Awschalom (Go71) are compared with measurements of absorbed dose conducted at the position shown in the four-legged labyrinth displayed in Fig. 5.9. As a coincidence, the “Transmission Factor” plotted as the ordinate is also the absolute scale of the absorbed dose measurement in units of mrad/1011 incident protons. [Reproduced from (Th88) and (Co85b).]
Chapter 5 Low Energy Prompt Neutron Radiation Phenomena
Page 5-16
5.2.5 Attenuation in Curved Tunnels Curved tunnels are principally used to provide access for large equipment items that cannot negotiate right-angle bends. These have not been treated in nearly the same detail as have the rectilinear passageways. It appears that the attenuation is described by an exponential function having an attenuation length, λ, that is only a function of the radius R of the tunnel. Patterson and Thomas (Pa73) determined that
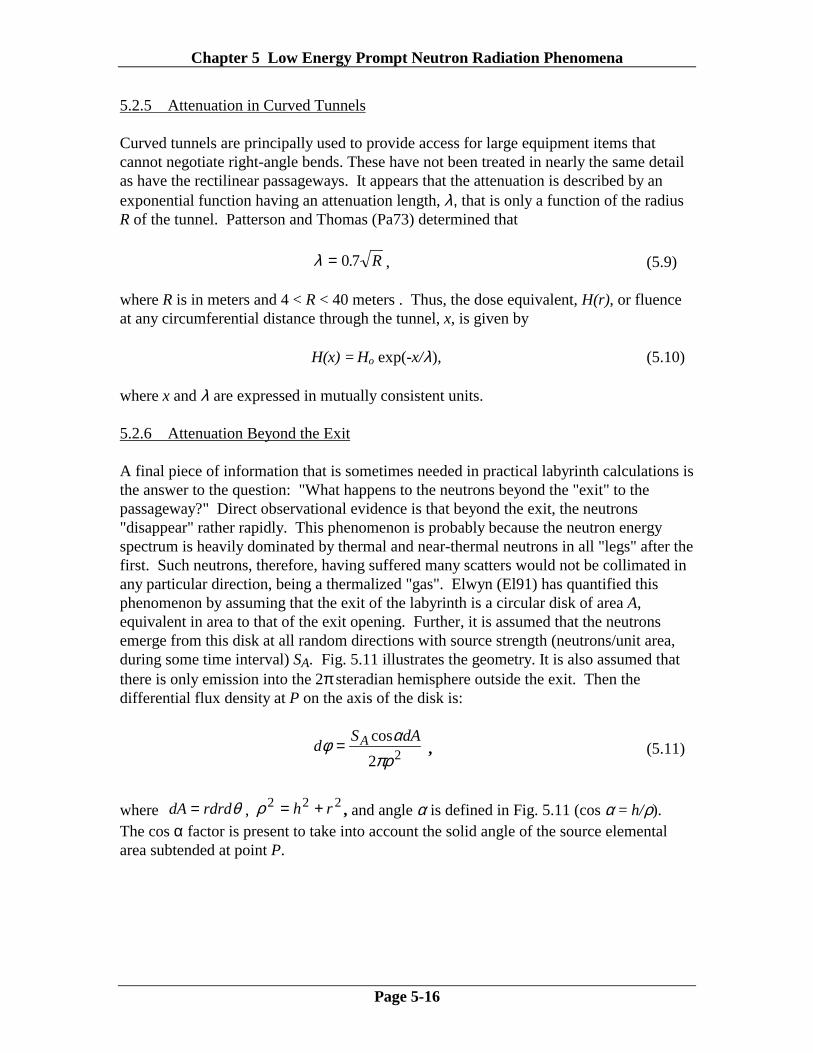
λ = 0 7. R , (5.9) where R is in meters and 4 < R < 40 meters . Thus, the dose equivalent, H(r), or fluence at any circumferential distance through the tunnel, x, is given by H(x) = Ho exp(-x/λ), (5.10) where x and λ are expressed in mutually consistent units. 5.2.6 Attenuation Beyond the Exit A final piece of information that is sometimes needed in practical labyrinth calculations is the answer to the question: "What happens to the neutrons beyond the "exit" to the passageway?" Direct observational evidence is that beyond the exit, the neutrons "disappear" rather rapidly. This phenomenon is probably because the neutron energy spectrum is heavily dominated by thermal and near-thermal neutrons in all "legs" after the first. Such neutrons, therefore, having suffered many scatters would not be collimated in any particular direction, being a thermalized "gas". Elwyn (El91) has quantified this phenomenon by assuming that the exit of the labyrinth is a circular disk of area A, equivalent in area to that of the exit opening. Further, it is assumed that the neutrons emerge from this disk at all random directions with source strength (neutrons/unit area, during some time interval) SA. Fig. 5.11 illustrates the geometry. It is also assumed that there is only emission into the 2π steradian hemisphere outside the exit. Then the differential flux density at P on the axis of the disk is:
22
cos
πραφ dAS
d A= , (5.11)
where θrdrddA = , 222 rh +=ρ , and angle α is defined in Fig. 5.11 (cos α = h/ρ). The cos α factor is present to take into account the solid angle of the source elemental area subtended at point P.
Chapter 5 Low Energy Prompt Neutron Radiation Phenomena
Page 5-17
P
R
h
r
ρ
θ
d A
α
Fig. 5.11 Diagram of labyrinth exit neutron calculation. The coordinates are explained in the text. Thus,
32πρθφ hRdrdS
d A= . (5.12)
Integrating,
( ) ( )φ
πθ
π( )h
S hdr d
r
r h
S h drr
r h
A RA
R=
+=
+=∫∫ ∫2 0
2
0 2 23
2 2 23
20
S hr h
SR
h
A
R
A−
+
= −
+
11
1
12 2 0 2 , (5.13)
where attenuation by the air is neglected. Thus one can use this by approximating the area of the exit opening by the area of a disk have an equivalent area. At large distances, one can apply a "point source" approximation due to the fact that:
φ( )hS R
hA≈
2
2
for h >> R. (5.14)
For h = 0, φ (0) = SA as expected. The rapidity of the decrease of fluence is illustrated by the tabulation of a few values in Table 5.3.

Chapter 5 Low Energy Prompt Neutron Radiation Phenomena
Page 5-18
Table 5.3 Estimates of relative neutron flux or dose equivalent as a function of scaled distance from the exit of a labyrinth.
h/R φ(h)/SA 0.5 0.55 1.0 0.29 2.0 0.11 4.0 0.03 10.0 0.005
To summarize thus far; one can use a calculation or measurement of the neutron flux density or dose equivalent at mouth of the labyrinth in conjunction with one of the above methods of calculating the attenuation of the neutrons by the passageway to get an estimate of the dose equivalent or fluence at the exit of the passageway. 5.2.7 Determination of the Source Factor Generally, the dose at the entrance can be obtained using Monte Carlo techniques or by directly using the information about neutron yields. For protons, approximations that use Moyer Model parameters discussed in Chapter 4 are likely to overestimate the dose equivalent at the entrance. This is because the Moyer parameter implicitly assumes development of the shower (a "buildup" mechanism, as seen in Chapter 4) in the enclosure shielding. This buildup does not happen in the passageway. For high energy proton accelerators, a rule of thumb for the source term which has been found to be very successful for the degree of accuracy generally required for personnel protection purposes has been developed by Ruffin and Moore (Ru76). It was improved by inclusion of Moyer energy scaling by Rameika (Ra91). In this model, it is seen that about one fast neutron GeV-1 of proton beam energy is produced with an isotropic distribution in addition to the much higher multiplicity in the forward direction. The neutrons that will dominate the spectrum and determine the dose equivalent at the entrance to the labyrinth have kinetic energies between 1 to 10 MeV. From the dose equivalent/fluence factors, P(E), in Fig. 1.5, one rem of 10 MeV neutrons represents a fluence of approximately 3 x 107 cm -2 for neutrons over this energy domain. Thus, at distance R (cm) from the source, one obtains;
( )H remE N
R
E N
R
p p( ) .
. .
=×
= × −00 8
2 79 0
0 8
24 3 102 65 10
π, (5.15)
Chapter 5 Low Energy Prompt Neutron Radiation Phenomena
Page 5-19
where R is in cm, Eo is in GeV, and Np is the number of incident protons. The constant, 2.65 x 10⁻⁹ (rem cm2), turns out to be approximately one-third the value obtained by using the Moyer source parameter along with high energy value of the Moyer angular factor at θ = π /2 (Eqs. (4.38 and 4.41);
(2.8 x 10⁻⁷ rem cm2)exp(-2.3π /2) = 7.6 x 10⁻⁹ rem cm2. (5.16) To obtain the source factor for neutrons produced by electrons, the neutron yields discussed in Section 3.2.4 can be utilized. 5.3 Skyshine Thin roof shielding represents a serious problem that has plagued a number of accelerators such as the Cosmotron (BNL), the Bevatron (LBL), and the Fermilab experimental areas. The phenomenon, known as skyshine, is the situation in which the roof of some portion of the accelerator or an associated experimental facility is shielded more thinly than are the sides of the same enclosure that directly view the radiation source. The first attempt to calculate the skyshine radiation field was made by Lindenbaum (Li61). Schopper et al. (Sc90) gives a rather complete description of the phenomena and Patterson and Thomas (Pa73), Rindi and Thomas (Ri75), Stevenson and Thomas (St84a), and Cossairt and Coulson (Co85c) present some specific results. Neutron skyshine, while it is usually "preventable" through the application of sufficient roof shielding, has been encountered at nearly all major accelerators. This has resulted either from lack of consideration of it at the design stage or from the need to accommodate other constraints such as the need to minimize the weight of shielding borne by the roofs of large experimental halls. 5.3.1 Simple Parameterizations When addressing the skyshine question, it is generally customary to plot the neutron fluence, or even the dose equivalent, as a function of distance from the source by multiplying it by the square of the distance from the source, i.e., as r2Φ (r). Stevenson and Thomas (St84a) included plots of a number of measurements of neutron skyshine obtained at proton accelerators producing protons of energies ranging from 30 MeV to 30 GeV, and also at high energy electron accelerators having energies of 7.5 and 12 GeV. In general, the quantity r2Φ(r) is characterized by a buildup followed by an exponential falloff. Most skyshine distributions are isotropic (i.e., independent of the angle θ). As exhibited by the typical skyshine data, λ, the effective attenuation length, has been found to vary between a minimum value of about 200 meters and much larger values which approach one kilometer. We shall shortly see how this quantity is dependent upon the energy spectrum of the neutron radiation field that is the source of the skyshine.
Chapter 5 Low Energy Prompt Neutron Radiation Phenomena
Page 5-20
Patterson and Thomas (Pa73) give a formula that describes such behavior for r > 50 meters;
Φ
πµ λ ( ) ( )/ /r
aQ
rr r= − − −
412 e e
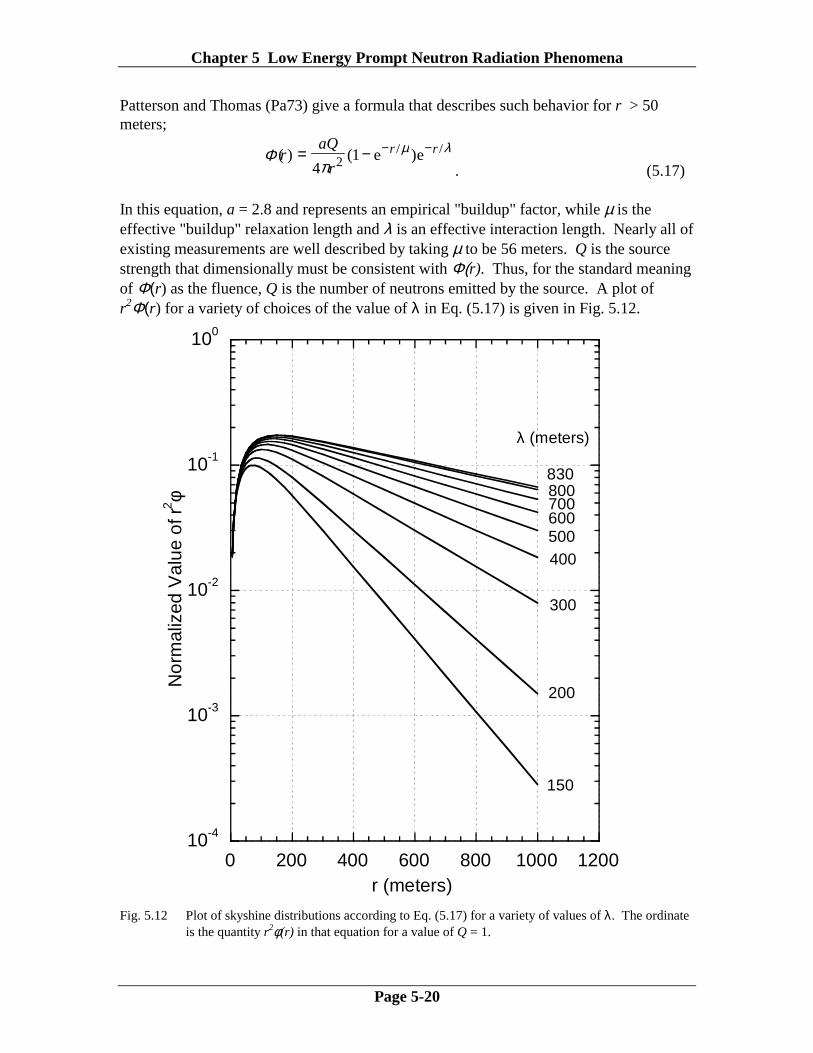
. (5.17) In this equation, a = 2.8 and represents an empirical "buildup" factor, while µ is the effective "buildup" relaxation length and λ is an effective interaction length. Nearly all of existing measurements are well described by taking µ to be 56 meters. Q is the source strength that dimensionally must be consistent with Φ(r). Thus, for the standard meaning of Φ(r) as the fluence, Q is the number of neutrons emitted by the source. A plot of r2Φ(r) for a variety of choices of the value of λ in Eq. (5.17) is given in Fig. 5.12.
10-4
10-3
10-2
10-1
100
0 200 400 600 800 1000 1200
Nor
mal
ized
Val
ue o
f r2 φ
r (meters)
λ (meters)
830800700600500400
300
200
150
Fig. 5.12 Plot of skyshine distributions according to Eq. (5.17) for a variety of values of λ. The ordinate
is the quantity r2φ(r) in that equation for a value of Q = 1.
Chapter 5 Low Energy Prompt Neutron Radiation Phenomena
Page 5-21
Values of λ > 830 meters are possible if very high energy neutrons (E > 150 MeV) are present. A value of 830 m (100 g cm-2 of air at standard temperature and pressure) corresponds to the interaction length of the neutrons of approximately 100 MeV likely to control the propagation of hadronic cascades in air. Larger values of λ are more likely due to multiple sources or an extended source. In such circumstances, the radiation field may also not necessarily be isotropic. Thus, λ is determined by the neutron energy spectrum present at the thinly shielded location. The procedure, then, for using Eq. (5.17) is to: A. Estimate the total emission rate of neutrons from the source. This can be done by
using information about the neutron spectrum at the source to choose an "average" energy and intensity. The dose equivalent per fluence conversion factor at that energy can then be used in conjunction with a dose equivalent rate survey over the thinly shielded region to determine the total neutron emission rate, Q, by numerically integrating over the area of the top of the shield.
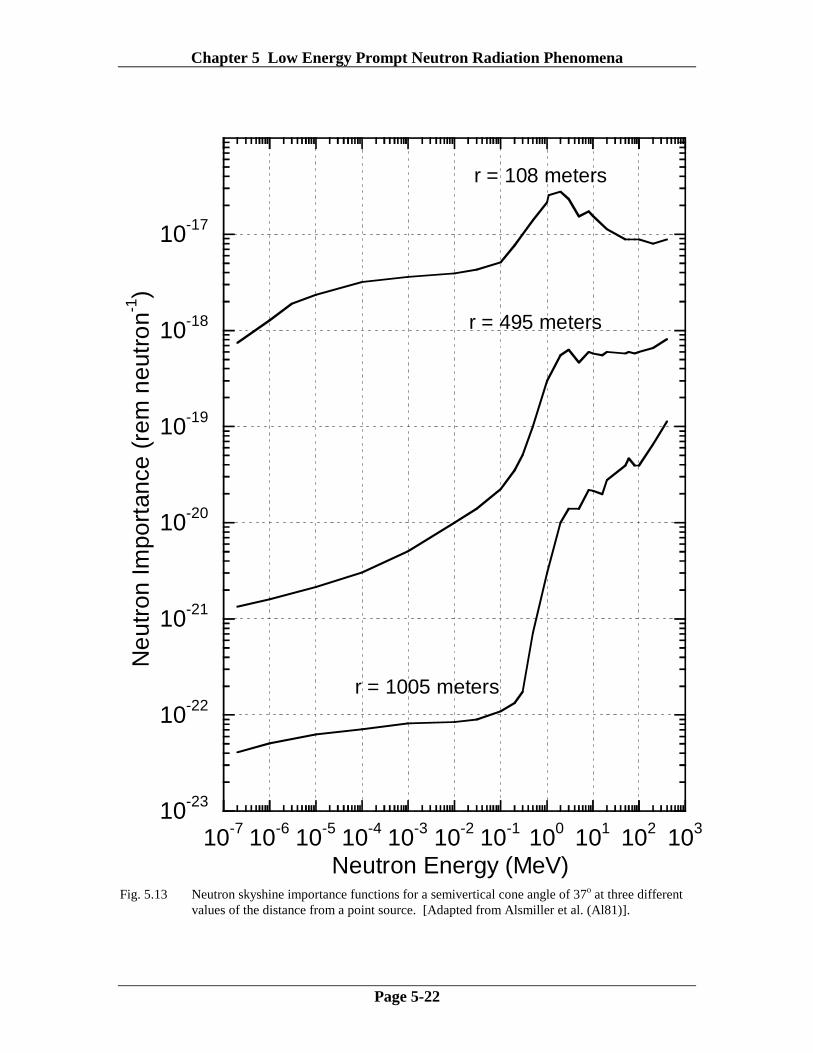
B. Estimate the value of λ from the neutron energy spectrum information. C. Apply Eq. (5.17) to determine the radial dependence. Cossairt and Coulson (Co85c) present an example of a non-isotropic, complex skyshine source involving high energies and an extremely thin shield that resulted in a value of λ ≈1200 meters. 5.3.2 A Somewhat More Rigorous Treatment A somewhat more rigorous treatment has been reported by Stevenson and Thomas (St84a), that is based on the work of Alsmiller, Barish, and Childs (Al81) and Nakamura and Kosako (Na81). These groups have independently performed extensive Monte Carlo calculations of the neutrons emitted into cones of small vertex angle. Alsmiller, Barish, and Childs used the Discrete Ordinates Transport Code DOT while Nakamura and Kosako used the Monte Carlo code MORSE. For selected distances from the skyshine source, these workers have calculated the dose equivalent as a function of both the source neutron energy and the emission cone’s semivertical angle (that is, the half-angle the rotation of which defines the cone into which the neutrons are emitted). The authors define this quantity, the so-called neutron importance, as the dose equivalent per emitted neutron as a function of the energy of the emitted neutron and of the distance from the source. This quantity is a measure a of how “important” a given emitted neutron is in delivering radiation dose equivalent to a point in space located at a given distance from the skyshine source. The results of the Alsmiller calculation for small semivertical angles are given in Fig. 5.13. The corresponding, but somewhat less-detailed results of Nakamura, are in good agreement with these results.
Chapter 5 Low Energy Prompt Neutron Radiation Phenomena
Page 5-22
10-23
10-22
10-21
10-20
10-19
10-18
10-17
10-7 10-6 10-5 10-4 10-3 10-2 10-1 100 101 102 103
Neu
tron
Impo
rtan
ce (
rem
neu
tron
-1)
Neutron Energy (MeV)
r = 108 meters
r = 495 meters
r = 1005 meters
Fig. 5.13 Neutron skyshine importance functions for a semivertical cone angle of 37o at three different
values of the distance from a point source. [Adapted from Alsmiller et al. (Al81)].
Chapter 5 Low Energy Prompt Neutron Radiation Phenomena
Page 5-23
Stevenson and Thomas (St84a) were able to derive an alternative "recipe" for skyshine neutron calculations to the one expressed in Eq. (5.17) by making two assumptions: A. The neutron energy spectrum has the 1/E form up to the proton energy and zero at
higher energies. This likely overestimates the contribution of the higher energy neutrons.
B. The neutrons are emitted into a cone whose semivertical angle is about 35-40o.
This may overestimate the doses by up to a factor of three for sources of smaller semivertical angles.
Stevenson and Thomas parameterized the skyshine phenomena using the following equation:
λ
π/
24)( re
r
Qr −′
=Φ . (5.18)
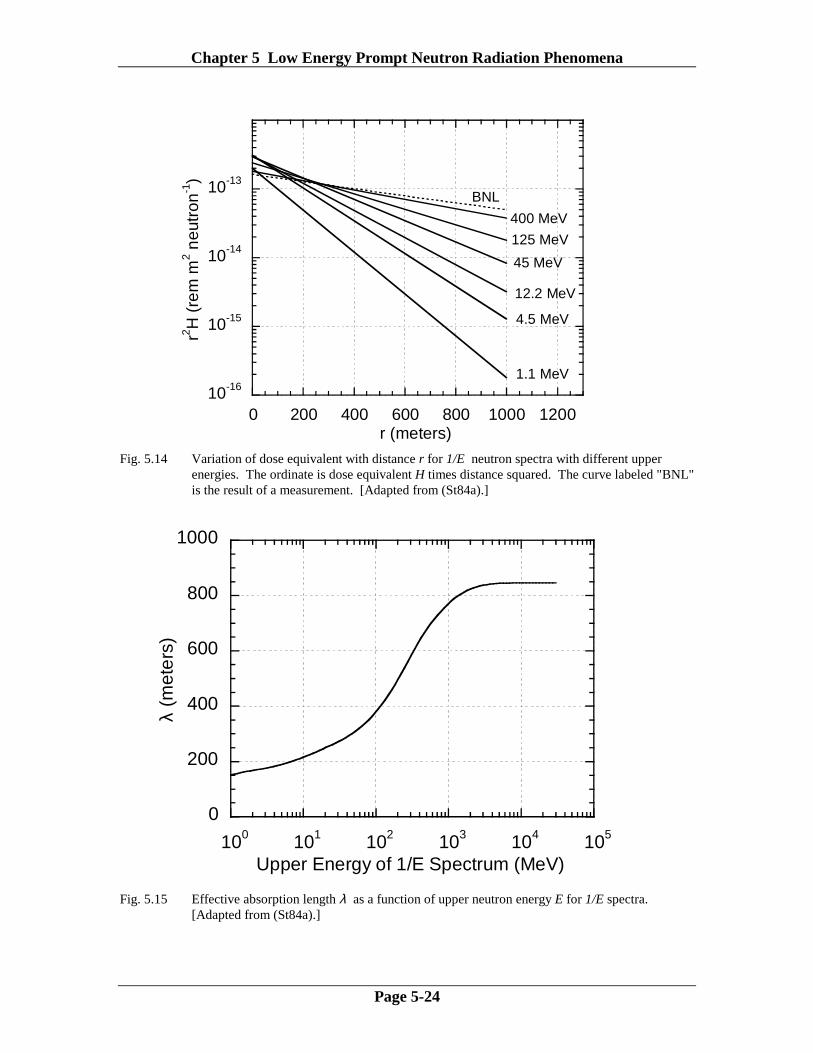
In this equation, the buildup exponential factor has been suppressed so the formula is valid only at large distances (i.e., r >> 56 meters). In addition, the source strength denoted by Q′ implicitly includes the buildup factor of 2.8. Further, they used the Alsmiller importance functions to estimate the value of λ based upon the upper energy of the 1/E spectrum. Fig. 5.14 displays the results of doing this for several choices of upper energies at three distances in a plot in which the 1/r 2 dependence is suppressed. The slopes, then, were used to obtain values of λ as a function of "upper energy" which are plotted in Fig. 5.15. A comparison with a measurement conducted at Brookhaven National Laboratory is also provided. To determine the source term, the straight lines in Fig. 5.14 (on the semi-logarithmic plot) were extrapolated to zero and used to determine intercepts at r = 0 ranging from 1.5 x 10⁻¹⁵ to 3 x 10-15 Sv m2/neutron (1.5 x 10⁻¹³ to 3 x 10-13 rem m2/neutron).
Chapter 5 Low Energy Prompt Neutron Radiation Phenomena
Page 5-24
10-16
10-15
10-14
10-13
0 200 400 600 800 1000 1200
r2 H (
rem
m2 n
eutr
on-1
)
r (meters)
BNL
400 MeV
125 MeV
45 MeV
12.2 MeV
4.5 MeV
1.1 MeV
Fig. 5.14 Variation of dose equivalent with distance r for 1/E neutron spectra with different upper
energies. The ordinate is dose equivalent H times distance squared. The curve labeled "BNL" is the result of a measurement. [Adapted from (St84a).]
0
200
400
600
800
1000
100 101 102 103 104 105
λ (m
eter
s)
Upper Energy of 1/E Spectrum (MeV)
Fig. 5.15 Effective absorption length λ as a function of upper neutron energy E for 1/E spectra. [Adapted from (St84a).]
Chapter 5 Low Energy Prompt Neutron Radiation Phenomena
Page 5-25
Hence, conservatively, Stevenson and Thomas found that
λ/
2
13e
103)( r
rrH −
−×= (rem/emitted neutron, r in meters). (5.19)
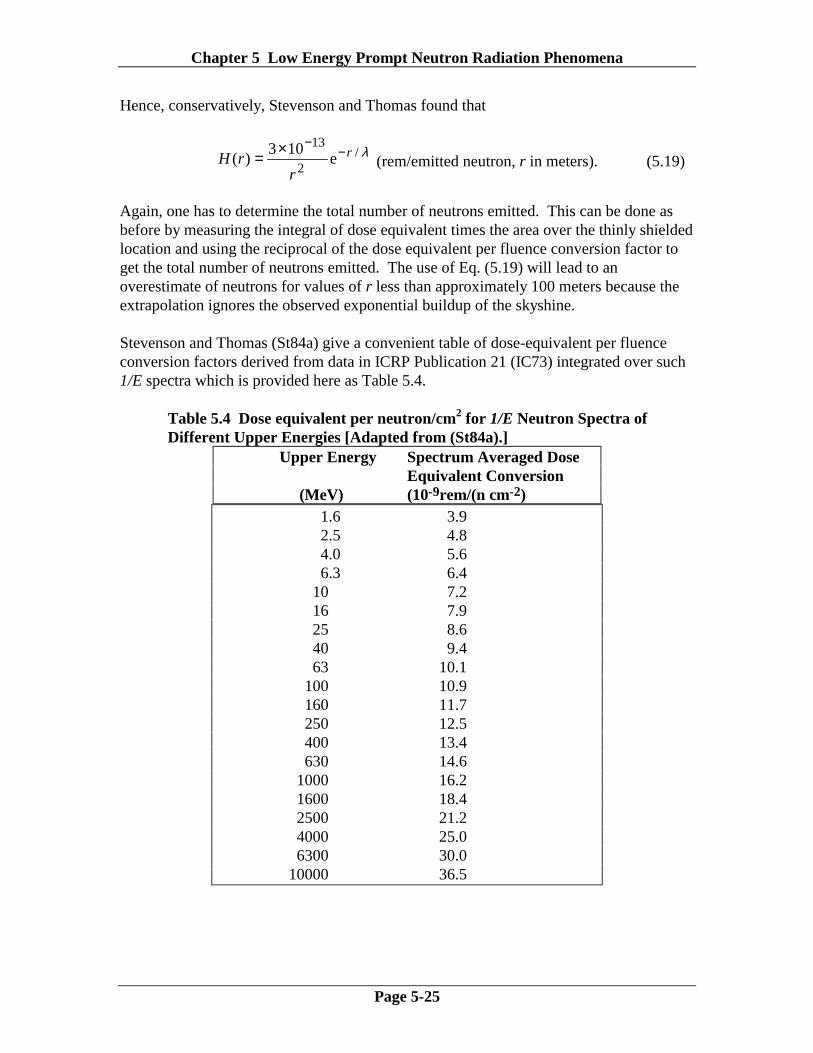
Again, one has to determine the total number of neutrons emitted. This can be done as before by measuring the integral of dose equivalent times the area over the thinly shielded location and using the reciprocal of the dose equivalent per fluence conversion factor to get the total number of neutrons emitted. The use of Eq. (5.19) will lead to an overestimate of neutrons for values of r less than approximately 100 meters because the extrapolation ignores the observed exponential buildup of the skyshine. Stevenson and Thomas (St84a) give a convenient table of dose-equivalent per fluence conversion factors derived from data in ICRP Publication 21 (IC73) integrated over such 1/E spectra which is provided here as Table 5.4.
Table 5.4 Dose equivalent per neutron/cm2 for 1/E Neutron Spectra of Different Upper Energies [Adapted from (St84a).]
Upper Energy Spectrum Averaged Dose Equivalent Conversion (MeV) (10-9rem/(n cm-2) 1.6 3.9 2.5 4.8 4.0 5.6 6.3 6.4 10 7.2 16 7.9 25 8.6 40 9.4 63 10.1 100 10.9 160 11.7 250 12.5 400 13.4 630 14.6 1000 16.2 1600 18.4 2500 21.2 4000 25.0 6300 30.0 10000 36.5
Chapter 5 Low Energy Prompt Neutron Radiation Phenomena
Page 5-26
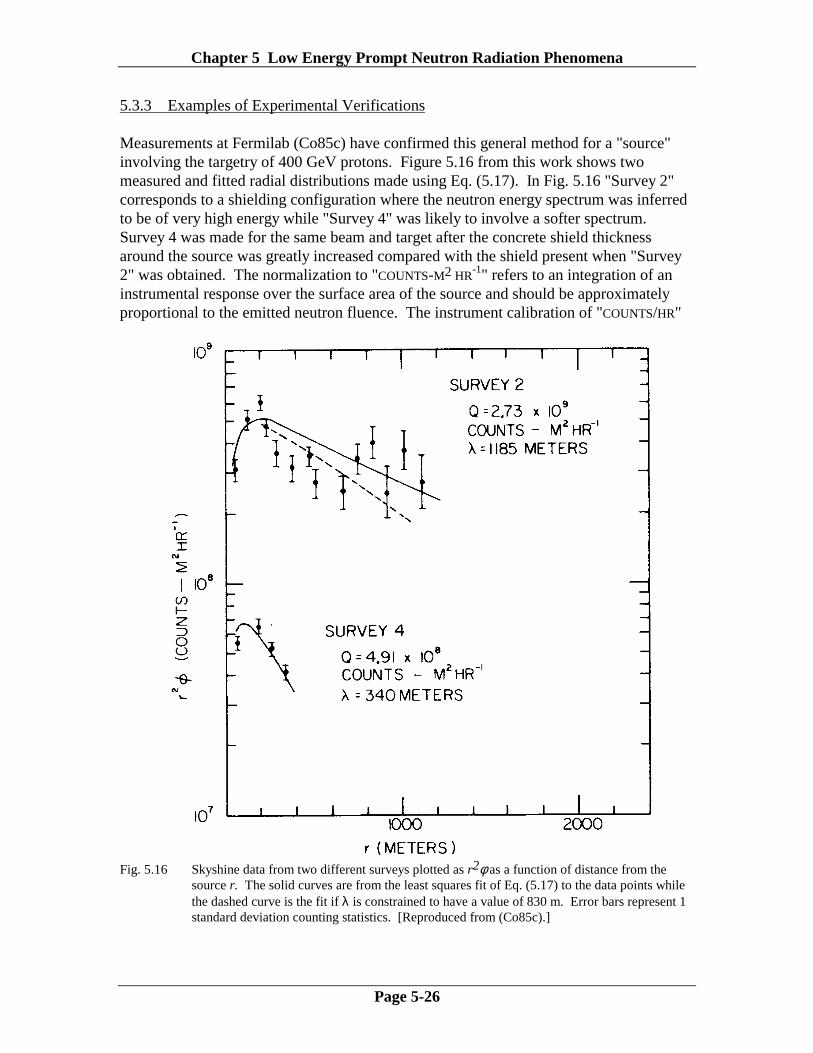
5.3.3 Examples of Experimental Verifications Measurements at Fermilab (Co85c) have confirmed this general method for a "source" involving the targetry of 400 GeV protons. Figure 5.16 from this work shows two measured and fitted radial distributions made using Eq. (5.17). In Fig. 5.16 "Survey 2" corresponds to a shielding configuration where the neutron energy spectrum was inferred to be of very high energy while "Survey 4" was likely to involve a softer spectrum. Survey 4 was made for the same beam and target after the concrete shield thickness around the source was greatly increased compared with the shield present when "Survey 2" was obtained. The normalization to "COUNTS-M2 HR
-1" refers to an integration of an instrumental response over the surface area of the source and should be approximately proportional to the emitted neutron fluence. The instrument calibration of "COUNTS/HR"
Fig. 5.16 Skyshine data from two different surveys plotted as r2φ as a function of distance from the
source r. The solid curves are from the least squares fit of Eq. (5.17) to the data points while the dashed curve is the fit if λ is constrained to have a value of 830 m. Error bars represent 1 standard deviation counting statistics. [Reproduced from (Co85c).]
Chapter 5 Low Energy Prompt Neutron Radiation Phenomena
Page 5-27
made possible an estimate of dose rates at r = 200 meters for the two surveys. In view of details of the conditions not described in detail here, one can make an educated guess that the spectrum of emitted neutrons of "Survey 2" had an upper energy of ≈ 1 GeV, while the spectrum of emitted neutrons of "Survey 4" had an approximate upper energy of ≈ 100 MeV. Using the appropriate dose equivalent/fluence, the value of Q for the Survey 2 conditions was determined experimentally to be 2.5 x 10⁵ mrem m2 hr-1. This was obtained from the measured absorbed dose surface integral of 5 x 10⁴ mrad m2hr-1 and assuming a quality factor of 5. For the Survey 4 conditions, Q was found to be 4.0 x 10⁴ mrem m2 hr-1. Again, this was obtained from the measured absorbed dose surface integral of 8.1 x 10³ mrad m2 hr-1 and assumed a quality factor of 5. Table 5.5 makes a comparison with the prescription of (St84a) for these data. In this table, H is the dose equivalent in one hour at 200 meters. The prescription of Stevenson and Thomas (St84a) is used to calculate the dose equivalent in one hour at 200 meters. The agreement is well within all uncertainties involved. Table 5.5 Comparisons of Fermilab skyshine data with results of parameterizations of surveys shown in Fig. 5.16, assuming 1/E spectra with inferred upper energies. The quantities are all for a one hour time period.
Survey λ (meters) (Co85c)
Emax (inferred)
(MeV)
Dose Equiv. per
Fluence (mrem/ n cm-2) (St84a)
Q-measured (mrem m2)
(Co85c)
H (200 m) (mrem)-
calculated
H (200 m) (mrem)-
measured (Co85c)
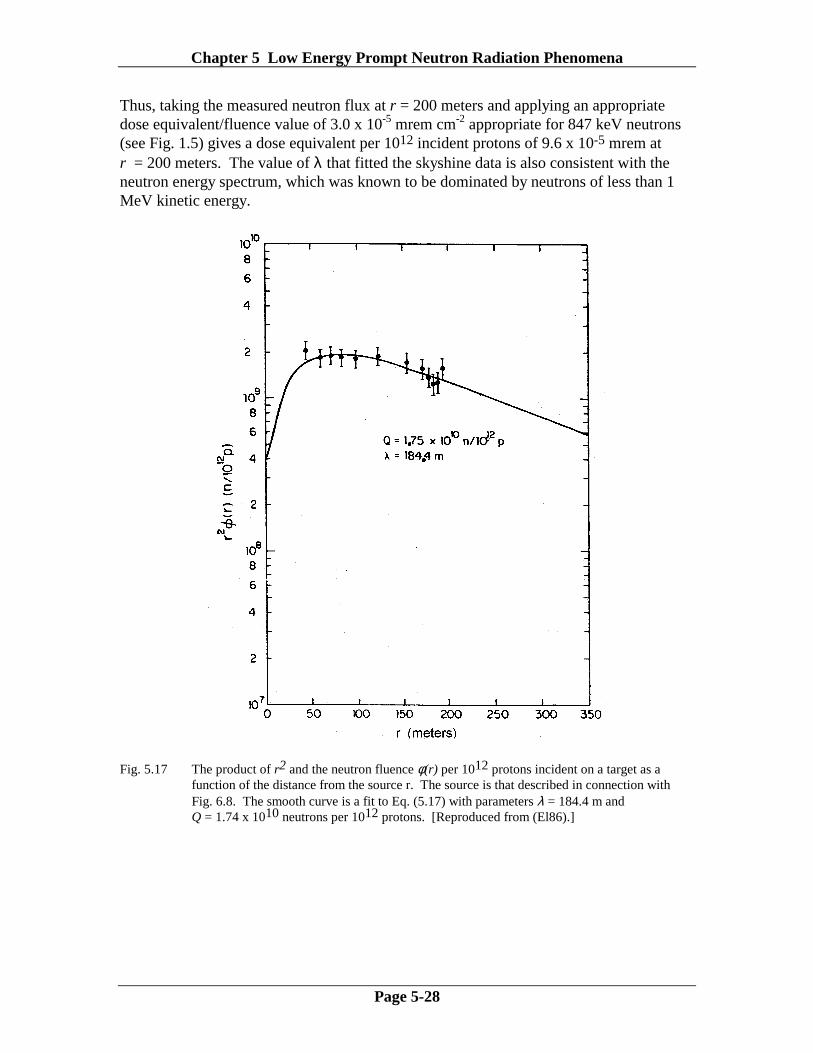
Survey 2 1200 1000 16.2 x 10⁻⁶ 2.5 x 10⁵ 1.0 1.6 Survey 4 340 100 10.9 x 10⁻⁶ 4.0 x 10⁴ 0.15 0.15 Another illustration is provided by Elwyn and Cossairt (El86) in connection with neutron radiation field emerging from an iron shield that is more fully described in Section 6.3.5. Fig. 5.17 taken from (El86) shows the measured radial dependence of neutron flux as a function of distance from that iron shield. From other considerations pertaining to an iron shield discussed in Section 6.3.5, it is known that the radiation field is dominated by neutrons of energies near 847 keV. Using the measured data, normalized to 1012 incident protons the parameters Q = 1.75 x 10¹⁰ and λ = 184.4 meters were determined by fitting the skyshine data using Eq. (5.17). Evaluating Φ at r = 200 meters,
[ ] 2-42
10m neutrons 1020.3)4.184/200exp()56/200exp(1
)200( 4
)1075.1(8.2)200( ×=−−×=Φ
π.
(5.20)
Chapter 5 Low Energy Prompt Neutron Radiation Phenomena
Page 5-28
Thus, taking the measured neutron flux at r = 200 meters and applying an appropriate dose equivalent/fluence value of 3.0 x 10⁻⁵ mrem cm-2 appropriate for 847 keV neutrons (see Fig. 1.5) gives a dose equivalent per 1012 incident protons of 9.6 x 10⁻⁵ mrem at r = 200 meters. The value of λ that fitted the skyshine data is also consistent with the neutron energy spectrum, which was known to be dominated by neutrons of less than 1 MeV kinetic energy.
Fig. 5.17 The product of r2 and the neutron fluence φ(r) per 1012 protons incident on a target as a
function of the distance from the source r. The source is that described in connection with Fig. 6.8. The smooth curve is a fit to Eq. (5.17) with parameters λ = 184.4 m and Q = 1.74 x 10¹⁰ neutrons per 1012 protons. [Reproduced from (El86).]
Chapter 5 Low Energy Prompt Neutron Radiation Phenomena
Page 5-29
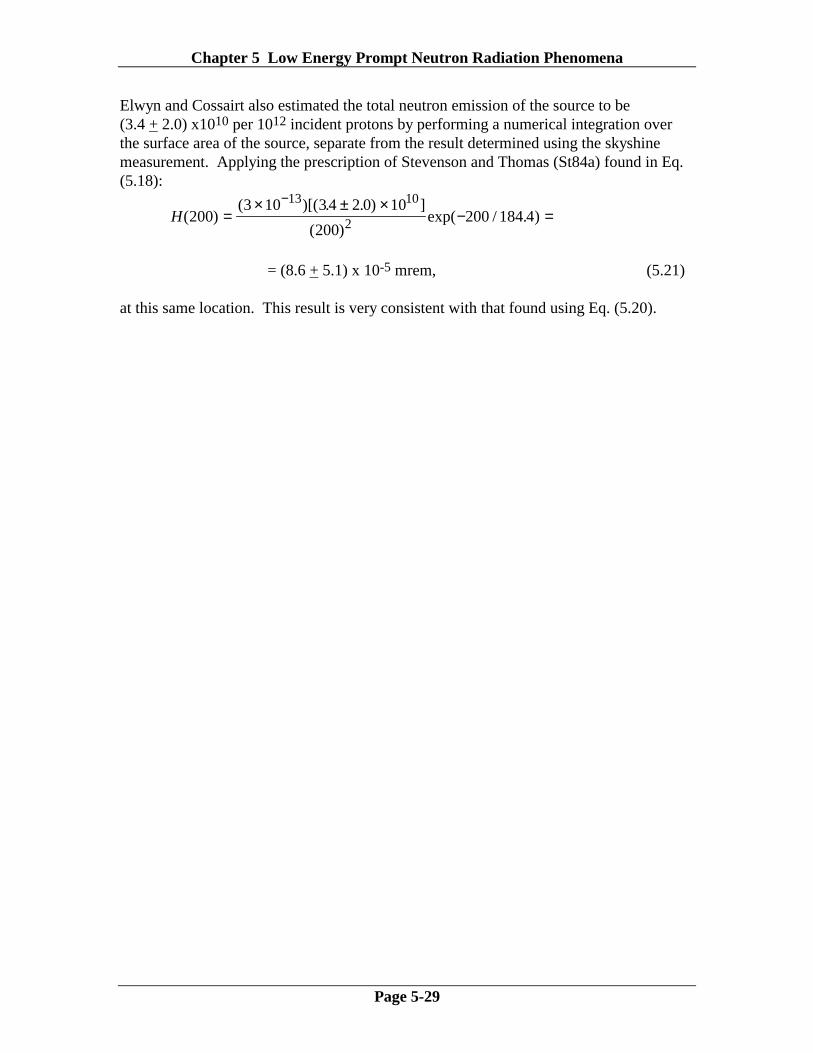
Elwyn and Cossairt also estimated the total neutron emission of the source to be (3.4 + 2.0) x1010 per 1012 incident protons by performing a numerical integration over the surface area of the source, separate from the result determined using the skyshine measurement. Applying the prescription of Stevenson and Thomas (St84a) found in Eq. (5.18):
H( )( )[( . . ) ]
( )exp( / . )200
3 10 34 2 0 10
200200 184 4
13 10
2=× ± ×
− =−
= (8.6 + 5.1) x 10-5 mrem, (5.21) at this same location. This result is very consistent with that found using Eq. (5.20).
Chapter 5 Low Energy Prompt Neutron Radiation Phenomena
Page 5-30
Problems 1. A 1 µA 100 MeV electron beam is incident on an "optimized bremsstrahlung"
target in a shielding configuration and labyrinth like that in Fig. 5.3. Using the facts given in Chapter 3 (Swanson’s Rules of Thumb, etc.) about bremsstrahlung, calculate the dose equivalent rate at the exit of a labyrinth having 2 legs. Set all distances, di, d1, and d2 = 3 meters. If the goal is to get the dose equivalent rate at the exit to be < 1 mrem/hr, is this a sensible design? The 2 legs are 1 x 2 meter2 in cross section and, since no other information is available, use α = 10-2 as a "conservative" value. [Hint: One needs to calculate the projected diameter of the beam at the wall where the first scatter occurs. This can be done using Eq. (3.12).]
2. A 500 GeV proton beam of 1011 protons/second strikes a magnet 2 m from the
mouth of a 3-legged labyrinth. Each of the 3 legs is 4 meters long and 1 x 2 m2 in cross section. The length of leg 1 is measured from the mouth of the labyrinth to the center of the first turn, all other lengths are measured between centers of turns. Assume the source is an on-axis “point source”. Using Goebel's "universal" curves and Rameika's source term, what is the dose equivalent rate at the exit expressed in rem hr-1. How far away from the exit does the value of dH/dt fall to 10 mrem hr-1.
3. A high energy accelerator has a section of beamline which was poorly designed.
Beam losses and insufficient shielding have resulted in a region of roof 10 meters wide and 50 meters long where a neutron dose equivalent rate averaging 100 mrem/hour (averaged over the surface of the weak shield) is found. A spectrum measurement indicates the spectrum to be approximately 1/E with an upper end point of approximately 500 MeV. Calculate the dose equivalent rate due to skyshine at distance r = 50, 100, 200, 500, & 1000 m using both formulae presented here.