Embed Size (px)
Citation preview

CHAPTER Launch Internet Explorer Brow ser.lnk
CHAPTER
RECOMBINANT
PROTEASES
CLONING, OVER-EXPRESSION AND
CHARACTERIZATION
5

137
5.1 INTRODUCTION
Genes from the extremophiles are often cloned and over expressed in domestic host
systems to obtain large quantities of enzymes (Corolina et al., 2008; Ni et al., 2009).
It is necessary and interesting to investigate, whether the folding and functioning of
recombinant protein is identical to normal protein.
So far, only few alkaline proteases are purified and characterized from the halophilic
and haloalkaliphilic bacteria, which primarily may be due to the difficulties associated
with the protein stability in the absence of salt. Characterization of such
haloalkaliphilic enzymes would provide important clue for the adaptation strategies
and stability of the biomolecules under which they can sustain with more than one
extremities of NaCl, pH and sometimes temperature.
In this context, during recent years gene cloning from extremophiles into mesophilic
bacteria has focused considerable attention. However, as said earlier in chapter 4, only
few alkaline proteases from halophiles and haloalkaliphiles are purified and
characterized due to its instability in the absence of salt (Dodia et al., 2008a; Ni et al.,
2009). Most typical halophilic enzymes require high concentrations of salt for their
activity and stability and are inactivated in Escherichia coli unless refolded in the
presence of salts under in-vitro conditions.
Recombinant DNA technology in conjunction with other molecular techniques is
being used to improve, evolve enzymes and for opening new opportunities for the
construction of genetically modified microbial strains with the selected biocatalysis
(Battestein, 2007; Caralino et al., 2008). Knowledge of full nucleotide sequences of
enzymes has facilitated the deduction of the primary structure of the encoded enzymes
and, in many cases, identification of various functional regions. These sequences also
serve as the basis for phylogenetic analysis of proteins and assist in predicting the
secondary structure of proteins, leading to the understanding of structure and function
relationship of the enzymes (Purohit and Singh, 2009; Siddhpura et al., 2010).
Therefore, cloning of the potential genes coding for different enzymes would be an
attractive approve to begin with. Some alkaline protease-encoding bacterial genes
have been cloned and expressed in new hosts, the two major organisms for cloning
and over-expression being E. coli and B. subtilis (Fu et al., 2003; Wang et al., 2008).

138
Developments in molecular approaches to improve the cloning and expression of
genes leads to enhanced solubilization of the expressed proteins from halophilic and
other extremophilic organisms in heterologous hosts will certainly boost the number
of enzyme-driven transformations in chemical, food, pharmaceutical and other
industrial applications. This process will add to the prospect of enzyme-driven
catalysis (Kim et al., 1998; Machida et al., 1998; Machida et al., 2000; Singh et al.,
2002). In this chapter we have described our studies on alkaline protease gene from
haloalkaliphilic bacteria which has been cloned and expressed in E. coli as host. The
properties of the recombinant enzyme were then compared with the native one. The
major aspects of cloning and over-expression discussed in detail are as depicted in
Fig.5.1.1
Fig.5.1.1: The schematic representation of major aspects covered in Chapter-5
Expression of recombinant clones
Gelatin Agar Plate SDS-PAGE
Cloning of Alkaline Protease gene from potential candidates
Colony PCR Confirmation of the insert
Amplification of Alkaline Protease gene
Seven Sets of primers designed for amplification of alkaline protease genes.

139
5.2 MATERIALS AND METHODS
5.2.1 Bacterial strain and plasmids
The bacterial strains used for cloning procedures and expression analysis were E. coli
TOP10 and BL21a+ (DE3) (Invitrogen, USA). Plasmid over-expression vector
pET21a+ (Invitrogen, USA) was used for expression analysis of serine alkaline
proteases.
5.2.2 Sample collections and growth conditions
Sample collections, growth conditions and phylogenentic determination of O.M.A18
and O.M.E12 were as described in details in chapter-2.
5.2.3 DNA manipulations
Isolation and assessment of genomic DNA and plasmid DNA
Genomic DNA of haloalkaliphilic bacterial strains O.M.E12 and O.M.A18 were
isolated by enzymatic method (Sambrook and Russell, 2001). Plasmids DNA were
retrieved by using SDS-Miniprep method (Sambrook and Russell, 2001) from
transformed clones of BL21 (DE3) harboring pET21a+. Purity and yield of DNA
preparations were judged and analyzed by spectrophotometric assessment/Nanodrop
and agarose gel electrophoresis. The 1,000-bp PCR-amplified products were gel
purified by using the QIAgen PCR purification kit (Qiagen, Germany) according to
the manufacturer’s instructions after resolving on a 0.8% agarose gel.
PCR primer designing
In order to amplify the complete ORF (1.0 kb) of the protease gene, six pairs of
primers were designed specifically for haloalkaliphilic extracellular alkaline protease.
As described in brief in chapter-3; among the six pairs, three pairs of primers used for
amplification profile SPS-1, 3 and 4 were synthetic degenerate oligonucleotides based
on the previously known sequence of extracellular alkaline protease gene from
Bacillus halodurans, Bacillus cerus and Oceanobacillus iheyensis serine proteases
respectively. UTR region of known sequences were used as a frame for primer
designing procedures. Primer pair, SPS-5 was designed on the basis of identification
of conserved residues among the already reported alkaline proteases sequences
belonging to haloalkaliphilic bacteria. The conserved pattern within the UTR’s was
identified using multiple sequence alignment tool-CLUSTAL W (Thompson et al.,

140
1994) (www.ebi.ac.uk/Tools/msa/clustalw2/). All the above described primer pair
combinations were designed manually, while two primer pairs were designed on the
basis of conserved sequences of Haloalkaliphilic Bacillus species, by generating block
using degenerate primer designing bioinformatics tool-CODEHOP. A set of forward
and reverse primers were designed on the basis of conserved sequences of 15
haloalkaliphilic Bacillus species alkaline proteases, by using multiple sequencing tool,
followed by block generation using degenerate primer designing bioinformatics tool-
CODEHOP (Timothy et al., 2003) (Fig.5.2.1). All the designed primers were
commercially synthesized (Sigma Aldrich, Life Sciences). The sequence and
description of all six pairs of primers are described in details in materials and methods
section of chapter-3. The primer set that yielded the specific amplified product was:
SPS-6 forward 5’-cat atg ccg ccg agg agg ac-3’(Tm 66oC) and SPS-6 reverses 5’-gtc
gac ggc ctt cgt gtg g-3’ (Tm 64oC).
CODEHOP Results
Oligo Summary Not all overlapping primers are shown
CODEHOP Version 10/14/04.1
COPYRIGHT 1997-2004, Fred Hutchinson Cancer Research Center, Seattle, WA, USA
Parameters:
Amino acids PSSM calculated with odds ratios normalized to 100
and back-translated with Standard genetic code Maximum core degeneracy 128 Core strictness 0.00
Clamp strictness 1.00 Target clamp temperature 60.00 C
DNA Concentration 50.00 nM Salt Concentration 50.00 mM Codon boundary 0 Most common codon 0
Suggested CODEHOPS: The degenerate region (core) is printed in lower case,
the non-degenerate region (clamp) is printed in upper case.
Block x25568xblB Oligos
P E A A E E N K K D Y L I
CCGCCGAGGAGGACAAGrarrantayyt -3' Core: degen=128 len=11 Clamp: score=66, len=17 temp= 63.0
GCCGCCGAGGAGGACrarrarranta -3' Core: degen=128 len=11 Clamp: score=63, len=15 temp= 61.6
Complement of Block x25568xblB
P E A A E E N K K D Y L I
No suggested primers found.
Block x25568xblC
E F N D E V D I Q S E E E E Y D
No suggested primers found.
Complement of Block x25568xblC
E F N D E V D I Q S E E E E Y D
No suggested primers found.
Block x25568xblD Oligos
D V I H E F E T I P V I H A E L S P K E L K K L K K D P N I N Y I E E D A E V T
CCAACATCAACTACATCGAGGAGraygynsargt -3' Core: degen=128 len=11 Clamp: score=72, len=23 temp= 60.9
AAGGACCCCAACATCAACTACAThgarrarrayg -3' Core: degen=96 len=11
Clamp: score=70, len=23 temp= 60.9

141
AAGGACCCCAACATCAACTACathgarrarra -3' Core: degen=48 len=11
Clamp: score=65, len=21 temp= 60.9 GAGGTGAAGAAGCTGAAGAAGgayccnamnrt -3' Core: degen=128 len=11 Clamp:
score=69, len=21 temp= 61.4
Complement of Block x25568xblD Oligos
D V I H E F E T I P V I H A E L S P K E L K K L K K D P N I N Y I E E D A E V T
ctrggntknyaGTTGATGTAGCTCCTCCTGC -5' Core: degen=128 len=11
Clamp: score=68, len=20 temp= 60.3 tadctyytyytGCGGCTCCACTGT -5' Core: degen=48 len=11
Clamp: score=71, len=13 temp= 52.7 *** CLAMP NEEDS EXTENSION
adctyytyytrcGGCTCCACTGT -5' Core: degen=96 len=12 Clamp: score=69, len=11 temp= 42.3 *** CLAMP NEEDS EXTENSION
ctyytyytrcrGCTCCACTGT -5' Core: degen=64 len=11 Clamp: score=69, len=10 temp= 22.6 *** CLAMP NEEDS EXTENSION
Block x25568xblE Oligos
M S Q T V P W G I S R V N T Q Q A H N R G I F G N G I K V A V L D T G I S Q H P D L N I Q G G A S F I P S E P
GGTGGCCGTCCTGgayacnggnat -3' Core: degen=32 len=11 Clamp:
score=73, len=13 temp= 60.1 CGTCAAGGTGGCCGTCCTngayacnggna -3' Core: degen=128 len=11 Clamp:
score=74, len=18 temp= 64.6
GCGTCAAGGTGGCCGTCytngayacngg -3' Core: degen=64 len=11 Clamp: score=70, len=17 temp= 64.0
CGGCGTCAAGGTGGCCrtnytngayac -3' Core: degen=128 len=11 Clamp:
score=72, len=16 temp= 65.0
Complement of Block x25568xblE Oligos
M S Q T V P W G I S R V N T Q Q A H N R G I F G N G I K V A V L D T G I S Q H P D L N I Q
G G A S F I P S E P anctrtgnccntAGAGGTGCGTGGGGC -5' Core: degen=128 len=12
Clamp: score=62, len=15 temp= 61.7
ctrtgnccntaGAGGTGCGTGGGGC -5' Core: degen=32 len=11 Clamp: score=56, len=14 temp= 61.7
Block x25568xblF Oligos
S T H D N N G H G T H V A G T I A A L N N S I G V L G V A P S A E L Y A V K V L N R N G
S G S Y S S I A Q G L
GCCGAGCTGTACGCCgynaargtnyt -3' Core: degen=128 len=11 Clamp: score=73, len=15 temp= 62.8
CATCGGCGTGCTGggnrtngcncc -3' Core: degen=128 len=11 Clamp: score=64,
len=13 temp= 62.2 ACCCAGGACGACAACggncayggnac -3' Core: degen=32 len=11 Clamp: score=71, len=15 temp= 60.5
TCCACCCAGGACGACAAyggncayggna -3' Core: degen=64 len=11 Clamp: score=72, len=17 temp= 59.5 *** CLAMP
NEEDS EXTENSION TCCACCCAGGACGACaayggncaygg -3' Core: degen=16 len=11 Clamp: score=64, len=15 temp= 59.5 *** CLAMP NEEDS
EXTENSION
TCCACCCAGGACGAnaayggncayg -3' Core: degen=64 len=11 Clamp: score=69, len=14 temp= 52.3 *** CLAMP NEEDS
EXTENSION
TCCACCCAGgayrrnaaygg -3' Core: degen=64 len=11 Clamp: score=60, len=9 temp= 37.3 *** CLAMP NEEDS
EXTENSION
Complement of Block x25568xblF Oligos
S T H D N N G H G T H V A G T I A A L N N S I G V L G V A P S A E L Y A V K V L N R N G
S G S Y S S I A Q G L ctryynttrccGGTGCCGTGGGT -5' Core: degen=64 len=11 Clamp: score=77, len=12 temp= 62.5
ttrccngtrccGTGGGTGCACCGG -5' Core: degen=16 len=11 Clamp: score=74, len=13 temp= 63.5
trccngtrccntGGGTGCACCGGCC -5' Core: degen=64 len=12 Clamp: score=77, len=13 temp= 61.2 ccngtrccntgGGTGCACCGGCC -5' Core: degen=32 len=11 Clamp: score=73, len=12 temp= 61.2
ccnyancgnggGCTGCGGCTCGA -5' Core: degen=128 len=11 Clamp:
score=56, len=12 temp= 60.7 crnttycanraCCTGTCCTTGCCGTAGC -5' Core: degen=128
len=11 Clamp: score=58, len=17 temp= 64.3
Block x25568xblG
E W A I N N N M H I I N M S L G S T S P S K T L E Q A V N R A N N A G V L L V G A S G N
N G R Q S V N Y P A R No suggested primers found.

142
Complement of Block x25568xblG Oligos
E W A I N N N M H I I N M S L G S T S P S K T L E Q A V N R A N N A G V L L V G A S G N
N G R Q S V N Y P A R
ctyacccgnnmGTTGTTGTTGTACGTGTAGCA -5' Core: degen=64 len=11 Clamp: score=74, len=21 temp= 60.5
Block x25568xblH Oligos
Y E N V M A V G A T D Q N N Q R A S F S Q Y G P G L E I V A P G V N V Q S T Y Q G N R Y V S L S G T S M A T P
CGTGGCCCCCggngtnaaybt -3' Core: degen=96 len=11 Clamp: score=70,
len=10 temp= 60.0 TCGAGATCGTGGCCccnggngtnaa -3' Core: degen=64 len=11 Clamp:
score=66, len=14 temp= 61.8
GGGATCGAGATCGTGgcnccnggngt -3' Core: degen=64 len=11 Clamp: score=61, len=15 temp= 60.1
Complement of Block x25568xblH Oligos
Y E N V M A V G A T D Q N N Q R A S F S Q Y G P G L E I V A P G V N V Q S T Y Q G N R Y V S L S G T S M A T P
cgnggnccncaCTTGCACTTCTGGTGGATGG -5' Core: degen=64 len=11
Clamp: score=68, len=20 temp= 60.8 ggnccncanttGCACTTCTGGTGGATGGGC -5' Core: degen=64 len=11
Clamp: score=63, len=19 temp= 63.5
ccncanttrvaCTTCTGGTGGATGGGCCC -5' Core: degen=96 len=11 Clamp: score=58, len=18 temp= 63.2
Block x25568xblI Oligos
H V A G V A A L V W S Q N P H W D N N Q I R Q H L K Q T A T Y L G N P N L Y G N G N V
N A N R A T F
GAACCCCCACTGGACCaayrwncanat -3' Core: degen=128 len=11 Clamp: score=62, len=16 temp= 61.8
CACGTGGCCggngyngcngc -3' Core: degen=128 len=11 Clamp: score=65, len=9 temp= 48.5 *** CLAMP NEEDS
EXTENSION
Complement of Block x25568xblI Oligos
H V A G V A A L V W S Q N P H W D N N Q I R Q H L K Q T A T Y L G N P N L Y G N G N V
N A N R A T F ccncrncgncgGGACCAGACCGTCG -5' Core: degen=128 len=11 Clamp: score=66, len=14 temp= 61.6
ttrywngtntaGGCCTTCGTGTAGTTCG -5' Core: degen=128 len=11 Clamp: score=59, len=17
temp= 61.2
Oligos
Degenerate alphabet D P N I N Y I E E D A
ctrggntknyaGTTGATGTAGCTCCTCCTGC oligo:5'-CGTCCTCCTCGATGTAGTTGaynktnggrtc-3' degen=128 temp=60.3
I E E D A E V T tadctyytyytGCGGCTCCACTGT oligo:5'-TGTCACCTCGGCGtyytyytcdat-3' degen=48 temp=52.7 Extend clamp
E E D A E V T
adctyytyytrcGGCTCCACTGT oligo:5'-TGTCACCTCGGcrtyytyytcda-3' degen=96 temp=42.3 Extend clamp
E E D A E V T
ctyytyytrcrGCTCCACTGT oligo:5'-TGTCACCTCGrcrtyytyytc-3' degen=64 temp=22.6 Extend clamp
Block x25568xblE G I K V A V L D T
oligo:5'-CGGCGTCAAGGTGGCCrtnytngayac-3' degen=128 temp=65.0
I K V A V L D T G oligo:5'-GCGTCAAGGTGGCCGTCytngayacngg-3' degen=64 temp=64.0
I K V A V L D T G I
oligo:5'-CGTCAAGGTGGCCGTCCTngayacnggna-3' degen=128 temp=64.6 V A V L D T G I
oligo:5'-GGTGGCCGTCCTGgayacnggnat-3' degen=32 temp=60.1
Complement of Block x25568xblE D T G I S Q H P D
anctrtgnccntAGAGGTGCGTGGGGC oligo:5'-CGGGGTGCGTGGAGAtnccngtrtcna-3' degen=128 temp=61.7
D T G I S Q H P D ctrtgnccntaGAGGTGCGTGGGGC oligo:5'-CGGGGTGCGTGGAGatnccngtrtc-3' degen=32 temp=61.7
Block x25568xblF S T H D N N G
oligo:5'-TCCACCCAGgayrrnaaygg-3' degen=64 temp=37.3 Extend clamp
S T H D N N G H G oligo:5'-TCCACCCAGGACGAnaayggncayg-3' degen=64 temp=52.3 Extend clamp
S T H D N N G H G
oligo:5'-TCCACCCAGGACGACaayggncaygg-3' degen=16 temp=59.5 Extend clamp S T H D N N G H G T

143
oligo:5'-TCCACCCAGGACGACAAyggncayggna-3' degen=64 temp=59.5 Extend clamp
T H D N N G H G T oligo:5'-ACCCAGGACGACAACggncayggnac-3' degen=32 temp=60.5
I G V L G V A P
oligo:5'-CATCGGCGTGCTGggnrtngcncc-3' degen=128 temp=62.2 A E L Y A V K V L
oligo:5'-GCCGAGCTGTACGCCgynaargtnyt-3' degen=128 temp=62.8
Complement of Block x25568xblF D N N G H G T H
ctryynttrccGGTGCCGTGGGT oligo:5'-TGGGTGCCGTGGccrttnyyrtc-3' degen=64 temp=62.5
N G H G T H V A ttrccngtrccGTGGGTGCACCGG oligo:5'-GGCCACGTGGGTGccrtgnccrtt-3' degen=16 temp=63.5
G H G T H V A G
trccngtrccntGGGTGCACCGGCC oligo:5'-CCGGCCACGTGGGtnccrtgnccrt-3' degen=64 temp=61.2 G H G T H V A G
ccngtrccntgGGTGCACCGGCC oligo:5'-CCGGCCACGTGGgtnccrtgncc-3' degen=32 temp=61.2
G V A P S A E L
ccnyancgnggGCTGCGGCTCGA oligo:5'-AGCTCGGCGTCGggngcnayncc-3' degen=128 temp=60.7
V K V L N R N G S G
crnttycanraCCTGTCCTTGCCGTAGC oligo:5'-CGATGCCGTTCCTGTCCarnacyttnrc-3' degen=128 temp=64.3 Complement of Block x25568xblG
E W A I N N N M H I I
ctyacccgnnmGTTGTTGTTGTACGTGTAGCA oligo:5'-ACGATGTGCATGTTGTTGTTGmnngcccaytc-3' degen=64 temp=60.5
Block x25568xblH
G L E I V A P G V oligo:5'-GGGATCGAGATCGTGgcnccnggngt-3' degen=64 temp=60.1
E I V A P G V N oligo:5'-TCGAGATCGTGGCCccnggngtnaa-3' degen=64 temp=61.8
V A P G V N V
oligo:5'-CGTGGCCCCCggngtnaaybt-3' degen=96 temp=60.0 Complement of Block x25568xblH
A P G V N V Q S T Y Q
cgnggnccncaCTTGCACTTCTGGTGGATGG oligo:5'-GGTAGGTGGTCTTCACGTTCacnccnggngc-3' degen=64 temp=60.8
P G V N V Q S T Y Q
ggnccncanttGCACTTCTGGTGGATGGGC oligo:5'-CGGGTAGGTGGTCTTCACGttnacnccngg-3' degen=64 temp=63.5
G V N V Q S T Y Q G ccncanttrvaCTTCTGGTGGATGGGCCC oligo:5'-CCCGGGTAGGTGGTCTTCavrttnacncc-3' degen=96 temp=63.2
Block x25568xblI
H V A G V A A oligo:5'-CACGTGGCCggngyngcngc-3' degen=128 temp=48.5 Extend clamp
N P H W D N N Q I
oligo:5'-GAACCCCCACTGGACCaayrwncanat-3' degen=128 temp=61.8 Complement of Block x25568xblI
G V A A L V W S Q
ccncrncgncgGGACCAGACCGTCG oligo:5'-GCTGCCAGACCAGGgcngcnrcncc-3' degen=128 temp=61.6 N N Q I R Q H L K Q
ttrywngtntaGGCCTTCGTGTAGTTCG oligo:5'-GCTTGATGTGCTTCCGGatntgnwyrtt-3' degen=128 temp=61.2
Fig. 5.2.1: Conserved primer designing of alkaline proteases by block generation
using online CODEHOP (Consensus Degenrate Oligonucleotide Primer) tool.

144
Polymerase chain reaction for amplification of protease gene
Polymerase chain reaction was carried using Gradient Eppendorf Thermocycler.
To 100ng of DNA as the template, 25 pmol of each forward and reverse
oligonucleotides primer, 25µl of 2X red mix plus which contains all the reagents and
enzymes required for PCR reaction except primers and template DNA (Merk, Life
sciences, India) were added. Negative controls were included in the PCR reactions to
establish the validity of the experiment. Experiment was carried out under the thermal
cycling conditions as described in Materials and Method section of Chapter-3.
In general cycles were designed as: [95°Cx5 mins] x1, [95°Cx1 mins/50°C x 45s/and
72°C x1 min] x 30, [72°C x1 min] x 1.
5.2.4 Cloning of PCR Product (Digestion and ligation procedure)
Approximately 200ng of plasmid DNA and 50ng of the insert DNA samples were
digested in 30µl reaction mixtures with BamHI for 4 hours under the conditions
specified by the manufacturer (Merk life science, India). The digested samples
(10-15µl) were resolved on 1.2% agarose gel along with broad range DNA marker
(Merk life sciences, India) to analyze the restriction patterns. Purification of RE
digested products were subsequently done by using PCR purification kit (Merk Life
sciences, India). For ligation procedures, 250ng of the purified fragment and 50ng
pET21a+ was added in a sterile eppendorf tubes, final reaction mixture was made
upto 25µl with sterile MilliQ grade D/W. Tubes were incubated overnight at 4°C as
per manufacturer’s instructions (Promega, Madison, Wisc., USA). This ligation
mixture was used to transform E. coli strain Top10 (Novagen) (Sambrook and Russell,
2001). The bacterial colonies containing recombinant plasmids were selected on LB
agar medium containing 0.5mM IPTG (isopropyl-D-thiogalactopyranoside) and 50
µg/ml ampicillin. The overall flow chart of cloning procedures is as described in
5.2.2.After sub-cloning the PCR product - pET21a+ plasmids were re-extracted from
Top10 for further confirmation of positive clones.
Sequence of the insert was confirmed by sequencing (Merk life science, India), and
found to be in frame to vector. Further, it was re-transformed in over-expression host;
BL21 (DE3) by using standard calcium transformation procedures (Sambrook and
Russell, 2001).

145
5.2.5 Cloning confirmation by restriction analysis
Plasmids harbored by positive clones were re-digested in 30µl reaction mixtures with
NotI restriction enzyme and incubated at 16°C for 4 hours (Merk life science, India).
The digested samples (10–15µl) were resolved on 1.2% agarose gel along with broad
range DNA marker (Merk Life Science) to analyze the restriction patterns.
Fig.5.2.2: The major steps of cloning of alkaline protease genes
5.2.6 Expression Analysis
Effect of temperature and IPTG Induction on the growth and expression of
alkaline protease enzyme
Recombinant clones were screened on gelatin agar plate (pH-7) for enzyme secretion
at different IPTG concentrations (0.1-3mM) and growth temperatures (27 and 37oC).
Positive clones were grown in LB broth containing ampicillin (30µg/ml). At regular
interval of time, 2 ml of culture was withdrawn and centrifuged at 5000 rpm for 5 min
at 4°C. The growth was measured at 660nm. The cells were suspended in 1ml
potassium phosphate buffer (pH-8) and subjected to sonication at 30Hz for 30 seconds
•Amplicon and pET 21a+ was Digested by BamH1
•Amplicon and pET 21a+ was Digested by Sal1RE Digestion-
• Double digested amplicon and vector was ligated in ratio of 1:3
•Ligation carried by Quick Ligase, FermentasLigation
•Ligated vector transformed to Top 10(E.coli Host strain)
•5 Poisitive clones for O.M.A18 and 7 positive clones for O.M.E12 obtained on plate containing LB+Ampicillin
Transformation-I
•Colony PCR
•To check for release of vectorConfirmation of transformation
•Positive clone from both the strains vector transformed in BL21 Host strain(Expression strain)Transformation-II

146
in 6 cycles. Samples were cooled in ice for 30 seconds between each cycle. The
resulted supernatant after sonication was treated as soluble fraction. The pellet was
then treated with 8M urea for 30 min at 30oC, followed by centrifugation at 5000rpm
for 5 minutes at 10oC to obtain supernatant, which was treated as insoluble fraction.
The insoluble fractions were dialyzed against phosphate buffer (pH-8) to renature the
denatured enzyme for further analysis. Insoluble and soluble fractions in required
aliquot judged on the basis of total protein estimation were taken as an enzyme
sample for activity analysis and SDS-PAGE confirmation.
Enzyme Assay and Protein estimation
The alkaline protease activity and total protein estimation was measured by Anson-
Hagihara's and Bradford method as described in detail in Materials and Method
section of chapter-4.
SDS-polyacryalamide gel electrophoresis
Sodium dodecyl sulphate polyacrylamide gel electrophoresis (SDS-PAGE) was
carried out according to the method of Laemmli as described in detail in Materials and
method section of chapter-4. To visualize protease expression, soluble and insoluble
fractions (20μg) were loaded onto gel. The molecular weight of the enzyme was
determined using reference molecular weight marker (Middle range ruler, Merk life
science, India).
One-step purification of enzyme
Purification fractions having enzyme activities were pooled together on the basis of
elution profile. Sample was purified to homogeneity by one step affinity
chromatography using Nickel as a matrix column. Purification procedure was
performed as described by using gradient of Immidazole concentration from
(0-20mM) (Sambrook and Russell, 2001).
5.2.7 Enzyme characterization
Effect of temperature and pH
The effect of pH and temperature was monitored by incubating the reaction mixture at
the set conditions. For the effect of temperature on catalysis, the activity was
determined by incubating the assay mixture at temperatures, 37, 50, 60 and 70°C.
Similarly, the effect of pH was assessed by performing the enzyme activity in the
range of pH 7-10.

147
Effect of urea on enzyme activity
The effects of chemical denaturing agent, urea (8M), on the enzyme preparations were
studied. The recombinant enzymes were incubated with urea at different
temperatures; 50, 60 and 70°C as similar to its native counterparts (Purohit and Singh,
2011. The enzyme mixtures were incubated at set conditions for 3 hours followed by
measurement of the residual activity to ascertain the loss of enzyme activity.
Effect of NaCl on enzyme stability
Effect of NaCl on temperature profile was explored by incubating the reaction
mixtures supplemented with various concentrations of NaCl (0-3M).
Enzyme Thermostability
The thermal stability of the enzyme was studied by incubating it at different
temperatures; 37, 50 and 60°C. The enzyme aliquots were withdrawn at regular
intervals up to 24 hours and the enzyme activities were measured at optimum
temperature.
5.2.8 DNA Sequencing and in-silico analysis
Plasmids were retrieved from positive clones and sequenced from both ends, using
standard T7 promoter and terminator sequence which was on a flanking region of
insert by chromosome walking method, using custom based service of Merk Life
sciences, India. Sequence homologies to known nucleotide sequences in the GenBank
database were determined using the BLAST algorithm of the NCBI at the National
Library of Medicine. A phylogenetic tree for recombinant O.M.A18 and O.M.E12
were constructed of aligned sequences by the Neighbor-Joining method clustering
strategy in Mega 4.0(www.megasoftware.net) (Tamura et al., 2007). Other DNA
analyses, required for cloning confirmation i.e. restriction analysis and primer
prediction were carried out by CLC main workbench (Dainith, 2004). The amino acid
sequence for both of them were deduced using translate tool of Expasy
(http://expasy.org/tools/translate), exploiting correct ORF predicted by NCBI
(www.ncbi.nlm.nih.gov.in) (Purohit and Singh, 2011). The protein properties
prediction and hydropathy plots were performed by EXpasY (http://expasy.org/tools)
freely available protein server database (Kyte and Doolittle 2007).

148
5.2.9 Modeling of the 3D Structure
Three-dimensional structures of both the serine proteases protein were modeled using
the online I-TASSER server for protein 3D structure prediction (Wu et al., 2007,
Zhang and Zeng, 2008, Zhang et al., 2008). The server also predicts other molecular
information’s, such as distribution of amino acids, active site moiety, primary and
secondary protein structure properties by Profile Profile Alignment (PPA) Threading
techniques. For the O.M.A18 and O.M.E12 proteases, 5 models were obtained.
5.2.10 Nucleotide sequence accession numbers
The DNA sequence of the protease genes cloned and studied in present work were
submitted in the GenBank database under the accession number HM219179 for
O.M.A18 and HM219182 for O.M.E12 with its characteristic properties in native and
recombinant system.

149
5.3 RESULTS AND DISCUSSION
5.3.1 Amplification profile and cloning of the protease gene
The amplification of the alkaline protease gene was carried out using the genomic
DNA of Oceanobacillus iheyensis O.M.A18 (gene bank accession number-
EU680961) and Haloalkaliphilic bacterium O.M.E12 (Gene bank accession no.
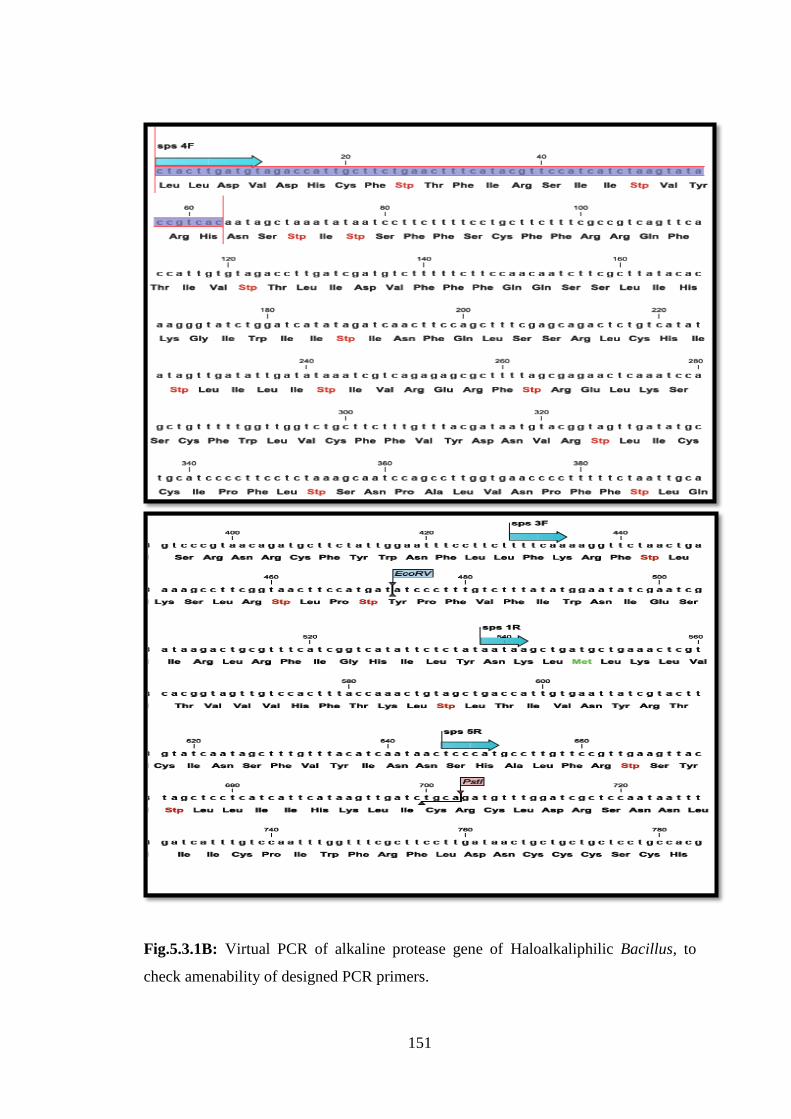
EU680960). Virtual PCR was carried out to analyze the product size of amplicons.
The predicted amplicons are as described in Fig. 5.3.1 A and B. Restriction analysis
of amplified PCR was judged by RE cutter. The results are as described in Fig.5.3.2.
PCR reaction was carried out at three gradient of annealing temperatures using
Gradient Thermocycler (Eppendorf).
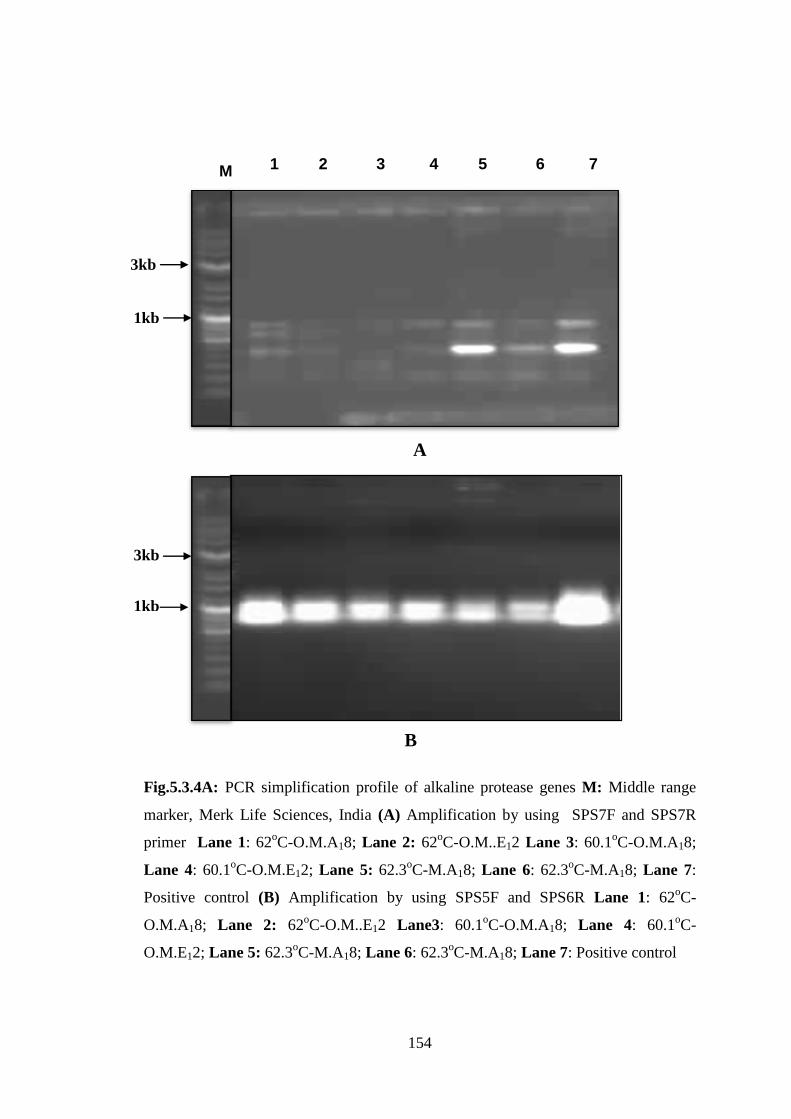
The 1-kb coding region of the gene was PCR amplified by using primer pair designed
as described in materials and methods section. Amplicon size of product obtained
from SPS-6 was of aprox. 1kb for O.M.A18 and O.M.E12 at Ta of 60°C, however as
described earlier in Result and Discussion section of Chapter-3 in protease
amplification section, concentration of product varied with respect to gradient of
temperature and primer pair used for the amplification profile generation (Fig.5.3.3 A
and B). For, visual assessment and quantification of PCR products; both the
amplicons were resolved on an agarose gel.
Amplicon were further purified by using PCR purification kit (Merk life sciences,
India) to remove traces of enzymes and chemicals. After, successful restriction
digestion procedures, O.M.A18 and O.M.E12 digested amplicons were cloned into
suitable over-expression vector- pET21a+
individually; vector constructs were
transformed into over-expression host Escherichia coli BL21 (Fig.5.3.4; 5.3.5).
Selections of positive clones were done on the basis of ampicillin (30µg/ml) as a
marker trait (Fig.5.3.4).
Further, confirmation of positive clones harboring O.M.A18 protease and O.M.E12
protease were done on the basis of excision with BamHI and SalI restriction sites, all
the plasmids were individually digested with these enzymes (Fig. 5.3.6). Two excised
bands were visualized on agarose gel (0.8%) which confirmed the cloning procedures
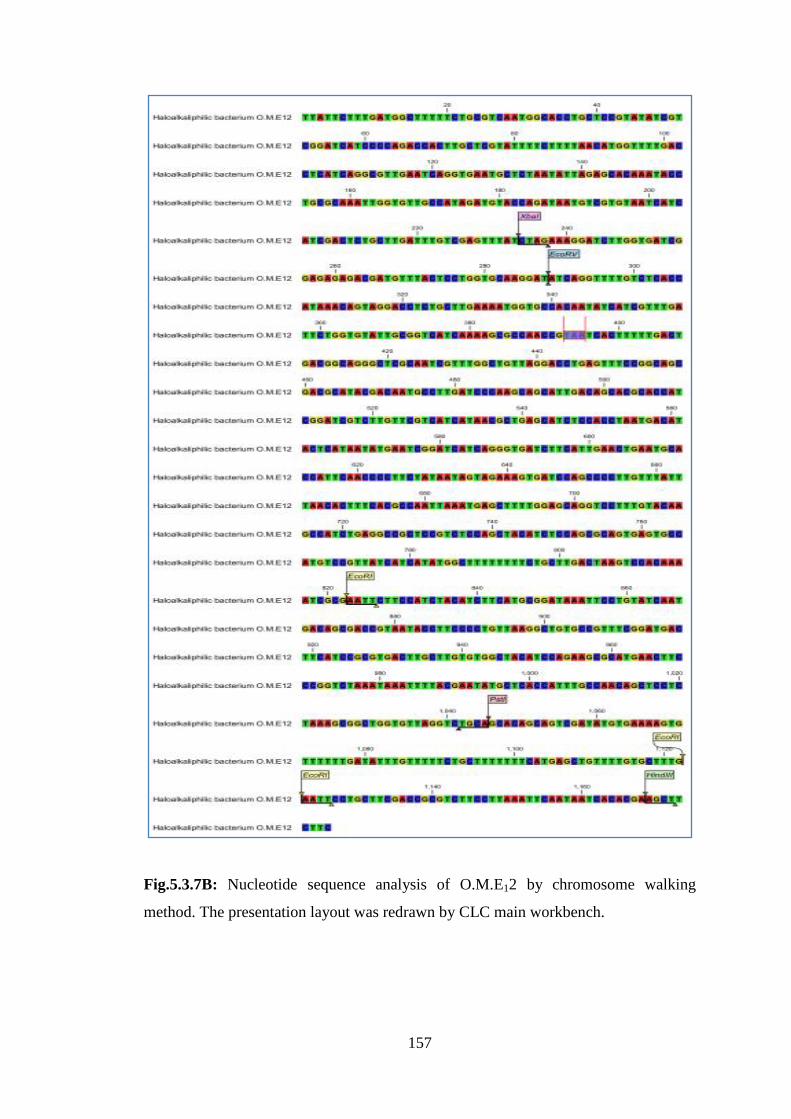
(Fig.5.3.6). The complete analysis of nucleotide sequence was done by chromosome

150
walking method using T7 promoter and terminator sequence of pET21 a+ as a primer
sequence (Fig.5.3.7A and 5.3.7B).
Fig.5.3.1A: Virtual PCR of alkaline protease gene of Oceanobacillus iheyensis to
check amenability of designed PCR primer
151
Fig.5.3.1B: Virtual PCR of alkaline protease gene of Haloalkaliphilic Bacillus, to
check amenability of designed PCR primers.

152
Fig.5.3.2: Snapshot of virtual restriction analysis of conserved region of alkaline
proteases

153
Fig.5.3.3: Amplification profile of alkaline proteases of O.M.A18 and O.M.E12.
0
0.2
0.4
0.6
0.8
1
1.2
SPS-1F&R
SPS-3F&R
SPS-4F&R
SPS-5F &R
SPS-6F &R
SPS7F&R
Size(kb) 1 1.1 0.8
0
0.2
0.4
0.6
0.8
1
1.2
Primer pair combination
S
ize
(kb
)
154
Fig.5.3.4A: PCR simplification profile of alkaline protease genes M: Middle range
marker, Merk Life Sciences, India (A) Amplification by using SPS7F and SPS7R
primer Lane 1: 62oC-O.M.A18; Lane 2: 62
oC-O.M..E12 Lane 3: 60.1
oC-O.M.A18;
Lane 4: 60.1oC-O.M.E12; Lane 5: 62.3
oC-M.A18; Lane 6: 62.3
oC-M.A18; Lane 7:
Positive control (B) Amplification by using SPS5F and SPS6R Lane 1: 62oC-
O.M.A18; Lane 2: 62oC-O.M..E12 Lane3: 60.1
oC-O.M.A18; Lane 4: 60.1
oC-
O.M.E12; Lane 5: 62.3oC-M.A18; Lane 6: 62.3
oC-M.A18; Lane 7: Positive control
M 1 2 3 4 5 6 7
A
B
3kb
1kb
3kb
1kb

155
Fig.5.3.4: Expressed clones of alkaline proteases gene of O.M.A18 and O.ME12.
Fig. 5.3.5: Virtual Confirmation of ligation insert in pET 21a+
Fig.5.3.6: Confirmation of cloning by release of insert; where colony designated 1, 2,
3 are of O.M.A18 recombinant clone and colony number: 4, 5, 6 are of O.M.E12 clone
O.M.A18

156
Fig.5.3.7A: Nucleotide sequence analysis of O.M.A18 by chromosome walking
method. The presentation layout was redrawn by CLC main workbench.
157
Fig.5.3.7B: Nucleotide sequence analysis of O.M.E12 by chromosome walking
method. The presentation layout was redrawn by CLC main workbench.

158
5.3.2 Analysis of the nucleotide and protein sequence
The plasmids isolated from clones were used for sequencing. As the size of the insert
was 1.0 kb, two internal primers, SPS 6 forward and SPS 6 reverse, were used to
obtain the partial sequence. The sequence contained 50% G + C base pairs. A 100%
homology of the sequence was found with Bacillus sp.KP43 protease. This ORF had a
codon bias towards C or G at position 3 (Purohit and Singh, 2011). Protein similarity
and phylogenetic analysis was carried out by using nBLASTp (prediction of protein
sequence by submitting nucleotide sequence as a query) to identify the protein.
Predicted N-terminal sequence for Oceanobacillus iheyensis O.M.A18 was
5’MNPGSAWRSPVVPFSSLGMSPAYG (Purohit and Singh, 2011) and for;
Haloalkaliphilic bacterium O.M.E12 was 5’KLRVIIEFKEDAVEAGIQSTKQLMKK.
On the basis of physico-chemical properties predicted by in-silico projection and our
experimental results on thermal stability and denaturation profile were compared and
analyzed (Purohit and Singh, 2011).
5.3.3 Protein solubilization
Protein folding is a specific process that leads to functional molecules under in-vivo
conditions. There are various physico-chemical factors required to maintain the stable
structure. However, the aggregation of newly synthesized proteins emerges as a
process that competes with in-vivo folding (Kim et al., 1998; Machida et al., 1998;
Machida et al., 2000; Singh et al., 2009). The growth and production of foreign
proteins in the host cells is influenced by different factors, such as temperature, pH
and ionic strength. Aggregation of partially folded intermediates leads to the
production of insoluble inclusion bodies, which may be mainly due to unstable
folding intermediate of the target protein at higher temperature and/or during over-
expression of a gene. The optimum secretion of recombinant enzyme was at 27oC on
gelatin plate; however, level of expression at 37oC was also significant for both
recombinant O.M.A18 and O.M.E12. The growth, as expected, was higher at 37oC as
compared to 27oC.

159
Fig.5.3.8A: Effect of induction on growth and enzyme secretion of O.M.A18 (Upper
panel) and O.M.E12 (Lower panel): Effect of inducer (IPTG) on growth and enzyme
production: 1mM IPTG at 37oC; 1mM IPTG at 27
oC; 3mM IPTG at 37
oC; 3mM
IPTG at 27oC were analyzed.
As similar to temperature, with respect to effect of inducer, both the isolates were
reflecting same trends with different concentration of IPTG. Different concentrations
of isopropyl β-d-thiogalactopyranoside (IPTG); 1.0-3.0mM, were used as inducer to
induce the expression of the target protease gene in E. coli harboring recombinant
plasmids.
0
0.5
1
1.5
2
2.5
3
3.5
4
4.5
5
0
1
2
3
4
5
6
7
8
9
10
1 2 3 4
Colony number
colony diameter(mm) at 27oC and 1mM IPTG colony diameter(mm) at 37oC and 3mM IPTG
zone ratio(mm) at 27oC and 1mM IPTG zone ratio(mm) at 37oC and and 3mM IPTG
C
olo
ny
dia
met
er (
mm
)
Zo
ne
rati
o (
mm
)
0
0.5
1
1.5
2
2.5
3
3.5
4
4.5
5
0
1
2
3
4
5
6
7
Effect of Induction

160
1 2 3 4 5 6 7 1 2 3 4 5 6 7
(A) (B)
Fig.5.3.9 A: Expression analysis of protein in soluble and insoluble fractions.
Soluble fractions prepared at different hours after IPTG induction (A) Expression
analysis was carried at 27oC: Lane 1: PCR control; Lane 2: Molecular weight marker
(Middle range, Merk life science); Lane 3: 24 hours sample; Lane 4: 6 hours sample;
Lane 5: 4 hours sample; Lane 6: 2 hours sample; Lane 7: Pre-induction sample
Insoluble fractions prepared at different hours after IPTG induction
(B) Expression analysis was carried at 27oC: Lane 1: Molecular weight marker
(Middle range, Merk life science); Lane 2: Pre-induction sample; Lane 3: 2 hours
sample; Lane 4: 4 hours sample; Lane 5: 4 hours sample; Lane 6: 6 hours sample;
Lane 7: 24 hours sample
1 2 3 4 5 6 7
Fig.5.3.9 B: Expression analysis of protein in soluble fraction. Lane 1: Middle
range Marker. Lane 2: Crude Soluble fraction E12, Lane 3: His tag elution Fraction
(50mM), Lane 4: His tag elution Fraction (100mM Fraction no: 11), Lane 5: His tag
elution Fraction (100mM Fraction no: 12), Lane 6: His tag elution Fraction (200mM
Fraction no: 13), Lane 7: Binding buffer Wash
30kDa
29kDa
29kDa

161
At 1.0mM IPTG induction, higher level of enzyme was produced as compared to
0.5mM, while the optimum enzyme production was evidently with 1mM
concentration (Fig.5.3.8 A and B). Level of induction, however, did not significantly
affect growth of the host cells (Fig.5.3.8 A and B).
Synergistic effect of temperature and IPTG induction on protein solubilization was
examined at; 27oC and 1mM IPTG and 37
oC and 3mM IPTG. For both the isolates, it
was quite distinct that at 27oC and 1mM IPTG, higher level of protein expression was
evident for both the recombinant enzyme preparations. However, substantial enzyme
was expressed at other conditions of growth and induction. The SDS-PAGE patterns
and protease activity revealed that with increasing time after induction, there was
gradual increase in the target protein in soluble fraction (Fig. 5.3.9A). Similar profile
was apparent for insoluble fraction. Although activity was lower than soluble fraction,
it increased with increasing time after induction (Fig. 5.3.9B).
5.3.4 Protease activity assay and enzyme purification
The expressed proteins were fractionated into soluble and insoluble fraction as
described in materials and method section. Fractions collected at different hours i.e. 0,
2, 4, 6, 24 were analyzed for both, soluble and insoluble components. Enzyme
samples of different hours were further analyzed on SDS PAGE (Fig.5.3.9). SDS
PAGE results were quite comparable with the patterns of protease assay. The apparent
molecular weight of the enzyme was estimated as 29 and 30 kDa for O.M.A18 and
O.M.E12, which was quite comparable to our bioinformatics, based prediction as well
our studies on native enzyme preparations of same isolates (Purohit and Singh, 2011).
Purification of protein
To facilitate purification, the recombinant alkaline proteases were expressed with a
His tag at its C-terminal in BL21. Purification was achieved at its homogeneity, which
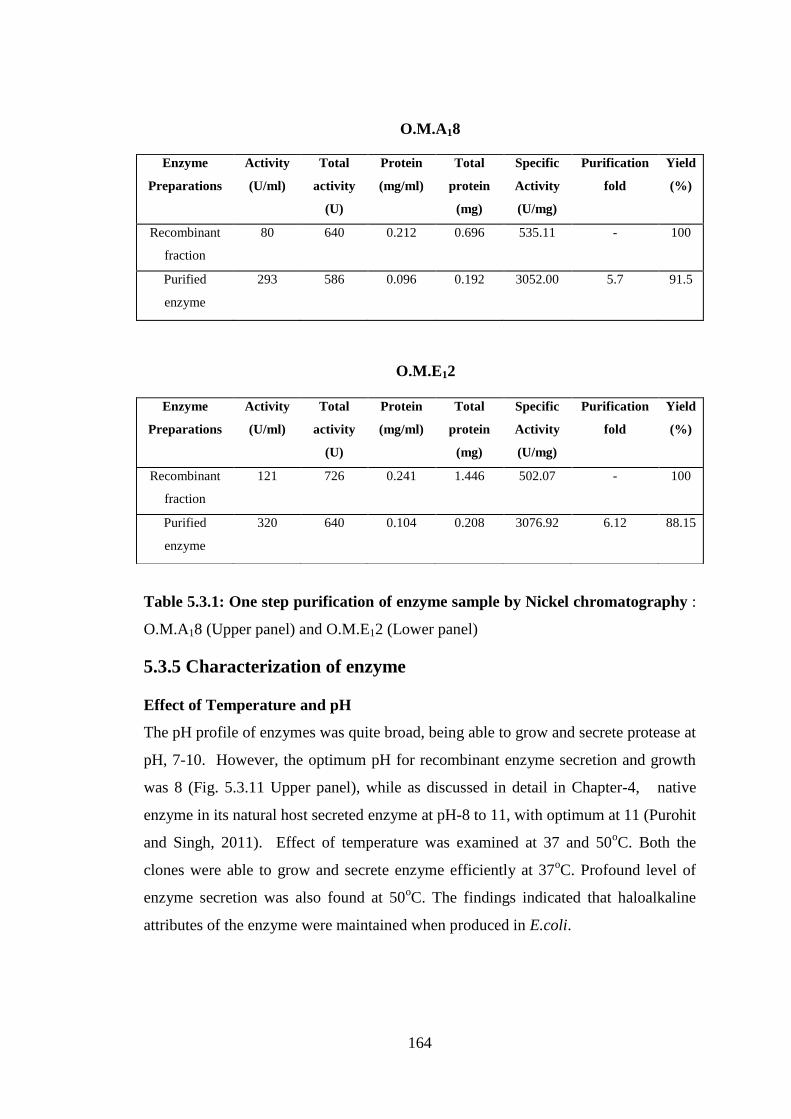
was evident from SDS-PAGE as well activity of enzyme increased to 5.7 fold, with
specific activity of 3,052 for O.M.A18 while for O.M.E12 activity increased to 6.12
fold, with specific activity of 3076.92 and yield of 88.15% (Table 5.3.1).

162
Fig. 5.3.10: Recombinant alkaline proteases purification by nickel
chromatography:
SDS-PAGE profile of recombinant enzyme purified on Ni-Column of recombinant
O.M.A18( Left panel) and O.M.E12(Right panel) Left panel: Lane 1: Crude
Soluble fraction E12, Lane 2: His tag elution Fraction (50mM), Lane 3: His tag
elution Fraction (100mM Fraction no: 11), Lane 4: His tag elution Fraction (100mM
Fraction no: 12), Lane 5: His tag elution Fraction (200mM Fraction no: 13), Lane 6:
Binding buffer Wash, Lane 7: Middle range Marker. Right panel: Lane 1: Crude
Soluble fraction O.M.A18, Lane 2: His tag elution Fraction (50mM), Lane 3: His
tag elution Fraction (100mM Fraction no: 11), Lane 4: His tag elution Fraction
(100mM Fraction no: 12), Lane 5: His tag elution Fraction (200mM Fraction no: 13),
Lane 6: Binding buffer Wash, Lane 7: Middle range Marker
1 2 3 4 5 6 7 1 2 3 4 5 6 7
7
En
zym
e a
ctivity (
U/m
l)

163
Fig.5.3.11: Elution profile of recombinant purified O.M.E12(Upper panel) and
O.M.A18(Lower panel) alkaline protease: Fractions: 1-12, Binding ; 13-23, Buffer
wash; 24-25, 50mM Immidazole ( SRL,Sisco Laboratories,India), 26-27,100mM
immidazole; 28-29, 200mM immidazole, 30; Wash buffer
These results are quite encouraging and interesting in light of verity that, over-
expression of enzyme was achieved in one step and high level of enzyme was
obtained in simple bacterial system and profound amount of enzyme was also noticed
in soluble fractions (Fig.5.3. 10, Fig. 5.3.11 A and B, Table.5.3.1).
0
0.5
1
1.5
2
2.5
0
200
400
600
800
1000
1200
1 3 5 7 9 11 13 15 17 19 21 23 25 27 29
Fraction number
OM.A18 enzyme
Enzyme activity (U/ml) A 280
0
0.5
1
1.5
2
2.5
0
200
400
600
800
1000
1200
O.M.E12 enzyme
Pro
tein
co
nte
nt
(A280)
En
zym
e a
ctiv
ity
(U
/ml)
164
Table 5.3.1: One step purification of enzyme sample by Nickel chromatography :
O.M.A18 (Upper panel) and O.M.E12 (Lower panel)
5.3.5 Characterization of enzyme
Effect of Temperature and pH
The pH profile of enzymes was quite broad, being able to grow and secrete protease at
pH, 7-10. However, the optimum pH for recombinant enzyme secretion and growth
was 8 (Fig. 5.3.11 Upper panel), while as discussed in detail in Chapter-4, native
enzyme in its natural host secreted enzyme at pH-8 to 11, with optimum at 11 (Purohit
and Singh, 2011). Effect of temperature was examined at 37 and 50oC. Both the
clones were able to grow and secrete enzyme efficiently at 37oC. Profound level of
enzyme secretion was also found at 50oC. The findings indicated that haloalkaline
attributes of the enzyme were maintained when produced in E.coli.
Enzyme
Preparations
Activity
(U/ml)
Total
activity
(U)
Protein
(mg/ml)
Total
protein
(mg)
Specific
Activity
(U/mg)
Purification
fold
Yield
(%)
Recombinant
fraction
80 640 0.212 0.696 535.11 - 100
Purified
enzyme
293 586 0.096 0.192 3052.00 5.7 91.5
Enzyme
Preparations
Activity
(U/ml)
Total
activity
(U)
Protein
(mg/ml)
Total
protein
(mg)
Specific
Activity
(U/mg)
Purification
fold
Yield
(%)
Recombinant
fraction
121 726 0.241 1.446 502.07 - 100
Purified
enzyme
320 640 0.104 0.208 3076.92 6.12 88.15
O.M.E12
O.M.A18

165
5.3.11 (Upper panel) Effect of pH (7, 8, 9, 10) on recombinant alkaline proteases.
(Lower panel) Effect of temperature (37oC, and 50
oC) on recombinant alkaline
protease
Effect of NaCl on enzyme stability
Effect of NaCl on temperature profile was explored by incubating the reaction
mixtures supplemented with various concentrations of NaCl (0-3M). The recombinant
enzyme maintained its 100% activity with up to 1M NaCl; however with increasing
NaCl, the activity sharply declined (Fig. 5.3.12). In the moderate haloalkalophilic
organisms, the enzyme activity increases with increasing NaCl up to a threshold level
(Dodia et al., 2008a and b; Joshi et al., 2008). As compared to the purified native
O.M.A18 protease, the recombinant enzyme was relatively more sensitive towards
NaCl. O.M.E12 enzyme was able to maintain its total activity upto 1M NaCl,
however, with further supplement of salt, enzyme activity was reduced with total loss
of activity at 24 hours (Fig.5.3.12). It is well studied fact that in moderate
haloalklaiphiilc organism, with increase in NaCl concentration upto threshold there is
increase in activity (Dodia et al., 2008b, Joshi et al., 2008, Purohit and Singh, 2011).
As compared to purified haloalkaliphilic O.M.E12 enzyme, the recombinant enzyme
was found to be very sensitive in the presence of NaCl.
0
50
100
150
200
250
37 50
7 8 9 10
0
50
100
150
200
250
7 8 9 10
37 50
z
% R
esid
ual
act
ivit
y

166
Fig.5.3.12: Stability of NaCl on recombinant enzyme O.M.A18 (Upper panel) and
O.M.E12 (Lower panel) Stability of NaCl; where (1M-■-), (2M-●-), (3M-♦-) was
checked on recombinant alkaline proteases after different hours of incubations
Thermostability of Enzyme
The thermal stability of the O.M.A18 recombinant alkaline protease was assessed for
36 hours at, 37, 50 and 60oC, and pH 8. The recombinant enzyme maintained its
stability at 37 and 50oC for 3 hours, with a complete loss of activity at 60
oC after 3
hour for O.M.A18 while for O.M.E12 enzyme maintained 50% of its stability at 37, 50
temperatures up to 3 hours (Fig. 5.3.13). However, on extending the time of
incubation to 24hour, both the enzymes preparations were completely denatured at
lower temperatures (Fig. 5.3.13).
% R
esid
ual
act
ivit
y
0
20
40
60
80
100
120
0 1 2 3 24
Time(h)
1M 2M 3M
0
20
40
60
80
100
120
0 1 2 48 72

167
Fig.5.3.13. Thermostability profile of recombinant enzyme O.M.A18
(Upper panel) and O.M.E12 (Lower panel): Thermostability of enzyme was
characterized after different hours (1, 2, 3, and 24) of incubation at (37oC▬); (50
oC -
■-), (60oC -▲-).
On the whole, it is quite logical that the stability of the alkaline protease in its native
form at elevated temperature could be attributed due to the inherent haloalkaliphilic
cellular components, metabolites and other complex machinery.
Effect of chemical denaturant urea
Recombinant O.M.A18 protease was treated with urea at 50, 60 and 70oC. Enzyme
retained marginal activity at 60 and 70oC. At 50
oC, 75% of the residual activity was
retained after 30 mins, which was further reduced to 50% after an hour of incubation.
A complete loss of activity was observed after 3 hours (Fig.5.3.14). When compared
with the urea sensitivity of native enzyme, the recombinant enzyme was more
sensitive (Purohit and Singh, 2011).
% R
esid
ual
act
ivit
y
0
20
40
60
80
100
120
140
0
20
40
60
80
100
120
1 2 3 24 36Time(h)
37 50 60

168
Fig.5.3.14. Urea Denaturation profile: Effect of urea after different time intervals at
50oC (♦), 60
oC (■) and 70
oC (▲).
With increase in temperature to 60oC for O.M.E12, only half of its activity was
maintained, with further increase in activity only marginal activity was observed.
Enzyme was found to be highly sensitive to chemical denaturant urea, as after an hour
of incubation, only 10-20% of activity was observed at all the temperature range and
total loss of activity was observed after 3 hours (Fig.5.3.14). On comparison of the
results with its native counterparts, we can observe that native counterparts were more
resistant to harsh conditions (Purohit and Singh, 2011).
5.3.6 Hydropathy determination
The hydropathy profile of the nucleotide sequence of O.M.A18 and O.M.E12 protease,
plotted according to the method of Kyte and Doolittle (Kyte and Doolittle, 2007) by
using pscale tool available at Expasy. The results showed increased presence of
0
20
40
60
80
100
120
0 30 60 180
Time(mins)
50 60 70
0
20
40
60
80
100
120
% R
esid
ual
act
ivit
y

169
hydrophobic residues in both the sequence analysis (Fig. 5.3.15). For general
information, the results showed increased presence of hydrophobic residues, the peak
above +1 indicate residues are more hydrophobic in nature while its value below 0
indicates its hydrophilicity, the net charge of amino acids is observed to be +1,
indicating structure to be hydrophobic in nature (Fig. 5.3.15). There are several
reports where we found that the distribution of hydrophobic amino acids is one of the
mechanisms of halophilic organisms to thrive in extreme salt concentrations (Oren,
2008; Nada, 2010).
Figure 5.3.15: Hydropathy analysis for O.M.A18 (Left panel) and O.M.E12
(Right panel) protease according to Kyte and Doolittle.
On the plot, a positive peak indicates a probability that the corresponding polypeptide
fragment is hydrophobic (a negative peak indicates a probable hydrophilic segment).
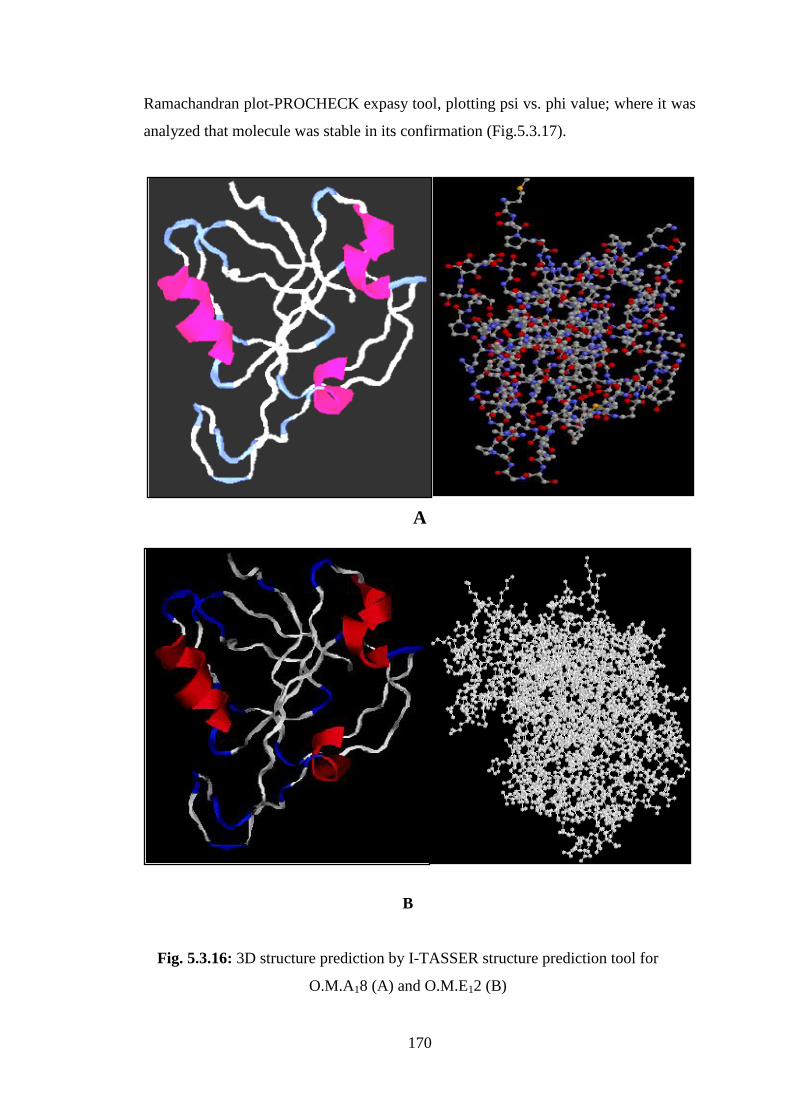
5.3.7 3D structure prediction
In order to correlate our work on this enzyme, in its native (Purohit and Singh, 2011)
and recombinant forms, three-dimensional structures of O.M.A18 protease were
modeled using the online I-TASSER 3D structure prediction (Fig.5.3.16). We
evaluated that the distribution of alpha helix and beta sheets were repeated after
approximately every 20 amino acids in O.M.A18. While there was no such uniform
confirmation observed in O.M.E12. We further predicted that enzyme contained serine
amino acids at its active site by I-TASSER tool, which was supported by our findings
on the inhibitor studies, where polymethyl sulfonyl chloride (PMSF) strongly
inhibited the enzyme activity. The stability of in-silico structure was predicted by
170
Ramachandran plot-PROCHECK expasy tool, plotting psi vs. phi value; where it was
analyzed that molecule was stable in its confirmation (Fig.5.3.17).
A
B
Fig. 5.3.16: 3D structure prediction by I-TASSER structure prediction tool for
O.M.A18 (A) and O.M.E12 (B)

171
Fig. 5.3.17: Ramachandran analysis of predicted 3D structure by PROCHECK for
O.M.A18 (Left panel) and O.M.E12 (Right Panel)
We were not able to analyze any special distribution pattern of helix and sheets in its
secondary structure confirmation. We further predicted that enzyme contained serine
amino acids at its active site by I-TASSER tool, which was supported by our findings
on the inhibitor studies, where polymethyl sulfonyl chloride (PMSF) strongly
inhibited the enzyme activity.

172
In brief, recombinant enzyme maintained features and attributes of native protein
O.M.A18 and O.M.E12. The characteristics of the native haloalkaliphilic serine
alkaline protease were by and large maintained by recombinant clones O.M.A18 and
O.M.E12; with respect to urea denaturation, thermal and salt stability.
Overall, the results in this chapter are highlighted on the cloning, over expression and
inexpensive method of purifying the over-expressed protein. The results hold novelty
in that the over expressed recombinant protein was obtained in active form. The fact
that only limited enzymes from halophiles and haloalkaliphiles have been cloned and
studied for heterologous expression further adds to the study. The results and trends
highlighted in this chapter are therefore of value addition to the recombinant
enzymology and significant from biotechnological stand point.