Embed Size (px)
Citation preview

Chapter 5Special Studies
Pictures on this and previous double page: Breeds (Pictures by: Ndambi Asaah, Katja Seifert and Torsten Hemme)
5.1 Summary 120
5.2 Impact analysis of dairy development programmes in Andhra Pradesh, India 122
5.3 Impact analysis of dairy development programmes in Uganda 124
5.4 Farm development strategies for dairy farms in Haryana (India) 126
5.5 Policy impact analysis for dairy farms in Thailand and Viet Nam 128
5.6 Comparison of dairy chains in Karnal, India 130
5.7 Cost of ‘quality milk’ in Karnataka, India: a case study 132
5.8 The competitiveness of skim milk powder from Uganda 134
5.9 The dairy feed chain in Peru: a case study 136
5.10 A comparison of dairy farming systems in India 138
5.11 A comparison of rural & peri-urban milk production systems in South Asia 140
5.12 Comparison of small- and large-scale dairy farming systems in India & US 142
5.13 Comparing household, whole farm and dairy enterprise levels in India 144
5.14 Methodological approach for guiding dairy development activities 146
5.15 Comparison of IFCN and Extrapolate approaches to impact analysis 148
5.16 Assessing the risks faced by dairy farms 150
5.17 Incorporating risk in dairy development strategy formulation 152
5.18 Carbon footprints of dairy farming systems 154
120 © IFCN 2008
5.1 Summary
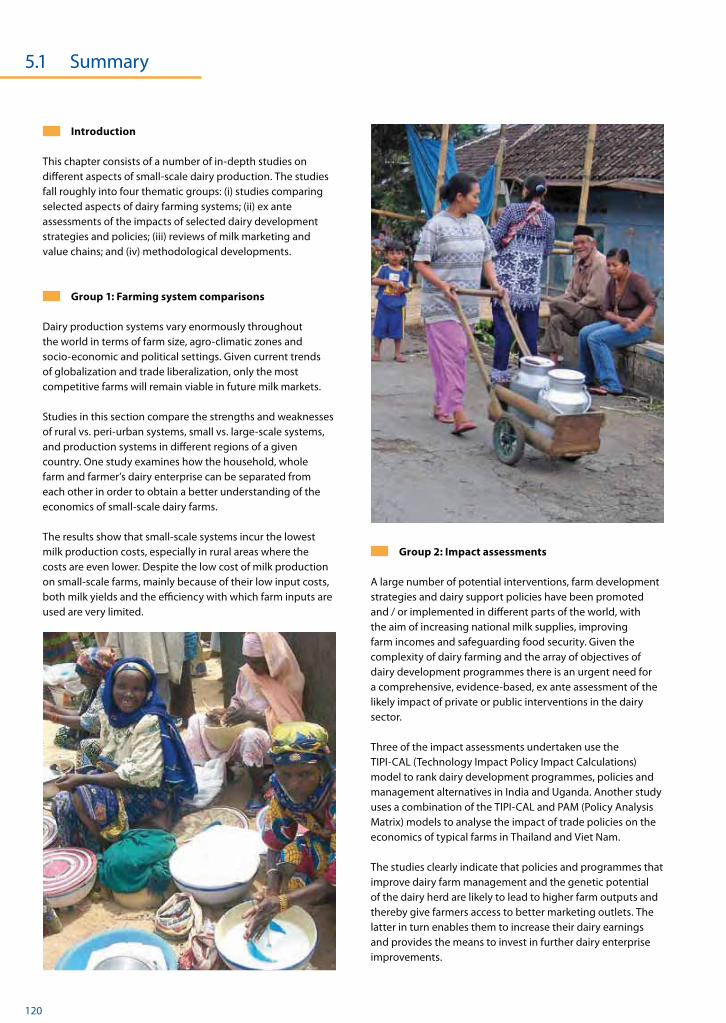
Introduction
This chapter consists of a number of in-depth studies on different aspects of small-scale dairy production. The studies fall roughly into four thematic groups: (i) studies comparing selected aspects of dairy farming systems; (ii) ex ante assessments of the impacts of selected dairy development strategies and policies; (iii) reviews of milk marketing and value chains; and (iv) methodological developments.
Group 1: Farming system comparisons
Dairy production systems vary enormously throughout the world in terms of farm size, agro-climatic zones and socio-economic and political settings. Given current trends of globalization and trade liberalization, only the most competitive farms will remain viable in future milk markets.
Studies in this section compare the strengths and weaknesses of rural vs. peri-urban systems, small vs. large-scale systems, and production systems in different regions of a given country. One study examines how the household, whole farm and farmer’s dairy enterprise can be separated from each other in order to obtain a better understanding of the economics of small-scale dairy farms.
The results show that small-scale systems incur the lowest milk production costs, especially in rural areas where the costs are even lower. Despite the low cost of milk production on small-scale farms, mainly because of their low input costs, both milk yields and the efficiency with which farm inputs are used are very limited.
Group 2: Impact assessments
A large number of potential interventions, farm development strategies and dairy support policies have been promoted and / or implemented in different parts of the world, with the aim of increasing national milk supplies, improving farm incomes and safeguarding food security. Given the complexity of dairy farming and the array of objectives of dairy development programmes there is an urgent need for a comprehensive, evidence-based, ex ante assessment of the likely impact of private or public interventions in the dairy sector.
Three of the impact assessments undertaken use the TIPI-CAL (Technology Impact Policy Impact Calculations) model to rank dairy development programmes, policies and management alternatives in India and Uganda. Another study uses a combination of the TIPI-CAL and PAM (Policy Analysis Matrix) models to analyse the impact of trade policies on the economics of typical farms in Thailand and Viet Nam.
The studies clearly indicate that policies and programmes that improve dairy farm management and the genetic potential of the dairy herd are likely to lead to higher farm outputs and thereby give farmers access to better marketing outlets. The latter in turn enables them to increase their dairy earnings and provides the means to invest in further dairy enterprise improvements.

© IFCN 2008 121
Group 3: Milk marketing and the value chain
Studies in this section analyse the economics of alternative marketing channels for a major farm input (feed) and major outputs (milk and cream), and show how milk quality determines the market for dairy products. One study describes a local community approach to addressing the problem of poor-quality milk produced by small-scale farmers.
The analysis of a pilot scheme in India to improve milk quality shows that it is possible to do so through adopting a community approach at very low additional costs. Improving milk quality helps capture new markets and increases household income, which is also affected by the dairy chain for both farm inputs and outputs. An inefficient input system will result in limited input use; sub-optimal milk yields; and limited income generation from dairying. Finally, if farmers are given the chance to select their milk marketing channels, they can increase their earnings from dairying and are likely to strive to improve on the quality of their milk through private and/or communal initiatives provided they help them to access ‘external‘, higher-value markets. However, if the costs involved are too high, farmers will instead focus on local markets on which their products are still acceptable.
Group 4: New methods in dairy analysis
Dairying is a complex activity, the analysis of which calls for well-adapted methodologies. Small-scale dairying is particularly complex owing to its interaction with household activities and, worse still, because smallholder dairy farmers rarely keep records of their activities.
Studies in this section expand on the different methods developed by the IFCN for analysing and ranking programme and policy impacts, defining a sequential ‘dairy development ladder’, integrating risk assessment into farm economics and policy analysis, and evaluating the carbon footprint of dairy farms (a parameter that has given rise to concern in recent years).
The methods that have been applied represent pragmatic approaches to analysing the complexity of dairy farms, which can produce robust results without relying on data from large surveys which are usually very expensive. Thus, they are also suitable for small-scale dairy farms that do not keep records. However, these studies show that there is still a great need for the further development of the currently available analytical tools to better understand the complexity of small-scale farming systems.
5.1 Summary
122 © IFCN 2008
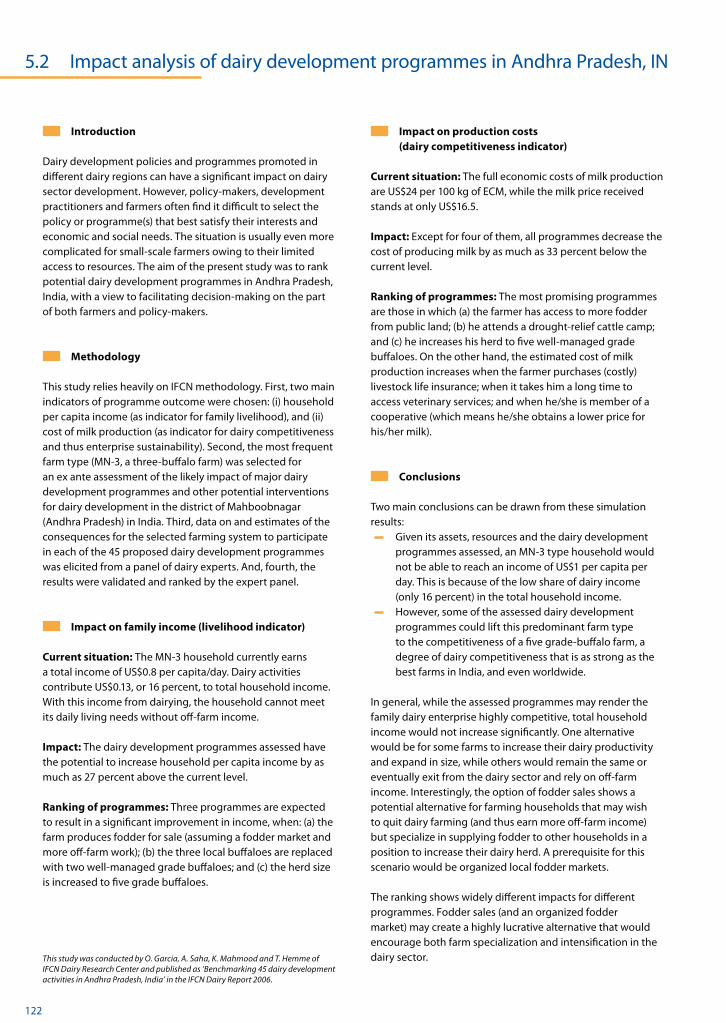
5.2 Impact analysis of dairy development programmes in Andhra Pradesh, IN
Introduction
Dairy development policies and programmes promoted in different dairy regions can have a significant impact on dairy sector development. However, policy-makers, development practitioners and farmers often find it difficult to select the policy or programme(s) that best satisfy their interests and economic and social needs. The situation is usually even more complicated for small-scale farmers owing to their limited access to resources. The aim of the present study was to rank potential dairy development programmes in Andhra Pradesh, India, with a view to facilitating decision-making on the part of both farmers and policy-makers.
Methodology
This study relies heavily on IFCN methodology. First, two main indicators of programme outcome were chosen: (i) household per capita income (as indicator for family livelihood), and (ii) cost of milk production (as indicator for dairy competitiveness and thus enterprise sustainability). Second, the most frequent farm type (MN-3, a three-buffalo farm) was selected for an ex ante assessment of the likely impact of major dairy development programmes and other potential interventions for dairy development in the district of Mahboobnagar (Andhra Pradesh) in India. Third, data on and estimates of the consequences for the selected farming system to participate in each of the 45 proposed dairy development programmes was elicited from a panel of dairy experts. And, fourth, the results were validated and ranked by the expert panel.
Impact on family income (livelihood indicator)
Current situation: The MN-3 household currently earns a total income of US$0.8 per capita/day. Dairy activities contribute US$0.13, or 16 percent, to total household income. With this income from dairying, the household cannot meet its daily living needs without off-farm income.
Impact: The dairy development programmes assessed have the potential to increase household per capita income by as much as 27 percent above the current level.
Ranking of programmes: Three programmes are expected to result in a significant improvement in income, when: (a) the farm produces fodder for sale (assuming a fodder market and more off-farm work); (b) the three local buffaloes are replaced with two well-managed grade buffaloes; and (c) the herd size is increased to five grade buffaloes.
Impact on production costs
(dairy competitiveness indicator)
Current situation: The full economic costs of milk production are US$24 per 100 kg of ECM, while the milk price received stands at only US$16.5.
Impact: Except for four of them, all programmes decrease the cost of producing milk by as much as 33 percent below the current level.
Ranking of programmes: The most promising programmes are those in which (a) the farmer has access to more fodder from public land; (b) he attends a drought-relief cattle camp; and (c) he increases his herd to five well-managed grade buffaloes. On the other hand, the estimated cost of milk production increases when the farmer purchases (costly) livestock life insurance; when it takes him a long time to access veterinary services; and when he/she is member of a cooperative (which means he/she obtains a lower price for his/her milk).
Conclusions
Two main conclusions can be drawn from these simulation results:
Given its assets, resources and the dairy development programmes assessed, an MN-3 type household would not be able to reach an income of US$1 per capita per day. This is because of the low share of dairy income (only 16 percent) in the total household income.
However, some of the assessed dairy development programmes could lift this predominant farm type to the competitiveness of a five grade-buffalo farm, a degree of dairy competitiveness that is as strong as the best farms in India, and even worldwide.
In general, while the assessed programmes may render the family dairy enterprise highly competitive, total household income would not increase significantly. One alternative would be for some farms to increase their dairy productivity and expand in size, while others would remain the same or eventually exit from the dairy sector and rely on off-farm income. Interestingly, the option of fodder sales shows a potential alternative for farming households that may wish to quit dairy farming (and thus earn more off-farm income) but specialize in supplying fodder to other households in a position to increase their dairy herd. A prerequisite for this scenario would be organized local fodder markets.
The ranking shows widely different impacts for different programmes. Fodder sales (and an organized fodder market) may create a highly lucrative alternative that would encourage both farm specialization and intensification in the dairy sector.This study was conducted by O. Garcia, A. Saha, K. Mahmood and T. Hemme of
IFCN Dairy Research Center and published as ‘Benchmarking 45 dairy development activities in Andhra Pradesh, India’ in the IFCN Dairy Report 2006.

© IFCN 2008 123
0.0
0.2
0.4
0.6
0.8
1.0
1.2 Baseline level Daily income per capita 1 US-$ / capita / day
Feeding Programs Marketing Husbandry Genetics & Upscaling Health
INS-
WSH
GIN
S-C
oo
pIN
S-So
loH
ealt
h-I
NS
Vet-
2-Fa
rmVe
t-C
linic
Vacc
ines
5-G
rad
3-G
rad
3-G
rad
+Lo
an2-
Gra
d2-
Gra
d+
Loan
1-G
rad
1-G
rad
+Lo
anH
erd
-Red
uct
Yiel
d+
DIM
DIM
Yiel
dB
uild
ing
Stal
l Fee
din
gPr
enat
alC
alfR
eari
ng
Wat
erin
g
Co
op
-12
WSH
GLa
bo
urS
ales
Fod
der
Sale
sC
oo
pU
nio
nFa
tom
atic
C-C
oo
ling
C-p
lan
tQ
trC
oo
pC
-mem
br
Co
mp
letF
eed
Cat
tleF
eed
Fallo
wLa
nd
Vco
mm
on
sFb
ank
GF-
Cu
tter
G-F
od
der
AllS
traw
Gro
un
dn
ut
Ure
aStr
awC
-Cam
pM
N-3
US$
/ 10
0 kg
milk
(ECM
)
Household per capita income
US$
/ ca
pita
/ da
y
Costs of milk production (only)
0
5
10
15
20
25
30 Milk price Opportunity costs (excl. quota) Costs from P&L account - non-milk returns Baseline level
Feeding Programs Marketing Husbandry Genetics & Upscaling Health
INS-
WSH
GIN
S-C
oo
pIN
S-So
loH
ealt
h-I
NS
Vet-
2-Fa
rmVe
t-C
linic
Vacc
ines
5-G
rad
3-G
rad
3-G
rad
+Lo
an2-
Gra
d2-
Gra
d+
Loan
1-G
rad
1-G
rad
+Lo
anH
erd
-Red
uct
Yiel
d+
DIM
DIM
Yiel
dB
uild
ing
Stal
l Fee
din
gPr
enat
alC
alfR
eari
ng
Wat
erin
g
Co
op
-12
WSH
GLa
bo
urS
ales
Fod
der
Sale
sC
oo
pU
nio
nFa
tom
atic
C-C
oo
ling
C-p
lan
tQ
trC
oo
pC
-mem
br
Co
mp
letF
eed
Cat
tleF
eed
Fallo
wLa
nd
Vco
mm
on
sFb
ank
GF-
Cu
tter
G-F
od
der
AllS
traw
Gro
un
dn
ut
Ure
aStr
awC
-Cam
pM
N-3
Feeding programmes
1-MN-3: Baseline farm (3 local buffaloes)
2-C-Camp: Cattle camp (free straw during drought)
3-UreaStraw: Urea applied to own farm paddy straw
4-Groundnut: More and quality protein is fed
5-AllStraw: All homegrown paddy straw is utilized
6-G-fodder: Green fodder is cultivated on own land
7-GF-Cutter: A manual green fodder cutter is used
8-Fbank: Fodder bank is set up on public land
9-Vcommons: Village common grazing land
10-FallowLand: Unused land doubles fodder yield
11-CattleFeed: Homemixed feed is replaced
12-CompleteFeed: Substitutes homemixed ration
Marketing programmes
13-C-membr: Farmer is a dairy cooperative member
14-QtrCoop: Only 25 % of milk output sold to the coop.
15-C-plant: Coop. adds value to milk locally
16-C-Cooling: More coop. cooling units in rural areas
17-Fatomatic: Accurate milkfat testing in the field
18-CoopUnion: Coop. makes own business decisions
20-FodderSales: Farmer grows fodder for sale
21-LabourSales: Family increases off-farm employment
22-WSHG: Family associates to open a mini-dairy
23-Coop-12: The coop. pays 12 INR/ kg buffalo milk
Animal husbandry programmes
24-Watering: Sufficient water for grazing buffaloes
25-CalfRearing: Subsidized calf concentrated feed
26-Prenatal: Care in late trimester of pregnancy
27-StallFeeding: All animals are confined
28-Building: Minimization of heat stress
29-Yield: Increased to the state milk yield average
30-DIM: Only days in milk per year are increased
31-Yield+DIM: Both yield and DIM are increased
Breeding programmes
32-Herd-Reduct: Has instead 2 grade buffaloes
33-1-Grad+Loan: Loan to buy 1 grade adult buffalo
34-1-Grad: 1 grade animal raised from within farm
35-2-Grad+Loan: Loan to buy 2nd graded
36-2-Grad: 2nd grade animal from within farm
37-3-Grad+Loan: Loan to buy 3rd graded
38-3-Grad: 3rd grade animal from within farm
39-5-Grad: Now 2 animals are added to 3 grade
Health programmes
40-Vaccines: Certain vaccines are subsidized
41-Vet-Clinic: Farmer visits the next vet clinic (6x / yr)
42-Vet-2-Farm: Doorstep veterinary services
43-Health-INS: Pays 200 INR / adult head/ year
44-INS-Solo: Alone buys animal life insurance
45-INS-Coop: Coop. offers animal life insurance
46-INS-WSHG: Group animal life insurance
Explanation of programmes abbreviations
5.2 Impact analysis of dairy development programmes in Andhra Pradesh, IN

124 © IFCN 2008
5.3 Impact analysis of dairy development programmes in Uganda
Impact on cost of milk production
The policies have little impact on the present cost of milk production with local cows. Exceptionally, when the farmer spends more hours fetching water, opportunity costs increase by up to 20 percent owing to increased family labour for which there are very limited opportunities for alternative economic uses. With cross-bred dairy animals, the total cost is 40 percent higher than with local cows, and cash costs stand at US$6 per 100 kg of ECM instead of practically nil.
Impact on return to labour
The policies analysed could lead to an increase or decrease return to dairy labour of between +40 percent and -20 percent on the farm with local cows. None of the analysed policies brings the return to labour from working on the dairy farm to what the farmer would earn from working off-farm. This means that, whenever there is an off-farm job alternative, producing milk for sales under the same conditions will not be attractive. With cross-bred cows, however, dairy farming becomes a highly attractive alternative for the use of family labour since the return to labour would now be expected to be 40 percent above local wages.
Conclusions
The policies analysed seem to only have a minor impact on the household income and dairy competitiveness of farms with local breeds. However, the impact is more evident when policies are combined with genetic improvements that boost milk yields because this change requires more inputs. An adequate dairy development plan will therefore require improvements in the genetics of the dairy cows, which will in turn strengthen the impact of other policies on small-scale dairying.
Introduction
Policy-makers and private investors wishing to increase the efficiency of the dairy sector call for ex ante assessments of the impact of intended interventions. The aim of the present study was to analyse the potential outcome of various development strategies on the most widespread typical dairy farming system in Uganda and contribute to building up a knowledge bank to help policy-makers to prioritize development strategies for the Ugandan dairy sector. Compared with the previous study, the present one goes a step further by first assessing the impact of the same policies and strategies on the typical farm with local cows and then on a farm with genetically improved dairy cows.
Methodology
A policy impact analysis was made for the most predominant dairy farming system: extensive smallholder dairy farming with a herd of three local cows. The calculations were based on the simulation model, TIPI-CAL (Technology Impact and Policy Impact Calculation Model), version 4.0, which was further developed for application to small-scale dairy farms. Scenarios and input parameters for the model were developed in consultation with a panel of local dairy experts, followed by validation on typical farms through farm visits and interviews with producers.
The first 13 scenarios apply to policies on the farm as it is now (with local cows), while the last 11 assess the impact of the same policies but assume that the farmer has three pure exotic or cross-bred cows rather than local cows.
Impact on household income
Upgrading from local to cross-bred animals had a marked effect on household income, leading to an increase by 63 percent. Depending on changes in the milk price, the policies analysed either increased or decreased the daily per capita household income. Low impacts were generally observed because the farm had little access to input and output markets. However, if both genetics and management were to be improved, the policy impact would be as much as threefold.
Programme and scenario descriptionsKY-3 (baseline): The household head is an agricultural labourer who owns about 2 ha of land and has access to another 20 ha for grazing. Milk is sold to a local trader from the farm once daily. Graded: Farmer uses exotic cows that are stall-fed with elephant grass and concentrates. Sch-milk: Farmers join together to provide milk for the local school milk programme. >Demand: Demand for milk increases; farmgate milk price increases. >Q+price: Quality control against adulteration of milk results in higher farm milk prices. >Q-price: Quality control against milk adulteration results in lower farm milk prices because the traders (who are no longer able to adulterate the milk) wish to maintain their profit margins. Cooler-coop: Farmer delivers to his cooperative and obtains additional yearly benefits from dividends. Cooler-private: Farmer delivers to a private collection centre at 12.5 percent higher price. Private-vet: Several entities support private veterinary services in the area. >Vet-med: This type of farmer rarely has access to veterinary services. Vet-med disc: A 30 percent discount is offered for purchases of all veterinary products. >Credit: More access is provided to credit facilities at national interest rates. FeedP-30%: Major feed suppliers have agreed to 30 percent discount on bulk purchases of feed. >Water: Additional water is supplied to the cows in the evenings.
This study was conducted by A. Ndambi, O. Garcia and T. Hemme of the IFCN Dairy Research Center and by D. Balikowa of the Ugandan Dairy Development Authority in Kampala. It was published as ‘IFCN policy impact analysis for dairy farms in Uganda’ in the IFCN Dairy Report 2007.

© IFCN 2008 125
0
5
10
15
20
25 Opportunity costs Costs from P&L account - non-milk returns Milk price
Internationally Competitive Milk Price
Local cow Grade cow
>W
ater
Feed
P-30
%
>C
red
it
Vet-
Med
Dis
c
Co
ole
r-Pr
ivat
Co
ole
r-C
oo
p
>Q
-Pri
ce
>Q
+Pr
ice
>D
eman
d
Sch
-Milk
Gra
ded
>W
ater
Feed
P-30
%
>C
red
it
Vet-
Med
Dis
c
>Ve
t-M
ed
Priv
at-v
et
Co
ole
r-Pr
ivat
Co
ole
r Co
op
>Q
-Pri
ce
>Q
+Pr
ice
>D
eman
d
Sch
-Milk
KY
-3
0.00
0.05
0.10
0.15
0.20
0.25 Wage paid to hired labour Return to dairy labour Local wage level
>W
ater
Feed
P-30
%
>C
red
it
Vet-
Med
Dis
c
Co
ole
r-Pr
ivat
Co
ole
r-C
oo
p
>Q
-Pri
ce
>Q
+Pr
ice
>D
eman
d
Sch
-Milk
Gra
ded
>W
ater
Feed
P-30
%
>C
red
it
Vet-
Med
Dis
c
>Ve
t-M
ed
Priv
at-v
et
Co
ole
r-Pr
ivat
Co
ole
r Co
op
>Q
-Pri
ce
>Q
+Pr
ice
>D
eman
d
Sch
-Milk
KY
-3
Local cow Grade cow
0.0
0.1
0.2
0.3
0.4
0.5
0.6
0.7
0.8
0.9
1.0 Baseline level Household income
Market Scenarios
Market Scenarios
Input Scenarios
Input Scenarios
Local cow Grade cow
>W
ater
Feed
P-30
%
>C
red
it
Vet-
Med
Dis
c
Co
ole
r-Pr
ivat
Co
ole
r-C
oo
p
>Q
-Pri
ce
>Q
+Pr
ice
>D
eman
d
Sch
-Milk
Gra
ded
>W
ater
Feed
P-30
%
>C
red
it
Vet-
Med
Dis
c
>Ve
t-M
ed
Priv
at-v
et
Co
ole
r-Pr
ivat
Co
ole
r Co
op
>Q
-Pri
ce
>Q
+Pr
ice
>D
eman
d
Sch
-Milk
KY
-3
Household income
Cost of milk production
Return to labour
US$
/ cap
ita /
day
US$
/ ho
urU
S$ /
100
kg E
CM5.3 Impact analysis of dairy development programmes in Uganda

126 © IFCN 2008
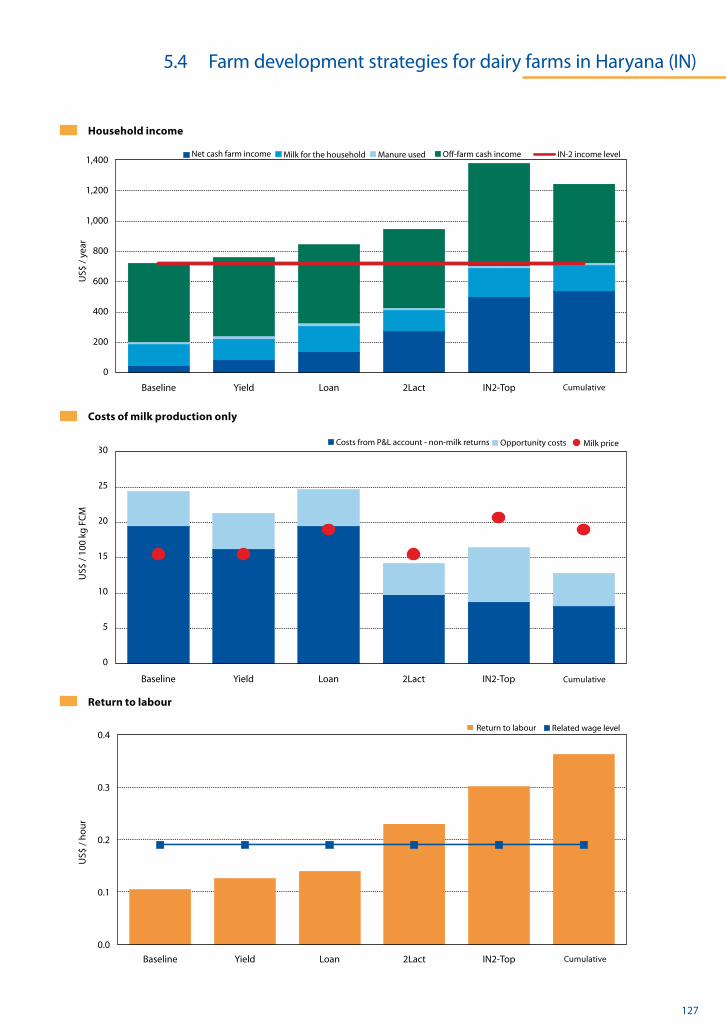
5.4 Farm development strategies for dairy farms in Haryana (IN)
Introduction
Previous studies in this section have assessed the impact of ‘genetic upgrading’ with a view to increasing the household income of family dairy farms. However, owing to social and economic restrictions, it is often difficult for smallholder farmers to ‘upgrade’ their dairy herd. Another way of increasing farm household income is to improve farm management. The aim of the present study was to analyse the impact of alternative management scenarios on small-scale dairy farms in India, currently the world’s largest dairy producer.
Methodology
The effects of four different dairy farm development strategies / scenarios on the outcome variables ‘household income’, ‘cost of milk production’ and ‘return to labour’ were analysed against the baseline of a typical two-cow farm (IN-2) in Haryana (India). The four assessed strategies / scenarios were as follows: (i) ‘Yield’ – the farm obtains a 20 percent increase in milk yield per buffalo without additional inputs as a result of better management, (ii) ‘Loan’ – the farm has more equity and does not need to take a loan from the milkman, which results in a better milk price and reduces interest payments to zero; (iii) ‘2Lact’ – the farmer manages to obtain one calf per buffalo per year instead of one every second year and thereby has two buffaloes in lactation, which doubles milk production; and (iv) ‘IN2-Top’ – to estimate the potential of a two-cow operation in Haryana, a top managed two buffalo farm was included in the assessment.
Impact on household income
All scenarios result in increases in household income in the range of US$60-500 per annum. Household income is doubled in scenario ‘IN2-Top’. The key factor of the IN2-Top scenario is the higher milk price the farm obtains and its higher milk output (higher milk yield + two cows in lactation/year).
Impact on cost of milk production
The 2Lact and IN2-Top scenarios reduce milk production costs by approximately 40 percent, thus bringing them to US$15/100 kg which is comparable with those of the larger farms in Haryana (IN-4, IN-22) and with milk prices in Oceania. This means that the 2Lact and IN2-Top farms have are competitive vis-a-vis imports of dairy products. The 2Lact scenario doubles the farm’s milk production and almost triples the quantity of milk sold.
Impact on return to labour
To compete over the long term with other farms or off-farm activities, the wages the family earns through the dairy enterprise (return to labour) should be equal to, or higher than, the region’s wage level. So far, the IN-2 farm (baseline) obtains a ‘salary’ of US$0.1/hour, or 50 percent of the region’s wage level. The IN2-Top farm obtains a salary of US$0.3/hour, which makes dairy farming more profitable than working as a non-farm labourer in the region. This clearly shows the potential of dairy farming as a source of employment and for improving living standards in the region.
Conclusions
Compared with the baseline dairy enterprise, all of the assessed scenarios are deemed to improve the farming family’s household income, albeit to different extents. Smallholder dairy farmers in Haryana can thus improve their household income without public policy interventions. However, the potential increases are likely to be greater if combined with such interventions.
Explanation of variables, year and sources of dataFarm codes: Example IN-2 = Two-cow farm in India. Farm data refers to the year 2002, published in the IFCN Dairy Report 2003.Baseline: Reference scenario - typical IN-2 farm situation as observed. Cumulative: A combination of the various scenarios but without the IN2-Top scenario.Household income: Includes cash and non-cash income from farm and off-farm activities. Costs of milk production only, return to labour: For definitions, see Section 4.7.
This study was carried out by O. Garcia, A. Saha and T. Hemme, IFCN Dairy Research Center, and was published as the study ’Strategy analysis for a two-cow farm in India/Haryana’ in IFCN Dairy Report 2003.
© IFCN 2008 127
0
200
400
600
800
1,000
1,200
1,400
AccumulativeIN2-Top2LactLoanYieldBaseline
IN-2 income level Off-farm cash income Manure used Milk for the household Net cash farm income
Return to labour
Household income
Costs of milk production only
0.0
0.1
0.2
0.3
0.4
AccumulativeIN2-Top2LactLoanYieldBaseline
Related wage level Return to labour
0
5
10
15
20
25
30
AccumulativeIN2-Top2LactLoanYieldBaseline
Milk price Opportunity costs Costs from P&L account - non-milk returns
US$
/ ye
ar
US$
/ ho
urU
S$ /
100
kg F
CM
5.4 Farm development strategies for dairy farms in Haryana (IN)
Cumulative
Cumulative
Cumulative

128 © IFCN 2008
5.5 Policy impact analysis for dairy farms in Thailand and Viet Nam
Introduction
The consumption of milk and livestock products is expanding rapidly in East Asia. Governments have responded by resorting to a wide variety of policy instruments to support and protect domestic dairy production, which is dominated by small-scale systems. However, in an increasingly open economy, one key question is: how profitable and competitive are these farms with and without current policy interventions? The aim of the present study was to analyse the profitability of East Asian dairy farms with and without current policy interventions.
Methodology
To address the above question, the main policies and their impact on farm outputs/inputs were first identified (for summary, see graphs 1 and 3). Secondly, the policy impact was eliminated by decreasing/increasing prices by the estimated effect of the ‘support’/’tax’ on these farms. For example, for Thailand, it was estimated that the farm milk price (of US$29/100 kg) would be 27 percent lower without policy support. For fertilizer, farm prices would decrease by 17 percent if taxes were eliminated. Lastly, the Policy Analysis Matrix (PAM) developed by Monke & Pearson (1989) was used to quantify the policy impact on selected farm types.
Thailand: policies and dairy farm profitability
As the first graph shows, under the current policy regime, Thai farmers obtain higher returns on their farm outputs, pay lower prices for domestic inputs, and pay higher prices (taxes) on internationally tradable inputs than would otherwise be the case. The overall impact of the combination of the policies in place is that farmers make a profit from their dairy farms. However, once these policies are eliminated, both farm types make losses. The high costs incurred by farm TH-117 (under current policies) can be attributed to heavy use of taxable inputs (e.g. feeds, medicine, etc.).
Viet Nam: policies and dairy farm profitability
Vietnamese dairy farmers obtain higher returns on their farm outputs, pay lower prices for labour and capital, but pay taxes on internationally tradable inputs. Land is not privately owned but rented; and government seems to keep rent prices high.
The results of the analysis indicate that dairy farmers benefit from current policies and that the dairy enterprise generates profits. However, once the policy support is eliminated, only the larger farm (VN-4) remains profitable, mostly owing to its higher labour and capital (two highly subsidized inputs) productivity. Farm type VN-4 sells more cattle per 100 kg of milk produced than VN-2, which explains the difference in returns (once current policy interventions are removed).
Producer support estimates
The producer support estimates (PSEs) show the share of the farm profits attributable to policy interventions as part of the farm returns. For typical dairy farms in both countries, the PSE levels orbit around 20 percent.
Conclusions
This study shows that both countries combine policy instruments, albeit in different ways, that on the one hand support and on the other hand tax their dairy farmers. The PSE levels show that Viet Namese dairy farms benefit slightly more than those in Thailand from their national policy frameworks. However, from a policy standpoint, the Thai farmers are more encouraged to expand their dairy enterprises. The Thai policies do this by supporting a high milk price and by keeping prices for domestic resources (labour, land and capital) low. On the other hand, Viet Namese farmers have access to highly subsidized loans, which they take to raise beef animals as for them, any dairy expansion would require more reliance on machinery, land and feed, which are heavily-taxed inputs. A beef animal eats local feed (less taxed inputs) and sells for an attractive price. Finally, Viet Nam’s land market policies may have effects that have not been detected in this study.
The combination of applied policy instruments differs between countries, and determines farmer prices for various types of inputs and outputs, which in turn strongly influence the level of dairy farm intensification.
Methods and data challenges
Policy distortions have been quantified mainly using the applied tariffs for farm outputs (milk and beef) and inputs. If, instead of tariffs, world prices had been used, the results would have differed significantly.
Explanation of variablesFarm data: The farm data refers to the year 2003, published in the IFCN Dairy Report 2004. Monke, E. A. and S. R. Pearson, 1989. Costs and returns with current policies are based on the actual prices obtained by these farmers in calendar year 2003. Costs and returns without current policies are calculated by eliminating the effects of policies on the prices obtained by these farmers in calendar year 2003. Exchange rates: US$1 = 42 Thai Baht; and US$1 = 16,067 VN Dong. Producer support estimates (PSE) = [profits (with policies) - profits (with no policies)]/returns (with policies). Method comment: Moreover, estimating distortions in prices of production factors was a very complex exercise and was done on the basis of expert estimations.
This study was undertaken by O. Garcia of the IFCN Dairy Research Center and by J. Stoll of the Justus-Liebig-University in Giessen. It was published as ‘Policy analysis for typical dairy farms in Thailand and Viet Nam’ in the IFCN Dairy Report 2005.

© IFCN 2008 129
0 %
5 %
10 %
15 %
20 %
25 %
30 %
VN-4VN-2TH-117TH-14
Reference Line) PSE
Producer support estimates (PSE)
% o
f ret
urns
/ 10
0 kg
milk
(ECM
)
Viet Nam policy impacts on prices
0
5
10
15
20
25
30
35
40
VN-4VN-2
Costs Returns
No policies With policies No policies With policies
Vietnamese farm profitability levels
0
5
10
15
20
25
30
35
40
No policies With policies No policies With policies
TH-14 TH-117
Costs Returns
US$
/ 10
0 kg
milk
(ECM
)
Thai farm profitability levels
0 % 20 % 40 % 60 % 80 % 100 % 120 %
Electricity
Vet. medicine
Feedstuffs
Fuel
Fertilizer
Machinery
Capital
Land
Labour
Beef
Milk 27 %
50 %
50 %
50 %
17 %
17 %
7 %
Supporting the farms ** Taxing the farms***
12 %
12 %
37 %
Thailand policy impacts on prices
0 % 20 % 40 % 60 % 80 % 100 % 120 %
Electricity
Vet. medicine
Feedstuffs
Fuel
Fertilizer
Machinery
Capital
Land rent
Labour
Beef
Milk 20 %
20 %
50 %
50 %
100 %
20 %
5 %
10 %
18 %
10 %
11 %
Supporting the farms ** Taxing the farms***
US$
/ 10
0 kg
milk
(ECM
)
** Supporting farms in %: Technically is equal to price with no policy / price with policy minus 1. A Thai example: Without policy intervention (tariffs), the milk price received by Thai farmers would be 27 % lower. A Vietnamese example: Without policy intervention (subsidized loans), Vietnamese farmers would pay 100 % higher interest rates (doubling). *** Taxing farms in %: Without policy interventions (import taxes for fertilizers), the fertilizer price for the Thai farmers would be 12 % lower.
5.5 Policy impact analysis for dairy farms in Thailand and Viet Nam

130 © IFCN 2008
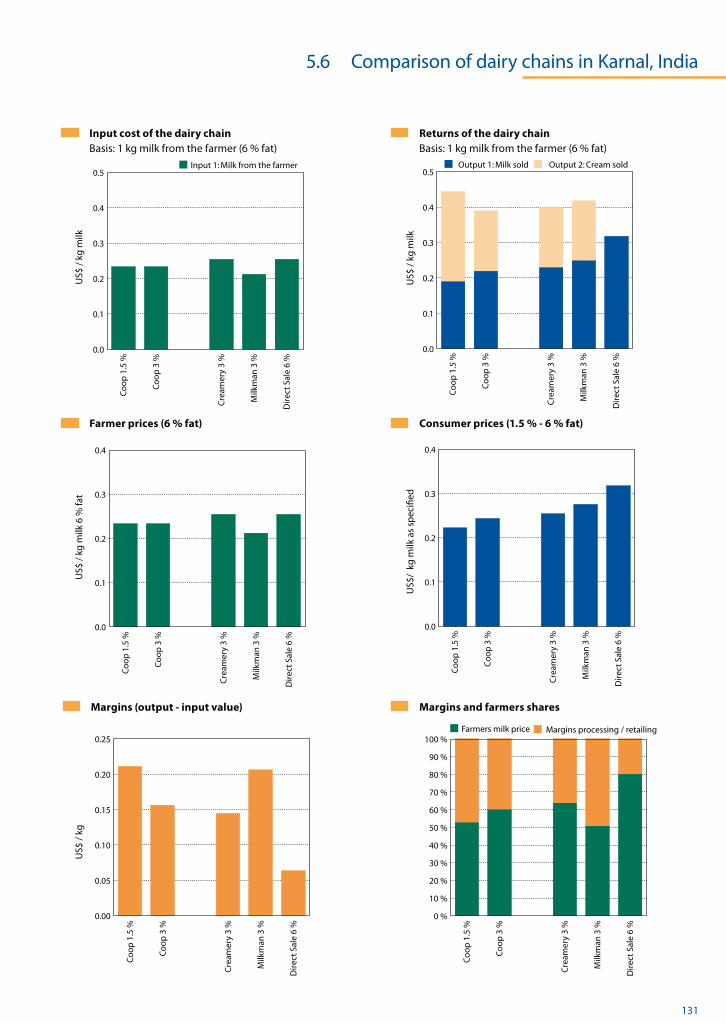
5.6 Comparison of dairy chains in Karnal, India
Introduction
The previous study shows that milk quality is a determinant for the selection of markets for milk products. Marketing of milk and milk products might also go through different channels, depending on the processors involved and the nature of the final product. The aim of the present study was to analyse the marketing costs involved in the various channels and the returns from processing milk and cream from 1 kg of milk (6 percent fat).
Methodology
In this study, the first step taken was to analyse the dairy chains / channels in India (Karnal). Each channel is then assumed to purchase 1 kg of raw milk (6 percent fat) from the farmer and process it into milk and fresh cream, if applicable. The returns from this 1 kg of milk (milk and cream), costs (farmer’s milk prices) and margins were then calculated.
Six marketing chains / channels were identified. The cooperative represents the formal sector, while the remaining channels represent the informal sector. The channels are defined as follows:
Coop 1.5 percent: Cooperative buying milk at 6 percent fat and selling at 1.5 percent fat.
Coop 3 percent: Cooperative buying milk at 6 percent fat and selling at 3 percent fat.
Creamery 3 percent: Private processor buying milk at 6 percent fat and selling at 3 percent fat.
Milkman 3 percent: Private person, collecting milk at 6 percent fat and selling at 3 percent fat.
Direct sale 6 percent: Dairy farms, such as IN-37, selling directly to the consumer with 6 percent fat.
Farmer milk prices
Milk prices paid by the cooperatives are slightly (9 percent) lower than those paid by the ’creameries’. The milkman pays the lowest milk price to farmers (but covers collection and transportation costs to the town and for home delivery).
Consumer milk prices
The formal sector receives slightly lower consumer prices than the informal sector. By having a more conveniently located point for delivering milk to the customers (often daily home delivery), the informal sector can demand a higher price for its milk. The higher price of ‘direct sale of farm-fresh milk with 6 percent fat’ and the lower price of ‘processed milk with 1.5 percent fat’ reflects the difference in the fat content of milk sold to the consumer and customers’ preference for milk with a high fat content.
The cream business
Most marketing channels extract cream from the milk bought from the farmer. This cream (30 percent fat) is either sold directly (by the informal sector) or further processed into butter or ghee. A processor’s calculation is as follows:
US$0.23/kg milk: Purchase of milk from the farmer (6 percent fat),
US$0.24/kg milk: Sale of milk to the consumer (3 percent fat),
US$0.17/kg milk: Sale of extracted cream to the consumer (0.1 kg * US$1.7/kg).
The price paid to the farmer for milk with 6 percent fat is similar to that which the consumer pays for 3 percent fat milk. Thus, the cream extracted and sold by the processor covers the processing cost and retail margin in the dairy chain.
Margins (consumer prices - input value
of raw materials)
The margins for milk processing and retailing vary from US$0.06 to US$0.21 per kilogram of milk. The cooperative’s 1.5 percent fat milk has the highest margins. Farms selling the milk directly have the lowest margins as they do not participate in the ‘cream business’. The margins of the cooperative and milkman, at US$0.21/kg of milk, are similar. The margins observed in Karnal are half those of dairy chains in Europe (US$0.5/kg).
Conclusions
The cost and returns from milk and cream vary both between products and between the different marketing channels selected for the purpose of this study. Prices do not vary much for the raw milk purchased from farmers, but once milk is processed its share in the consumer price varies by 50 to 80 percent.
Explanation of variables, year and sources of dataValue of raw material input: Farmgate price of whole milk. Margin: Represents transport, processing and retail costs.Source of data: Data collection and interviews, October 2002.
This study was undertaken by T. Hemme, O. Garcia and A. Saha of the IFCN Dairy Research Center, and published as “Method approach – Analysis of dairy chains in India/Karnal” in the IFCN Dairy Report 2003.
© IFCN 2008 131
Input cost of the dairy chain Basis: 1 kg milk from the farmer (6 % fat)
Margins (output - input value)
Consumer prices (1.5 % - 6 % fat) Farmer prices (6 % fat)
Returns of the dairy chain Basis: 1 kg milk from the farmer (6 % fat)
Margins and farmers shares
0.0
0.1
0.2
0.3
0.4
0.5Input 1: Milk from the farmer
Dir
ect
Sale
6 %
Milk
man
3 %
Cre
amer
y 3
%
Co
op
3 %
Co
op
1.5
%
0.0
0.1
0.2
0.3
0.4
0.5Output 2: Cream sold Output 1: Milk sold
Dir
ect
Sale
6 %
Milk
man
3 %
Cre
amer
y 3
%
Co
op
3 %
Co
op
1.5
%
0.0
0.1
0.2
0.3
0.4
Dir
ect
Sale
6 %
Milk
man
3 %
Cre
amer
y 3
%
Co
op
3 %
Co
op
1.5
%
0.0
0.1
0.2
0.3
0.4
Dir
ect
Sale
6 %
Milk
man
3 %
Cre
amer
y 3
%
Co
op
3 %
Co
op
1.5
%
0.00
0.05
0.10
0.15
0.20
0.25
Dir
ect
Sale
6 %
Milk
man
3 %
Cre
amer
y 3
%
Co
op
3 %
Co
op
1.5
%
0 %
10 %
20 %
30 %
40 %
50 %
60 %
70 %
80 %
90 %
100 % Margins processing / retailing Farmers milk price
Dir
ect
Sale
6 %
Milk
man
3 %
Cre
amer
y 3
%
Co
op
3 %
Co
op
1.5
%
US$
/ kg
milk
US$
/ kg
milk
US$
/ kg
milk
6 %
fat
US$
/ kg
milk
as
spec
ified
US$
/ kg
5.6 Comparison of dairy chains in Karnal, India

132 © IFCN 2008
5.7 Cost of ‘quality milk’ in Karnataka, India: a case study
Introduction
The quality of milk products largely depends on the quality of the milk from which they are derived. This has become ever more important recently, especially following inter alia the melamine scandal/crisis in China. Small-scale farmers face a considerable challenge in adhering to high milk-quality standards because their small scale of operations makes it difficult to devise economically feasible investments for ensuring milk quality. The aim of the present study was to assess a community-based approach to improving the quality of milk delivered by small-scale dairy farmers, and to quantify the additional costs involved.
Pilot case study
In collaboration with the Technology Information, Forecasting & Assessment Council, Department of Science and Technology, Government of India (TIFAC) and the district milk union, an innovative project in Karnataka in the Kolar region of India attempts to address milk-quality through community involvement in milking operations and doorstep delivery of veterinary and breeding services. The concept adopted was to consider the whole village as a single dairy herd.
The community milking centre (CMC) of the district milk cooperative producers’ society provides diverse services to its farmer members. Milking is undertaken at the CMC twice daily in a 4x1 milking parlour and farmers bring their animals for milking in accordance with a fixed schedule. An emergency diesel generator supplies sufficient power for the two milking operations per day. The milk goes directly to the bulk-milk cooling centre, thereby preventing any contamination or adulteration. The secretary of the CMC supervises the milking operations and passes on requests from farmers for emergency veterinary health services to a veterinarian serving some nine villages. The capital investment for setting up the cold chain is made by the district milk producers’ milk union (cooperatives) in the region.
To assess the financial viability of the investment into the milking parlour bulk milk cooling centre, the costs of installation, machinery and their equipment and their maintenance were calculated. The assessment was then divided into two parts:
Machine milking and cooling services
Taking advantage of the producers society’s building, fixed costs relate only to machinery (milking parlour, milking machine, motorcycle, generator, and a bulk-milk cooler for 2 000 litres) and equipment (milk testing machine, weighing scale, computer). Using depreciation rates of 15 percent and 10 percent for machinery and equipment respectively and setting maintenance costs at 5 percent, the cost of milking and cooling services comes to US$1.96 (89 INR) per 100 litres of milk. Fuel and electricity account for 70 percent of the variable costs while machinery and equipment account for for 26 percent and for 4 percent.
Animal health and breeding services
The dairy cooperative milk union provides animal health and breeding services at the farmers’ doorstep. The union has established a network of about 46 veterinarians to cover its 400 villages in the milk shed area. Services are provided through animal health and vaccination camps and, in response to telephone requests in the case of artificial insemination and emergencies. Charges to farmers are subsidized by as much as 35 percent. In 1993-94, the cost of providing these services amounted to US$0.46 (21.05 INR) per 100 litres of milk procured. The fixed expenses of veterinary facilities and buildings are not included in the calculation. The major share of costs relates to medicine (65 percent) followed by services (camps) (21 percent), salaries (10 percent) and equipment (3 percent).
Conclusions
The cost of producing quality milk in the case reviewed involved an expenditure of US$2.42 per 100 kg of milk procured by the milk collection centre. The improvement in the quality of milk is evident from the somatic cell bacterial counts as determined by standard laboratory procedures, which both were significantly below the average recorded in India. The milk quality obtains the highest score for low coliform count. As a side-effect, with the drudgery of milking being reduced farmers are inclined to keep higher-quality dairy animals.
In conclusion, it appears that smallholder dairy farmers can produce high quality milk and that a community-based approach can work well to improve the quality of milk delivered by small-scale dairy producers at a relatively low cost.
This study, undertaken by A. Saha of the IFCN Dairy Research Center, was published as ‘Cost for ‘quality milk’ in India: A case study’ in the IFCN Dairy Report 2005.

© IFCN 2008 133
Community milking centre Bulk milk cooling facilities
Milking costs Veterinary expenses Milk collection centre data
Milk collection per day per centre = 900 litres
Number of farm members per centre = 50
Milking investment cost per 100 kg milk = 5.57 US$
Kolar Milkshed data
Number of villages covered by veterinary services = 400
Number of veterinarians = 46 Villages with CMC = 30 Villages with BMC = 106
Milk quality status (Mean of 10 milk collection centres)
Cost economies of quality milk (US$ / 100 kg ECM)
Date 13.11.2004 16.11.2004
SPC (cfu/ml) 800,000 670,000
CC (cfu/ml) 37,500 29,000
MBRT (hrs) 4.62 4.79
Adulterants 0 0
SPC: Standard plate count. CC: Coliform count. MBRT: Methylene Blue Reduction Test. cfu: colony forming unit. 1 US$ = 45.34 Indian Rupees in 2004
Variable expenses (1.38 US$)
Equipment (0.07 US$)
Machinery (0.51 US$)
Equipment (0.02 US$)
Medicines (0.31 US$)
Labour (0.05 US$)
Veterinary services (0.46 US$)
Milking and cooling (1.96 US$)
Veterinary expenses (0.27 US$)
0.00
0.05
0.10
0.15
0.20
0.25
0.30
0.35
0.40
0.45
0.50
0.0
0.2
0.4
0.6
0.8
1.0
1.2
1.4
1.6
1.8
2.0
FarmerMilk union
0.0
0.5
1.0
1.5
2.0
2.5
Services (0.10 US$)
5.7 Cost of ‘quality milk’ in Karnataka, India: a case study

134 © IFCN 2008
5.8 The competitiveness of skim milk powder from Uganda
costs include the cost of the milking machine, cooling and other costs incurred by each of the two farm types to achieve CODEX milk quality standards are thus very significant.
When using the milk from KY-13 and KY-3 to attain the EU quality level for SMP, the costs in Kayunga would be three and four times the current EU cost of producing EU-compliant SMP. This is clearly an unrealistic business alternative for processors in Kayunga.
Competitiveness of Kayunga SMP, 1996-2007
Over the last decade, production costs of SMP in Kayunga have been lower than its price in Uganda and probably also throughout the COMESA (Common Market of Eastern and Southern Africa) region. For the world market, however, Kayunga SMP production costs would be higher than the world market price (20 percent higher in 2006). These cost increases would be mainly the result of investments required at the farm and collection centres for producing/maintaining milk to the CODEX standard. For the EU market, stringent milk-quality requirements would bring the cost of Kayunga SMP to about 2.5 times the EU market price in 2006. It is interesting to note that, in 2007, the world price for SMP surpassed the US$4 000 mark (about 1.5 times the Kayunga production costs in 2006). This study strongly underpins the widely expressed opinion of dairy experts in Uganda that, under past and current economic and trading conditions, Kayunga dairy products will not be competitive within the EU.
Conclusions
This study supports the following conclusions: (1) farm size has a strong impact on the final cost of SMP; (2) Kayunga SMP is competitive on the present Ugandan market and in neighbouring countries; (3) Kayunga SMP can be competitive in the world market with raw milk supplied by the larger typical farms; (4) Kayunga SMP has no foreseeable chance of meeting EU requirements; and (5) to enhance the competitiveness of Kayunga SMP milk quality needs to be enhanced at the farm level.
It is economically feasible to produce SMP from milk produced by small-scale farmers in Uganda for the local market. It costs significantly more to produce SMP to recommended standards for world and EU markets than for local markets.
ExplanationsCost of cooling facilities/collection centre: This cost includes operating and investment costs of a typical Kayunga collection centre; in the EU and world scenarios, it includes cooling costs on the farm. Cost of transport cooling tank – processor: This cost includes cost of transport from the cooling centre to the processor’s gate in Kayunga. In the EU and world scenarios, this means transport from the farm to the processor. Cost of transport farm - cooling tank): Normally the farmer or milk trader delivers to a collection centre (therefore it costs assumed to be nothing). SMP processing costs: EU Level of US$363/ton of SMP is assumed due to lack of data and access to accurate information. Transport costs Kayunga - trading ports: These costs are not included in the calculations. However, shipping 1 kg of SMP from Kayunga to Rotterdam costs US$0.20 per ton (quotation in February 2007 by SDV Transami Uganda, for a full 20 ton container). Similarly, the cost of transporting 1 kg of SMP to the nearest world port (Mombasa, Kenya) would be US$0.12 per ton, while from Kayunga to Kampala it would be US$0.10 per ton.
This study was conducted by A. Ndambi, O. Garcia and T. Hemme of the IFCN Dairy Research Center and published as ‘How competitive is skim milk powder from Uganda’ in the IFCN Dairy Report 2008.
Introduction
Small-scale dairy production systems in Africa, Asia and South America are ‘low-cost’ compared with those in the European Union (EU) and the United States (as described in chapter 4). If this advantage were transferred to the whole dairy chain, there might be a chance of producing competitive dairy products for the world market. The aim of the present study was to explore the possibility of transforming low-cost milk produced by smallholder dairy farmers in Uganda into skim milk powder (SMP) for sale on three distinct markets, namely Uganda itself, the international market and the EU.
Methodology
For the purpose of this study, several panels of dairy experts were established to review the condition of the dairy chain in Uganda and to identify the changes necessary for SMP from Kayunga to enter the three markets in question. Major methodological challenges emerged as a result of the lack of data and of dairy processing experience. To circumvent the latter, several estimations and assumptions had to be made based on available data from neighbouring regions.
Competitiveness of Kayunga SMP on Uganda,
World and EU markets in 2006
Both graphs on the top of next page, in principle, display the same results. The first gives the costs of SMP production in United States dollars per ton of SMP (of interest for processors and traders). The second graph gives the results in United States dollars per 100 kg of milk equivalent (of interest for producers and processors). In 2006, the cost of producing SMP in Kayunga was about 20 percent lower than the ‘world cost’, which, combined with high Ugandan import tariffs of 60 percent for SMP, put Kayunga SMP in a strong competitive position on the domestic market.
If Kayunga SMP were obliged to meet the CODEX standards for raw milk quality to enter the world market, the cost of producing SMP would rise to 67 percent above the world cost for raw milk procured from the small Ugandan farm type KY-3 and to 14 percent above the world cost for raw milk procured from the medium-sized farm type KY-13. This significant cost increase is a result of having to improve milk quality at both the farm and collection centre levels. The additional

© IFCN 2008 135
Competitiveness of SMP in Uganda, World and EU markets in 2006
Competitiveness of Kayunga SMP 1996 - 2007
EU marketUganda market World market
ExplanationsEU scenario: Represents the case of a typical farm in Germany supplying to an average SMP processor.World scenario: Is based on the economics of a typical New Zealand farm, whose milk is converted into SMP.UG-3 now scenario: Represents current costs on the Kayunga farm for milk production + collection, at current milk quality and used for SMP.Processing costs kept constant (at EU levels) for all scenarios due to lack of data/ expertise/ access to better information.
Key assumptions in the time period 1996 - 2007SMP price in Uganda scenario: SMP world price plus Ugandan import tariff s in 2006. Tariff s kept constant for 1996-2007.Kayunga milk price 1996-2007: Linked to Uganda milk price 1996-2007 based on the Kayunga-Uganda milk price relation in 2006.
Non-IFCN sources: CODEX Standards for milk powders and cream powders, at http://www.codexalimentarius.net/ web/standard_list.jsp For milk quality standards, see Codex Stan 207; page 2); http://www.unctad-trains.org, consulted on February 2007 for the Ugandan tariffs for dairy imports; http://www.zmp.de for some dairy commodity prices, processing costs for SMP and butter, and conversion factors for milk into both SMP and butter; and personal interviews with dairy experts (farmers, veterinarians, NGO and government staff, dairy processors, milk transport services and retailers) operating in Kayunga, Kampala, Mukono and Mbarara, during the summer of 2006 and in February 2007.
5.8 The competitiveness of skim milk powder from Uganda

136 © IFCN 2008
Feed prices paid by dairy farmers
Farmers in Polloc pay US$0.27, US$0.17 and US$0.29 per kilogram, respectively, for their most common balanced feed mix, wheat middling and cottonseed meal. These prices do not include the cost of farmers’ labour and transportation from the distributor to the farmgate, which was estimated at between US$0.02 and US$0.05 per kilogram, respectively. Therefore, the average farmgate price for feed is US$0.27/kg, about double the IFCN world feed price estimate. Using the milk price of farm PE-6, the milk:feed price ratio is very low at 0.68. This means that with the proceeds of 1 kg of milk it is possible to purchase 0.68 kg of feed, which is one of the lowest figures found in the 34 countries analysed by the IFCN.
Transportation costs and retail margins
The transportation costs and margins of retailing (farmers’ prices - primary distributor price) were estimated as US$0.06, US$0.05 and US$0.08/kg, respectively, for the balanced feed mix, wheat middling and cottonseed meal. Transportation costs and margins for intermediaries along the chain thus amount to 22 to 29 percent of farmers’ feed prices in Polloc. The prices paid by the primary distributors in Lima represent about 60 to 70 percent of farmers’ final feed prices.
Conclusions
Dairy feed is very expensive in Cajamarca. Therefore, with the current milk prices, it is not generally economical to use concentrates on dairy farms. However, more efficient feed distribution chains could improve the milk:feed price ratio and thereby encourage use of concentrates, which would in turn increase milk yields and thereby household incomes.
It should be noted that this study was conducted in 2005, when feed prices were relatively stable. However, they increased from 2006 until they peaked in June 2008 and then started falling again. IFCN predicts that feed prices will remain volatile, a situation that needs to be considered in interpreting the results.
5.9 The dairy feed chain in Peru: a case study
Explanation of variablesWheat middling: Wheat middlings are a by-product of the flour and semolina (pasta) industry. They contain bran, germ and small amounts of starch, and are used widely in the feed industry as basic ingredients in commercial protein supplements, creep feeds and other feed products. IFCN estimate for world market price for feed: 0.3*soya bean meal price (CIF Rotterdam) and 0.7*corn price (FOB Gulf). Situation in 2005 (season 2004/05): SBM=US$239/ton; corn= US$98/ton = IFCN feed price estimate=US$138/ton.Transport cost from Polloc to the farm: Range US$0.02- 0.05/kg; US$0.035/kg used in the graphs.
This study was conducted by C. Gomez and M. Fernández of Universidad Nacional Agraria La Molina, Lima, Peru, and O. Garcia of the IFCN Dairy Research Center. It was published as ‘Analysis of the Peruvian feed chain: The case of Cajamarca’ in the IFCN Dairy Report 2006.
Introduction
Dairying does not just involve milk production and marketing but also includes the supply chain for farm inputs. As feed is both a major input to, and the largest cost item of, most dairy farms, it can be hypothesized that any improvement of feed distribution will not only have a significant influence on the cost of milk production but will also determine the intensity of feed use in milk production. The aim of the present study was to assess the economics of the various distribution channels for the most common concentrates used in Cajamarca, Peru.
Methodology
The study is based on information collected in 2005 from feed suppliers, farm managers and feed advisors in the region of Cajamarca. Data collection took place in a representative dairy site in a high valley area (Polloc) and covered the three most commonly-fed supplementary feeds: (i) a balanced dairy feed mix (16 percent protein and 1.6 Mcal/kg); (ii) wheat middling; and (iii) cottonseed meal.
Feed prices in Lima
The Cajamarcan feed chains start with primary distributors in Lima, who mostly use imported ingredients and sell balanced dairy feed mixes and/or wheat middling and cottonseed meal (as single feedstuffs) for US$0.21, US$0.12 and US$0.21/kg, respectively (prices at their warehouses in Lima). The IFCN estimated the world market price of balanced feeds in 2005 at US$0.138/kg. On the basis of this, the cost of bringing feed from world trading points (US-Gulf/Rotterdam) to Lima would be about US$0.07/kg.

© IFCN 2008 137
Farmer feed prices (Farm gate in Polloc, Cajamarca)
The feed chain for a dairy farmer (Polloc, Cajamarca)
0.00
0.05
0.10
0.15
0.20
0.25
0.30
0.35
Cotton seed meal Wheat middlingBalanced feed mix
0.138: IFCN estimate of world market »feed« price
Distributor feed prices (Lima)
US$
/ kg
Margins from Lima to the farm gate (Starting at distributor prices in Lima)
0.00
0.05
0.10
0.15
0.20
0.25
0.30
0.35
Cotton seed meal Wheat middlingBalanced feed mix
0.00
0.02
0.04
0.06
0.08
0.10
0.12
Cotton seed meal Wheat middlingBalanced feed mix
Transport cost to the farm (PE-6)Margin f. Lima to Polloc
0 %
20 %
40 %
60 %
80 %
100 %
Cotton seed meal Wheat middlingBalanced feed mix
Transport cost to the farm (PE-6)Margin f. Lima to PollocDistributors' Prices in Lima
US$
/ kg
US$
/ kg
5.9 The dairy feed chain in Peru: a case study

138 © IFCN 2008
5.10 A comparison of dairy farming systems in India
WB
BI
PU
HA
PU
PU
JK
RA
GU
MA
AP
TN
HP
OR
MP
KA
UP
KEKE
WB
BI
PU
HA
PU
PU
JK
RA
GU
MA
AP
TN
HP
OR
MP
KA
UP
KEKE
PU
HA
PU
OR
KA
HARYANAIN-2HAIN-4HA
MaharashtraIN-2MA°IN-2MA
Andhra PradeshIN-1AP-MNIN-3AP-MN
IN-1AP-GRIN-2AP-GR
PU
HA
PU
OR
KA
HaryanaIN-2HAIN-4HA
MaharashtraIN-2MA°IN-2MA
Andhra PradeshKarnataka
OrissaIN-2OR-CIN-2OR-B
OrissaIN-2OR-CIN-2OR-B
IN-1MNIN-3MN
IN-1GRIN-2GR
IN-1KAIN-2KAIN-4KA
Introduction
Dairy farms vary considerably in terms of their distance to consumption centres and their surrounding agro-climatic, socio-economic and political settings. India has the world’s largest dairy animal population spread across the vast nation and it is likely that variation in the above factors across India has an influence its on dairy production systems and their productivity. The aim of the present study was to assess the variation in dairy farming and dairy farm economics across different regions of India.
Selection of the study areas
India’s dairy production systems / areas can roughly be classified as ‘progressive’, ‘average’ and below ‘average’. The ‘progressive’ systems / areas are found in the states of Punjab and Haryana, while the ‘below-average’ systems dominate in the states of Orissa, Madhya Pradesh, Karnataka, Himachal Pradesh and all the north-eastern states except Mizoram and Sikkim. Dairy production systems in the remaining states of India can be classified as ‘average’ or as in between ‘progressive’ and ‘below-average’. Correspondingly, for this comparison, typical farms from Haryana were chosen to represent the ‘progressive’ systems / areas; farms from Maharashtra and Andhra Pradesh to represent the ‘average’, and farms from Orissa and Karnataka to represent the ‘below-average’ systems / areas. (‘Progressive’ systems can be found in areas where ‘below-average’ systems predominate and vice-versa. For example, within the ‘lagging’ regions of Karnataka, pockets of dairy zones with very high milk yields were identified.)
Household economics
Most of the dairy farming systems are operated by part-time farmers who earn between 8 and 30 percent of their income from dairying, the exceptions being the farms in Karnataka, IN-2KA and IN-4KA, which earn 40 and 48 percent of their income from dairying. Thus dairy farming is mostly an activity of part-time farmers who also depend on off-farm income for their livelihood. The vast majority of dairy farm households earn less than US$1 per capita/day. Most landless dairy farm households only make US$0.2-0.4 per capita/day. (It should be noted that these estimates of household income are not adjusted for purchasing power parity and thus are not comparable with the internationally used poverty lines.)
Dairy enterprise economics
The cost of milk production ranges from US$15.7 to US$28.3 per 100 kg of ECM. The cost of producing milk is relatively lower on farms with access to land compared with farms that have no such access. However, all farms find ways to generate a positive income from dairying and most make a return to labour similar to the wage level in their area. The landless farms − IN-1MN, IN-1GR, IN-1KA and IN-2HA − do not achieve this wage level, but will continue their dairy operations until such time as an alternative, better employment opportunities become available.
Conclusions
The economics of dairy farming are greatly affected by regional variations in resource quality and access and scale of production. Milk is mostly produced by low-income farm households; hence, dairy farming is mainly intended to improve livelihoods rather than as business venture. Regional variations in the cost of milk production are compensated by differences in land costs, wage rates and input productivity.
Explanation of variablesResult variables: See Chapter 4. Year of data collection: 2004. Source: Survey of the regions indicated in the map.
This study was undertaken by A. Saha of the IFCN Dairy Research Center and published as ‘An inter-regional evaluation of dairy farming systems in India’ in the IFCN Dairy Report 2005.
Typical dairy farms analysed in India

© IFCN 2008 139
Farm 2HA° 4HA 2MA° 2MA 2OR 2OR-B 1KA° 2KA 4KA 1AP°-GR 2AP-GR 1AP°-MN 3AP-MN
Haryana Maharashtra Orissa Karnataka Andhra Pradesh
Region Karnal Kolhapur Ganjam Kolar Guntur Mahboobnagar
Production system Rural L Rural PU Rural Rural G Rural Rural Rural Rural Rural-SG Rural Rural G Rural
Animal type Buffalo MB /CBH Buffalo Buffalo LC LB CBJ CBH CBH UB UB LC LB
Yield (kg/animal/year) 800 1,238 1,250 1,410 256 430 3,015 3,450 4,050 1,050 1,365 680 730
Fat (%) 6.5 6 8 7.5 3.6 5 3.5 3.5 3.6 5.5 7.2 4.0 6
Landholding (ha) 0 3.7 0 0.9 0.8 2 0 0.8 1.6 0 0.8 0 3
Arable land rent (US$/ha) - 276 - 221 221 221 - 221 193 - 221 - 165
Wage rate (US$/hour) 0.13 0.16 0.07 0.09 0.05 0.05 0.09 0.10 0.10 0.13 0.13 0.13 0.13
IN-3
MN
IN-1
MN
IN-2
GR
IN-1
GR
IN-4
KA
IN-2
KA
IN-1
KA
IN-2
OR-
B
IN-2
OR
IN-2
MA
IN-2
MA
°
IN-4
HA
IN-2
HA0.0
0.5
1.0
1.5
2.0
2.5
0.3
2.2
1.0
0.7
0.2
0.8
0.30.3
2.4
0.4
0.9
0.4
0.7
US$
/ 100
kg
milk
(ECM
)U
S$ /
capi
ta /
day
Dairy enterprise economics
Household economics
0 %
10 %
20 %
30 %
40 %
50 %
60 %
70 %
80 %
90 %
100 % Other farm income Off-farm income Dairy income
IN-3
MN
IN-1
MN
IN-2
GR
IN-1
GR
IN-4
KA
IN-2
KA
IN-1
KA
IN-2
OR-
B
IN-2
OR
IN-2
MA
IN-2
MA
°
IN-4
HA
IN-2
HA
Average wages on the farm Return to labour
0.00
0.05
0.10
0.15
0.20
0.25
0.30
0.35
0.40
IN-3
MN
IN-1
MN
IN-2
GR
IN-1
GR
IN-4
KA
IN-2
KA
IN-1
KA
IN-2
OR-
B
IN-2
OR
IN-2
MA
IN-2
MA
°
IN-4
HA
IN-2
HA0
5
10
15
20
25
30 Opportunity cost Milk price Costs- non-milk returns
IN-3
MN
IN-1
MN
IN-2
GR
IN-1
GR
IN-4
KA
IN-2
KA
IN-1
KA
IN-2
OR-
B
IN-2
OR
IN-2
MA
IN-2
MA
°
IN-4
HA
IN-2
HA
US$
/ hou
r
Income per capita per day Household income share
Costs of milk production only Return to labour
Farm description
Farm IN-2HA IN-4HA IN-2MA° IN-2MA IN-2OR IN-2OR-B IN-1KA IN-2KA IN-4KA IN-1GR IN-2GR IN-1MN IN-3MN
Roughage Wheat straw Sugarcane tops Paddy straw Jowar and Ragi straw Paddy straw Paddy and jowar straw
Milking system Hand Hand Hand Machine Hand Hand
Rainfall 1,100 mm 1,300 mm 850 mm 900 mm 853 mm 604 mm
L = Landless; G = Grazing; SG=Semi grazing; PU = Peri-Urban; MB / CBH= Murrah Buffalo + Crossbred cows (Holstein); CBJ = Crossbred cows (Jersey); CBH = Crossbred cows (Holstein); LB = Local buffalo; UB = Upgraded buffalo; LC=Local cow; Rainfall data from various published sources.
5.10 A comparison of dairy farming systems in India

140 © IFCN 2008
5.11 A comparison of rural & peri-urban milk production systems in South Asia
Explanation of variablesResult variables: See Chapter 4. Farm types: IN-22R: farm with five buffalos and 17 cows located in the rural region of Kamal District in Haryana. IN-37U: farm with 26 buffalos and 11 cows located in peri-urban part of Karnal District in Haryana. PK-10R: farm with eight buffalos and two cows located in the rural region of Layyah District, Punjab. PK-10U: farm with eight buffalos and two cows located in the peri-urban part of Lahore City, Punjab.
This study was conducted by K. Mahmood, A. Saha and T. Hemme of the IFCN Dairy Research Center, and published as ’Comparing rural vs. peri-urban milk production systems in Asia’ in the IFCN Dairy Report 2004.
Introduction
In developing countries, particularly in Asia, there exists a stark contrast between rural dairy farms that have a land basis for fodder / feed production and peri-urban dairy farming systems that rely on purchased feed. This dichotomy raises questions as to which system will be more competitive in satisfying the growing urban demand for milk in the near future. Moreover, policy-makers raise the question: What is ‘better’ in the long run - to move feed or milk from rural to urban areas? To address this concern, the present study compares the costs and returns of rural and peri-urban dairy production systems.
Methodology
To address the above question the current assessment draws on data on farms in India and Pakistan, focussing on the larger dairy farm types as the IFCN had comparable data from larger typical farms in both countries, sited in rural and peri-urban locations. The ‘typical’ peri-urban farms selected (IN-37U and PK-10U) are located within a radius of 5 to 10 km around a city; they do not have sufficient land for feed / fodder production and therefore purchase feed (both green fodder and concentrates); and tend to sell milk directly to consumers in the urban centres.
The two typical farms selected to represent dairy farms in rural areas (IN-22R and PK-10R) are located more than 10 km away from an urban centre, have sufficient land for feed / fodder production and market their milk through a ‘milkman’.
Milk prices and cost of milk production
In both countries, the peri-urban farm types receive higher milk prices (US$27/100 kg of ECM) by selling their milk directly to urban consumers. Their price advantage amounts to approximately US$10/100 kg of ECM, or 37 percent more than the price received by farmers in rural areas.
The milk production costs of peri-urban farms in both countries is in excess of US$22/100 kg of ECM, which is considerably higher compared with rural farms, which have production costs of US$11 to 13/100 kg of ECM.
Entrepreneur profit and return on investment
The entrepreneur profits are US$4.8 and US$5.9 per 100 kg of ECM on the Indian farms and US$3.8 and US$4.8/100 kg of ECM on the farms in Pakistan. In both countries, the return on investment (ROI) is higher in the peri-urban farms. The peri-urban farm in India has a very high ROI of 37 percent compared with 10 percent on the rural farm and the peri-urban farm in Pakistan has an ROI of 19 percent compared with 8 percent on the rural farm.
Asset structure per cow
The reason for the differences in entrepreneur profits and ROIs lies in the different asset structure of peri-urban and rural dairy farms. In the case of the rural farms, land is the dominant asset employed in milk production and land prices are very high (US$10 000 to 30 000/ha). In the case of peri-urban farms, the total value of assets is about US$500/cow, while in rural farms the corresponding figure is more than US$2 000/cow. The value of the land required to house the animals is not included in the above calculation. A preliminary estimate shows that inclusion of this value would lower the advantage of the peri-urban systems, but would not change the overall results..
Strengths and weaknesses
An analysis of the profile of the strengths and weakness of the selected farm types shows that peri-urban farms in both India and Pakistan have higher total dairy returns thanks to higher milk prices. At the same time, however, total costs are also higher inasmuch as peri-urban farms need to purchase feed and replacement animals.
Conclusions
The cost of producing milk in rural areas is as much as 40 to 50 percent lower than the comparable cost in peri-urban areas. However, milk prices are also lower in rural than in peri-urban areas, where higher feed costs make milk production more expensive. As a net result, despite the higher production costs, peri-urban farms have higher returns per 100 kg milk produced, and hence are more profitable than farms in rural areas.
To be noted as caveat, this assessment assumes that feed is produced in rural areas and sold to peri-urban farmers, and that the price received by rural farmers for their milk remains low(er) compared to the milk price received by peri-urban dairy farmers. Once these conditions no longer hold, the outcome of the comparison may also change.

© IFCN 2008 141
Buildings and machinery OtherLivestockLand
0
500
1,000
1,500
2,000
2,500
3,000
PK-10UPK-10RIN-37UIN-22R
0
5
10
15
20
25
30
Milk price Opportunity costs Costs from P&L account - non-milk returns
PK-1
0U
PK-1
0R
IN-3
7U
IN-2
2R
0
1
2
3
4
5
6
PK-1
0U
PK-1
0R
IN-3
7U
IN-2
2R
Cost of milk production only Location of dairy farms Entrepreneur‘s profit
Profile of strengths and weaknesses
Return on investment (nominal) Asset structure per cow
US$
/ 100
kg
ECM
US$
/ 100
kg
ECM
US$
/ cow
Peri-urban FarmsLocated in 5-10 km
Radius of town
UrbanArea
All Feed bought
PK-U IN-U
Rural FarmsLocated more than 10 km from
peri-urban ring, produce their own fodder
PK-R IN-R
-15 -10 -5 0 5 10 15Return to labour
Entrepreneur's profitFamily farm income
Other costsCapital costsLabour costs
Land costsVet., Med. & A.I.
Building costsFuel, Energy, Water
Machinery costsAnimals purchased
Feed costsTotal costs
Other returnsCattle returns
Milk returnsTotal returns
WeakStrong
US$/100 kg ECM
IN-37 urban vs IN-22 rural farm PK-10 urban vs PK-10 rural farm
5 %
10 %
15 %
20 %
25 %
30 %
35 %
40 %
PK-10UPK-10RIN-37UIN-22R
-15 -10 -5 0 5 10 15Return to labour
Entrepreneur's profitFamily farm income
Other costsCapital costsLabour costs
Land costsVet., Med. & A.I.
Building costsFuel, Energy, Water
Machinery costsAnimals purchased
Feed costsTotal costs
Other returnsCattle returns
Milk returnsTotal returns
WeakStrong
US$/100 kg ECM
5.11 A comparison of rural & peri-urban milk production systems in South Asia
Strength Weakness
Strength Weakness

142 © IFCN 2008
5.12 Comparison of small- and large-scale dairy farming systems in India & US
Explanation of variablesFarm codes: IN-2HA = two-cow farm in Haryana, US-2400TX = USA 2 400-cow farm in Texas (farm data refer to the year 2003).Results variables: Similar to those described in Section 4.Labour efficiency: Amount of ECM produced per unit of labour.Feed costs: Cost of purchased feeds, land and variable costs of forage production (seeds, fertilizer, etc.).Feed ‘price’: Total feed costs/total quantity of dry matter of feed calculated per 100 kg of ECM produced.Feed efficiency: Amount of ECM milk produced per kg of dry matter consumed.
This study was conducted by A. Saha and T. Hemme of the IFCN Dairy Research Center and published as ‘Comparison between the farms IN-2 and US-2400’ in the IFCN Dairy Report 2004.
Introduction
In South Asia, as in most developing countries, dairy farming is predominantly a smallholder, family-based, mixed crop-livestock farming operation. Farmers feed their cattle with crop residues, mainly straw, and natural grasses (often from common land). Milk yields per cow and year are usually low. By contrast, capital-intensive dairy farms, operating with hired labour, predominate in the United States. The purpose of the present assessment was to compare small- and large-scale dairy farming systems in order to determine their relative strengths and weaknesses.
Methodology
IFCN methodology was used to estimate and compare costs of milk production. The farms chosen for the comparative analysis were a typical two-buffalo farm in Haryana, India (1 058 kg of ECM per buffalo cow and year) and a 2 400-cow farm in Texas, United States (8 589 kg of ECM per cow per year). The farm data refers to the year 2003. The cost of milk production was subdivided into feed, labour and ‘other’ costs.
Cost of milk production
The cost of milk production minus the non-milk returns was lower on the farm in India while the full economic cost of US$28 per 100 kg of ECM was similar on both dairy farms. Feed costs account for 30 percent of production costs on the Indian farm and for 60 percent on the United States farm while labour costs account for 50 percent of total costs on the Indian farm and for only 10 percent on the US American farm.
Labour cost component
Labour costs are higher on the Indian farm (US$17 per 100 kg of ECM) compared with only US$3.5 per 100 kg of ECM on the US American farm. This can be explained by the higher labour productivity on the US American farm (255 times higher!!) while the wage rate is only 50 times higher. In terms of labour efficiency, the above corresponds to 5 kg of ECM per minute of farm labour on the US American farm against only 0.02 kg of ECM on the Indian farm. (Conversely, it takes 12 seconds of farm labour to produce one litre of milk on the US
American farm compared with 51 minutes on the Indian farm to produce the same amount.) The farm in Texas invests 5 minutes of farm labour time per cow/day, while on the Indian it is 2.5 hours per animal/day.
Feed cost component
The feed costs on the Indian farm are US$10 per 100 kg of ECM compared with US$19 on the US American farm. This can be explained by feed prices of US$0.18 per kilogram of dry matter on the US American farm compared with only US$0.03 for the same amount on the farm in India. The United States farm uses better-quality forage (sorghum and corn silage, alfalfa hay) and a high proportion of concentrates (50 per- cent). The Indian farm feeds mostly grasses, sugarcane tops (free-of-charge), wheat/paddy straw and 120 grams of concentrates (cotton seed/mustard seed cake) per buffalo per day.
The impact of the difference in feed quality is evident: feed efficiency is 3.6 times higher on the US American farm, with 0.97 kg of ECM produced per kilogram of dry matter against only 0.27 kg of ECM on the Indian farm. The US American farm uses 1 kg of dry matter to produce 1 kg of milk whereas the Indian farm needs 3.6 kg of dry matter for the same quantity of milk.
Conclusions
The cheap feed source compensates for lower feed efficiency on the typical, two-buffalo landless farm in Indian. The wages paid in India are very low (US$0.2/hour) but the very low productivity of labour stills results in high labour costs per kg of milk produced compared with those of the large-scale US American farm. The key cost advantage of the Indian system thus lies in the low feed costs (crop residues such as straw) in combination with low milk yields. The maximum daily feed intake capacity of about 15 kg of dry matter limits the milk yield per animal on the Indian farm.

© IFCN 2008 143
0
5
10
15
20
US-2400TXIN-2HA
Hired labour costsFamily labour costs
0
5
10
15
20
US-2400TXIN-2HA0.0
0.2
0.4
0.6
0.8
1.0
1.2
US-2400TXIN-2HA
0
1
2
3
4
5
6
US-2400TXIN-2HA
0.02
5.0
0
2
4
6
8
10
12
US-2400TXIN-2HA
0.00
0.02
0.04
0.06
0.08
0.10
0.12
0.14
0.16
0.18
0.20
US-2400TXIN-2HA
0 %
20 %
40 %
60 %
80 %
100 %
US-2400TXIN-2HA
Feed costs Labour costs Other costs
Cost of milk production
Average wages on the farm Labour costs
Share of cost components
US$
/ 100
kg
ECM
US$
/ 100
kg
ECM
US$
/ hou
r
Labour efficiency
Feed price Feed costs Feed efficiency
kg E
CM / m
inut
e
US$
/ 100
kg
ECM
US$
/ kg
dry
mat
ter
kg E
CM / k
g dr
y m
atte
r
0
5
10
15
20
25
30
35
US-2400TXIN-2HA
Milk price Opportunity costs
Costs from P&L account - non-milk returns
5.12 Comparison of small- and large-scale dairy farming systems in India & US

144 © IFCN 2008
5.13 Comparing household, whole farm and dairy enterprise levels in India
Introduction
In small-scale, family run dairy production systems, the economics of the household, whole farm, and the dairy enterprise are intimately interlinked and difficult to disentangle one from the other. However, to be meaningful, farm economic analysis requires a precise separation of the three levels.
Methodology
The aim of the present study was to analyse the economics of small-scale dairy farms in India at the dairy enterprise, whole farm, and household level. This analysis attempts to illustrate the different aspects and complexity of the farming household system. Three farm types in India were chosen for this analysis and purpose. In addition to the data on the dairy farming system detailed data had been collected on economic aspects of the household and the whole farm.
Household activities and income
Total annual household income differs significantly between the three households (US$700 to 7 800/year) and increases in accordance with herd size. The smallest farm, IN-2, dedicates a large proportion of its family labour to off-farm activities, which contribute 75 percent to total household income. The remaining 25 percent of total household income are returns from milk and manure. The household covers all cash expenses with the farm receipts and has milk and manure for heating as a surplus to improve family living conditions. By contrast, on the large farm, IN-22, 100 percent of the family labour is used for on-farm work. The situation is somewhat between these extremes on the intermediate size farm, IN-4, which dedicates 30 percent of its family labour to off-farm activities.
Farm activities, returns and income
The IN-2 farm type may be considered as a specialized dairy farm while the two larger farm types also generate returns from selling cash crops. The IN-4 farm rents out machinery to other farmers. Total farm returns range from US$300 to US$20 000 per annum while the corresponding net cash farm
incomes range from US$160 to US$7 800. The share of the net cash farm income in farm returns is approximately 50 percent on the smallest farm and 37 percent on the largest farm.
Dairy enterprise, returns and competitiveness
Total annual returns from the dairy enterprise range from US$300 to US$26 000. The estimate of the return to (family) labour provides an indication of how competitive the dairy enterprise is on the local labour market. Both larger farms are very competitive as they generate ‘salaries’ that are above the local wage level. Without major improvements in labour productivity, the IN-2 farm type will find it difficult to compete with the larger farm types over the long term. However, as in most other countries, farmers will keep their dairy cows as long as no alternative employment opportunities are available.
The cost of milk production ranges from US$12 to US$22/100 kg milk and provides a measure of a farm’s competitiveness on the milk market. Economies of size are evident. The larger farm types (IN-4, IN-22) have milk production costs similar to those in Oceania and South America. With the existence of a competitive dairy chain in India, these farms would be able to compete against imports and should even be able to produce milk for export.
Conclusions
While there is a strong interrelation between the three levels of economic analysis, the applied methodology offers a chance to reasonably distinguish between them. The smallest farm type has higher milk production costs than the larger ones, but its actual cash expenses per kilogram of milk produced are less than half those of the larger farm types. A large part of the production costs on the smallest farm type consists of opportunity costs for family-owned resources, mainly family labour. If a family member working in the dairy enterprise actually has the opportunity to work off-farm the milk production cost will be as high as shown. However, in case no opportunity for off-farm work exists, the opportunity cost of family labour will be zero which means a small-scale dairy farm can be more competitive than the larger farm types analysed.
Explanation of variablesFarm codes: Example IN-2 = Indian two-cow farm. The farm data refers to the year 2002.Labour use: All family labour used to generate income.Household income: Includes cash and non-cash income from farm and off-farm activities.Off-farm income: Include all salaries for all family members.Net cash farm income: Total farm returns (including milk and manure used in the household) minus total farm expenses.Method challenge: Once the opportunity to work off-farm is not there the opportunity costs for labour could be zero.
This study was conducted by T. Hemme, O. Garcia and A. Saha, IFCN Dairy Research Center, and published as ’India: Household, whole farm and dairy enterprise level analysis’ in IFCN Dairy Report 2003.
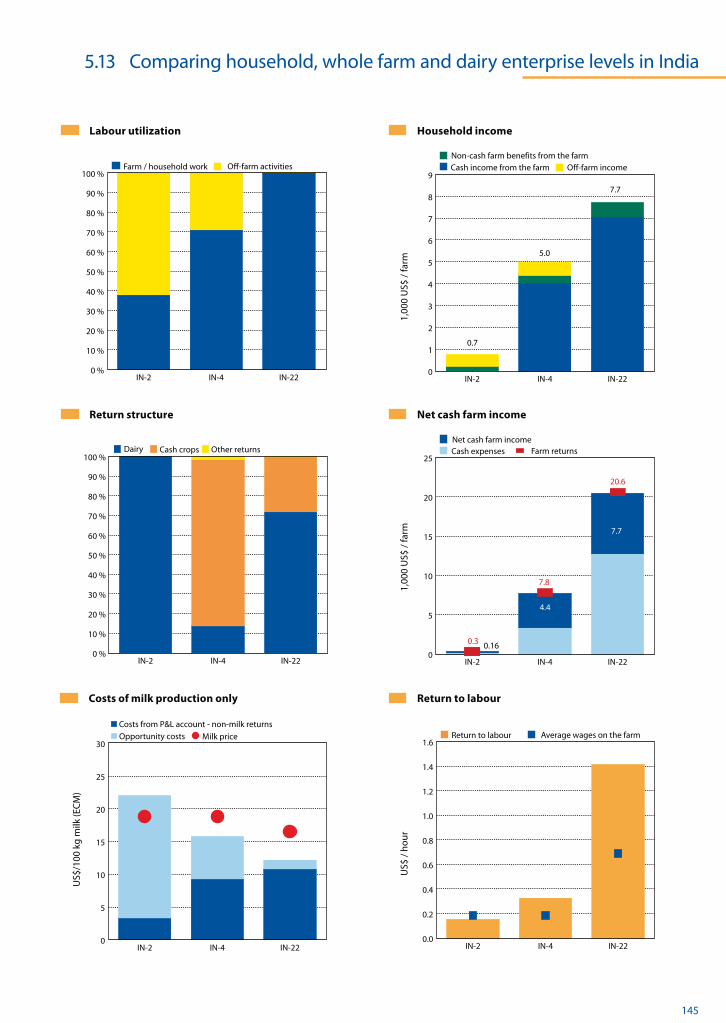
© IFCN 2008 145
0 %
10 %
20 %
30 %
40 %
50 %
60 %
70 %
80 %
90 %
100 %
IN-22IN-4IN-2
Off-farm activities Farm / household work
0
1
2
3
4
5
6
7
8
9
Non-cash farm benefits from the farm
Off-farm incomeCash income from the farm
IN-22IN-4IN-2
0.7
7.7
5.0
0 %
10 %
20 %
30 %
40 %
50 %
60 %
70 %
80 %
90 %
100 %
IN-22IN-4IN-2
Other returns Cash crops Dairy
0
5
10
15
20
25
Net cash farm income
IN-22IN-4IN-2
20.6
7.8
0.3
7.7
4.4
0.16
Farm returns Cash expenses
0
5
10
15
20
25
30
IN-22IN-4IN-2
Milk price Opportunity costs
Costs from P&L account - non-milk returns
0.0
0.2
0.4
0.6
0.8
1.0
1.2
1.4
1.6
IN-22IN-4IN-2
Average wages on the farm Return to labour
Labour utilization
Costs of milk production only
Net cash farm income Return structure
Household income
Return to labour
1,00
0 U
S$ /
farm
US$
/100
kg
milk
(ECM
)
US$
/ ho
ur1,
000
US$
/ fa
rm
5.13 Comparing household, whole farm and dairy enterprise levels in India

146 © IFCN 2008
5.14 Methodological approach for guiding dairy development activities
Developing an action plan
All but three of the possible interventions reduce MN-3’s milk production costs. Some of the interventions individually have a major impact and bring milk productions costs down to the target of US$16/100 kg of ECM. However, it would be advisable for dairy development programmes to rely on combining the strengths of different interventions.
A panel of experts combined interventions into a programme that first improves the management of MN-3 (here referred to as MN3-Top). A secondly step foresees breed improvements from local to grade (cross-bred) and then to pure Murrah buffaloes. And, thirdly, they agreed that MN-3 would subsequently be in a position to increase its herd size to five, and then ten, well-managed and productive animals. This sequence was referred to as ‘dairy development ladder’.
The sequential combination of the selected interventions shows that MN-3 can reach the target of US$0.15/hour simply by improving its management. Improving the genetic potential and increasing the size of the herd is predicted to result in a return to labour of US$0.25 (5.3 times its current level). Similarly, the programme also reduces MN-3’s milk production costs from US$23 to US$16/100 kg of ECM − a 30 percent reduction.
Conclusions
The above approach proved very helpful in assisting dairy stakeholders to (1) gain a clearer understanding of the economics of local dairy production systems and of ‘business’ targets for dairy development (2) assess the farm-level impact of various potential interventions to improve dairy farm profitability and competitiveness, and (3) bring together diverse stakeholders to jointly formulate an action plan for local dairy development.
The importance of the intense participation of local dairy stakeholders in this approach cannot be over-emphasized. They identify the farms that are typical for the area, set the performance targets, assess on-farm resources and off-farm dairy development opportunities and, finally, combine all potential interventions into a clear development strategy.
Introduction
In today’s rapidly-changing dairy sectors, farmers require strategies for the development of their dairy enterprise that are based on business approaches to enterprise management. Crafting such strategies draws on the critical managerial tasks of defining business performance targets (the ends) and action plans to achieve them (the means). The major challenge here is that few dairy stakeholders have sufficient knowledge of their own dairy sector and trends and the entrepreneurial skills to either set adequate targets or design action plans to achieve them. The present study is an example of an approach to assist dairy stakeholders to set realistic business targets and to develop a plan for meeting them.
Methodology
This exercise was carried out in the District of Mahboobnagar (Andhra Pradesh) in India and focused on developing a strategy to improve the predominant milk production system − a dairy farm with three local buffaloes (MN-3). Among the economic outcome variables, return to labour and cost of milk production were selected to guide the farm development strategy. In a sequential approach, the three most prominent dairy farm types in the region were benchmarked (performance targets) and potential dairy development interventions for MN-3 identified and ranked in accordance with their expected impact on MN-3’s competitiveness. A panel of local experts then combined the interventions into a development programme and action plan to improve MN-3’s dairy competitiveness.
Setting performance targets
Although the returns to labour on all three farm types in the region are quite low by international standards, the larger farm type achieves 3.3 times the return to labour of MN-3 (and MN-1). With respect to the cost of milk production, the larger farm produces at about 50 percent and 70 percent of the costs of MN-1 and MN-3 respectively. These comparative results indicate that MN-3 needs to improve its return to labour (dairy profitability) from US$0.047 to US$0.15/hour and has to reduce the cost of milk production from US$23 to US$16/100 kg of ECM (increasing dairy competitiveness) in order to maintain its position in the market.
Explanation of variables & sourcesFor abbreviations of the dairy development programmes, see Section 5.2 ‘Policy analysis for dairy farming in Andhra Pradesh, India’.MN-3: A three- local buffalo farm; Top-MN3: A well-managed, three-buffalo farm; 3-Grade: A well-managed farm with three-grade-buffaloes; 3-Murrah: A well-managed farm with three-Murrah buffaloes, and so for five- and ten-Murrah farms. ECM: Energy Corrected Milk, 4 percent fat, 3.3 percent protein.
This study was conducted by O. Garcia, A. Saha, K. Mahmood and T. Hemme of the IFCN Dairy Research Center and published as ‘IFCN research approach to guide dairy development activities’ in the IFCN Dairy Report 2006.

© IFCN 2008 147
0
5
10
15
20
25
30
35
MN-14MN-3MN-1
US$
/ 10
0 kg
milk
(ECM
)
0.00
0.02
0.04
0.06
0.08
0.10
0.12
0.14
0.16
MN-14MN-3MN-1
Regional wage LevelReturn to Labour
Establishing performance targets Return to labour Costs of milk production (only)
US$
/ ho
ur
US$
/ ho
ur
The dairy ladder Return to labour Costs of milk production (only)
Comparing progammes Dairy development programmes & ideas: Impact analysis – Costs of milk production (only)
US$
/ 10
0 kg
milk
( EC
M)
0
5
10
15
20
25
10-Murrah5-Murrah3-Murrah3-GradedTop-MN3MN-3
US$
/ 10
0 kg
milk
(ECM
)
0.00
0.05
0.10
0.15
0.20
0.25
10-Murrah5-Murrah3-Murrah3-GradedTop-MN3MN-3
Regional wage LevelReturn to Labour
0
5
10
15
20
25
30
INS-
WSH
GIN
S-C
oo
pIN
S-So
loH
ealt
h-I
NS
Vet-
2-Fa
rmVe
t-C
linic
Vacc
ines
5-G
rad
3-G
rad
3-G
rad
+Lo
an2-
Gra
d2-
Gra
d+
Loan
1-G
rad
1-G
rad
+Lo
anH
erd
-Red
uct
Yiel
d+
DIM
DIM
Yiel
dB
uild
ing
Stal
l Fee
din
gPr
enat
alC
alfR
eari
ng
Wat
erin
g
Co
op
-12
WSH
GLa
bo
urS
ales
Fod
der
Sale
sC
oo
pU
nio
nFa
tom
atic
C-C
oo
ling
C-p
lan
tQ
trC
oo
pC
-mem
br
Co
mp
letF
eed
Cat
tleF
eed
Fallo
wLa
nd
Vco
mm
on
sFb
ank
GF-
Cu
tter
G-F
od
der
AllS
traw
Gro
un
dn
ut
Ure
aStr
awC
-Cam
pM
N-3
Milk price Opportunity costs (excl. quota) Costs from P&L account - non-milk returns
Feeding Programs Marketing Husbandry Genetics & Upscaling Health
Baseline level
Costs from P&L account - non-milk returns
Opportunity costs (excl. quota)
Milk price
Costs from P&L account - non-milk returns
Opportunity costs (excl. quota) Milk price
5.14 Methodological approach for guiding dairy development activities

148 © IFCN 2008
5.15 Comparison of the IFCN and Extrapolate approaches to impact analysis
Introduction
Different analytical tools have been developed and applied for the analysis of small-scale agricultural systems − which are very complex economic units − and of the impacts of policy and / or technological interventions on these systems. The main aim of this study was to compare the applicability of two models for dairy sector policy analysis. It also aimed to identify policies that have an influence on dairy farming in Uganda and to analyse their impact on milk-producing households.
Methodology
Two models were used to assess the impact of various policies on typical dairy farms in Uganda. Identification of stakeholders and policies affecting dairying, followed by ranking of these policies, was done by using the EXTRAPOLATE (EX-ante Tool for Ranking Policy Alternatives) model (Thorne et al, 2005). Deeper policy impact assessment was done using the IFCN’s TIPI-CAL (Technology Impact Policy Impact Calculations) model (Hemme, 2000). These two models were selected for their broad applicability, especially in areas with limited background data and knowledge. Data collection was carried out in two steps: firstly, through a panel approach whereby stakeholders and researchers provided and inserted data into the models, and, secondly, through on-farm visits and farmer interviews using a semi-structured questionnaire with open-ended questions. Since the EXTRAPOLATE analysis used livelihood status for ranking policies, household income was selected as a similar parameter for ranking policies using the typical model. These two parameters are compared in Table 1; the policies analysed are described in Table 2 on the next page.
Comparison of policy impacts
A comparison of the extent of policy impacts on the initial farm (status quo) using the two models is shown in Figure 1. Policies that favour better marketing outlets for milk and improved milk consumption had strong impacts on households when using both models. Marketing is usually a serious constraint for smallholder farmers because they live far from the consumers, in areas with poor roads, and produce such small amounts of milk that they do not consider it worth delivering it to the milk collection centres. They therefore deliver their milk to local milk traders at lower prices. Compared with the TIPI-CAL model, policy impact appears greater with the EXTRAPOLATE model.
Ranking of policy impacts
Details of the policy impacts are shown in Table 3, expressed as percentage change with respect to the initial situation. Ranking of impacts on households by the two methods showed extreme diversion for two policies (genetic and vet services).The other policies (3-7) were ranked in the same order by the two models. The EXTRAPOLATE model ranked provision of veterinary services as the intervention with the largest positive impact on livelihoods, while TIPI-CAL ranked it as the intervention with the lowest impact on household income. This is because the panels in the TIPI-CAL approach also consider the feasibility of a policy adoption and only assesses policy impact on a specific farm type.
In this particular case, the TIPI-CAL model describes the situation on the most common farm type in a production system with average management and performance, while the EXTRAPOLATE model assesses impacts based on a general situation across a broad variety of stakeholders. This implies that any policy / intervention that affects the top or bottom 5 percent of stakeholders is likely to be reflected in the results of the EXTRAPOLATE model, whereas the TIPI-CAL model presents only impacts that occur in the most common (majority of) cases. For the same reason, the TIPI-CAL model does not foresee any impact from the provision of credit facilities to farmers compared with the improvement in livelihood status foreseen in the EXTRAPOLATE case. According to the TIPI-CAL model, a typical small-scale extensive dairy farmer in Uganda is unlikely to take up credit. A more detailed comparison of both models is shown in Table 4.
Conclusions
Both methods make a significant contribution to ex ante policy analysis, although each has strengths and weaknesses. EXTRAPOLATE shows a more general picture, with greater emphasis on societal benefits. TIPI-CAL has a more specific target on farmers and produces more detailed and quantitative results by assessing impacts in real value terms. A combination of both approaches is likely to produce results that cover more scope and will be more useful for policy-making.
This study was conducted by A. Ndambi, O. Garcia and T. Hemme of the IFCN Dairy Research Center, and by D. Balikowa of the Dairy Development Authority in Kampala, Uganda. It was published as ‘Policy analysis by EXTRAPOLATE and TIPI-CAL Models in Uganda’ in the IFCN Dairy Report 2008.

© IFCN 2008 149
% change in Rank % change in Rank livelihood status household income
Genetic+ -6.0 7 +39.2 1Vet services +67.5 1 0.0 5Marketing+ +45.0 3 +3.1 3Quality -1.0 6 -4.7 7controlCons +46.5 2 +6.7 2promotionInput access +42.0 4 +1.2 4Credit access +36.0 5 0.0 5
EXTRAPOLATE Policies
0.0
0.5
1.0
1.5
2.0
2.5
3.0
Cre
dit
acc
ess
Inp
ut
acce
ss
Co
ns
pro
mo
tio
n
Qu
alit
y co
ntr
ol
Mar
keti
ng
+
Vet
serv
ices
Gen
etic
+
Stat
us
Qu
o 0.0
0.1
0.2
0.3
0.4
0.5
Cre
dit
acc
ess
Inp
ut
acce
ss
Co
ns
pro
mo
tio
n
Qu
alit
y co
ntr
ol
Mar
keti
ng
+
Vet
serv
ices
Gen
etic
+
Stat
us
Qu
o Figure 1:
Comparing policy impacts using EXTRAPOLATE and TIPI-CAL models EXTRAPOLATE TIPI-CAL
Live
lihoo
d st
atus
Hou
seho
ld in
com
e U
S$ /
capi
ta /
day
Policies Policies
Table 2: Description of policy impacts, EXT. & TIPI-CAL
Table 1: Livelihood status vs household income
Table 4: Comparing EXTRAPOLATE and TIPI-CAL models
Table 3: Ranking of policy impacts on farmers
Sub-components of policy impact parameters Livelihood status considers: Household income considers:
Increased production and sales of dairy products
Increased income from higher production and sales of dairy products
Increased profit margins Increased profits reflected in household income
Increased security of livestock assets
Increased animal mortality with less secure animals, hence reduced household income
Improved nutritional status Increased on-farm consumption of dairy products (reduced income from sales).
Increased on and off farm employment opportunities
Increased (or reduced) household income from on and off farm employment
Reduced environmental degradation
No impact on household income due to environmental degradation
Policies EXTRAPOLATE TIPI-CAL
Genetic+ Use of high yielding breeds
Use of high yielding dairy breeds
EXTRAPOLATE TIPI-CAL
Key strengths
The method incorporates identification of stakeholders and influential policies in its analysis It directly considers environmental and nutritional security of the farming household Broad application on farmers, traders, processors, etc
It gives a detailed assessment of policy impacts on farm parameters and the farm as a whole Considers willingness of farmers to adopt policies Flexibility in the choice for ranking parameter(s)
Key weaknesses
Only gives a relative assessment and describes a general situation Though several aspects are considered, the overall ranking is based on a single criteria (Livelihood status)
Neither identifies stakeholders nor influential policies Application is limited to farms
Higher building, machinery, feeding and veterinary costs
High costs of inputs for graded animals
Vet services Better animal health
Bringing veterinary services closer to farmers Presence of more vets in rural areas
Marketing+ Better access to markets
Improved market outlets through formation of farmer cooperatives
Improved dairy infrastructure
Quality control
Improved quality of dairy products
Improvement of marketed milk quality
Cons promotion
Improved access to markets
Higher demand and consumption of dairy products
Improved consumption of dairy products
Input access Improved availability of inputs
Improved availability of water and feed to farmers
Credit access Better access to credit and farm inputs
Increasing number of credit institutions accessible to farmers
Status quo
5.15 Comparison of the IFCN and Extrapolate approaches to impact analysis
TIPI-CAL
150 © IFCN 2008
5.16 Assessing risks faced by dairy farms
Introduction
In recent years, dairy farming has been affected by large fluctuations in milk and feed prices. It has therefore become essential to consider and assess the nature and level of risk that dairy farmers face in various production systems and world regions. The aim of the present study was to assess a range of risks faced by dairy farms.
Methodology
The simulation model TIPI-CAL was extended by the software package SIMETAR to allow for stochastic simulation. The following variables were represented by distributions rather than by fixed values: milk price, milk yield, cull cow price, culling rate, calf prices, heifer prices, grain price, soybean meal price and compound feed price. The choice of distributions was based on empirical evidence and their parameters were estimated from historical data. All stochastic variables were further correlated based on historical correlations. The risk in forage production has not been included in the analysis. One typical farm from Germany, India, New Zealand, Pakistan, Poland and the United States, respectively was selected for a comparative assessment of risks faced by different diary systems in various regions of the world.
Variability in milk price
The box plot charts display the variation in milk price around the mean, and the minimum and maximum values. The box itself covers the price range of +/-25 percentage points around the mean. Large variations in milk price are observed in Poland and New Zealand. The support price mechanism in the EU and the United States reduces the probability of very low milk prices. Therefore, in Germany and the United States high maximum values are seen while minimum values are close to the mean. In India and Pakistan, milk price variations can be classified as moderate.
Variability in return on investment
Large variations in returns on investment (ROI) are found in the US American and both Asian farms. For these countries, the minimum/maximum results in 2005 stood at about +/-8 percentage points around the mean. As a result of the variation in milk prices, milk yields, feed prices, etc., the ROI for the US American farm ranges between -7 percent and +8 percent. The Polish and New Zealand farms face less risk, as both ROIs stand at +/-5 percentage points around the projected mean. The lowest risk was observed for the German 80-cow farm (ROI +/-2 percentage points).
Risk of a cash flow deficit
Based on forecasts from FAPRI and on assumptions made with regard to prices and inflation rates, the probability of a cash flow deficit for the whole farm was estimated for the situation in 2005. The highest risk of having a serious (20 percent below needs) cash flow deficit occurs for the US American (92 percent) and the New Zealand (44 percent) farms. A moderate cash flow risk is projected for the farm in Germany. The farms IN-22, PK-10 and PL-20 do not risk experiencing a cash flow deficit.
Probability of ’economic success’
This indicator was defined as the return to labour from farming divided by the wage level in the region. In most cases this parameter is correlated with the cash flow indicator. An exception is found for the German farm, which has no chance of covering the regional wage level by working on the dairy farm. The ‘progressive’ farms in Pakistan and India were certain to receive a ‘salary’ above the local wage.
Conclusions
The applied method demonstrates the great variations in risks faced by different farming systems. Although the small-scale farms in Pakistan and India obtain very low milk prices compared with those in the United States and Europe, their price variation is moderate, which contributes to their zero percent probability of experiencing a cash flow deficit.
Explanation of variables and assumptionsFarm codes: Example: DE-80 = 80-cow farm in Germany. The farm data refers to the year 2002, published in the IFCN Dairy Report 2003. Special assumptions Germany: Owing to modelling difficulties (milk yield, quota, cow numbers), the risk in milk yield was not taken into account. ROI in nominal terms: (Entrepreneur profit + estimated interests (on non-land, non-quota assets) + interests on quota + opportunity costs for land (by land rents))/all farm assets. Cash flow deficit: Net cash farm income - family living expenses-principal payments - taxes-average annual investment in the simulation period. Bounds: Red: Cash flow below 80 percent of the cash needs; Green: Cash flow 20 percent above the cash needs; Yellow: Cash flow 80-120 percent of cash needs. Economic success: For the dairy enterprise, the return to labour has been divided by the wage level in the area. If this variable is above 1 the farm covers full economic costs and generates an entrepreneur profit. Bounds: Red: Variable < 0.80. Green: Variable > 1.20. Yellow: Variable between 0.8 and 1.2.
Example for interpretation of stoplight charts: Green = Chance of having no cash flow difficulties. Red = Chance of having cash flow difficulties. Yellow = Moderate cash flow situation.
This study was conducted by T. Hemme, A. Saha and K. Mahmood of the IFCN Dairy Research Center, J. Richardson of the Texas A&M University, E. Kaczocha of the University of Szczecin, Poland, and N. Shadbolt of Massey University, Palmerston North, New Zealand. It was published as ‘What is a dairy farm facing high risk?’ in the IFCN Dairy Report 2004.

© IFCN 2008 151
-10 % 0 % 10 % 20 % 30 %-5 % 5 % 15 % 25 %
US-1710 PL-20DE-80
Legend:
minmeanmax
-5 % 0 % 5 % 10 % 15 % 20 % 25 % 30 %
IN-22 PK-10NZ-246
Return on investment (nominal) for the dairy enterprise
Stoplight charts: Cash flow situation and economic success
0 %
10 %
20 %
30 %
40 %
50 %
60 %
70 %
80 %
90 %
100 %
PK-10IN-22NZ-246PL-20US-1710DE-80
20 % 92 % 100 % 44 %
80 %
8 %
8 %
48 %
100 % 100 %
0 %
10 %
20 %
30 %
40 %
50 %
60 %
70 %
80 %
90 %
100 %
PK-10IN-22NZ-246PL-20US-1710DE-80
100 % 36 % 23 % 59 %
48 % 77 % 14 %
16 % 27 %
100 % 100 %
Variability in milk prices and return on investment
Milk prices: Box plot chart
Probability of a positive cash flow for the whole farm Probability of ‘economic success’ of the dairy enterprise
Milk prices : Box plot chart
10
15
20
25
30
35
PL-20US-1710DE-8010
15
20
25
30
35
IN-22PK-10NZ-246
max
mean
min
50 % box
Return on investment (nominal) for the dairy enterprise
Return on investment Return on investment
Prob
abili
ty
Prob
abili
ty
Red= low, Yellow= moderate, Green= highRed= low, Yellow= moderate, Green= high
US$
/ kg
ECM
US$
/ kg
ECM
5.16 Assessing risks faced by dairy farms

152 © IFCN 2008
Thirty-eight of the 45 interventions increase the return to labour to US$0.12/hour, which is higher than the local wage. In the case of the Fbank (fodder bank) intervention the predicted increase approaches nearly 250 percent. If one considers that women and children are the ones doing the work of dairy farming, this means that these family members would end up with a higher return to labour than that of the household head who works as an agricultural labourer in the area.
In general, the feeding interventions have the highest impact in terms of reducing the risk of achieving a lower return to labour than in the baseline situation. Purchasing livestock insurance for local buffaloes, stall-feeding local buffaloes and joining the local cooperative (which leads to receiving lower milk prices) clearly increases the risk of not even achieving MN-3’s current return to labour.
Risk after combining interventions
Even better results can be achieved by a combination of the dairy development interventions analysed. Improving management and genetic potential can decrease the risk of falling below US$ 0.05/man-hour from 45 percent to practically nil (1 to 2 percent). At the same time, the probability of reaching a return to labour equal to the regional wage level can rise from 0 percent to as much as 84 percent. Hence, the existing and potential interventions can be combined into a programme in such a way that the predominant farm type (MN-3) not only makes attractive profits but also significantly improves its risk profile.
Conclusions
This study clearly shows dairy development interventions can be combined and implemented in a way that significantly increases the dairy farm returns to labour while at the same time improving the risk profile of the same farm type. Both achievements (higher return to labour and reduced farm risks) would certainly drive dairy development forward, particularly in Mahboobnagar (Andhra Pradesh) in India.
Risk is a vital consideration for ranking dairy development programmes. It is possible to implement programmes that both have a significant effect on dairy development and reduce the risk in small-scale dairy farming.
Explanation of variablesFor abbreviations of the 45 dairy development programmes, see Section 5.2 ‘Impact analysis of dairy development programmes in Andhra Pradesh, India’MN-3: a farm with three local buffaloes; Top-MN3: a well-managed, three-buffalo farm; 3-Grade: a well-managed, farm three- grade buffaloes 3-Murrah: a well-managed farm with three-Murrah buffaloes, and so for the five- and ten-Murrah farms. Man hour equivalent: Refers to a standard work hour for an adult man. Labour from other family members was converted into this unit.
This study was conducted by O. Garcia, A. Saha, K. Mahmood and T. Hemme of the IFCN Dairy Research Center and published as ‘Consideration of farm risk and uncertainty in dairy development’ in the IFCN Dairy Report 2006.
Introduction
As a result of increased volatility, it is essential to consider the risks involved when deciding on the best policy alternatives for dairy farms. This means that the analysis should not only consider a static situation but should also incorporate dynamic aspects. The aim of the present study was to incorporate risk and uncertainties in the ranking of dairy development programmes.
Methodology
This study builds on the process of formulating a dairy development strategy for Andhra Pradesh, India (See Sections 5.2 and 5.14). Once the current economics of the target farm type (MN-3) were assessed, a panel of local experts (farmers, extension agents, NGO and government officers, etc.) listed all the major dairy development interventions and activities in the area which might be suitable for the farm in question. The panel then discussed the qualitative and quantitative implications of participation of the selected farm type in each one of the listed initiatives. More than 45 initiatives / programmes were analysed. Finally, the panel reviewed its results and made modifications were it deemed appropriate. ‘Return to labour’ was chosen as the key variable for assessing the impact of the potential dairy development programmes.
Baseline risk
Applying its current dairy production practices the farming family has a 55 percent probability of making a dairy labour return of US$0.05/man-hour or more. Conversely, the family has a 45 percent probability of obtaining a return to labour below this figure.
Risk after single interventions
Most of the dairy interventions analysed reduce the probability of MN-3 making a return to labour below the baseline situation, from 45 percent to a low 10 percent. However, seven interventions increase the probability of MN-3 achieving a lower level of return to labour. It is also interesting to note that approximately five interventions increase the probability of MN-3’s return to labour surpassing the regional wage level by up to 30 percent.
5.17 Incorporating risk in dairy development strategy formulation
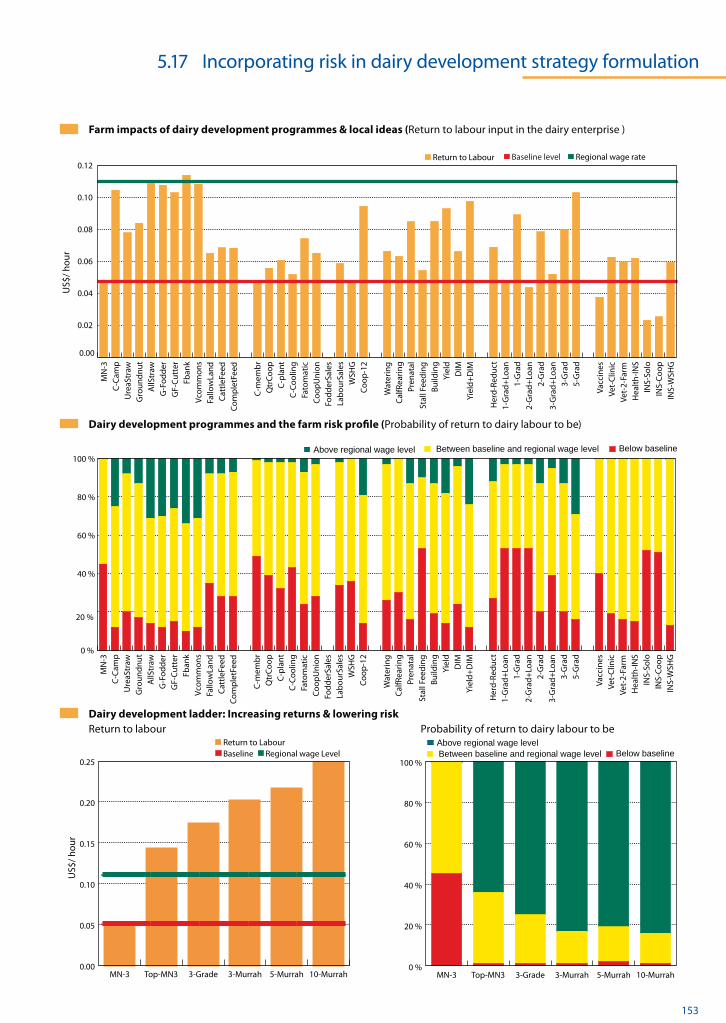
© IFCN 2008 153
0 %
20 %
40 %
60 %
80 %
100 %Above regional wage level Between baseline and regional wage level Below baseline
INS-
WSH
GIN
S-C
oo
pIN
S-So
loH
ealt
h-I
NS
Vet-
2-Fa
rmVe
t-C
linic
Vacc
ines
5-G
rad
3-G
rad
3-G
rad
+Lo
an2-
Gra
d2-
Gra
d+
Loan
1-G
rad
1-G
rad
+Lo
anH
erd
-Red
uct
Yiel
d+
DIM
DIM
Yiel
dB
uild
ing
Stal
l Fee
din
gPr
enat
alC
alfR
eari
ng
Wat
erin
g
Co
op
-12
WSH
GLa
bo
urS
ales
Fod
der
Sale
sC
oo
pU
nio
nFa
tom
atic
C-C
oo
ling
C-p
lan
tQ
trC
oo
pC
-mem
br
Co
mp
letF
eed
Cat
tleF
eed
Fallo
wLa
nd
Vco
mm
on
sFb
ank
GF-
Cu
tter
G-F
od
der
AllS
traw
Gro
un
dn
ut
Ure
aStr
awC
-Cam
pM
N-3
0 %
20 %
40 %
60 %
80 %
100 %
10-Murrah5-Murrah3-Murrah3-GradeTop-MN3MN-3
Above regional wage levelBetween baseline and regional wage level Below baseline
0.00
0.02
0.04
0.06
0.08
0.10
0.12 Baseline level Return to Labour Regional wage rate
INS-
WSH
GIN
S-C
oo
pIN
S-So
loH
ealt
h-I
NS
Vet-
2-Fa
rmVe
t-C
linic
Vacc
ines
5-G
rad
3-G
rad
3-G
rad
+Lo
an2-
Gra
d2-
Gra
d+
Loan
1-G
rad
1-G
rad
+Lo
anH
erd
-Red
uct
Yiel
d+
DIM
DIM
Yiel
dB
uild
ing
Stal
l Fee
din
gPr
enat
alC
alfR
eari
ng
Wat
erin
g
Co
op
-12
WSH
GLa
bo
urS
ales
Fod
der
Sale
sC
oo
pU
nio
nFa
tom
atic
C-C
oo
ling
C-p
lan
tQ
trC
oo
pC
-mem
br
Co
mp
letF
eed
Cat
tleF
eed
Fallo
wLa
nd
Vco
mm
on
sFb
ank
GF-
Cu
tter
G-F
od
der
AllS
traw
Gro
un
dn
ut
Ure
aStr
awC
-Cam
pM
N-3
Farm impacts of dairy development programmes & local ideas (Return to labour input in the dairy enterprise )
US$
/ hou
r
US$
/ hou
r
Dairy development ladder: Increasing returns & lowering risk Return to labour Probability of return to dairy labour to be
Dairy development programmes and the farm risk profile (Probability of return to dairy labour to be)
0.00
0.05
0.10
0.15
0.20
0.25
10-Murrah5-Murrah3-Murrah3-GradeTop-MN3MN-3
BaselineReturn to Labour
Regional wage Level
5.17 Incorporating risk in dairy development strategy formulation

154 © IFCN 2008
5.18 Carbon footprints of dairy farming systems
Carbon footprints of dairy farming systems
In the chart, the emissions per 100 kg of milk from the typical 80-cow farm in Germany are taken as point of reference (= 100). Half of the farm types analysed had carbon footprints of +/- 20 percentage points with respect to the reference farm. The low-yield farming systems in Africa and South Asia showed the highest carbon footprints per 100 kg of milk, while high-yield farming systems showed significantly lower emissions.
Emission by types of gases
The most important gas was methane (CH4), which contributed 50 to 70 percent of the greenhouse gas emissions calculated as CO2 equivalents. The emissions from N2O and CO2 together accounted for 30 to 50 percent of total emissions. The amounts of N2O and CO2 varied, depending on emissions from manure handling and on the amount of purchased feed, fertilizer and energy use.
Emission by activities
The main source of GHG emissions was the digestion in the rumen, which accounted for about 50 to 70 percent of the total. Therefore the key determinant of the carbon footprints of dairy systems is milk production by body weight, i.e. the higher the milk production per kg bodyweight (weight productivity), the lower the carbon footprints. Therefore, low-yield dairy farming systems have more emissions per kg of milk than high-yield systems. Depending on the farming system, the next-ranked sources of GHG emission were manure handling and storage at 10 to 20 percent, the volume of purchased feed at 5 to 10 percent, and fertilizer use at up to 10 percent. The use of energy in the form of electricity and fuel accounted for only 5 to 10 percent of GHGs.
Conclusion
This study represents a first attempt to estimate the carbon footprints of dairy farming systems on the basis of IFCN’s farm data. The strength of the approach does not lie in producing exact carbon footprints, but in providing a range in which the footprints could fall. The results show significant differences among farm types and indicate that ‘weight productivity’ is the key determinant.
Explanation of variablesSources: IPCC (2007), FAO (2006) ,Kirchgeßner et al (1992)’. Sector estimate based on IPCC: Greenhouse gases agriculture = 13.5 percent, all cattle = 7 percent, share of dairy cattle in total cattle population = 35 percent (calculation based on FAO cattle numbers), -> dairy cattle contribute 2.5 percent of greenhouse gases. Carbon footprints from deforestation not included for dairy farming. Sector estimate based on FAO: Greenhouse gases livestock = 18 percent, approximately 6 percent points arise from deforestation, which means the residual is 12 percent. Assuming, similar to the IPCC, that cattle contribute 52 percent and dairy cattle account for 35 percent of the total cattle population means that dairy cattle contribute 2.2 percent of all global greenhouse gas emissions. Coefficients of CO2 equivalents: 1 kg CO2 = 1 kg CO2 ; 1 kg CH4 = 23 kg CO2 ; 1 kg N2O = 296 kg CO2. This study was conducted by H. Bendfeld, M. Hagemann and T. Hemme of the IFCN Dairy Research Center and published as ’Carbon footprints of dairy farming systems in 38 countries’ in the IFCN Dairy Report 2008.
Introduction
As climate change has gained in prominence in the international debate environmental sustainability and greenhouse gas (GHG) emissions of dairy farming systems are becoming increasingly important aspects of dairy production, even for small-scale systems. Measurement and attribution of GHG emissions is challenging and the aim of the present study was to initiate the development of a methodology to estimate GHG emissions from typical dairy production systems. Because dairy cows are seen as a major contributor of global GHG emissions, an attempt was made to estimate their share in the global total.
Methodology
Estimates of the contribution of dairy farming to global GHG emissions were made based on IPCC and FAO reports. For details, see the explanations below. The estimates of GHG emissions by dairy farming system draws on the IFCN database of typical dairy farms and uses key variables such as number of cows, number of heifers, milk yield, use of fertilizer, electricity, fuel and purchased feed, and live weight of cows. Ratios such as amounts of fuel or of compound feed used per 100 kg of milk were then derived from these figures. Next, emissions of CO2, CH4 and N2O were estimated. For example, the CH4 emission from the rumen was estimated based on the function CH4 (kg) = 55 + 4.5* milk yield per day (kg milk/cow/day) + 1.2 * (metabolic weight) (Kirchgessner et al., 1992). Similarly, gas emissions from manure handling, concentrates, fuel and energy use, fertilizer production, buildings and machinery, etc. were estimated and attributed to the system. This approach thus includes the GHG emissions from purchased feed, heifer raising, and all inputs used.Moreover the analysis has considered the output of beef and livestock from the dairy farm as credits. GHGs from (long-distance) transport of concentrates, replacement heifers reared on other farms were not considered in this analysis. Finally, the emissions of the different gases were converted into CO2 equivalents by using the coefficients shown below. Forty-six typical dairy farms in 38 countries were included in for the analysis.
Global carbon footprint of milk production
The two simple calculations of global share of GHG emissions from dairy farming, based on IPCC and FAO data indicate that dairy cows contribute between 2.2 and 2.5 percent of all global GHG emissions. It should be noted that these figures are based on very simple calculations and do not attribute deforestation to dairy farming

© IFCN 2008 155
Digestion Manure Fertilizer Energy Purchase feed Others
range +/- 20%
Global sources of carbon emissions Global sources of carbon emissions
Emission by activities Emission by gases ‘Weight productivity’
5.18 Carbon footprints of dairy farming systems
Source: IPCC Report 2007. Source: Estimates IFCN 2008.
Carbon footprints of 46 typical dairy farms from 38 countries

India
Morocco
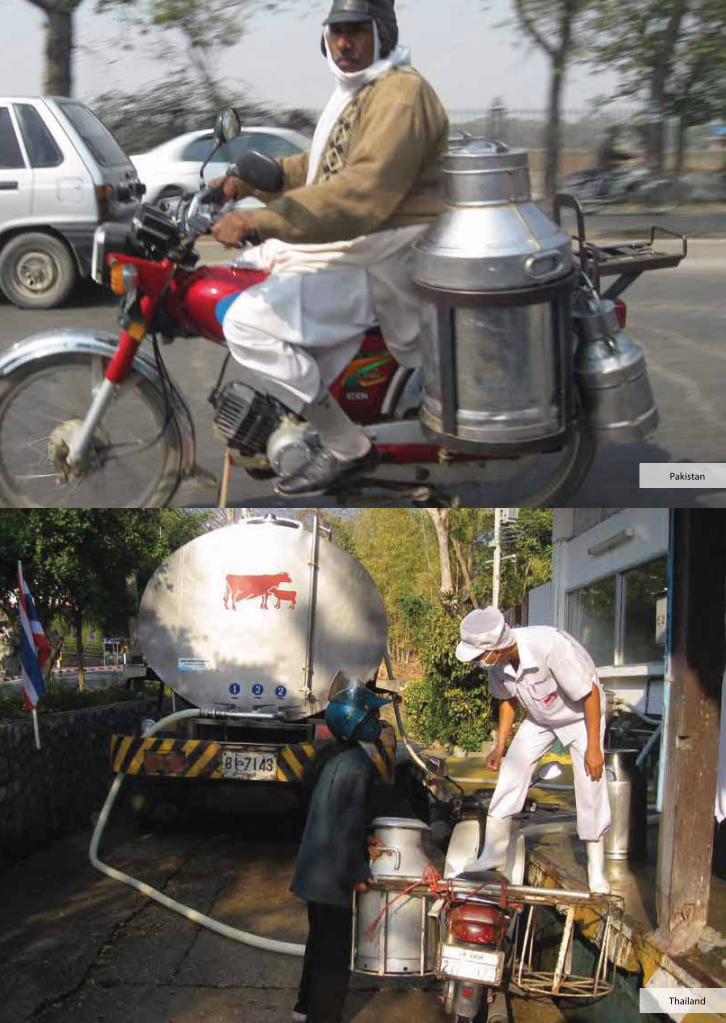
Pakistan
Thailand

China