Embed Size (px)
Citation preview
116
CHAPTER 5ENHANCING EXPORT SHARE OF INDIAN SHRIMPS/PRAWNS
THROUGH BRANDING APPROACH
5.1 Introduction
This chapter deals with the effect of branding on exporting Indian shrimps/prawns
in the international market. In the first step the impact of branding strategies on
the market share enhancement, creating awareness and providing sustainability
to the product (shrimps/prawns) in the international market is analyzed through
some international case studies. In the second step, the competitiveness of
Indian shrimps/prawns has been analyzed through the SWOT analyzes.
For the related hypothesis testing, data analysis of construct validity and use of
statistical techniques for analysis of data collected through questionnaire were
highlighted. An action research model was adopted to enhance awareness and
visibility of Indian marine shrimps/prawns (HS Code 030613) for boot customers
and end consumers. It will at one level help expand the market and stop decline
in shrimps/prawns demand and at another level establish desired premium and
unique and exotic image for the Indian products. This will enable Indian exporters
an advantage over competition, which cannot be easily undermined only by price
differential. The challenge of low unit value realization (UVR) can also be
resolved through establishment and promotion of a strong and unique brand.

117
The Kapferer brand identity prism modeled is used to suggest, to create
awareness for the brand. The factors, which are depending on the real term is
accessing through regression analysis.
5.2 Case Studies
The key challenges for Indian exporters in present and for future to export
shrimps/prawns is declining exporting; threat from lower price white prawns;
threat from cultured shrimps/prawns and low UVR compared to processed
shrimps/prawns. In order to overcome these challenges, it is important to
consider branding as a strategic imperative. Few case studies have given, on the
basis of how branding is a solution for the above given challenges.
5.2.1 Case Study -1
Brand Name: “ShiMo” and “Tokaii”
Country: Bangladesh
ShiMo Global Group, LLC (D/B/A: Brothers’ Exports & Imports, Bangladesh) is a
harvester, producer, processor, supplier, and exporter of frozen shrimp (mainly
Black Tiger and fresh water shrimps and other deep sea water fishes and
seafood). They export their shrimp and seafood under brand name is “ShiMo”
and “Tokaii”. ShiMo Global does not “spot sale” any shrimp or seafood to anyone
in order to maintain its brand standard and its commitment to the existing buying
partners. They also provide the company brand name to their clients on the
imported shrimp and seafood from their company, depending on the size of the

118
order, longevity of the relationship with them. As a value added service they also
offer “private branding” of their shrimp and seafood for valued clients, for which
there may be an additional charge.
Shimo ensures that, their handed products rate high on customer tastes for
freshness and quality i.e. smell of the prawn and shell near the tail is intact firm
and close to the body of the prawn.
5.2.2 Case Study -2
Brand Name: “Silver Sea”
Country: Madagascar
The Malagasy authorities have long term strategies both in capture and culture
shrimp and focus on high-quality products and sustainability. With regard to
economic development in the seafood sector, Malagasy authorities, such as the
Ministry of Agriculture And Fishing, define strategies and set conditions for the
trade. They are giving first priority to create the local brand and try to competing
with other global brands (McDowell Group, 2006).
5.2.3 Case Study -3
Brand Logo: “Q”
Country: Thailand
The Thailand government has specific policies related to seafood trade. The
broad policy is to maintain Thailand as one of the important fish producing and
exporting country. Mainly through aquaculture and expansion of high sea and

119
deep sea fisheries that will improve fish supplies for the domestic market and for
exports. Improve competitiveness they develop an integrated policy and
programme involving various agencies to ensure the safety of food products
(including seafood) both for products consumed locally and for export. Also
Ministry of Agriculture and Cooperatives (MOA) promotes "Q" logo for food
products, including seafood, which have passed quality and food safety
certification in order to achieve the national goal to establish Thailand as "Kitchen
of the World". The “Q” logo serves the role of an endorser. Quality control and
value added strategy has also started for cultured shrimp whereby the
government promotes Code of Conduct (COC) and Good Aquaculture Practices
(GAP) labeling, the former has a higher standard, thus fetches higher price in the
market. DOF has established cooperation with Carrefour supermarket group to
promote this programme.
Table 5.1: Global Brands for Shrimps/PrawnsCountry Name Company Name Brand Name
Thailand Govt. endorsed brand “Q”
Madagascar Govt. endorsed brand “Silver Sea”Bangladesh ShiMo Global Group ShiMo” and “TokaiiVietnam Vietdelta Industrial Co., Ltd VietdeltaChina Dragonbull Co.,Ltd DragonbullJapan Good Fortune Cold Storage ( GFC ) Pmp & Lotus (Popular)Panda Brand,
Lucky 11 Brand & Lucky 7 Brand
Singapore Gold Coin Services Pte., Ltd. Gold CoinBio-Feed Industries Pte., Ltd. Bio-FeedSin Heng Chan (S) Pte., Ltd. Red CircleVirginia Industries Pte., Ltd. Virginia
Indonesia - Your NameNikita, Azzurra & Amanda (BuyersBrand)
Australia Beyond Harvest Crimson Tiger Prawns™

120
5.3 SWOT Analysis on Indian Shrimps/Prawns
Indian shrimps/prawns are having some many strengths and opportunities, as it
is organic in quality. Like wise it has also some weakness and threats, given in
details in Table 5.2. The main threat is high competition in the global market and
launching of Vannamei prawn (white prawn) by Vietnam.
Table 5.2 SWOT Analysis: Economic Viability of the Indian Shrimps/prawns
STRENGTHS WEAKNESSES OPPORTUNITIES THREATSAbandonment naturalsupply
Low production costs
Unpredictableproduction output dueto climatic influence
Low financial supportform govt.
Internal competitionis very high.
Local markets as wellas global market
High competition in globalmarket
The other countries are alsostart to culture and supplying ina low cost.
Vietnam launched a low costcultured variety (Vannamei)also famous on brand calledVietdelta.
Ongoing research forintensive technology
Very low technicallevel
Lack skilled labour forprocessing
Japan, Vietnam, Thailand,China etc, have skilled laboursas well using advanceprocessing technology
High cost ofmarketing
Increased demand ofmarine shrimps/prawns
Positive environmentalcontribution forcultivating naturally(fishing tactics andpond culture )
Sustainable industryPotential for anenvironment friendlyintensive production
Indian product islargely organic
Investment needed tomeet environmentalstandards (Central &East Europecountries)
Differences innational legislation
Organic certificationnot for highlyintensive systems
Certification cost
Increasingenvironmental concernand growing demandof organic sea food
Indian seafood productsbeginning to face problem ofbacterial contamination.
Good products andbasic processesingquality
Lack of informationand awareness forfarmers on logisticissues.
Promote quality ofcontrolled production

121
STRENGTHS WEAKNESSES OPPORTUNITIES THREATSSafe products
Easy control on safetyof production
Poor HACCPimplementation
Safe product image
HACCP can furtherimprove consumers’confidence
Lack of information on HACCP(small businesses)
USA has banned the Indiashrimp product due to hygienestandards are very low
Consumer confusionand lack of knowledgeabout speciesidentification
Lack of concentrationof the offer
Poor organization ofthe producers
Low fish consumptionin Central & EastEurope countries . Sothere is a potential forgrowth
Cheap imports of processedand branded product fromoverseas
Failure in thecommunicationstrategy anddifferentiation organiccapture from culturedprawn
Legal clarification anddistinction between aquaculture(inorganic) and capturefisheries (organic) andcertification for organic product
Enlargement of productvariety
Loss of existing markets like USand Stagnation in unit value
5.4 Customer Analysis
An open ended questionnaire constructed for the exporters, besides the
quantitative questionnaire after the intensive literature review. The responses of
exporters from the open ended questionnaire were contributing to get the
knowledge about the customer’s demand (the detailed methodology has given in
chapter-3), which is given below in different sub headings from 5.4.1 to 5.4.2.
5.4.1 Consumers Preference
The Indian marine shrimps/prawns are primarily targeted at top hotels and
restaurants and also the sophisticated people who want to and are afford to buy
this product. The main customers for the Indian exporters are the wholesaler who

122
further supply to hotels/restaurants and/or retailers. According to Indian
exporters, the customers are basically looking for the certified product (the
information has collected through an organized questionnaire, given in Appendix
VII). Sometimes they check colour as an indication of freshness of the product.
EU, Japan, China, USA, Singapore etc. are leading importers, given in Table-5.3.
Most importers are wholesalers. The Indian industries having a good reputation
in the world market due to their quality and high reorganization of company brand
name.
According to the exporter’s survey all countries consider organic shrimps/ prawns
are more preferred. This could be an advantage for India, as maximum export
from India are basically captured or semi-intensive cultured shrimps/prawns.
Table 5.3: Demand for Quality by the ImporterTotalExporters
Import Countries MajorClients
AttributesLooking for
Consumer’sexpectation
Consumer’sSatisfaction
101 EU, Japan, China,
USA,UAE, Australia,
S. Africa, Vietnam &
Malaysia
Whole
sellers
Certificate,
colour, size,
freshness and
SPS
Organic
Species and
Certified
Very Good
5.4.2 Consumers Knowledge
Consumers are generally not capable of differentiating different varieties of
prawns (white, brown, or tiger) or growth conditions (wild or farm raised). While
consumers identified flavor as the dominant factor influencing their consumption
of shrimps/prawns, differences in overall acceptance ratings also reflected
influences in the areas of aroma, appearance, and color acceptance. A majority

123
of consumers could differentiate fresh from frozen but could not differentiate
different shrimps/prawns varieties. Although 50% of the consumers would buy
both "Certified" shrimps/prawns and locally caught prawn, most were willing to
pay more for the former item but not for the latter. Frequency of consumption and
ability to differentiate shrimp samples were contributing factors to their
willingness to pay more for a shrimps/prawns product. Chemical safety, more so
than microbiological safety, was a concern to consumers.
5.5 Role of Branding in Exporting Indian Shrimps/Prawns
The above given case studies were used to capture the reality of the role of
branding in exporting of the shrimps/prawns. On that basis the constructed
questionnaire were analyzed to get the proper correlation of the macro and micro
variables with brand image and product selling under the brand name. Similarly
the impact of brand image and branding in different macro and micro variables
were analyzed through regression method.
5.5.1. Branding Approach to Reduce Domestic Market Competition
Univariate Statistical Analysis: Branding Approach
The univariate statistical analysis on micro variables for the branding approach
has provided in Table 5.4. The mean and median values have very little
difference between each other. In the case of micro variable competition in
domestic market, standard variable is very low. A low value of standard deviation
of micro variables indicated that the executive’s opinions were consistent and
can be relied upon.

124
Table 5.4: Univariate Statistical Analysis of Micro Variables for BrandingApproach
Mean S. E of Mean Median S.D Variance Minimum MaximumBranding 2.38 0.13 2 1.31 1.72 1 5Erratic-demand 3.20 0.13 3 1.32 1.74 1 5
Competitionin domestic
market4.80 0.06 5 0.57 0.32 1 5
Low exportprice 3.77 0.15 4 1.48 2.18 1 5
PriceFluctuation 3.77 0.16 5 1.57 2.46 1 5
Correlation Analysis of Micro Variables: Reduce Competition in DomesticMarket
The five micro variables, Viz, erratic demand, competition in domestic market,
low export price, price fluctuation and lack of knowledge, were correlated using
the Pearson correlation two-tailed test for the total sample of (N=101) exporters
covering a major part of the frozen shrimps/prawns exporting. The results of the
correlation analysis are presented in Table 5.5. The above table shows there is a
significant positive relationship, at 99 percent confidence level, between the
variables, erratic demand (.327**) and branding; Lack of knowledge (.241*) and
branding. Similarly price fluctuation is highly significantly related to low export
price (0.730**) and significant correlated to lack of knowledge (.348**) and with
erratic demand (.336**). Low export price also significantly related to lack of
knowledge. From this analysis it shows that the low export price, price fluctuation
an erratic demand basically due to lack of knowledge. Similarly branding can be
a solution for the erratic demand.
Table 5.5 Correlation between Pricing and Competitiveness with Branding

125
Correlations
brandingErratic
demand CompetitionLow
Export pricePrice
FluctuationLack of
knowledgebranding 1Erratic-demand .327** 1
Competition .101 .107 1LowExport price .148 .306** -.090 1
Price-Fluctuation .149 .336** -.006 .730** 1
Lack ofknowledge .241* .376** .029 .296** .348** 1
**Correlation is significant at the 0.01 level (2-tailed).*Correlation is significant at the 0.05 level (2-tailed).
Regression Analysis of Micro Variables: Reduce Competition in DomesticMarket
Hypothesis of association were tested and validated through the statistical
technique of multivariate analysis, i.e. regression analysis. This is one of the way
to testing the role and impact of branding for exporting Indian frozen
shrimps/prawns in international market. While testing the models, the correlation
between the micro variables was run to verify the significance. Then the micro
variable, which is depend upon the macro variables, branding were consider for
regression. In this cases, there was only one variable, branding under
consideration for regression. For that the analysis was done through the enter
method of regression. The detail of analysis has given in Appendix XI.
Erratic-demand as Dependent Variable
126
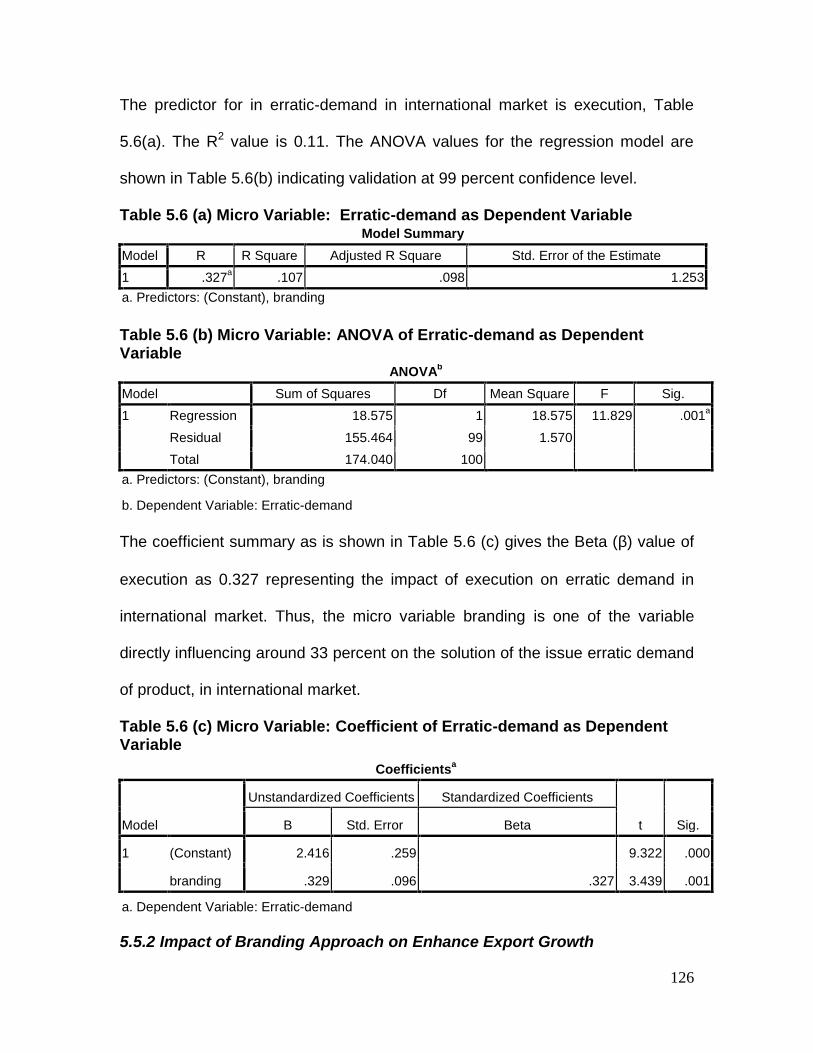
The predictor for in erratic-demand in international market is execution, Table
5.6(a). The R2 value is 0.11. The ANOVA values for the regression model are
shown in Table 5.6(b) indicating validation at 99 percent confidence level.
Table 5.6 (a) Micro Variable: Erratic-demand as Dependent VariableModel Summary
Model R R Square Adjusted R Square Std. Error of the Estimate1 .327a .107 .098 1.253a. Predictors: (Constant), branding
Table 5.6 (b) Micro Variable: ANOVA of Erratic-demand as DependentVariable
ANOVAb
Model Sum of Squares Df Mean Square F Sig.1 Regression 18.575 1 18.575 11.829 .001a
Residual 155.464 99 1.570Total 174.040 100
a. Predictors: (Constant), branding
b. Dependent Variable: Erratic-demand
The coefficient summary as is shown in Table 5.6 (c) gives the Beta () value of
execution as 0.327 representing the impact of execution on erratic demand in
international market. Thus, the micro variable branding is one of the variable
directly influencing around 33 percent on the solution of the issue erratic demand
of product, in international market.
Table 5.6 (c) Micro Variable: Coefficient of Erratic-demand as DependentVariable
Coefficientsa
Model
Unstandardized Coefficients Standardized Coefficients
t Sig.B Std. Error Beta
1 (Constant) 2.416 .259 9.322 .000
branding .329 .096 .327 3.439 .001
a. Dependent Variable: Erratic-demand
5.5.2 Impact of Branding Approach on Enhance Export Growth

127
The univariate statistical analysis on macro variables for the branding approach
has given in Table 5.7.
Table 5.7: Univariate Statistical Analysis of Variables
MeanS. E.Mean Median Mode S.D. Variance Minimum Maximum
Turnover 2.32 0.13 2 2 1.32 1.74 1 5Brand Name 0.28 0.04 0 0 0.45 0.20 0 1
Public relation0.95 0.02 1 1 0.21 0.04 0 1
A & P 0.71 0.07 1 1 0.67 0.45 0 2Total Export
country 4.13 0.20 4 4 1.99 3.95 1 10
Years Exporting 2.87 0.15 3 4 1.49 2.23 1 5threat by Cheap-
prawn 3.65 0.18 5 5 1.80 3.23 1 5
FDI-inflow 4.86 0.04 5 5 0.37 0.14 3 5Product
prominancy 3.70 0.07 4 3 0.70 0.49 3 5
Rejection ofConsignment 1.35 0.09 1 1 0.88 0.77 1 5
Competitivenessin domestic
market4.00 0.07 4 3.5 0.74 0.56 2 5
Price Constrains3.49 0.11 3.75 4 1.10 1.21 1 5
Product Statusin Market 4.03 0.08 4 3 0.79 0.62 2.5 5
There is very less difference between the mean and median values. In the case
of macro variable, public relation, promotional activity, competitiveness in
domestic market, product status in market, import barrier, safety standards and
NTB standard deviation is very low. A low value of standard deviation of micro
variables indicated that the executive’s opinions were consistent and can be
relied upon. The standard deviation for turnover, total number of exporting
country exported by the particular firm, years in the exporting business are not
128
the part of opinion survey but these are the status of the firms. So in this case the
standard deviation values are not valid.
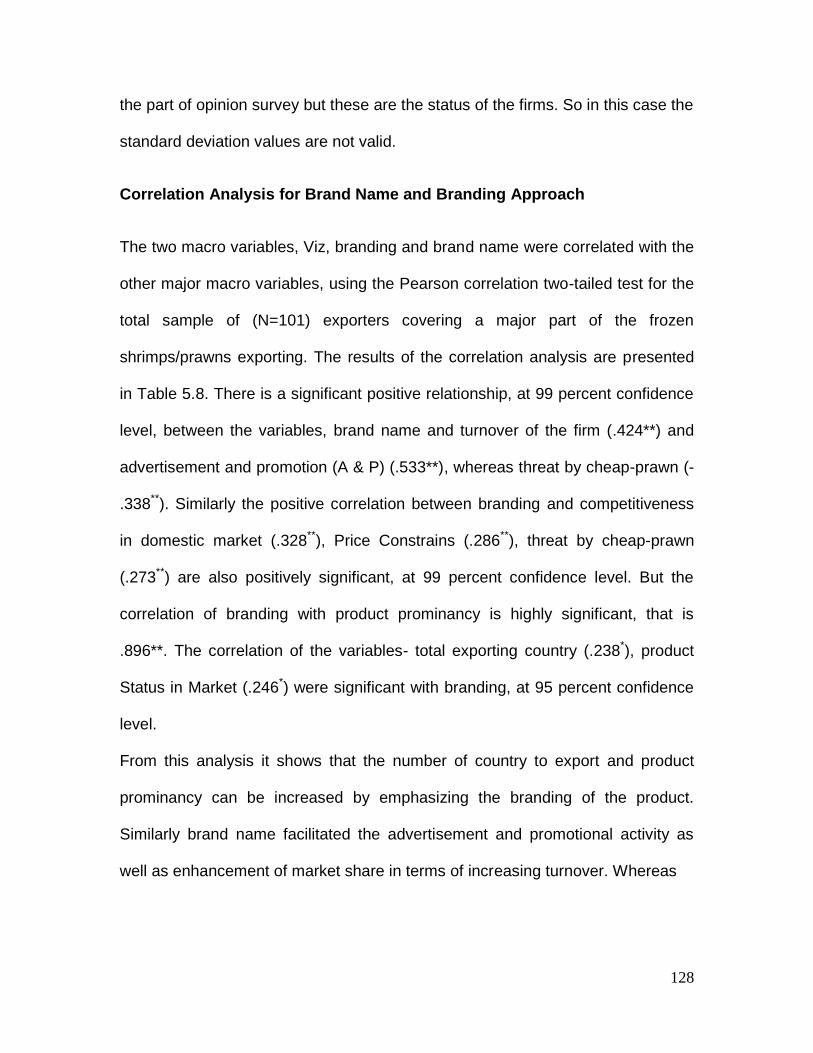
Correlation Analysis for Brand Name and Branding Approach
The two macro variables, Viz, branding and brand name were correlated with the
other major macro variables, using the Pearson correlation two-tailed test for the
total sample of (N=101) exporters covering a major part of the frozen
shrimps/prawns exporting. The results of the correlation analysis are presented
in Table 5.8. There is a significant positive relationship, at 99 percent confidence
level, between the variables, brand name and turnover of the firm (.424**) and
advertisement and promotion (A & P) (.533**), whereas threat by cheap-prawn (-
.338**). Similarly the positive correlation between branding and competitiveness
in domestic market (.328**), Price Constrains (.286**), threat by cheap-prawn
(.273**) are also positively significant, at 99 percent confidence level. But the
correlation of branding with product prominancy is highly significant, that is
.896**. The correlation of the variables- total exporting country (.238*), product
Status in Market (.246*) were significant with branding, at 95 percent confidence
level.
From this analysis it shows that the number of country to export and product
prominancy can be increased by emphasizing the branding of the product.
Similarly brand name facilitated the advertisement and promotional activity as
well as enhancement of market share in terms of increasing turnover. Whereas

129
Table 5.8: Correlation of Macro Variables with Brand Name and Branding Approach (N=101)
BrandName branding Turnover
TotalExportingcountry
Years inExporting A & p
Publicrelation
FDIInflow
Productprominanc
y
Competitivenessin domestic
marketPrice
ConstraintProduct Status
in Marketthreat by
Cheap-prawn
Rejection ofConsignmen
tBrand Name 1branding .025 1Turnover .424** -.180 1TotalExportingcountry
.139 .238* .148 1
Years inExporting -.170 -.251* -.355** -.075 1
A & P .533** .056 .490** .427** -.238* 1Publicrelation .148 -.090 .192 .193 -.042 .233* 1
FDI-inflow -.007 .066 .029 -.177 .039 -.081 -.089 1Productprominancy -.022 .896** -.146 .272** -.171 .072 -.056 .108 1
Competitiveness indomesticmarket
-.030 .328** -.132 -.024 -.112 .030 -.162 -.125 .316** 1
PriceConstrains -.066 .286** -.233* .045 -.140 -.047 -.144 -.118 .266** .584** 1
ProductStatus inMarket
-.009 .246* .053 .148 -.256** .102 -.062 -.020 .234* .367** .683** 1
threat byCheap-prawn
-.338** .273** -.367** -.060 -.088 -.267** .007 .091 .338** .213* .293** .223* 1
Rejection ofConsignment
-.043 .155 -.156 -.043 -.027 -.187 -.180 .148 .186 .168 .106 .101 .140 1
**. Correlation is significant at the 0.01 level (2-tailed).*Correlation is significant at the 0.05 level (2-tailed).
130
issues like, Competitiveness in domestic market, Price Constrains, threat by
cheap-prawn and problem with product status in market can be solved, if the
exporters try to establish the product (Indian marine shrimps/prawns) through
branding.
Regression Analysis for Branding Approach
Hypothesis of association were tested and validated through the statistical
technique of multivariate analysis, i.e. regression analysis. This is one of the way
to testing the role of branding to create an effective international marketing
strategy for exporting Indian frozen shrimps/prawns (HS Code 030613) product.
To know the impact of branding on the macro variables and to testing the
hypothesis, the regression analysis has run. In this cases, there was only two
variable, branding and brand name under consideration for regression. For that
the analysis was done through the enter method of regression.
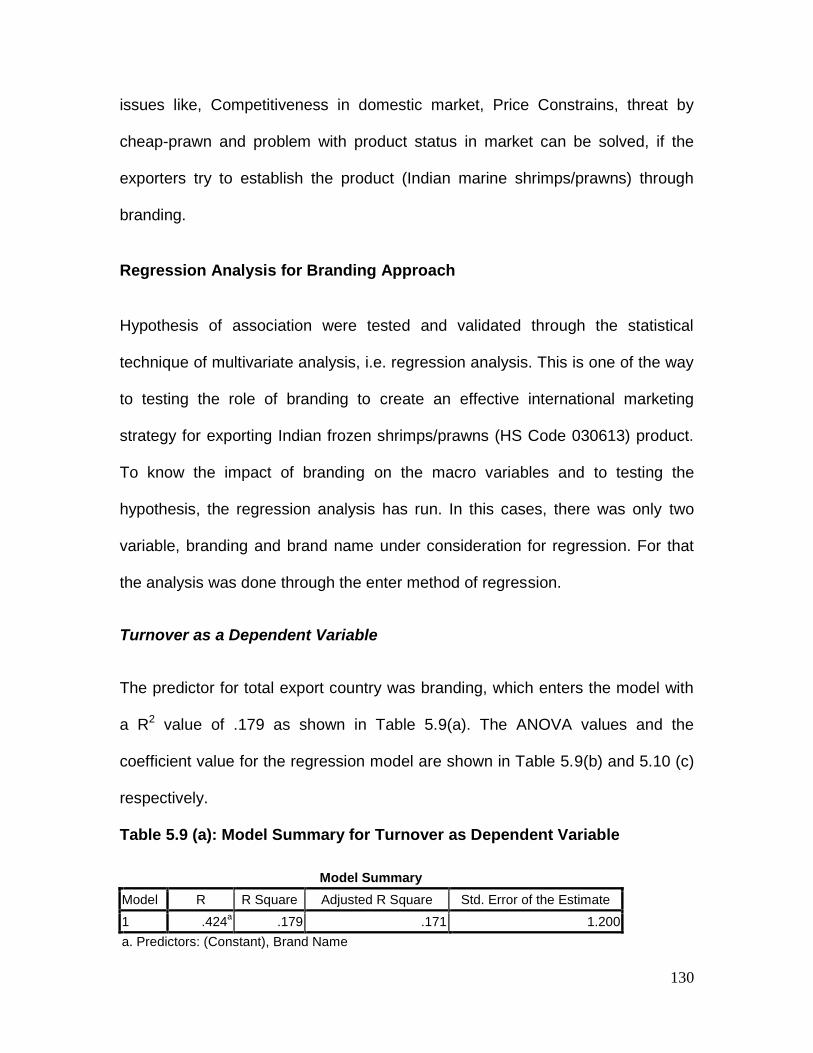
Turnover as a Dependent Variable
The predictor for total export country was branding, which enters the model with
a R2 value of .179 as shown in Table 5.9(a). The ANOVA values and the
coefficient value for the regression model are shown in Table 5.9(b) and 5.10 (c)
respectively.
Table 5.9 (a): Model Summary for Turnover as Dependent Variable
Model SummaryModel R R Square Adjusted R Square Std. Error of the Estimate
1 .424a .179 .171 1.200a. Predictors: (Constant), Brand Name

131
Table 5.9 (b): ANNOVA for Turnover as Dependent Variable
ANOVAb
ModelSum of
Squares df Mean Square F Sig.1 Regression 31.202 1 31.202 21.653 .000a
Residual 142.659 99 1.441Total 173.861 100
a. Predictors: (Constant), Brand Nameb. Dependent Variable: Turnover
Table 5.9 (c): Coefficients for Turnover as Dependent Variable
Coefficientsa
Model
Unstandardized CoefficientsStandardizedCoefficients
t Sig.B Std. Error Beta1 (Constant) 1.973 .140 14.040 .000
Brand Name 1.242 .267 .424 4.653 .000a. Dependent Variable: Turnover m cr
Therefore the regression analysis is predicting, the export turnover can be
enhanced, by exporting the product under Brand Name. The below
mathematical calculation is giving the fair idea about the percentage of export
turnover increased through product exporting under the brand name.
Regression Equation Y (Turn over) = + X1
The percentage of Turnover enhance is = 1.973 +.424 (Brand Name)
The calculation shows through branding the exporters can get extra 42.4 per cent
in term of trade value. Of course some cost must be bear by the exporter to
create a brand identity and maintained the brand value, which is a one time
investment. Whereas out of that investment the exporter can get a establishment
in the global market as well as a higher profit margin for life time.

132
Competitiveness in Domestic Market as a Dependent Variable
The predictor for Competitiveness in Domestic Market was branding, which
enters the model with a R2 value of .107 as shown in Table 5.10(a). The ANOVA
values and the coefficient value for the regression model are shown in Table
5.10(b). The analysis shows branding is key variable which drives the
competitiveness in the domestic market.
Table 5.10 (a): Model Summary for Competitiveness in Domestic Market asDependent Variable
Model SummaryModel R R Square Adjusted R Square Std. Error of the Estimate1 .328a .107 .098 .707a. Predictors: (Constant), branding
Table 5.10 (b): ANOVA for Competitiveness in Domestic Market asDependent Variable
ANOVAb
Model Sum of Squares df Mean Square F Sig.1 Regression 5.964 1 5.964 11.919 .001a
Residual 49.536 99 .500Total 55.500 100
a. Predictors: (Constant), brandingb. Dependent Variable: Competitiveness in domestic market
The coefficient summary as is shown in Table 5.10 (c) gives the Beta () value of
branding is .328. The value of branding is fairly representing of their impact on
the competitiveness in domestic market for this product. Thus branding has
emerged as major influential variable for solve the price constrain problem in
international market.

133
Table 5.10 (c): Coefficient for Competitiveness in Domestic Market as Dependent VariableCoefficientsa
ModelUnstandardized Coefficients Standardized Coefficients
t Sig.B Std. Error Beta
1 (Constant) 3.557 .146 24.311 .000branding .186 .054 .328 3.452 .001
a. Dependent Variable: Competitiveness in domestic market
Price Constrains as Dependent Variable
The first predictor for Price constraint was branding, which enters the model with
a R2 value of .082 as shown in Table 5.11(a). The ANOVA values for the
regression model are shown in Table 5.11(b) indicating validation at 99 percent
confidence level and the coefficient value of the regression model has given in
the Table 5.11 (c).
Table 5.11 (a) Model Summary for Price Constraint as Depend VariableModel Summary
Model R R Square Adjusted R Square Std. Error of the Estimate1 .286a .082 .073 1.060a. Predictors: (Constant), branding
Table 5.11 (b) ANOVA for Price Constraint as Depend VariableANOVAb
Model Sum of Squares df Mean Square F Sig.1 Regression 9.925 1 9.925 8.832 .004a
Residual 111.257 99 1.124Total 121.182 100
a. Predictors: (Constant), brandingb. Dependent Variable: Price Constrains
Table 5.11 (c) Coefficient for Price Constraint as Depend Variable
Coefficientsa
ModelUnstandardized Coefficients Standardized Coefficients
t Sig.B Std. Error Beta
1 (Constant) 2.921 .219 13.322 .000branding .240 .081 .286 2.972 .004
a. Dependent Variable: Price Constrains

134
Product Prominancy as a Dependent Variable
The first predictor for product prominancy was branding, which enters the model
with a R2 value of .803, given in Table 5.12 (a). The ANOVA values for the
regression model are shown in Table 5.12(b) indicating validation at 99 percent
confidence level and coefficients of the variables given in the Table 5.12(c)
shows the impact of branding on product prominancy is around 90 per cent.
The analysis shows the product prominancy highly (90%) dependent on the
branding of the product. That means without branding developing identification
for the product is very difficult.
Table 5.12(a): Model Summary for Product Prominancy as DependableVariable
Model SummaryModel R R Square Adjusted R Square Std. Error of the Estimate
1 .896a .803 .801 .312a. Predictors: (Constant), branding
Table 5.12 (b): ANOVA for Product Prominancy as Dependable Variable
ANOVAb
Model Sum of Squares df Mean Square F Sig.
1 Regression 39.435 1 39.435 404.414 .000a
Residual 9.654 99 .098
Total 49.089 100a. Predictors: (Constant), brandingb. Dependent Variable: Product prominancy
Table 5.12 (c): Coefficients for Product Prominancy as Dependable Variable
Coefficientsa
Model
Unstandardized CoefficientsStandardizedCoefficients
t Sig.B Std. Error Beta1 (Constant) 2.564 .065 39.698 .000
branding .479 .024 .896 20.110 .000a. Dependent Variable: Product prominancy

135
5.5.3 Factors Contributing to Building a Brand
Regression Analysis
The four variables, competitiveness in domestic market, total exporting countries,
threat by cheap-prawn and years in exporting, together explain 50 percent of
variation in branding. The model summary is presented in Table 5.13(a). The
ANOVA (significant at 99 percent) and coefficient has presented in the Table
5.13 (b) and 5.13 (c) respectively. The regression analysis has done in step wise
method, the detail analysis has presented in the Appendix XII.
From the analysis, it is concluded that as branding approach and brand name
effectively establish the product, some variables like competitiveness in domestic
market, total exporting countries, threat by cheap-prawn and years in exporting
are also creating a pressure on the marketer to go for branding of the product.
Due to competitors’ pressure in national/international level the enthusiasm for
product branding within the exporters is developing, that leads to the product
selling under brand name.
Table 5.13 (a): Model Summary for Branding as Depend Variable
Model Summary
Model R R Square Adjusted R Square Std. Error of the Estimate
1 .328a .107 .098 1.2442 .410b .168 .151 1.2073 .466c .217 .193 1.1774 .500d .250 .219 1.158
a. Predictors: (Constant), Competitiveness in domestic marketb. Predictors: (Constant), Competitiveness in domestic market, Total ex countryc. Predictors: (Constant), Competitiveness in domestic market, Total ex country, threat by Cheap-prawnd. Predictors: (Constant), Competitiveness in domestic market, Total ex country, threat by cheap-prawn,Year-Ex

136
Table 5.13 (b): ANOVA for Brand as Dependable Variable
Model Sum of Squares df Mean Square F Sig.1 Regression 18.450 1 18.450 11.919 .001a
Residual 153.253 99 1.548
Total 171.703 1002 Regression 28.858 2 14.429 9.899 .000b
Residual 142.845 98 1.458Total 171.703 100
3 Regression 37.301 3 12.434 8.974 .000c
Residual 134.401 97 1.386Total 171.703 100
4 Regression 42.960 4 10.740 8.008 .000d
Residual 128.743 96 1.341Total 171.703 100
a. Predictors: (Constant), Competitiveness in domestic marketb. Predictors: (Constant), Competitiveness in domestic market, Total Exporting Countryc. Predictors: (Constant), Competitiveness in domestic market, Total Ex Country, threat by Cheap-prawnd. Predictors: (Constant), Competitiveness in domestic market, Total Ex country, threat by Cheap-prawn, Yearin Exportinge. Dependent Variable: brandingTable 5.13 (c): Coefficients for Brand as Dependent Variable
Coefficientsa
Model
UnstandardizedCoefficients
StandardizedCoefficients
t Sig.B Std. Error Beta1 (Constant) .070 .679 .103 .918
Competitiveness in domestic market .577 .167 .328 3.452 .0012 (Constant) -.641 .711 -.902 .369
Competitiveness in domestic market .587 .162 .334 3.620 .000Total Ex country .162 .061 .246 2.672 .009
3 (Constant) -.942 .704 -1.339 .184Competitiveness in domestic market .502 .162 .286 3.105 .002Total Ex country .171 .059 .259 2.876 .005threat by Chief-prawn .166 .067 .227 2.469 .015
4 (Constant) -.276 .765 -.361 .719Competitiveness in domestic market .470 .160 .267 2.941 .004Total Export countries .161 .059 .244 2.744 .007threat by Chief-prawn .156 .066 .214 2.359 .020Year in Exporting -.161 .078 -.184 -2.054 .043
a. Dependent Variable: branding

137
5.6 Strategy Recommendation
5.6.1The Marketing Advantages of Strong Brands
Building a strong brand, according Keller (1998), can be thought of as a series of
steps. The first step is to ensure identification of the brand with customers and an
association of the brand in customers' minds with a specific product class or
customer need. The second step is to firmly establish the brand meaning in the
minds of customers (i.e., by strategically linking a host of tangible and intangible
brand associations). The third step is to elicit the proper customer responses to
this brand identity and brand meaning. The final step is to convert brand
response to create an intense, active loyalty relationship between customers and
the brand. The following four steps represent fundamental questions that
customers invariably ask about brands—either implicitly or explicitly: (1) who are
you? {Brand identity) (2) what are you? {Brand meaning)(3) what does 1 think or
feel about you? {Brand responses) (4) what kind of association and how much of
a connection would I like to have with you? (Brand relationships). This is what
Keller terms as Building customer based brand equity.
5.6.2 Recommended Branding Strategy for Indian Shrimps/Prawns
Looking at the issues and challenges faced by the Indian exporters two pronged
approach for branding Indian marine shrimps/prawns is recommended. These
two approaches would encompass both value addition to the physical product
and its functional benefits as well as creating a distinct identify awareness and
138
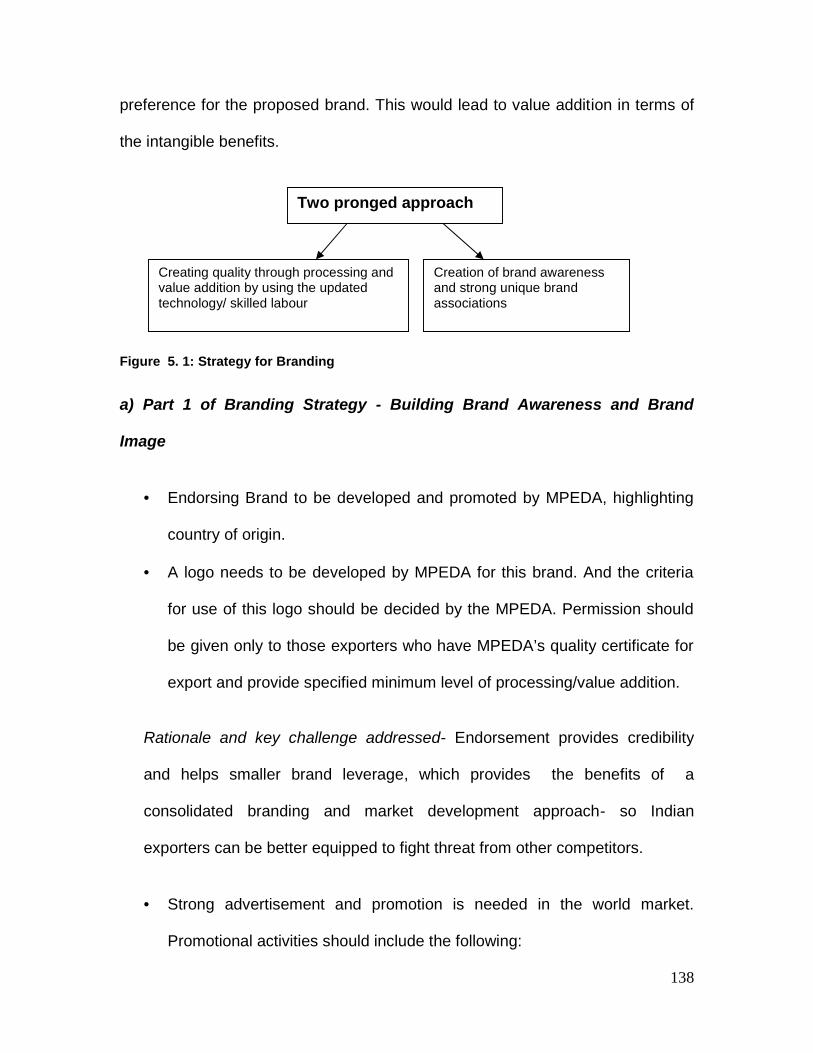
preference for the proposed brand. This would lead to value addition in terms of
the intangible benefits.
Figure 5. 1: Strategy for Branding
a) Part 1 of Branding Strategy - Building Brand Awareness and Brand
Image
Endorsing Brand to be developed and promoted by MPEDA, highlighting
country of origin.
A logo needs to be developed by MPEDA for this brand. And the criteria
for use of this logo should be decided by the MPEDA. Permission should
be given only to those exporters who have MPEDA’s quality certificate for
export and provide specified minimum level of processing/value addition.
Rationale and key challenge addressed- Endorsement provides credibility
and helps smaller brand leverage, which provides the benefits of a
consolidated branding and market development approach- so Indian
exporters can be better equipped to fight threat from other competitors.
Strong advertisement and promotion is needed in the world market.
Promotional activities should include the following:
Two pronged approach
Creating quality through processing andvalue addition by using the updatedtechnology/ skilled labour
Creation of brand awarenessand strong unique brandassociations

139
Opening special counters or shop in shop in selected retail outlets and
employing some special trained people for promoting the product.
Food exhibitions/ shrimp/prawn festivals/recipe contests in hotels and
restaurants.
Visual merchandising and POP display at selected retail chains.
There is lack of information on the nutritional properties of prawn and
shrimp species. For this both Government and individual exporters should
take some steps, like
Brief description of nutritional benefit of the product and differentiation
form other species should be given in packaging material.
The individual seafood company should add sections in their websites
and brochures for product details with product benefits.
Government could undertake public relation efforts to talk about
uniqueness and health benefits of shrimps/prawns.
MPEDA should create an unpaid separate database on the
shrimps/prawns export company’s name, their products details and
contacts.
Companies should create their website and there should be linked to the
brand‘s with main website, to be developed by MPEDA.
MPEDA can run selective co-operative advertising campaigns.
Once brand and logo is established and exporters start getting higher
UVR, the MPEDA can charge a small amount as fees for using logo.

140
Get reviews published with chefs rating Indian marine shrimps/prawns
high, as compared to other species in the foreign markets.
Rationale and Key challenges addressed-
These efforts will enhance awareness and visibility of Indian shrimps/prawns for
boot customers and end consumers. It will at one level, help expand the market
and stop decline in prawn demand and at another level establish desired
premium and unique and exotic image for the Indian products. This will enable
Indian exporters an advantage over competition, which cannot be easily
undermined only by price differential. The challenge of low UVR can also be
resolved through establishment and promotion of a strong and unique brand.
Developing the Brand Identity
A good framework for planning and building brand identity is given by Kapferer
(1997). According to him, brand identity can be represented by a hexagonal
prism (Figure-5.2). There are six aspects of brand identify defined by the prism. A
brand, first of all, has physical qualities-its ‘physique’. It is made of a combination
of either salient objective features (which immediately come to mind when the
brand is quoted in a survey) or emerging ones. Physique is both the brand’s
backbone and its tangible added value. A brand has a personality of its own. By
communicating, it gradually builds up character. The way in which it speaks of its
products or services shows what kind of person it would be if it were human. The
way in which it speaks of its products or services shows what kind of person it

141
Fig 5.2: Proposed Brand Identity
would be if it were human. A brand has its own culture, from which every product
derives. The product is not only a concrete representation of this culture, but also
a means of communication. Here culture means the set of values feeding the
brand’s inspiration. The cultural facet refers to the basic principles governing the
brand in its outward signs.
b) Part 2 of Branding Strategy- Value Addition to the physical product
MPEDA should also provide the technical help. That should set up
processing facilities with trained/skilled laboure. After establishing such
facilities MPEDA can also charge exporters nominally for their use.
Physique: Organic,nutritious large & goodflavour, striped, From NaturalIndian waters
Personality: Close to nature/environment friendly, healthyand Indian
Culture: Simple,classic, authentic andtransparent
INDIMARINO
TIGER PRAWN
Relationship:Trustworthy, Friendly
Customers’ Self-projection: Connoisseur,Discerning
Customers’ Reflection:Those who prefer natural productsand are particular about their foodchoice, Top Hotel and Restaurant

142
MPEDA is giving some basic training for shrimps/prawns processing units’
employees. But that is not sufficient. It has also take some more effective
steps like:
Conduct some programmes for the seafood industry employees,
specifically in processing technology.
Introduce some focused courses (degree or diploma) on fish
technology and processing in Government Academic Institute. Hire the
expertise from the countries which are doing the shrimps/prawns
processing for conducting these courses. May be it costs little higher
initially, but it will pay off latter.
MPEDA can enter into alliances/technological agreements with countries
like Japan, USA and China for training and setting up the processing
industries in India. By which they will also get a chance to penetrate the
other global markets, who are dealing with the partner countries.
5.7 Concluding Remarks
For testing the hypotheses of branding approach to Indian marine
shrimps/prawns exporting, correlation and regression analysis were performed
for both macro and micro variables. Most of the macro variables under study
emerged as interdependent with branding. Turnover (Indian frozen marine
shrimps/prawns) of the industry was found to be impacted by brand name of the
product. That shows there is a scope of increase penetration to the no. of global
market, if the product will export under the brand name. Other variables like price

143
constrain, threat by cheap prawn availability in export market and
competitiveness of domestic market problem can also control by branding.
Whereas branding was also a key driver to solve the problems like erratic-
demand found with the product in the market.
The variables which contributing to compel for the product (Indian marine
shrimps/prawns) branding, were Competitiveness in domestic market, total
exporting country, threat by cheap-prawn, years in exporting and product
prominancy.