Embed Size (px)
Citation preview
_________________________________________________________________________________________________ 185
CHAPTER 5 ECONOMIC GROWTH AND FOREIGN DIRECT INVESTMENT IN THE TRANSITION ECONOMIES
Foreign direct investment (FDI) has long been seen – and strongly recommended – as a crucial instrument in the process of transforming the former centrally planned economies of eastern Europe and the former Soviet Union into vibrant market systems. This chapter looks at the actual performance of FDI in promoting economic growth and restructuring in the transition economies since 1990. The basic conclusion is that the record is a very mixed one and that the wider benefits of FDI are contingent on the domestic economic and institutional environment – there is nothing automatic about them. FDI in the transition economies since 1990 has largely flowed to just a few central European countries, which are also the leading candidates for EU membership. These have indeed benefited from significant FDI financing of the balance of payments, and enterprises with foreign investment, not surprisingly, have had high rates of growth of output, productivity and exports. However, the expected spillover benefits to purely domestic enterprises – which represent the broader advantages of FDI for economic development – are found to be few and far between, and indeed often appear to have been negative rather than positive. In the absence of positive spillovers – and a fortiori in the presence of negative ones – the restructuring and development of the domestic enterprise sector may be inhibited, thereby reinforcing fears that an “enclave” economy might be emerging where a technologically advanced FDI sector pulls ahead but has little if any positive impact on the rest of the economy. The chapter ends with a discussion of how national policy measures might be designed to prevent such an outcome, inter alia, by strengthening national innovation systems, improving the absorptive or adaptive capabilities of local enterprises, and by adopting a more strategic approach to FDI in order to strengthen its development impact.
5.1 Introduction: theoretical aspects of FDI and economic growth
Foreign direct investment is often seen as an important catalyst for the economic transformation of the ECE transition economies. Its importance is seen to be not only in providing finance for the acquisition of new plants and equipment, but also in the transfer of technology and organizational forms from relatively more technologically advanced economies. FDI can also result in positive “spillovers” to the local economy through linkages with local suppliers, competition, imitation and training. It can also result, however, in negative spillovers if it forces domestic enterprises to close down because they cannot obtain the necessary financing for upgrading their technology. Moreover, it is possible that spillovers to the rest of the economy may not occur at all if there are institutional obstacles or deficiencies in the absorptive capacity of domestic enterprises.
As finance, FDI represents an inflow of foreign resources that can raise domestic savings rates in the recipient countries. This finance can include purchases by the foreign direct investor of equity capital (including
additional paid up capital) in the foreign investment enterprise (FIE), reinvestment of profits by the FIE and loans to the FIE from the parent firm. The FIE may also borrow abroad on its own account (although such funds are not classified as FDI). If the FIE uses these funds to build a new facility or upgrade an existing one, domestic fixed investment increases. Normally this involves a mix of domestic and imported inputs, especially foreign machinery and equipment. However, FDI also includes the acquisition of existing plants and equipment, in which case there is a transfer of title to existing assets rather than the creation of new ones. In the 1990s, most of these inflows were absorbed into the state budget since a large majority of the acquisitions involved the purchase of state assets. Also the profits of FIEs and funds from abroad may be placed in purely financial investments. In these cases, FDI does not have a direct impact on real investment, although an acquisition can result in the transfer of new technology and organizational forms over time.
The remainder of this section reviews the theoretical links between FDI and economic transformation. The determinants of FDI and the development of FDI in the transition economies are discussed in sections 5.2 and
186________________________________________________________________ Economic Survey of Europe, 2001 No. 1
5.3, respectively. Some economic consequences of FDI inflows, including their impact on the balance of payments and GDP growth, are discussed in sections 5.4 and 5.5. FDI as a channel of technology transfer and diffusion in the transition economies is explored further in sections 5.6 and 5.7. Conclusions and policy recommendations are made in section 5.8. An annex contains a discussion of the methodology for estimating technology transfer and spillovers.
(i) The role of transnational corporations (TNCs) in facilitating technological and organizational change Technical change and technological learning are
essential for the economic transformation of eastern Europe and the CIS. Since most research and development (R&D) takes place in TNCs located in the most advanced economies, these global enterprises can play an important role in transferring technology. The environment of the host country is also important for the diffusion of this technology to the local economy. These spillovers, as they are often called in growth theory, can occur directly through linkages with the local economy, through the labour market or through competitive pressure. But they can be negative if the FIE “crowds out” local enterprises through strong competitive pressures.
TNCs transfer technology in two ways: (1) directly, or internally, to FIEs under their ownership and control; and (2) indirectly, or externally, to other firms in the host economy. They can also have direct and indirect positive impacts on the diffusion of technology, irrespective of their ownership and control.478 A TNC can encourage technical change and technological learning directly through the transfer of new technology and organizational skills to one of its affiliates (FIE). The absorptive capacity (knowledge, skills and experience) of the FIE will then determine the pace of technological accumulation within the enterprise. These direct effects can appear as changes in productivity, industrial structure, R&D expenditure and the composition of exports. At the same time the presence of TNCs in the host economy can increase the rate of technical change and technological learning indirectly through technology spillovers from their FIEs to local or domestically owned enterprises (DEs). Spillovers can occur as a consequence of a TNC upgrading the technology of its affiliates (FIEs) to a level that is typically better than in the rest of the host economy. The innovation system and social capabilities of the host economy, together with the absorptive capacity of other enterprises in the host economy, will then determine the pace of technological progress in the economy as a whole.
Technology spillovers can occur between firms that are vertically integrated with the TNC (interindustry spillovers) or in direct competition with it (intra-industry spillovers). They can increase technical change and
478 For a similar discussion, see UNCTAD, World Investment Report
1992: Transnational Corporations as Engines of Growth (United Nations publication, Sales No. E.92.II.A.24), pp. 141-156.
technological learning in at least four ways.479 First, competition with the foreign affiliate can increase intra-industry spillovers by stimulating technical change and technological learning. Greater competitive pressure faced by local firms induces them to introduce new products to defend their market share and adopt new management methods to increase productivity. This kind of spillover is most important in industries with relatively low actual and potential competition and high barriers to entry. Second, cooperation between FIEs and upstream suppliers and downstream customers increases technological spillovers. To improve the quality standards of their suppliers, TNCs often provide resources to improve the technological capabilities of both vertically and horizontally linked firms. Third, human capital can spill over from FIEs to other enterprises as skilled labour moves between employers. These spillovers are especially important for enterprises that lack the technological capabilities and managerial skills to compete in world markets. Finally, the proximity of local firms to FIEs can sometimes lead to demonstration or imitation spillovers. When FIEs introduce new products, processes and organizational forms, they provide a demonstration of increased efficiency to other local enterprises. Local enterprises may also imitate FIEs through reverse engineering, personal contact and industrial espionage. In addition, a concentration of related industrial activities may also encourage the formation of industrial clusters, which further encourage FDI and local spillovers.
Not all TNC activity leads to technology transfer and positive spillovers.480 TNCs can have a negative impact on the direct transfer of technology to the FIE and reduce the spillovers from FDI in the host economy in several ways. They can provide their affiliates with too few, or the wrong kind of technological capabilities, or even limit access to the technology of the parent company. This type of behaviour may restrict the production of its affiliate to low-value activities and can also reduce the scope for technical change and technological learning within the affiliate. Even if the TNC transfers new technology to its affiliate, it can reduce the scope for technology spillovers by limiting downstream producers to low value added activities or eliminate them altogether by relying on foreign suppliers (including itself) for higher value added
479 For a similar classification, see A. Kokko, Foreign Direct
Investment, Host Country Characteristics and Spillovers (Stockholm, Stockholm School of Economics, 1992), and T. Perez, Multinational Enterprises and Technological Spillovers (Amsterdam, Harwood Academic Publishers, 1998), pp. 24-27.
480 See, for example, J. Dunning, “Re-evaluating the benefits of foreign direct investment”, Transnational Corporations, Vol. 3, No. 1, 1994, pp. 23-51, and P. Bardham, “The contributions of endogenous growth theory to the analysis of development problems: an assessment”, in F. Coricelli, M. di Matteo and F. Hahn (eds.), New Theories in Growth and Development (London, Macmillan, 1998). Dunning argues that TNCs can limit the access of affiliates to certain markets, the range of products they produce, the kinds of technology they adopt, the R&D activity they undertake and their pattern of networking with local enterprises. They can also reduce competition and taxes paid in the host country through market domination and transfer pricing. Bardham also suggests that TNCs can restrict domestic production when they set up affiliates with the main purpose of protecting existing property rights and taking out patents in the host country.
Economic Growth and Foreign Direct Investment in the Transition Economies ________________________________ 187
intermediate products. In some cases they can even eliminate competition by “crowding out” local producers. They may also limit exports to competitors and confine production to the needs of the TNC. This behaviour not only limits the scope for technology spillovers, but it may also lead to a decline in the overall growth rate of the host economy by reducing competition and worsening the balance of payments.
Technology spillovers from TNCs tend to occur more frequently when the social capabilities of the host country and the absorptive capacity of the firms in the economy are high. While relatively backward countries have a certain scope for catching up, it is often difficult for the country to build the necessary social capabilities and absorptive capacities that allow firms to take advantage of the technology spillovers that are potentially available to the economy. Countries (and firms) without the capability to assimilate new technology tend to attract mainly market-seeking or resource-seeking foreign investment, while countries with this capability tend to attract more efficiency-seeking and asset-seeking foreign investment.481 Closing the technology gap will be difficult without the relevant capabilities. As a result, there appears to be a certain threshold of development that countries must cross before the potential for technological spillovers can be realized.482
It is also useful to distinguish the broad category of productivity spillovers from technological spillovers. Often both happen together since industrial and corporate restructuring are connected to the competitive environment. Technology spillovers occur when TNCs improve the technology of their affiliates and this in turn diffuses to other firms in the host economy. They tend to occur more frequently in countries with relatively high levels of “social capabilities” (e.g. education levels, technological capabilities, good legal systems, etc.). In contrast, productivity spillovers can occur without any transfer of technology. For example, a TNC can create competitive pressures that force less efficient firms to close, thus increasing the average productivity of the industry in the host economy.
(ii) The role of FDI in economic growth: theoretical and empirical considerations Numerous empirical studies at the firm, industry
and economy-wide levels confirm that technical change and technological learning are important determinants of economic growth.483 TNCs are responsible for much of
481 J. Dunning, loc. cit. 482 A model of catching up by Verspagen shows why countries with a
high learning capacity and/or small productivity gap are likely to catch up, while others will tend to fall further behind. Crossing this threshold requires improving the human capital in the country as well as its “national innovation system”. B. Verspagen, “A new empirical approach to catching up or falling behind”, Structural Change and Economic Dynamics, Vol. 2, 1991, pp. 359-380. For a discussion of this threshold from the point of view of TNCs, see A. Kokko, op. cit.
483 J. Temple, “The new growth evidence”, Journal of Economic Literature, Vol. 37, No. 1, March 1999, pp. 112-156, and S. Durlauf and
this technological accumulation, yet growth theory rarely acknowledges the important role that these organizations play. In neo-classical analysis, FDI does not influence the long-run growth rate, but only the level of income. An exogenous increase in FDI would increase the amount of capital (and output) per person, but this would only be temporary, as diminishing returns (on the marginal product of capital) would impose a limit to this growth. FDI can influence the long-run growth rate only through technological progress or growth of the labour force, which are both considered exogenous.
If FDI is not only finance but also a bundle of fixed assets, knowledge (codified and tacit) and technology, then it can be expected to generate growth endogenously. According to recent endogenous growth theory, FDI influences growth via variables such as R&D and education (or human capital).484 Even if diminishing returns prevail inside the enterprise, various externalities (outside the enterprise) can provide the necessary positive feedback to sustain growth in the long run. TNCs create such positive externalities for the local economy when they transfer new technology and organizational forms directly to its affiliate. They can also create them indirectly through subcontracting, joint ventures and strategic alliances, technology licensing, imports of capital goods and migration. Through technology transfer and technology spillovers, these growth models suggest that FDI can speed up the development of new intermediate product varieties (the horizontally differentiated inputs model), raise product quality (the quality ladder model), facilitate international collaboration on R&D, and introduce new forms of human capital.485 By providing firms in relatively backward countries with greater access to finance and a wider range of intermediate products, FDI can increase
D. Quah, “The new empirics of economic growth”, in J. Taylor and M. Woodford (eds.), Handbook of Macroeconomics (Amsterdam, Elsevier Science, 1999), pp. 235-308.
484 Romer includes a technology parameter in the production function that exhibits increasing returns to knowledge and constant returns in knowledge accumulation. Technical knowledge is generally public (or non-rival) and at least partly excludable, and tacit knowledge is private or firm-specific (rival) and is excludable in that it requires certain rights to access it. P. Romer, “Increasing returns and long-run growth”, Journal of Political Economy, Vol. 94, 1986, pp. 1002-1037. Lucas introduced human capital as a parameter in the production function to generate increasing returns and endogenous growth. R. Lucas Jr., “On the mechanics of economic development”, Journal of Monetary Economics, Vol. 22, No. 3, 1988, pp. 3-42.
485 Some growth models suggest that the intensity of R&D determines the pace of economic growth by increasing the variety (and quality) of capital goods and inducing the necessary human capital for subsequent innovations. This product differentiation reflects the increased specialization of labour across an increasing variety of activities in the global economy. P. Romer, “Endogenous technological change”, Journal of Political Economy, Vol. 98, 1990, pp. S71-102; G. Grossman and E. Helpman, Innovation and Growth in the Global Economy (Cambridge, MIT Press, 1991); and P. Aghion and P. Howitt, “A model of growth through creative destruction”, Econometrica, Vol. 60, 1992, pp. 323-351. Grossman and Helpman represent the growth process as a quality ladder that firms climb depending on the stochastic nature of the R&D process. Aghion and Howitt describe how changing product variety leads to a process of creative destruction and explain how excessive R&D expenditures can have the opposite effect that Romer predicts.
188________________________________________________________________ Economic Survey of Europe, 2001 No. 1
productivity directly in the FIE and indirectly in local enterprises through knowledge spillovers. The existence of technology transfer and local spillovers prevent the unbounded decline of the marginal productivity of capital suggested in conventional growth theory and makes endogenously driven long-term growth possible.
Although the scope for externalities of various types and the influence they have on long-run growth is a common theme in most endogenous growth models, very few of them consider explicitly the role of FDI in generating these externalities.486 A widely held view is that international trade (especially in new intermediate and capital goods) leads to R&D spillovers and higher productivity growth.487 But while recent evidence shows that the composition of imports appears to influence productivity growth (especially in developing countries), it also reveals that domestic R&D has a greater influence on productivity growth than foreign R&D. The lack of sound evidence that international trade is an important channel of technology transfer has important policy implications for the creation of new free trade agreements. It also suggests that other channels of technology transfer should be examined more closely.488 Recent studies based on endogenous growth theory indicate that the transfer of technology and technology spillovers from FDI encourage long-run growth, but the extent to which this occurs depends crucially on the stock of human capital and the absorptive capacity of firms in the host economy.489 Scale effects found in industry data indicate that the direct transfer of technology to the FIE is more important than spillovers from the FIE to the domestic economy. But the dearth of statistically significant evidence suggests that no one channel of technology transfer is better than another and that these channels may be complementary rather than substitutes.
5.2 Principal determinants of FDI flows There is widespread agreement on what determines
the flow of FDI to one country rather than another. Countries attracting large amounts of FDI generally have
486 L. de Mello, Jr., “Foreign direct investment in developing
countries and growth: a selective survey”, The Journal of Development Studies, Vol. 34, No. 1, 1997, pp. 1-34. G. Grossman and E. Helpman, op. cit., incorporate FDI into their growth model, but only to the extent that it determines the international location of production.
487 D. Coe and E. Helpman, “International R&D spillovers”, European Economic Review, Vol. 39, 1995, pp. 859-887. They show that the total factor productivity of a country depends not only on its own R&D activity, but also the R&D activity of its trading partners.
488 W. Keller, “Do trade patterns and technology flows affect productivity growth?”, The World Bank Economic Review, Vol. 14, No. 1, January 2000, pp. 17-47.
489 E. Borensztein, J. De Gregorio and J.-W. Lee, “How does foreign direct investment affect economic growth”, Journal of International Economics, Vol. 45, 1998, pp. 115-135. Though not always statistically significant, the results show that FDI has a positive impact on economic growth, depending on the level of human capital in the host country. See also R. Baldwin, H. Braconier and R. Forslid, Multinationals, Endogenous Growth and Technological Spillovers: Theory and Evidence, Centre for Economic Policy Research (CEPR) Discussion Paper, No. 2155 (London), May 1999.
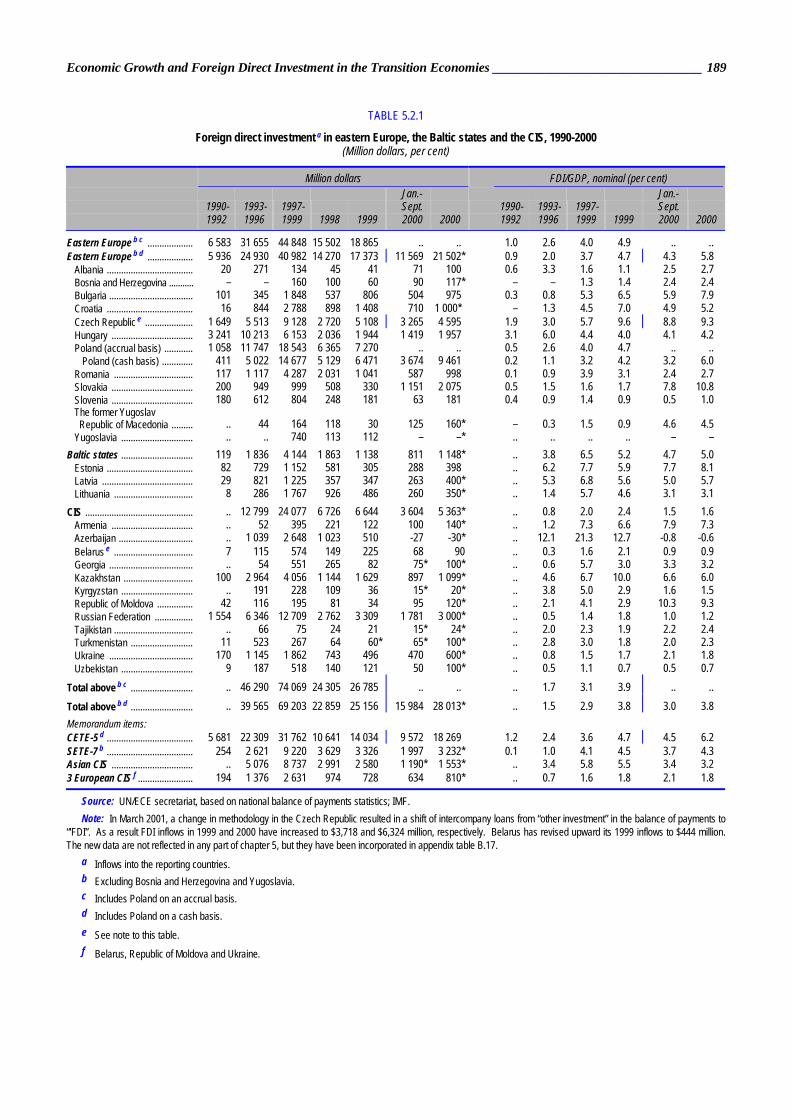
good economic fundamentals, that is, they have achieved a high degree of macroeconomic and political stability and have favourable growth prospects.490 They also tend to possess a good infrastructure and legal system (including enforcement of laws), a skilled labour force, and a foreign sector that has been liberalized to some extent (membership in free trade areas is a particular attraction). Location, country (market) size and natural endowments are generally important as well. In the former centrally planned economies, the degree of progress made in moving from plan to market has been a key explanation of FDI inflows (tables 5.2.1 and 5.2.2, charts 5.2.1 and 5.2.2 and appendix table B.17).491 More generally, those transition economies that have attracted substantial amounts of FDI have followed policies that have created friendly investment environments (although they often possess certain natural advantages as well).
This section will first discuss some of the determinants of FDI flows into the first group of transition economies chosen as candidates for EU accession (Czech Republic, Hungary, Poland, Slovenia and Estonia). These countries have received the bulk of FDI in the transition economies during the past decade, never less than 60 per cent of the total annual inflow. The focus then switches to countries that have failed to attract much FDI. In some cases, they have been in a favourable position to do so, but domestic political and/or economic policies have discouraged investment. In others, the causes appear to be more fundamental and intractable.
The first wave of EU candidate countries were among the first to achieve macroeconomic stabilization and their economic reforms have been the most advanced of all the transition economies. Although there have been considerable policy differences between them, a key element of the reforms has been the privatization of state assets with the involvement of foreign strategic investors. These acquisitions, the timing of which has been determined by the political process and national timetables for the sale of specific assets, have accounted for a considerable share of total FDI. Exclusive of Slovenia (see below), the early investment promotion efforts of these countries not only signalled that foreign investment was welcome in the former state run economies, but they also capitalized on the enthusiasm of western investors. At various times, investment incentives have been introduced492 which still seem to retain their attractiveness for individual countries competing for FDI.
490 Sections 5.2-5.5 are based on FDI data from the balance of
payments (also see box 5.3.1). 491 The relationship between the degree of economic reform and FDI
inflows has been commented on previously. See, for example, EBRD, Transition Report 1998 (London).
492 G. Hunya, International Competitiveness. Impacts of FDI in CEECs, The Vienna Institute for International Economic Studies (WIIW) Research Reports, No. 268 (Vienna), August 2000.
Economic Growth and Foreign Direct Investment in the Transition Economies ________________________________ 189
TABLE 5.2.1
Foreign direct investment a in eastern Europe, the Baltic states and the CIS, 1990-2000 (Million dollars, per cent)
Million dollars FDI/GDP, nominal (per cent)
1990- 1993- 1997- Jan.-Sept. 1990- 1993- 1997-
Jan.-Sept.
1992 1996 1999 1998 1999 2000 2000 1992 1996 1999 1999 2000 2000
Eastern Europe b c ................... 6 583 31 655 44 848 15 502 18 865 .. .. 1.0 2.6 4.0 4.9 .. .. Eastern Europe b d ................... 5 936 24 930 40 982 14 270 17 373 11 569 21 502* 0.9 2.0 3.7 4.7 4.3 5.8
Albania .................................... 20 271 134 45 41 71 100 0.6 3.3 1.6 1.1 2.5 2.7 Bosnia and Herzegovina ........... – – 160 100 60 90 117* – – 1.3 1.4 2.4 2.4 Bulgaria ................................... 101 345 1 848 537 806 504 975 0.3 0.8 5.3 6.5 5.9 7.9 Croatia .................................... 16 844 2 788 898 1 408 710 1 000* – 1.3 4.5 7.0 4.9 5.2 Czech Republic e .................... 1 649 5 513 9 128 2 720 5 108 3 265 4 595 1.9 3.0 5.7 9.6 8.8 9.3 Hungary .................................. 3 241 10 213 6 153 2 036 1 944 1 419 1 957 3.1 6.0 4.4 4.0 4.1 4.2 Poland (accrual basis) ............ 1 058 11 747 18 543 6 365 7 270 .. .. 0.5 2.6 4.0 4.7 .. ..
Poland (cash basis) ............. 411 5 022 14 677 5 129 6 471 3 674 9 461 0.2 1.1 3.2 4.2 3.2 6.0 Romania ................................. 117 1 117 4 287 2 031 1 041 587 998 0.1 0.9 3.9 3.1 2.4 2.7 Slovakia .................................. 200 949 999 508 330 1 151 2 075 0.5 1.5 1.6 1.7 7.8 10.8 Slovenia .................................. 180 612 804 248 181 63 181 0.4 0.9 1.4 0.9 0.5 1.0 The former Yugoslav Republic of Macedonia ......... .. 44 164 118 30 125 160* – 0.3 1.5 0.9 4.6 4.5 Yugoslavia .............................. .. .. 740 113 112 – –* .. .. .. .. – –
Baltic states .............................. 119 1 836 4 144 1 863 1 138 811 1 148* .. 3.8 6.5 5.2 4.7 5.0 Estonia .................................... 82 729 1 152 581 305 288 398 .. 6.2 7.7 5.9 7.7 8.1 Latvia ...................................... 29 821 1 225 357 347 263 400* .. 5.3 6.8 5.6 5.0 5.7 Lithuania ................................. 8 286 1 767 926 486 260 350* .. 1.4 5.7 4.6 3.1 3.1
CIS ............................................. .. 12 799 24 077 6 726 6 644 3 604 5 363* .. 0.8 2.0 2.4 1.5 1.6 Armenia .................................. .. 52 395 221 122 100 140* .. 1.2 7.3 6.6 7.9 7.3 Azerbaijan ............................... .. 1 039 2 648 1 023 510 -27 -30* .. 12.1 21.3 12.7 -0.8 -0.6 Belarus e ................................. 7 115 574 149 225 68 90 .. 0.3 1.6 2.1 0.9 0.9 Georgia ................................... .. 54 551 265 82 75* 100* .. 0.6 5.7 3.0 3.3 3.2 Kazakhstan ............................. 100 2 964 4 056 1 144 1 629 897 1 099* .. 4.6 6.7 10.0 6.6 6.0 Kyrgyzstan .............................. .. 191 228 109 36 15* 20* .. 3.8 5.0 2.9 1.6 1.5 Republic of Moldova ............... 42 116 195 81 34 95 120* .. 2.1 4.1 2.9 10.3 9.3 Russian Federation ................ 1 554 6 346 12 709 2 762 3 309 1 781 3 000* .. 0.5 1.4 1.8 1.0 1.2 Tajikistan ................................. .. 66 75 24 21 15* 24* .. 2.0 2.3 1.9 2.2 2.4 Turkmenistan .......................... 11 523 267 64 60* 65* 100* .. 2.8 3.0 1.8 2.0 2.3 Ukraine ................................... 170 1 145 1 862 743 496 470 600* .. 0.8 1.5 1.7 2.1 1.8 Uzbekistan .............................. 9 187 518 140 121 50 100* .. 0.5 1.1 0.7 0.5 0.7
Total above b c .......................... .. 46 290 74 069 24 305 26 785 .. .. .. 1.7 3.1 3.9 .. .. Total above b d .......................... .. 39 565 69 203 22 859 25 156 15 984 28 013* .. 1.5 2.9 3.8 3.0 3.8 Memorandum items: CETE-5 d .................................... 5 681 22 309 31 762 10 641 14 034 9 572 18 269 1.2 2.4 3.6 4.7 4.5 6.2 SETE-7 b .................................... 254 2 621 9 220 3 629 3 326 1 997 3 232* 0.1 1.0 4.1 4.5 3.7 4.3 Asian CIS .................................. .. 5 076 8 737 2 991 2 580 1 190* 1 553* .. 3.4 5.8 5.5 3.4 3.2 3 European CIS f ....................... 194 1 376 2 631 974 728 634 810* .. 0.7 1.6 1.8 2.1 1.8
Source: UN/ECE secretariat, based on national balance of payments statistics; IMF. Note: In March 2001, a change in methodology in the Czech Republic resulted in a shift of intercompany loans from “other investment” in the balance of payments to
“'FDI”. As a result FDI inflows in 1999 and 2000 have increased to $3,718 and $6,324 million, respectively. Belarus has revised upward its 1999 inflows to $444 million. The new data are not reflected in any part of chapter 5, but they have been incorporated in appendix table B.17.
a Inflows into the reporting countries. b Excluding Bosnia and Herzegovina and Yugoslavia. c Includes Poland on an accrual basis. d Includes Poland on a cash basis. e See note to this table. f Belarus, Republic of Moldova and Ukraine.
190________________________________________________________________ Economic Survey of Europe, 2001 No. 1
TABLE 5.2.2
Foreign direct investment inflows in eastern Europe, the Baltic states and the CIS, 1988-2000 (Billion dollars, per cent)
Cumulative FDI inflows 1988-1999
FDI inflows / GDFCF a (per cent)
FDI inflows / current account
(per cent) Secondary educationb
Corruption index 2000
Per cent Per
Billion dollars
Per cent of GDP c Rank
of GDP (PPP) c Rank
capita (dollars) Rank
1993-1996
1997-1999
1993-1996
1997-1999 1997 Rank d
CPI score
Eastern Europe e ...................... 84.4 22.8 .. 9.6 .. 789 .. 12 17 58f 86 80 51 3.8 Albania .................................... 0.4 11.8 18 4.1 16 126 16 .. .. 104 28 38 .. .. Bosnia and Herzegovina ........... 0.2 3.6 .. .. .. 57 .. .. .. – 4 .. .. .. Bulgaria ................................... 2.3 18.5 14 5.5 11 279 12 6 39 26 488 77 52 3.5 Croatia .................................... 3.7 18.4 15 11.6 6 815 7 8 19 74 52 82 51 3.7 Czech Republic ...................... 16.5 31.1 7 12.3 5 1 609 2 10 20 92 164 99 42 4.3 Hungary .................................. 19.8 40.9 3 17.8 2 1 969 1 30 19 89 115 98 32 5.2 Poland (FDI: accrual basis) .... 32.1 20.6 12 10.0 7 830 5 14 17 -672 85 98 43 4.1 Romania ................................. 5.5 16.2 16 4.3 15 246 13 4 20 19 67 78 68 2.9 Slovakia .................................. 2.2 10.9 20 3.9 17 400 11 5 5 58 20 94 52 3.5 Slovenia .................................. 1.6 8.0 22 5.3 12 806 6 5 6 -88 88 92 28 5.5 The former Yugoslav Republic of Macedonia ......... 0.2 6.1 24 2.1 21 103 19 2 9 7 23 63 .. .. Yugoslavia .............................. 0.7 4.2 .. 1.7 .. 70 .. .. – 21 62 89 1.3
Baltic states .............................. 6.1 27.7 .. 12.0 .. 805 .. 18 26 97 64 91 42 4.4 Estonia .................................... 2.0 38.2 4 16.9 3 1 361 3 23 28 104 86 104 27 5.7 Latvia ...................................... 2.1 33.2 6 14.2 4 853 5 34 29 -255 75 84 57 3.4 Lithuania ................................. 2.1 19.4 13 8.4 9 557 8 6 24 19 51 86 43 4.1
CIS ............................................. 38.7 14.1 .. 2.7 .. 137 .. 4 11 .. .. 86 74 2.5 Armenia .................................. 0.4 24.2 10 5.1 13 117 17 7 45 8 41 90 76 2.5 Azerbaijan ............................... 3.6 91.0 1 19.7 1 456 10 51 61 62 92 77 87 1.5 Belarus .................................... 0.7 6.6 23 1.0 25 68 22 1 6 6 30 93 43 4.1 Georgia ................................... 0.6 21.8 11 3.1 19 111 18 4 46 5 56 77 .. .. Kazakhstan ............................. 7.1 44.9 2 9.7 8 477 9 20 55 131 185 87 65 3.0 Kyrgyzstan .............................. 0.4 34.4 5 3.7 18 86 21 21 41 23 33 79 .. .. Republic of Moldova ............... 0.3 30.1 8 4.9 14 96 20 12 20 22 29 81 74 2.6 Russian Federation ................ 20.6 11.2 19 2.1 22 141 15 2 8 -15 -45 96f 82 2.1 Tajikistan ................................. 0.2 13.8 17 2.4 20 24 25 12 .. 12 39 78 .. .. Turkmenistan .......................... 0.8 24.5 9 5.7 10 165 14 9 24 -59 18 .. .. .. Ukraine ................................... 3.2 10.3 21 1.9 23 64 23 3 8 27 99 94f 87 1.5 Uzbekistan .............................. 0.7 4.1 25 1.2 24 28 24 2 3 14 77 94 79 2.4
Total above e ............................. 129.2 19.4 .. 5.5 .. 325 .. 8 14 .. .. .. .. .. Memorandum items: CETE-5 ...................................... 72.2 24.3 .. 11.1 .. 1 088 .. 14 16 174 92 96 39 4.5 SETE-7 e .................................... 12.2 16.5 .. 5.5 .. 299 .. 6 22 28 69 68 57 3.4 Asian CIS .................................. 13.9 29.8 .. 6.7 .. 191 .. 14 29 66 84 83 77 2.4 European CIS g ......................... 24.8 10.9 .. 2.0 .. 118 .. 3 8 .. .. 91 72 2.6 Poland: cash basis ..................... 20.1 12.9 .. 6.3 .. 520 .. 5.6 13 21 59 .. .. ..
Source: UN/ECE secretariat, based on national balance of payments statistics. Transparency International, Corruption Perceptions Index (CPI), (www.transparency.de). For data on secondary education, World Bank, World Development Indicators 2000 (Washington, D.C.), 2000.
a GDFCF - gross domestic fixed capital formation, converted to dollars at current exchange rates. b Per cent of the relevant age group. c GDP in 1999, at current prices and exchange rates. GDP(PPP) is purchasing power parity GDP. d Country rank out of 90 countries surveyed. The score ranges from 0-6, highest to lowest perceived corruption. e Excluding Bosnia and Herzegovina and Yugoslavia. f 1980. g Belarus, Republic of Moldova and Ukraine.
Economic Growth and Foreign Direct Investment in the Transition Economies ________________________________ 191
CHART 5.2.1
Cumulative FDI inflows as a percentage of current year GDP in eastern Europe, the Baltic states and the CIS, a 1990-1999 (Per cent)
Central Europe
0
5
10
15
20
25
30
35
40
45
1990 1991 1992 1993 1994 1995 1996 1997 1998 1999
Hungary
Poland
Slovenia
Slovakia
Czech Republic
South-east Europe
0
5
10
15
20
1990 1991 1992 1993 1994 1995 1996 1997 1998 1999
Albania
Bosnia andHerzegovina
BulgariaCroatia
Romania
The formerYugoslav
Republic ofMacedonia
Baltic states
0
5
10
15
20
25
30
35
40
45
1990 1991 1992 1993 1994 1995 1996 1997 1998 1999
Latvia
Estonia
Lithuania
European CIS
0
5
10
15
20
25
30
35
1990 1991 1992 1993 1994 1995 1996 1997 1998 1999
RussianFederation
Republic of Moldova
Belarus
Ukraine
Asian CIS
0
10
20
30
40
50
60
70
80
90
100
1990 1991 1992 1993 1994 1995 1996 1997 1998 1999
Kazakhstan
Azerbaijan
Uzbekistan
Georgia
Kyrgyzstan
Turkmenistan
Tajikistan
Armenia
EU accession countries b
0
5
10
15
20
25
30
35
1990 1991 1992 1993 1994 1995 1996 1997 1998 1999
2nd wave
1st wave
Others
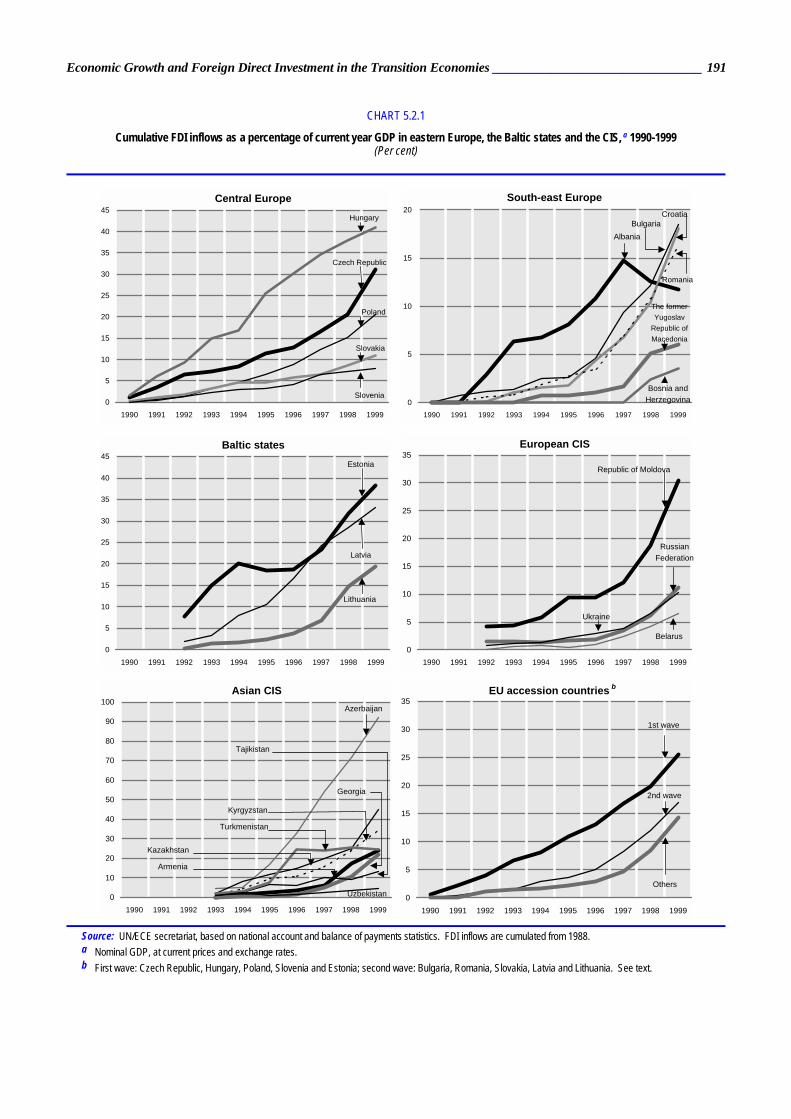
Source: UN/ECE secretariat, based on national account and balance of payments statistics. FDI inflows are cumulated from 1988. a Nominal GDP, at current prices and exchange rates. b First wave: Czech Republic, Hungary, Poland, Slovenia and Estonia; second wave: Bulgaria, Romania, Slovakia, Latvia and Lithuania. See text.
192________________________________________________________________ Economic Survey of Europe, 2001 No. 1
Geographical proximity to major west European markets and production centres is also a major advantage for the four countries, which share borders with the EU while Estonia enjoys easy maritime access. The size of the Polish economy has contributed to its leading position as a domicile for FDI. Most of these countries embarked on the transition with poor market supporting institutions and physical infrastructure. However, considerable progress has been made in some areas, often with the assistance of the international development banks493 and the involvement of foreign strategic investors.494 In particular, these investments have been instrumental in upgrading the important telecommunications sector.495 Local corruption appears to be less of a problem in these
493 These countries have received the assistance of the EBRD, the
World Bank, the EU (through PHARE and EIB loans) and, more generally, the G-24 programme (from the latter early in the reform process). Institution building has also been advanced through the process of the harmonization of national laws with the EU Acquis Communautaire.
494 The EBRD has become the largest single investor in the transition economies. By mobilizing private investors, its influence on FDI inflows extends beyond its stake holdings.
495 According to the Hungarian Institute of World Economics, the world ranking of the first wave of accession countries in telecommunications facilities has risen since 1990, and all except Poland were in the upper third of the sample in 1999. However, Bulgaria, Romania, Russia and Ukraine have lost ground. Similar differences were found in internet penetration. I. Berend (citing E. Erlich), “From regime change to sustained growth in central and eastern Europe”, UN/ECE, Economic Survey of Europe, 2000 No. 2/3, chap. 2.
four countries than elsewhere in the region. Corruption is often cited by foreign business as a deterrent to FDI, and this appears to be the case in the transition economies as well.496
Prospects for (or actual) EU membership have often proved a magnet for FDI in the accession countries.497 The acceleration of FDI into the EEC after the Treaty of Rome and into Greece, Portugal and Spain prior to accession to the EU is well known. The first wave countries have tended to have similar experiences with FDI.498 Initially, the free trade provisions of the Association Agreements (negotiated in 1991) probably attracted foreign investors.499 Although these accords did not promise EU membership, they were widely seen at the time as a first step towards it. More recently key announcements of the progress in EU accession seem to have resulted in larger FDI flows into the candidate countries, but much more so into the first wave than into the second (Bulgaria, Romania, Slovakia, Latvia and Lithuania).500 From the very beginning of the decade, investors have differentiated between these two groups of countries (chart 5.2.1), although the official announcements began to do so only in 1997.
An asset of interest to foreign investors that is broadly shared by all the transition economies is the
496 According to the indices calculated by Transparency International,
an average value of 5.0 for the first wave countries is much better than those for other groups of transition economies (table 5.2.2). The secretariat found a significant negative relationship between the corruption index and cumulated FDI inflows/GDP in the host transition economy. For a more general statistical analysis of corruption and FDI flows, see Shang-Jin Wei, How Taxing is Corruption on International Investors?, NBER Working Paper, Number 6030 (Cambridge, MA), May 1997.
497 The potential benefits of EU membership, including for foreign investors, have been extensively discussed. Very briefly, accepting EU rules and regulations reduces investment risk by creating a business environment similar to that in western Europe. In particular, the risk of arbitrary policy changes in, for example, market access and taxation are diminished and property rights become more secure. There is also a reduction in the transaction costs of cross-border business. See, for example, R. Baldwin, J. Francois and R. Portes “The costs and benefits of eastern enlargement: the impact on the EU and central Europe”, Economic Policy, Vol. 24, April 1997, pp. 127-170.
498 This issue has received considerable attention. For instance, Havrylyshyn found that all potential EU accession countries, which he defined as all non-CIS economies, attracted more FDI than the non-accession group did. O. Havrylyshyn, “EU enlargement and possible echoes beyond the new frontiers”, paper presented at the WIIW 25th Anniversary Conference, Shaping the New Europe: Challenges of EU Eastern Enlargement – East and West European Perspectives (Vienna), 11-13 November 1998.
499 Under the interim arrangements of the Association Agreements between the EC and Czechoslovakia, Hungary and Poland, measures liberalizing trade in industrial products entered into force on 1 March 1992. UN/ECE, Economic Survey of Europe in 1991-1992, p. 188.
500 A. Bevan and S. Estrin, The Determinants of Foreign Direct Investment in Transition Economies, London Business School, Centre for New and Emerging Markets Discussion Paper Series, No. 9 (London), October 2000. The EU accession-related announcements by the European Council were Copenhagen (June 1993), Essen (December 1994), Madrid (December 1995) and Agenda 2000 (July 1997). The first three announcements were not country specific, but the most recent defined the first and second wave countries.
CHART 5.2.2
Ratio of cumulative FDI inflows to GDP(PPP) and progress in reform a
(Per cent)
Ukraine
Russian Federation Georgia
KyrgyzstanAlbania Romania
Armenia
SlovakiaSlovenia
Bulgaria
Uzbekistan
TajikistanBelarus
Turkmenistan
Lithuania
PolandKazakhstan
Croatia
Czech Republic
Latvia
Estonia
HungaryAzerbaijan
-5
0
5
10
15
20
0.0 0.5 1.0 1.5 2.0 2.5 3.0 3.5 4.0Reform indicator
Cum
ulat
ive
FDI /
GD
P (P
PP),
per c
ent
The former YugoslavRepublic of Macedonia
Republic of Moldova
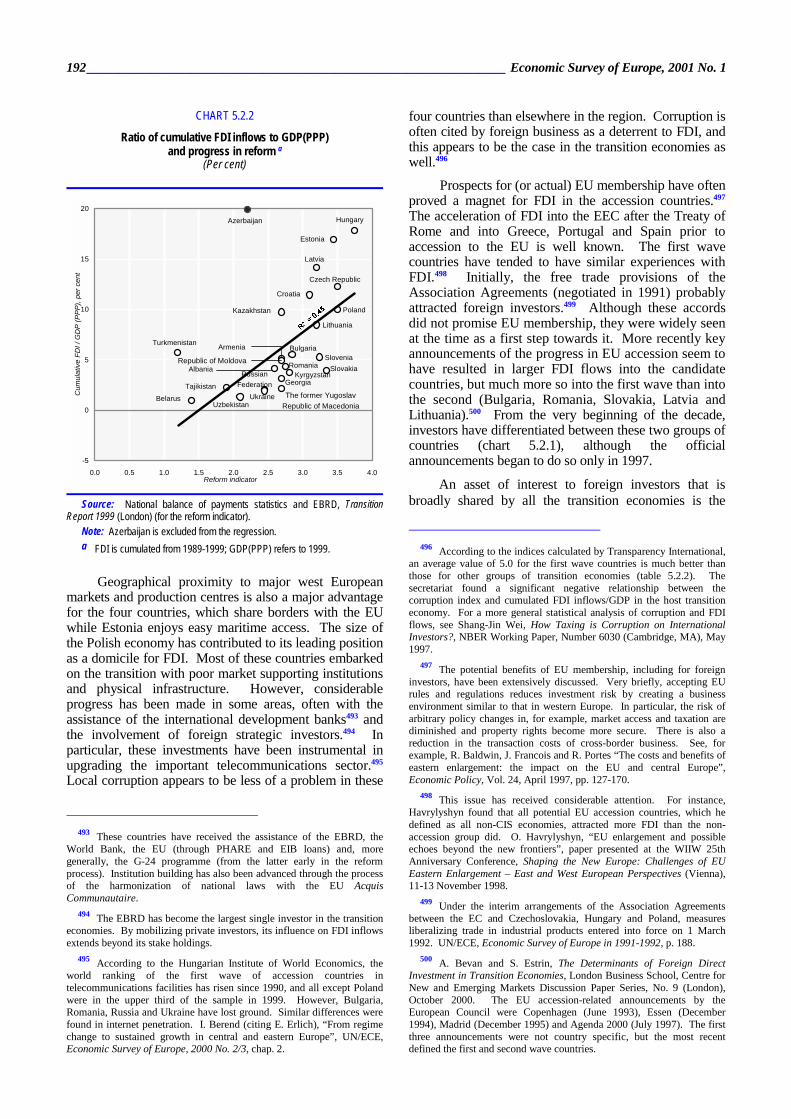
Source: National balance of payments statistics and EBRD, Transition Report 1999 (London) (for the reform indicator).
Note: Azerbaijan is excluded from the regression. a FDI is cumulated from 1989-1999; GDP(PPP) refers to 1999.
Economic Growth and Foreign Direct Investment in the Transition Economies ________________________________ 193
relative abundance of well-educated but low-cost labour. The first wave of five candidate countries lead the region in terms of educational attainment,501 and nominal wages are several times lower than in the lowest-wage EU economies. Wages in the first wave countries make them competitive as hosts for FDI even after adjustments are made for their lower productivity.502 However, relatively rapid increases in unit labour costs seem to discourage foreign investors.503
Given their favourable location, educated labour forces and other assets, several other transition economies have been well placed to receive foreign investments, but the results have been largely disappointing (table 5.2.1 and chart 5.2.1). Slow economic reform and a lack of restructuring have been general features, but there have been specific factors as well. For example, in Slovakia until recently the political climate and official attitudes toward foreign investment were viewed unfavourably by foreign investors. Bulgaria and Romania were characterized for years by policy immobility and periodic economic crises, but subsequent changes in policy have led to their acceptance in the second wave of EU accession countries. FDI has increased mainly because privatization programmes have been accelerated.
The republics of the former SFR of Yugoslavia also possess assets of potential interest to foreign investors. However, risks associated with the breakup of the country have dominated foreign perceptions: regional and internal conflicts, financial difficulties (e.g. the former SFR of Yugoslavia’s default on foreign debt, loss of official reserves, negotiations with foreign creditors) and, most recently, the Kosovo conflict (which adversely affected the entire Balkan region). Slow economic reform and the political situation (which disqualified Croatia from the PHARE programme) were also factors. However, investment in Croatia has increased following the cessation of hostilities and again after the election of a reform-minded government. On the other hand, peace and large amounts of foreign aid have done little to help attract FDI into Bosnia and Herzegovina, which for the time being remains a dysfunctional state subject to ethnic tensions. Yugoslavia has been viewed as a high-risk country, subject to a United Nations embargo and pursuing an inward-looking economic policy. Its only significant foreign investment has been the FDI-related privatization of the telecommunications enterprise. After the recent elections, however, the prospects for fundamental change have improved. Slovenia has attracted only modest amounts of investment (see below) despite the restoration of peace, a good location (bordering on two EU countries) and solid economic
501 In general the transition economies rank very high by world standards,
significantly above the average of developing countries (table 5.2.2). 502 A. Bevan and S. Estrin, op. cit., have found that unit labour costs in a
selection of transition economies are a significant determinant of FDI inflows. They note that nominal wages alone are not a good explanatory variable.
503 Ibid.
fundamentals. This is the result of a deliberate policy choice, however, which has become more welcoming in the past year.
Within the CIS, countries well endowed with natural resources – Azerbaijan, Kazakhstan and Turkmenistan (oil and gas) and Kyrgyzstan (gold) – have attracted relatively large amounts of FDI into the extractive industries. However, generally unfavourable investment climates (including, for example, slow rates of economic reform, high levels of corruption, poor records of enforcing existing laws and agreements, etc.), great distances from world markets and landlocked locations appear to have generally deterred investment in other sectors. Some of these same factors also help to explain the low levels of foreign investment in other CIS countries including Russia,504 which has a huge natural resource base and great potential for foreign investment.505
Although a number of the factors discussed above appear individually to explain FDI inflows into the transition economies, they are in fact interrelated and it is doubtful that their separate contributions can be unravelled. The countries of central Europe (and the Baltics to a lesser extent) have benefited from their location, political history and initial economic conditions, which facilitated the early launching of economic reforms, the introduction of stabilization programmes and the achievement of political stability. These same factors also help to explain the development of various institutions (especially of the market supporting type), the relatively lower levels of corruption and the prospects for EU membership in the not too distant future. The confluence of all these factors, individually important to foreign investors, is likely to have created a virtuous circle of an improving investment climate, above average economic prospects and increasing FDI. Other transition countries, more distant from west European markets and with different political histories, have been less fortunate.
5.3 The development of FDI flows, 1990-2000 Foreign investment was generally prohibited during
the period of central planning. Only Hungary, Poland and Romania permitted some FDI (in the form of joint ventures) and the amounts involved were small. The former SFR of Yugoslavia, which was considered a mixed economy, received only modest foreign investment in the 1980s. From this low base, FDI in the transition economies increased at a modest pace in the early 1990s. In fact, with the exception of Hungary, inflows were generally disappointing, falling far short of
504 R. Ahrend, “Foreign direct investment into Russia - pain without
gain? A survey of foreign direct investors”, Russian Economic Trends, June 2000.
505 A major reason for Russia’s failure to attract much investment in the extractive sector is the lack of a comprehensive legal framework for production sharing agreements (PSAs) and protracted legislative procedures. UN/ECE, “A note on production sharing in Russia”, Economic Survey of Europe, 1998 No. 3, chap. 5.
194________________________________________________________________ Economic Survey of Europe, 2001 No. 1
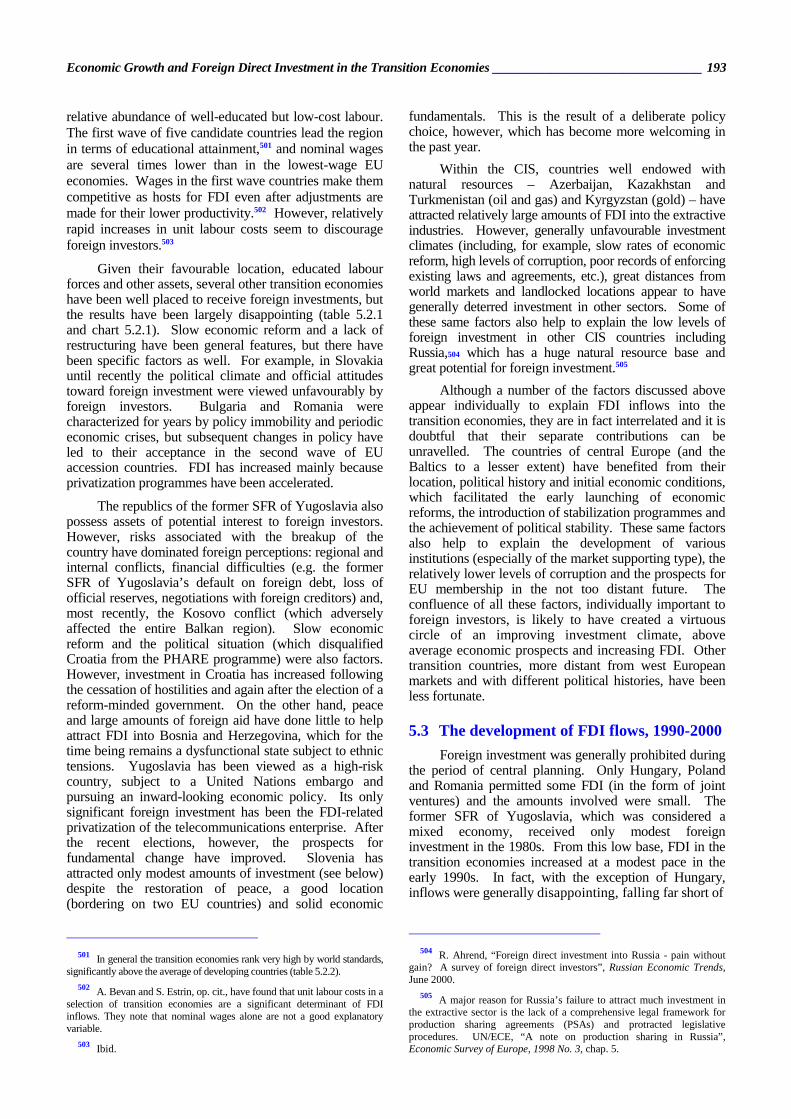
expectations.506 However, in the second half of the decade, FDI flows accelerated (table 5.2.1 and charts 5.2.1 and 5.3.1). In 1999 annual investments reached nearly $28 billion (4 per cent of GDP),507 and cumulated inflows amounted to some $130 billion. Preliminary data for 2000 suggest that annual FDI inflows continued to increase.508
Policy decisions in Hungary and Estonia gave them an early lead in attracting foreign investment. Their objective was to sell off state assets rapidly to foreign strategic investors and thus achieve increased economic efficiency and integration into world markets. In addition to Hungary, the Czech Republic509 and Poland began to attract relatively large inflows from the middle of the decade, resulting in a high concentration of FDI in these three countries: they accounted for two thirds of the total annual flow to the ECE transition economies in 1995. The subsequent acceleration of privatization and the generally improving investment climate in other transition economies boosted their FDI inflows and resulted in a somewhat more even geographical distribution. However, in 1999-2000 the concentration increased again, due to the fast pace of investment in the three leading countries. Other noteworthy developments in the second half of the 1990s were: • Poland became the main destination of FDI in 1996; • An acceleration of flows into Latvia and, with a lag,
into Lithuania (second wave countries), but their cumulative flows continue to lag behind those of Estonia;
• FDI in the Czech Republic surged following the passage of a new investment law in 1998 and accelerated privatization.510 For two years the country has received FDI amounting to around 10 per cent of GDP, one of the highest ratios in the ECE region;
• Accelerated privatization in Bulgaria, Romania and Croatia significantly boosted inflows in 1996-1999. The sale of the national telecom companies in the latter two countries markedly raised FDI in 1998 and 1999, respectively;
506 Early in the transition, some observers and policy makers expected
a rush of FDI, which would play a major role in creating market systems, restructuring economies and stimulating economic growth.
507 The interpretation of the indicators of FDI penetration (including FDI/gross domestic fixed capital formation) and the methodological issues surrounding them are discussed in box 5.3.1. It should be noted that the data for Poland (reported annually) are on an accrual and cash basis (tables 5.2.1 and 5.2.2), the accrual figures being somewhat higher than the cash figures (available monthly) published regularly in the Economic Survey of Europe.
508 Chap. 3.6 of this Survey. 509 Although Czech voucher privatization discouraged FDI in the
affected enterprises, there were several large privatizations (e.g. Skoda involving VW) and greenfield investments involving foreign investors.
510 According to R. Samek, a spokesperson for CzechInvest. Bureau of National Affairs (BNA), Eastern European Reporter, Vol. 10, No. 1 (London), January 2000.
CHART 5.3.1
Annual FDI inflows as a percentage of GDP, 1990-1999 (Per cent)
0
5
10
15
20
25
1990 1991 1992 1993 1994 1995 1996 1997 1998 1999
FDI/GDP(PPP) FDI/(GDP-nominal)
Eastern Europe
0
1
2
3
4
5
6
1990 1991 1992 1993 1994 1995 1996 1997 1998 1999
Baltic states
0
1
2
3
4
5
6
7
8
9
1990 1991 1992 1993 1994 1995 1996 1997 1998 1999
3 European CIS a
0
0.5
1
1.5
2
1990 1991 1992 1993 1994 1995 1996 1997 1998 1999
Asian CIS
0
1
2
3
4
5
6
1990 1991 1992 1993 1994 1995 1996 1997 1998 1999
Source: National balance of payments statistics; UN/ECE secretariat forGDP(PPP).
a Belarus, Republic of Moldova and Ukraine.
Economic Growth and Foreign Direct Investment in the Transition Economies ________________________________ 195
Box 5.3.1
FDI indicators and their interpretation Direct investment is a category of international investment that reflects the objective of a resident entity in one country (the “direct investor”) obtaining a lasting interest in an enterprise located in another country (the “direct or foreign investment enterprise”).1 A lasting interest implies the existence of a long-term relationship between the direct investor and the enterprise. A direct investment relationship is created when a foreign investor owns 10 per cent or more of the ordinary shares or voting power in the direct investment enterprise (incorporated or unincorporated).2
FDI in the balance of payments comprises three components:
• Equity: comprises equity in branches, all shares in subsidiaries and associates, and other capital contributions;
• Reinvested earnings: consist of the direct investor’s share (in proportion to direct equity participation) of earnings not distributed as dividends by subsidiaries and earnings of branches not remitted to the direct investor;
• Other direct investment capital: covers the borrowing and lending of funds between direct investors and subsidiaries, including both short- and long-term investments.
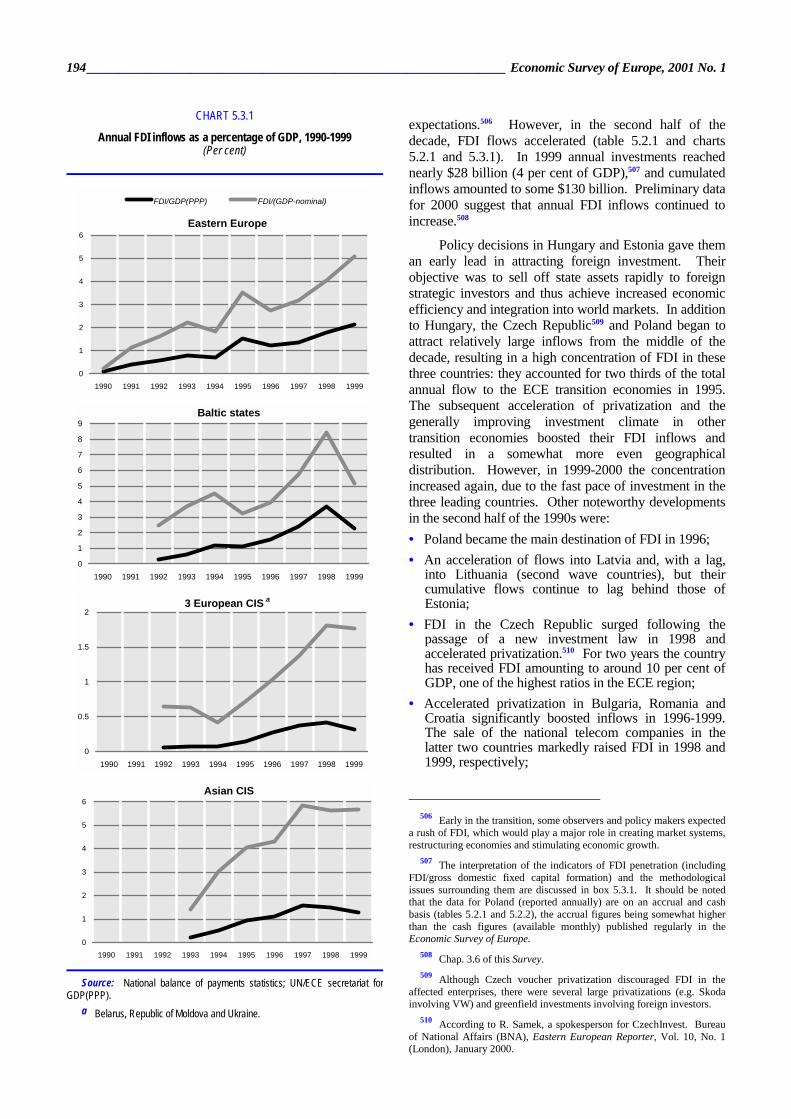
The transition economies have made good progress in reporting the components of FDI flows. By 1998, 12 of them reported reinvested earnings, several having done so for a number of years (see table below).3 When the decision to report earnings is made there is invariably a break in the series. In most cases, this is not serious because reinvested profits were previously small, given the relatively recent establishment of direct investment enterprises. However, several countries have reported to have, or are believed to have, reinvested earnings of over 10 per cent of current equity investments. For those countries, failure to include reinvested profits (and inter-company loans) in total annual and cumulative FDI flows means the latter are underestimated and that the international comparability of the statistics is impaired. The largest underestimate is likely to have occurred in Hungary where non-reported reinvested earnings are estimated to have reached 1.3 per cent of GDP in 1997.4
Balance of payments components of FDI in eastern Europe, the Baltic states and the CIS as reported by the IMF,a 1991-1998
Equity capital Reinvested
earnings Other capital Equity capital Reinvested
earnings Other capital
Albania ............................ 1992-1998 .. .. Armenia .......................... 1993-1998 1997-1998 1995; 1998 Bulgaria ........................... 1990-1998 1998 1997-1998 Azerbaijan ....................... 1995-1998 .. 1995-1998 Croatia ............................ .. .. .. Belarus ........................... 1993-1998 1997-1998 1996-1998 Czech Republic ............... 1993-1998 .. .. Georgia ........................... 1998 .. .. Hungary .......................... 1991-1998 .. 1996-1998 Kazakhstan ..................... 1995-1998 1996-1998 1995-1998 Poland b .......................... 1990-1998 1990-1998 1991-1998 Kyrgyzstan ...................... 1993-1998 1996-1998 1995-1998 Romania .......................... 1991-1998 .. .. Republic of Moldova ....... 1995-1998 1998 1995-1998 Slovakia .......................... 1994-1998 1995-1998 1995-1998 Russian Federation ........ 1997-1998 1998 1997-1998 Slovenia .......................... 1992-1998 .. .. Tajikistan ........................ .. .. .. The former Yugoslav Turkmenistan .................. 1996-1997 .. 1997 Republic of Macedonia .... 1996-1998 .. 1996-1997 Ukraine ........................... 1994-1998 c .. .. Estonia ............................ 1992-1998 1992-1998 1992-1998 Uzbekistan ...................... .. .. .. Latvia .............................. 1992-1998 1996-1998 1996-1998 Lithuania ......................... 1993-1998 1995-1998 1995-1998
Source: IMF, Balance of Payments Statistics Yearbook, Part 1: Country Tables (Washington, D.C.), 1999. a Year for which data are reported. b Accrual basis (annual data only). Coverage of data on a monthly cash basis is less comprehensive. c Total FDI.
Data on FDI inflows in the balance of payments generally begin in 1990, later for the CIS and the republics of the former SFR of Yugoslavia. Consequently any investments made prior to those dates are not reflected in the cumulative totals. For the reasons already mentioned, this is unlikely to be a problem except perhaps in Hungary and the republics of the former SFR of Yugoslavia.5
Three types of ratios are typically used in the analysis of inward FDI: the FDI/GDP ratio, calculated from annual flows; the ratio of cumulated annual FDI flows6 to GDP (using current year GDP); and the ratio of annual FDI flows to gross fixed capital formation. All three are measures of the penetration of FDI in the economy and give some idea of the potential economic impact of foreign investment.
The GDP statistic generally used in these ratios is calculated at current prices and exchange rates (nominal GDP). One of its shortcomings stems from differences in the degree of undervaluation of national currencies relative to the dollar and from the often large depreciations of nominal exchange rates which, for example, occurred in several transition economies following the 1997-1998 financial crises. A partial solution is to use dollar GDP estimates at PPP exchange rates.7 The latter raise the GDP of the transition economies, especially those of the CIS (whose exchange rates are the most undervalued). FDI/GDP ratios, including those based on GDP(PPP), are also sensitive to economic downturns, the resulting increases in the ratios implying (incorrectly) increases in FDI penetration. This is important because in some countries there have been falls in output from time to time, particularly in the early 1990s and again in 1997-1999.
196________________________________________________________________ Economic Survey of Europe, 2001 No. 1
• Azerbaijan, Kazakhstan and Turkmenistan (1994-1997) received relatively large investments in the natural resource extraction sectors;
• Changes in Slovak policy towards FDI were reflected in 2000 by the sale of Slovak Telecom (!1 billion) and the VSZ steelworks ($500 million plus $700 million in promised follow-up investments over 10 years).
The global financial crises of 1997-1998 had only a limited impact on foreign direct investment in the transition economies. In fact total inflows continued to rise, a reflection of both the long-term planning horizon of foreign direct investors and the more immediate opportunities presented by depressed asset prices. Foreign investors also remained interested in acquiring strategic assets, especially in telecommunications companies. However, FDI into Russia has fallen sharply in the wake of the rouble crisis, exacerbating a persistently unfavourable investment climate. Moreover, it has been reported that some new investments intended to supply the CIS market were postponed, particularly in the Baltic states. The Kosovo conflict also discouraged investment in south-east Europe, at least temporarily, but several key privatizations did go ahead.
Several major privatizations in 2000 (e.g. Poland=s TSPA for $4 billion; Slovak Telecom for !1 billion) show their continuing importance as a determinant of FDI. The
experiences of Hungary and Estonia indicate that the winding down of privatization programmes results in a fall of receipts. In most east European and Baltic states, these programmes are due to be completed in 2001-2002, but in other countries the process is much further behind.
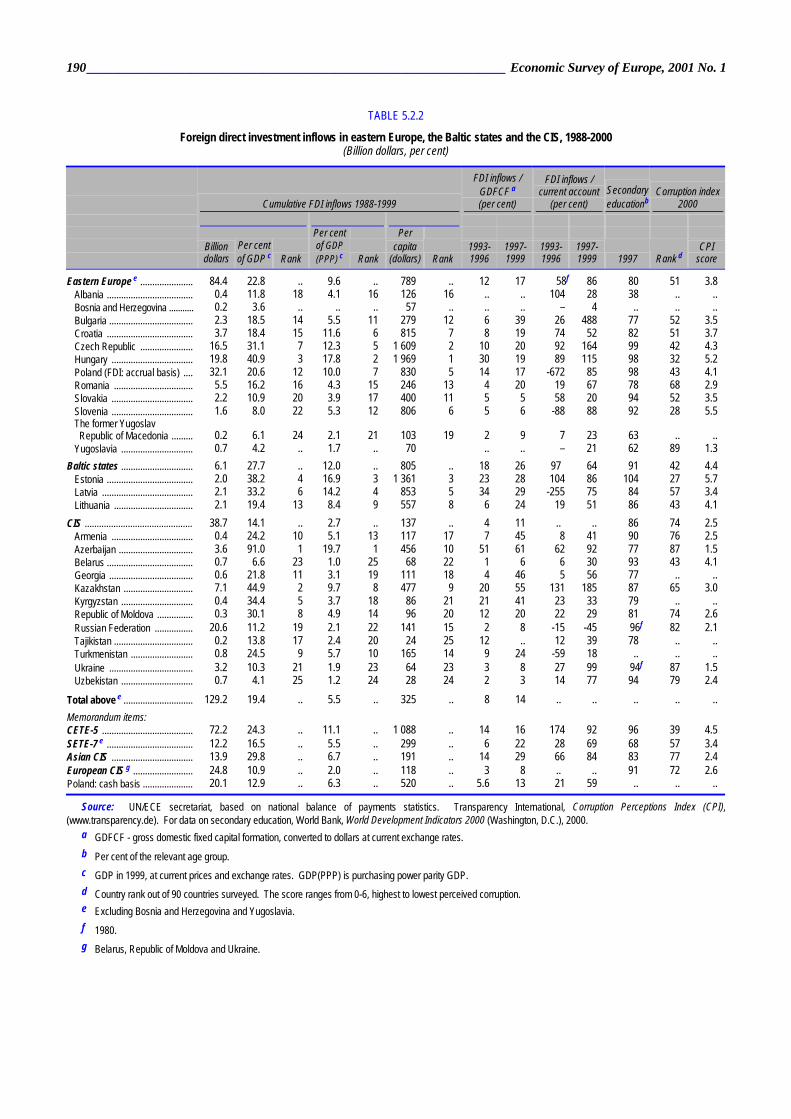
There are considerable differences in the amounts of FDI received by different transition economies. In 1999, the ratio of the cumulated inflows to GDP, a measure of the penetration of FDI in the host economy, was in the range of 30-40 per cent in the Czech Republic, Hungary,511 Estonia and Latvia compared with around 10 per cent or less in many other countries (chart 5.2.1). However, this indicator is calculated using the nominal GDP and exchange rate of the host country, which is often undervalued (box 5.3.1). The FDI ratios calculated with GDP estimates based on PPPs are shown in table 5.3.1 and chart 5.3.1.512 Although the regional average has increased from 0.5 per cent in 1993-1996 to 1 per cent in 1997-1999, the ranking of countries remained broadly similar. Several
511 Hungary leads in the rankings despite the fact that its cumulated
FDI is underestimated by the exclusion of reinvested profits (box 5.3.1). 512 These ratios are lower because of the adjustment for exchange rate
undervaluation. The inter-country variance is smaller than that of the ratios based on nominal GDP (also see table 5.2.2.)
Box 5.3.1 (concluded)
FDI indicators and their interpretation
A variant of these measures replaces GDP with the population, yielding per capita flows or stocks. Population can beestablished accurately over time, which facilitates cross-country comparisons (problems not entirely solved by measuring GDP in PPPs), and it eliminates the problem of economic downturns. However, since per capita incomes vary considerably betweencountries, population figures are not likely to provide an accurate measure of economic size. Table 5.2.2 contains FDI ratios calculated using GDP (nominal), GDP(PPP) and population and country rankings based on each indicator.
FDI indicators and their interpretation The FDI/domestic investment ratio is often analysed assuming (at least implicitly) that FDI contributes to local gross fixed capital formation. This can be justified if FDI inflows consist of capital goods in kindor if FDI cash flows are used to purchase capital equipment (as is typically the case with greenfield or follow-up investments in existing facilities). In both cases FDI increases the capital stock and productive capacity. The ratio loses this interpretationwhen FDI takes the form of mergers and acquisitions (M&As), which represent change in ownership rather than fixed investment. In many transition economies M&A activity has accounted for the bulk of FDI. The inter-company loan component of FDI may also be used for transactions other than the finance of capital goods (e.g. for financial speculation).8 As privatization comes to an end, FDI should increasingly reflect capital investment (as is already the case in Hungary and Estonia).
1 The term “foreign investment enterprise” is used throughout this chapter but the IMF manual refers to “direct investment enterprise”. 2 IMF, Balance of Payments Manual, Fifth Edition (Washington, D.C.), 1993. 3 By comparison, in 1991 only 11 industrial countries surveyed in the Godeaux Report compiled reinvested earnings. In 1997 an OECD
survey concluded that about three fourths of OECD countries reported reinvested earnings. OECD, “Foreign direct investment: survey ofimplementation of methodological standards”, Financial Market Trends (Paris), November 1998.
4 IMF, op. cit. 5 Slovenia is estimated to have inherited an FDI stock of $666 million which is not reflected in cumulated inflows. Estimates for the other
republics are not available. UNCTAD, World Investment Report, 1999: Foreign Direct Investment and the Challenge of Development (United Nations publication, Sales No. E.99.II.D.3).
6 Cumulated annual FDI inflows are a measure of the country’s stock of foreign assets. 7 UN/ECE, International Comparisons of Gross Domestic Product in Europe, 1996 (United Nations publication, Sales No. E.99.II.E.13). 8 M&As can still positively affect economic efficiency (independently of new investment) if they lead to better management, better integration in
global marketing networks, and so on.
Economic Growth and Foreign Direct Investment in the Transition Economies ________________________________ 197
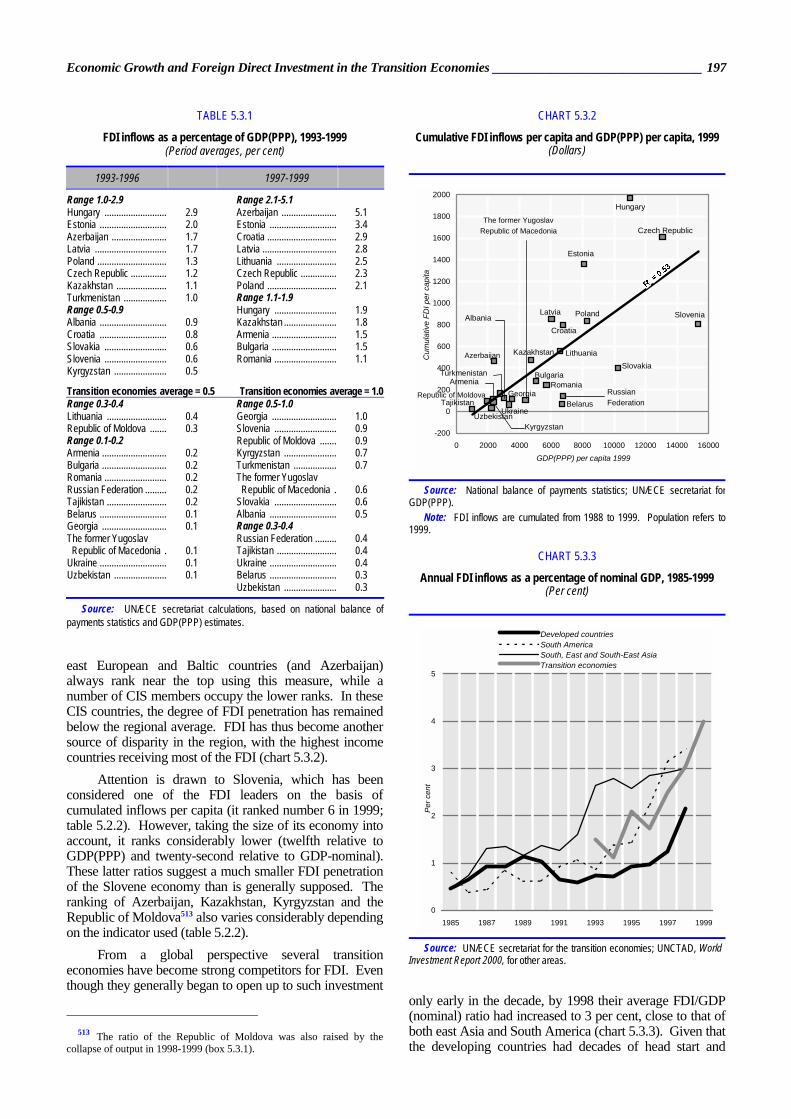
east European and Baltic countries (and Azerbaijan) always rank near the top using this measure, while a number of CIS members occupy the lower ranks. In these CIS countries, the degree of FDI penetration has remained below the regional average. FDI has thus become another source of disparity in the region, with the highest income countries receiving most of the FDI (chart 5.3.2).
Attention is drawn to Slovenia, which has been considered one of the FDI leaders on the basis of cumulated inflows per capita (it ranked number 6 in 1999; table 5.2.2). However, taking the size of its economy into account, it ranks considerably lower (twelfth relative to GDP(PPP) and twenty-second relative to GDP-nominal). These latter ratios suggest a much smaller FDI penetration of the Slovene economy than is generally supposed. The ranking of Azerbaijan, Kazakhstan, Kyrgyzstan and the Republic of Moldova513 also varies considerably depending on the indicator used (table 5.2.2).
From a global perspective several transition economies have become strong competitors for FDI. Even though they generally began to open up to such investment
513 The ratio of the Republic of Moldova was also raised by the
collapse of output in 1998-1999 (box 5.3.1).
only early in the decade, by 1998 their average FDI/GDP (nominal) ratio had increased to 3 per cent, close to that of both east Asia and South America (chart 5.3.3). Given that the developing countries had decades of head start and
TABLE 5.3.1
FDI inflows as a percentage of GDP(PPP), 1993-1999 (Period averages, per cent)
1993-1996 1997-1999
Range 1.0-2.9 Range 2.1-5.1 Hungary .......................... 2.9 Azerbaijan ....................... 5.1 Estonia ............................ 2.0 Estonia ............................ 3.4 Azerbaijan ....................... 1.7 Croatia ............................. 2.9 Latvia .............................. 1.7 Latvia ............................... 2.8 Poland ............................. 1.3 Lithuania ......................... 2.5 Czech Republic ............... 1.2 Czech Republic ............... 2.3 Kazakhstan ..................... 1.1 Poland ............................. 2.1 Turkmenistan .................. 1.0 Range 1.1-1.9 Range 0.5-0.9 Hungary .......................... 1.9 Albania ............................ 0.9 Kazakhstan ...................... 1.8 Croatia ............................ 0.8 Armenia ........................... 1.5 Slovakia .......................... 0.6 Bulgaria ........................... 1.5 Slovenia .......................... 0.6 Romania .......................... 1.1 Kyrgyzstan ...................... 0.5
Transition economies average = 0.5 Transition economies average = 1.0 Range 0.3-0.4 Range 0.5-1.0 Lithuania ......................... 0.4 Georgia ........................... 1.0 Republic of Moldova ....... 0.3 Slovenia .......................... 0.9 Range 0.1-0.2 Republic of Moldova ....... 0.9 Armenia ........................... 0.2 Kyrgyzstan ...................... 0.7 Bulgaria ........................... 0.2 Turkmenistan .................. 0.7 Romania .......................... 0.2 The former Yugoslav Russian Federation ......... 0.2 Republic of Macedonia . 0.6 Tajikistan ......................... 0.2 Slovakia .......................... 0.6 Belarus ............................ 0.1 Albania ............................ 0.5 Georgia ........................... 0.1 Range 0.3-0.4 The former Yugoslav Russian Federation ......... 0.4 Republic of Macedonia . 0.1 Tajikistan ......................... 0.4 Ukraine ............................ 0.1 Ukraine ............................ 0.4 Uzbekistan ...................... 0.1 Belarus ............................ 0.3 Uzbekistan ...................... 0.3
Source: UN/ECE secretariat calculations, based on national balance of payments statistics and GDP(PPP) estimates.
CHART 5.3.2
Cumulative FDI inflows per capita and GDP(PPP) per capita, 1999 (Dollars)
Hungary
Estonia
Latvia
Czech Republic
Croatia
Kazakhstan
Poland
Lithuania
Turkmenistan
BelarusTajikistan
Uzbekistan
Bulgaria
Slovenia
Slovakia
Armenia Romania
Albania
Kyrgyzstan
Georgia Russian Federation
Ukraine
-200
0
200
400
600
800
1000
1200
1400
1600
1800
2000
0 2000 4000 6000 8000 10000 12000 14000 16000GDP(PPP) per capita 1999
Cum
ulat
ive
FDI p
er c
apita
The former YugoslavRepublic of Macedonia
Azerbaijan
Republic of Moldova
Source: National balance of payments statistics; UN/ECE secretariat for GDP(PPP).
Note: FDI inflows are cumulated from 1988 to 1999. Population refers to 1999.
CHART 5.3.3
Annual FDI inflows as a percentage of nominal GDP, 1985-1999 (Per cent)
0
1
2
3
4
5
1985 1987 1989 1991 1993 1995 1997 1999
Per c
ent
Developed countriesSouth AmericaSouth, East and South-East AsiaTransition economies
Source: UN/ECE secretariat for the transition economies; UNCTAD, World Investment Report 2000, for other areas.
198________________________________________________________________ Economic Survey of Europe, 2001 No. 1
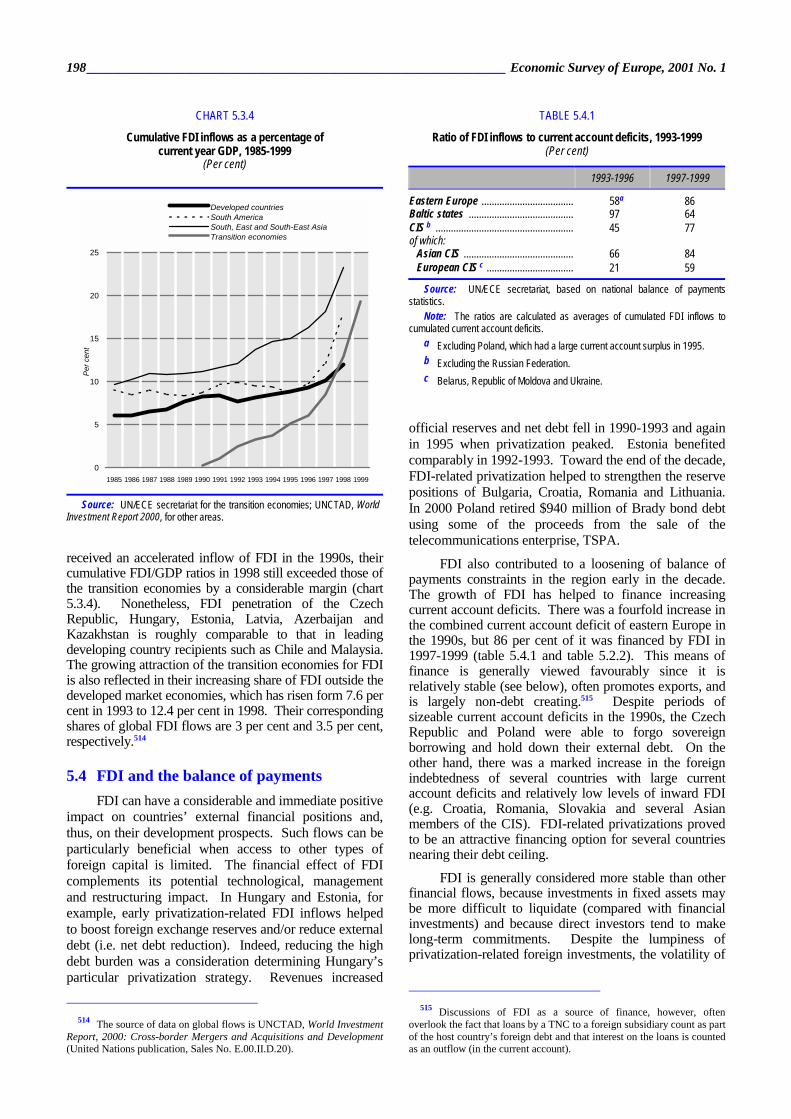
received an accelerated inflow of FDI in the 1990s, their cumulative FDI/GDP ratios in 1998 still exceeded those of the transition economies by a considerable margin (chart 5.3.4). Nonetheless, FDI penetration of the Czech Republic, Hungary, Estonia, Latvia, Azerbaijan and Kazakhstan is roughly comparable to that in leading developing country recipients such as Chile and Malaysia. The growing attraction of the transition economies for FDI is also reflected in their increasing share of FDI outside the developed market economies, which has risen form 7.6 per cent in 1993 to 12.4 per cent in 1998. Their corresponding shares of global FDI flows are 3 per cent and 3.5 per cent, respectively.514
5.4 FDI and the balance of payments FDI can have a considerable and immediate positive
impact on countries’ external financial positions and, thus, on their development prospects. Such flows can be particularly beneficial when access to other types of foreign capital is limited. The financial effect of FDI complements its potential technological, management and restructuring impact. In Hungary and Estonia, for example, early privatization-related FDI inflows helped to boost foreign exchange reserves and/or reduce external debt (i.e. net debt reduction). Indeed, reducing the high debt burden was a consideration determining Hungary’s particular privatization strategy. Revenues increased
514 The source of data on global flows is UNCTAD, World Investment
Report, 2000: Cross-border Mergers and Acquisitions and Development (United Nations publication, Sales No. E.00.II.D.20).
official reserves and net debt fell in 1990-1993 and again in 1995 when privatization peaked. Estonia benefited comparably in 1992-1993. Toward the end of the decade, FDI-related privatization helped to strengthen the reserve positions of Bulgaria, Croatia, Romania and Lithuania. In 2000 Poland retired $940 million of Brady bond debt using some of the proceeds from the sale of the telecommunications enterprise, TSPA.
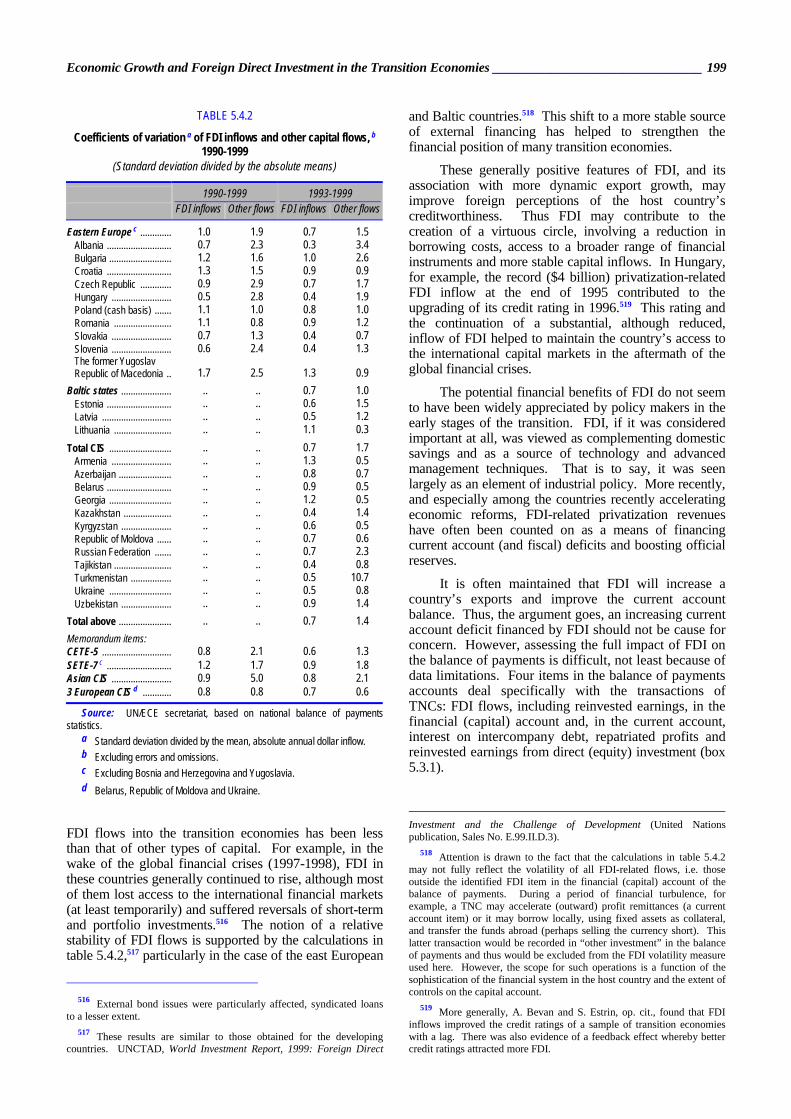
FDI also contributed to a loosening of balance of payments constraints in the region early in the decade. The growth of FDI has helped to finance increasing current account deficits. There was a fourfold increase in the combined current account deficit of eastern Europe in the 1990s, but 86 per cent of it was financed by FDI in 1997-1999 (table 5.4.1 and table 5.2.2). This means of finance is generally viewed favourably since it is relatively stable (see below), often promotes exports, and is largely non-debt creating.515 Despite periods of sizeable current account deficits in the 1990s, the Czech Republic and Poland were able to forgo sovereign borrowing and hold down their external debt. On the other hand, there was a marked increase in the foreign indebtedness of several countries with large current account deficits and relatively low levels of inward FDI (e.g. Croatia, Romania, Slovakia and several Asian members of the CIS). FDI-related privatizations proved to be an attractive financing option for several countries nearing their debt ceiling.
FDI is generally considered more stable than other financial flows, because investments in fixed assets may be more difficult to liquidate (compared with financial investments) and because direct investors tend to make long-term commitments. Despite the lumpiness of privatization-related foreign investments, the volatility of
515 Discussions of FDI as a source of finance, however, often
overlook the fact that loans by a TNC to a foreign subsidiary count as part of the host country’s foreign debt and that interest on the loans is counted as an outflow (in the current account).
CHART 5.3.4
Cumulative FDI inflows as a percentage of current year GDP, 1985-1999
(Per cent)
0
5
10
15
20
25
1985 1986 1987 1988 1989 1990 1991 1992 1993 1994 1995 1996 1997 1998 1999
Per c
ent
Developed countriesSouth AmericaSouth, East and South-East AsiaTransition economies
Source: UN/ECE secretariat for the transition economies; UNCTAD, World Investment Report 2000, for other areas.
TABLE 5.4.1
Ratio of FDI inflows to current account deficits, 1993-1999 (Per cent)
1993-1996 1997-1999
Eastern Europe .................................... 58a 86 Baltic states ......................................... 97 64 CIS b ...................................................... 45 77 of which:
Asian CIS ........................................... 66 84 European CIS c .................................. 21 59
Source: UN/ECE secretariat, based on national balance of payments statistics.
Note: The ratios are calculated as averages of cumulated FDI inflows to cumulated current account deficits.
a Excluding Poland, which had a large current account surplus in 1995. b Excluding the Russian Federation. c Belarus, Republic of Moldova and Ukraine.
Economic Growth and Foreign Direct Investment in the Transition Economies ________________________________ 199
FDI flows into the transition economies has been less than that of other types of capital. For example, in the wake of the global financial crises (1997-1998), FDI in these countries generally continued to rise, although most of them lost access to the international financial markets (at least temporarily) and suffered reversals of short-term and portfolio investments.516 The notion of a relative stability of FDI flows is supported by the calculations in table 5.4.2,517 particularly in the case of the east European
516 External bond issues were particularly affected, syndicated loans
to a lesser extent. 517 These results are similar to those obtained for the developing
countries. UNCTAD, World Investment Report, 1999: Foreign Direct
and Baltic countries.518 This shift to a more stable source of external financing has helped to strengthen the financial position of many transition economies.
These generally positive features of FDI, and its association with more dynamic export growth, may improve foreign perceptions of the host country’s creditworthiness. Thus FDI may contribute to the creation of a virtuous circle, involving a reduction in borrowing costs, access to a broader range of financial instruments and more stable capital inflows. In Hungary, for example, the record ($4 billion) privatization-related FDI inflow at the end of 1995 contributed to the upgrading of its credit rating in 1996.519 This rating and the continuation of a substantial, although reduced, inflow of FDI helped to maintain the country’s access to the international capital markets in the aftermath of the global financial crises.
The potential financial benefits of FDI do not seem to have been widely appreciated by policy makers in the early stages of the transition. FDI, if it was considered important at all, was viewed as complementing domestic savings and as a source of technology and advanced management techniques. That is to say, it was seen largely as an element of industrial policy. More recently, and especially among the countries recently accelerating economic reforms, FDI-related privatization revenues have often been counted on as a means of financing current account (and fiscal) deficits and boosting official reserves.
It is often maintained that FDI will increase a country’s exports and improve the current account balance. Thus, the argument goes, an increasing current account deficit financed by FDI should not be cause for concern. However, assessing the full impact of FDI on the balance of payments is difficult, not least because of data limitations. Four items in the balance of payments accounts deal specifically with the transactions of TNCs: FDI flows, including reinvested earnings, in the financial (capital) account and, in the current account, interest on intercompany debt, repatriated profits and reinvested earnings from direct (equity) investment (box 5.3.1).
Investment and the Challenge of Development (United Nations publication, Sales No. E.99.II.D.3).
518 Attention is drawn to the fact that the calculations in table 5.4.2 may not fully reflect the volatility of all FDI-related flows, i.e. those outside the identified FDI item in the financial (capital) account of the balance of payments. During a period of financial turbulence, for example, a TNC may accelerate (outward) profit remittances (a current account item) or it may borrow locally, using fixed assets as collateral, and transfer the funds abroad (perhaps selling the currency short). This latter transaction would be recorded in “other investment” in the balance of payments and thus would be excluded from the FDI volatility measure used here. However, the scope for such operations is a function of the sophistication of the financial system in the host country and the extent of controls on the capital account.
519 More generally, A. Bevan and S. Estrin, op. cit., found that FDI inflows improved the credit ratings of a sample of transition economies with a lag. There was also evidence of a feedback effect whereby better credit ratings attracted more FDI.
TABLE 5.4.2
Coefficients of variation a of FDI inflows and other capital flows, b
1990-1999 (Standard deviation divided by the absolute means)
1990-1999 1993-1999 FDI inflows Other flows FDI inflows Other flows
Eastern Europe c ............. 1.0 1.9 0.7 1.5 Albania ........................... 0.7 2.3 0.3 3.4 Bulgaria .......................... 1.2 1.6 1.0 2.6 Croatia ........................... 1.3 1.5 0.9 0.9 Czech Republic ............. 0.9 2.9 0.7 1.7 Hungary ......................... 0.5 2.8 0.4 1.9 Poland (cash basis) ....... 1.1 1.0 0.8 1.0 Romania ........................ 1.1 0.8 0.9 1.2 Slovakia ......................... 0.7 1.3 0.4 0.7 Slovenia ......................... 0.6 2.4 0.4 1.3 The former Yugoslav Republic of Macedonia .. 1.7 2.5 1.3 0.9
Baltic states ..................... .. .. 0.7 1.0 Estonia ........................... .. .. 0.6 1.5 Latvia ............................. .. .. 0.5 1.2 Lithuania ........................ .. .. 1.1 0.3
Total CIS .......................... .. .. 0.7 1.7 Armenia ......................... .. .. 1.3 0.5 Azerbaijan ...................... .. .. 0.8 0.7 Belarus ........................... .. .. 0.9 0.5 Georgia .......................... .. .. 1.2 0.5 Kazakhstan .................... .. .. 0.4 1.4 Kyrgyzstan ..................... .. .. 0.6 0.5 Republic of Moldova ...... .. .. 0.7 0.6 Russian Federation ....... .. .. 0.7 2.3 Tajikistan ........................ .. .. 0.4 0.8 Turkmenistan ................. .. .. 0.5 10.7 Ukraine .......................... .. .. 0.5 0.8 Uzbekistan ..................... .. .. 0.9 1.4
Total above ...................... .. .. 0.7 1.4 Memorandum items: CETE-5 ............................. 0.8 2.1 0.6 1.3 SETE-7 c ........................... 1.2 1.7 0.9 1.8 Asian CIS ......................... 0.9 5.0 0.8 2.1 3 European CIS d ............ 0.8 0.8 0.7 0.6
Source: UN/ECE secretariat, based on national balance of payments statistics.
a Standard deviation divided by the mean, absolute annual dollar inflow. b Excluding errors and omissions. c Excluding Bosnia and Herzegovina and Yugoslavia. d Belarus, Republic of Moldova and Ukraine.
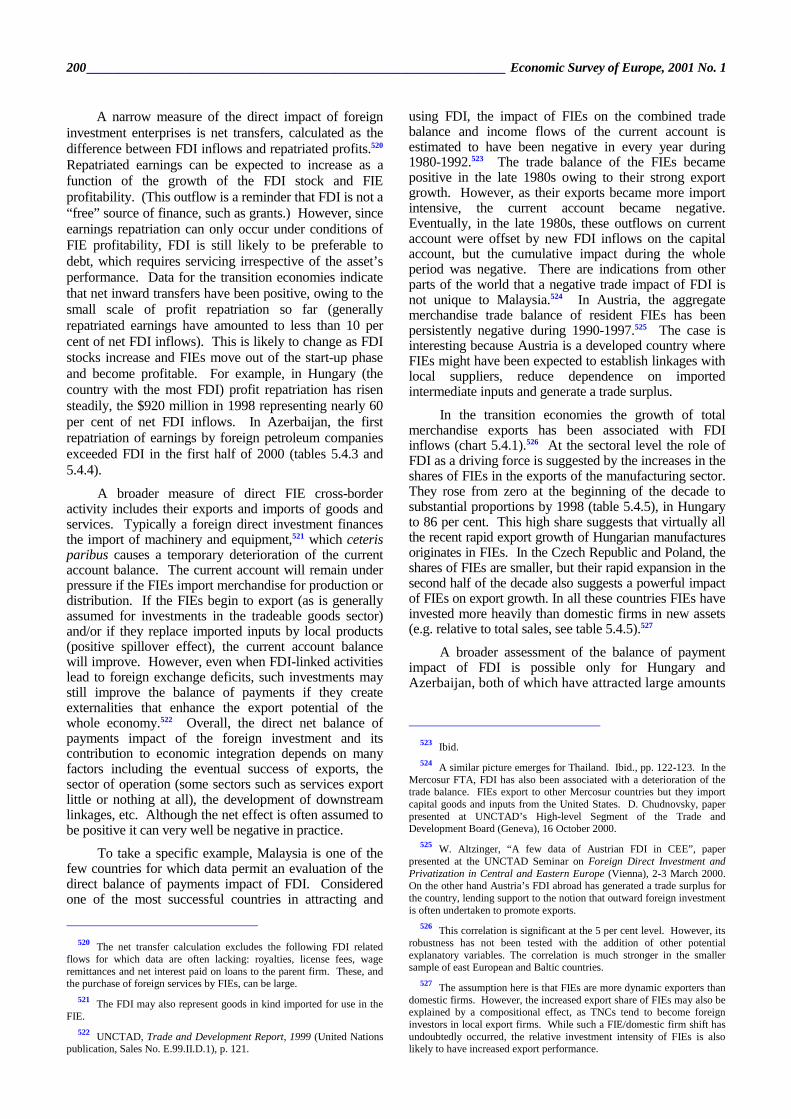
200________________________________________________________________ Economic Survey of Europe, 2001 No. 1
A narrow measure of the direct impact of foreign investment enterprises is net transfers, calculated as the difference between FDI inflows and repatriated profits.520 Repatriated earnings can be expected to increase as a function of the growth of the FDI stock and FIE profitability. (This outflow is a reminder that FDI is not a “free” source of finance, such as grants.) However, since earnings repatriation can only occur under conditions of FIE profitability, FDI is still likely to be preferable to debt, which requires servicing irrespective of the asset’s performance. Data for the transition economies indicate that net inward transfers have been positive, owing to the small scale of profit repatriation so far (generally repatriated earnings have amounted to less than 10 per cent of net FDI inflows). This is likely to change as FDI stocks increase and FIEs move out of the start-up phase and become profitable. For example, in Hungary (the country with the most FDI) profit repatriation has risen steadily, the $920 million in 1998 representing nearly 60 per cent of net FDI inflows. In Azerbaijan, the first repatriation of earnings by foreign petroleum companies exceeded FDI in the first half of 2000 (tables 5.4.3 and 5.4.4).
A broader measure of direct FIE cross-border activity includes their exports and imports of goods and services. Typically a foreign direct investment finances the import of machinery and equipment,521 which ceteris paribus causes a temporary deterioration of the current account balance. The current account will remain under pressure if the FIEs import merchandise for production or distribution. If the FIEs begin to export (as is generally assumed for investments in the tradeable goods sector) and/or if they replace imported inputs by local products (positive spillover effect), the current account balance will improve. However, even when FDI-linked activities lead to foreign exchange deficits, such investments may still improve the balance of payments if they create externalities that enhance the export potential of the whole economy.522 Overall, the direct net balance of payments impact of the foreign investment and its contribution to economic integration depends on many factors including the eventual success of exports, the sector of operation (some sectors such as services export little or nothing at all), the development of downstream linkages, etc. Although the net effect is often assumed to be positive it can very well be negative in practice.
To take a specific example, Malaysia is one of the few countries for which data permit an evaluation of the direct balance of payments impact of FDI. Considered one of the most successful countries in attracting and
520 The net transfer calculation excludes the following FDI related
flows for which data are often lacking: royalties, license fees, wage remittances and net interest paid on loans to the parent firm. These, and the purchase of foreign services by FIEs, can be large.
521 The FDI may also represent goods in kind imported for use in the FIE.
522 UNCTAD, Trade and Development Report, 1999 (United Nations publication, Sales No. E.99.II.D.1), p. 121.
using FDI, the impact of FIEs on the combined trade balance and income flows of the current account is estimated to have been negative in every year during 1980-1992.523 The trade balance of the FIEs became positive in the late 1980s owing to their strong export growth. However, as their exports became more import intensive, the current account became negative. Eventually, in the late 1980s, these outflows on current account were offset by new FDI inflows on the capital account, but the cumulative impact during the whole period was negative. There are indications from other parts of the world that a negative trade impact of FDI is not unique to Malaysia.524 In Austria, the aggregate merchandise trade balance of resident FIEs has been persistently negative during 1990-1997.525 The case is interesting because Austria is a developed country where FIEs might have been expected to establish linkages with local suppliers, reduce dependence on imported intermediate inputs and generate a trade surplus.
In the transition economies the growth of total merchandise exports has been associated with FDI inflows (chart 5.4.1).526 At the sectoral level the role of FDI as a driving force is suggested by the increases in the shares of FIEs in the exports of the manufacturing sector. They rose from zero at the beginning of the decade to substantial proportions by 1998 (table 5.4.5), in Hungary to 86 per cent. This high share suggests that virtually all the recent rapid export growth of Hungarian manufactures originates in FIEs. In the Czech Republic and Poland, the shares of FIEs are smaller, but their rapid expansion in the second half of the decade also suggests a powerful impact of FIEs on export growth. In all these countries FIEs have invested more heavily than domestic firms in new assets (e.g. relative to total sales, see table 5.4.5).527
A broader assessment of the balance of payment impact of FDI is possible only for Hungary and Azerbaijan, both of which have attracted large amounts
523 Ibid. 524 A similar picture emerges for Thailand. Ibid., pp. 122-123. In the
Mercosur FTA, FDI has also been associated with a deterioration of the trade balance. FIEs export to other Mercosur countries but they import capital goods and inputs from the United States. D. Chudnovsky, paper presented at UNCTAD’s High-level Segment of the Trade and Development Board (Geneva), 16 October 2000.
525 W. Altzinger, “A few data of Austrian FDI in CEE”, paper presented at the UNCTAD Seminar on Foreign Direct Investment and Privatization in Central and Eastern Europe (Vienna), 2-3 March 2000. On the other hand Austria’s FDI abroad has generated a trade surplus for the country, lending support to the notion that outward foreign investment is often undertaken to promote exports.
526 This correlation is significant at the 5 per cent level. However, its robustness has not been tested with the addition of other potential explanatory variables. The correlation is much stronger in the smaller sample of east European and Baltic countries.
527 The assumption here is that FIEs are more dynamic exporters than domestic firms. However, the increased export share of FIEs may also be explained by a compositional effect, as TNCs tend to become foreign investors in local export firms. While such a FIE/domestic firm shift has undoubtedly occurred, the relative investment intensity of FIEs is also likely to have increased export performance.
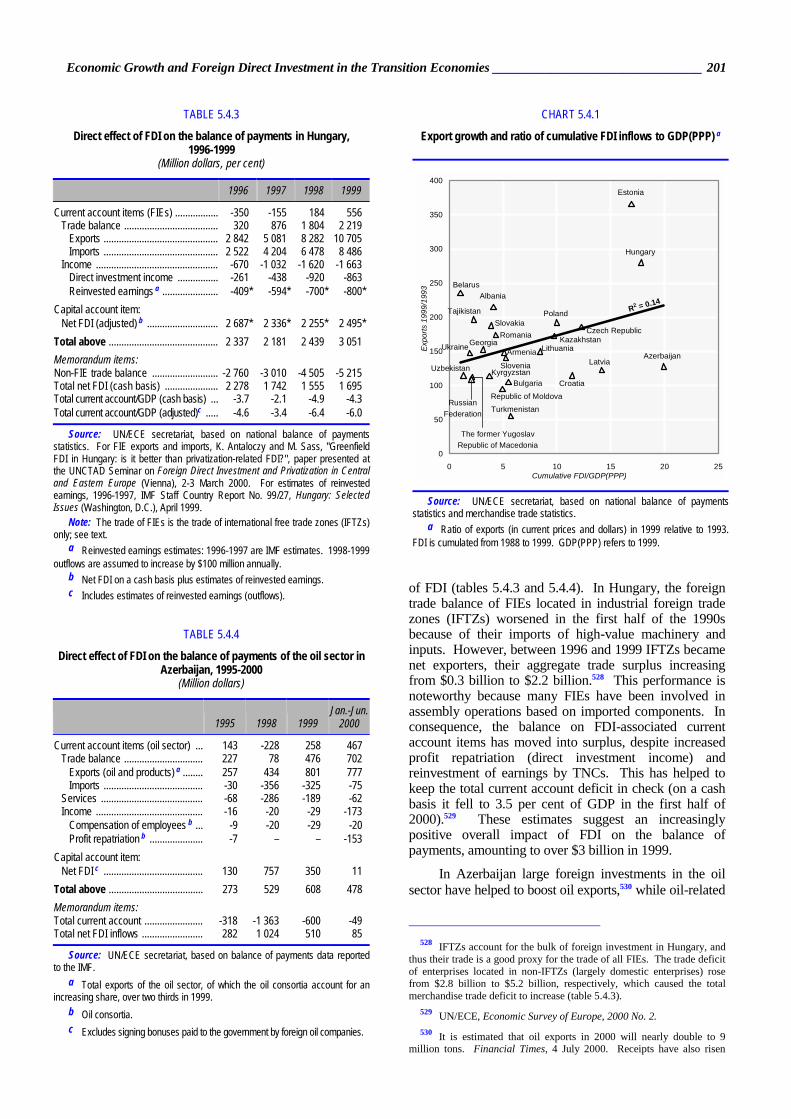
Economic Growth and Foreign Direct Investment in the Transition Economies ________________________________ 201
of FDI (tables 5.4.3 and 5.4.4). In Hungary, the foreign trade balance of FIEs located in industrial foreign trade zones (IFTZs) worsened in the first half of the 1990s because of their imports of high-value machinery and inputs. However, between 1996 and 1999 IFTZs became net exporters, their aggregate trade surplus increasing from $0.3 billion to $2.2 billion.528 This performance is noteworthy because many FIEs have been involved in assembly operations based on imported components. In consequence, the balance on FDI-associated current account items has moved into surplus, despite increased profit repatriation (direct investment income) and reinvestment of earnings by TNCs. This has helped to keep the total current account deficit in check (on a cash basis it fell to 3.5 per cent of GDP in the first half of 2000).529 These estimates suggest an increasingly positive overall impact of FDI on the balance of payments, amounting to over $3 billion in 1999.
In Azerbaijan large foreign investments in the oil sector have helped to boost oil exports,530 while oil-related
528 IFTZs account for the bulk of foreign investment in Hungary, and
thus their trade is a good proxy for the trade of all FIEs. The trade deficit of enterprises located in non-IFTZs (largely domestic enterprises) rose from $2.8 billion to $5.2 billion, respectively, which caused the total merchandise trade deficit to increase (table 5.4.3).
529 UN/ECE, Economic Survey of Europe, 2000 No. 2. 530 It is estimated that oil exports in 2000 will nearly double to 9
million tons. Financial Times, 4 July 2000. Receipts have also risen
TABLE 5.4.3
Direct effect of FDI on the balance of payments in Hungary, 1996-1999
(Million dollars, per cent)
1996 1997 1998 1999
Current account items (FIEs) ................. -350 -155 184 556 Trade balance ..................................... 320 876 1 804 2 219
Exports ............................................. 2 842 5 081 8 282 10 705 Imports ............................................. 2 522 4 204 6 478 8 486
Income ................................................ -670 -1 032 -1 620 -1 663 Direct investment income ................ -261 -438 -920 -863 Reinvested earnings a ...................... -409* -594* -700* -800*
Capital account item: Net FDI (adjusted) b ............................ 2 687* 2 336* 2 255* 2 495*
Total above ........................................... 2 337 2 181 2 439 3 051 Memorandum items: Non-FIE trade balance .......................... -2 760 -3 010 -4 505 -5 215 Total net FDI (cash basis) ..................... 2 278 1 742 1 555 1 695 Total current account/GDP (cash basis) ... -3.7 -2.1 -4.9 -4.3 Total current account/GDP (adjusted)c ..... -4.6 -3.4 -6.4 -6.0
Source: UN/ECE secretariat, based on national balance of payments statistics. For FIE exports and imports, K. Antaloczy and M. Sass, "Greenfield FDI in Hungary: is it better than privatization-related FDI?", paper presented at the UNCTAD Seminar on Foreign Direct Investment and Privatization in Central and Eastern Europe (Vienna), 2-3 March 2000. For estimates of reinvested earnings, 1996-1997, IMF Staff Country Report No. 99/27, Hungary: Selected Issues (Washington, D.C.), April 1999.
Note: The trade of FIEs is the trade of international free trade zones (IFTZs) only; see text.
a Reinvested earnings estimates: 1996-1997 are IMF estimates. 1998-1999 outflows are assumed to increase by $100 million annually.
b Net FDI on a cash basis plus estimates of reinvested earnings. c Includes estimates of reinvested earnings (outflows).
TABLE 5.4.4
Direct effect of FDI on the balance of payments of the oil sector in Azerbaijan, 1995-2000
(Million dollars)
1995 1998 1999 Jan.-Jun.
2000
Current account items (oil sector) ... 143 -228 258 467 Trade balance ............................... 227 78 476 702
Exports (oil and products) a ........ 257 434 801 777 Imports ....................................... -30 -356 -325 -75
Services ........................................ -68 -286 -189 -62 Income .......................................... -16 -20 -29 -173
Compensation of employees b ... -9 -20 -29 -20 Profit repatriation b ..................... -7 – – -153
Capital account item: Net FDI c ....................................... 130 757 350 11
Total above ..................................... 273 529 608 478 Memorandum items: Total current account ....................... -318 -1 363 -600 -49 Total net FDI inflows ........................ 282 1 024 510 85
Source: UN/ECE secretariat, based on balance of payments data reported to the IMF.
a Total exports of the oil sector, of which the oil consortia account for an increasing share, over two thirds in 1999.
b Oil consortia. c Excludes signing bonuses paid to the government by foreign oil companies.
CHART 5.4.1
Export growth and ratio of cumulative FDI inflows to GDP(PPP) a
Ukraine
Russian Federation
Georgia
Belarus
Kyrgyzstan
Albania
Romania
Armenia
Slovakia
Slovenia
Bulgaria
Uzbekistan
Tajikistan
Azerbaijan
Turkmenistan
Lithuania
Poland
Kazakhstan
Croatia
Czech Republic
Latvia
Estonia
Hungary
R2 = 0.14
0
50
100
150
200
250
300
350
400
0 5 10 15 20 25Cumulative FDI/GDP(PPP)
Expo
rts 1
999/
1993
The former YugoslavRepublic of Macedonia
Republic of Moldova
Source: UN/ECE secretariat, based on national balance of payments statistics and merchandise trade statistics.
a Ratio of exports (in current prices and dollars) in 1999 relative to 1993. FDI is cumulated from 1988 to 1999. GDP(PPP) refers to 1999.
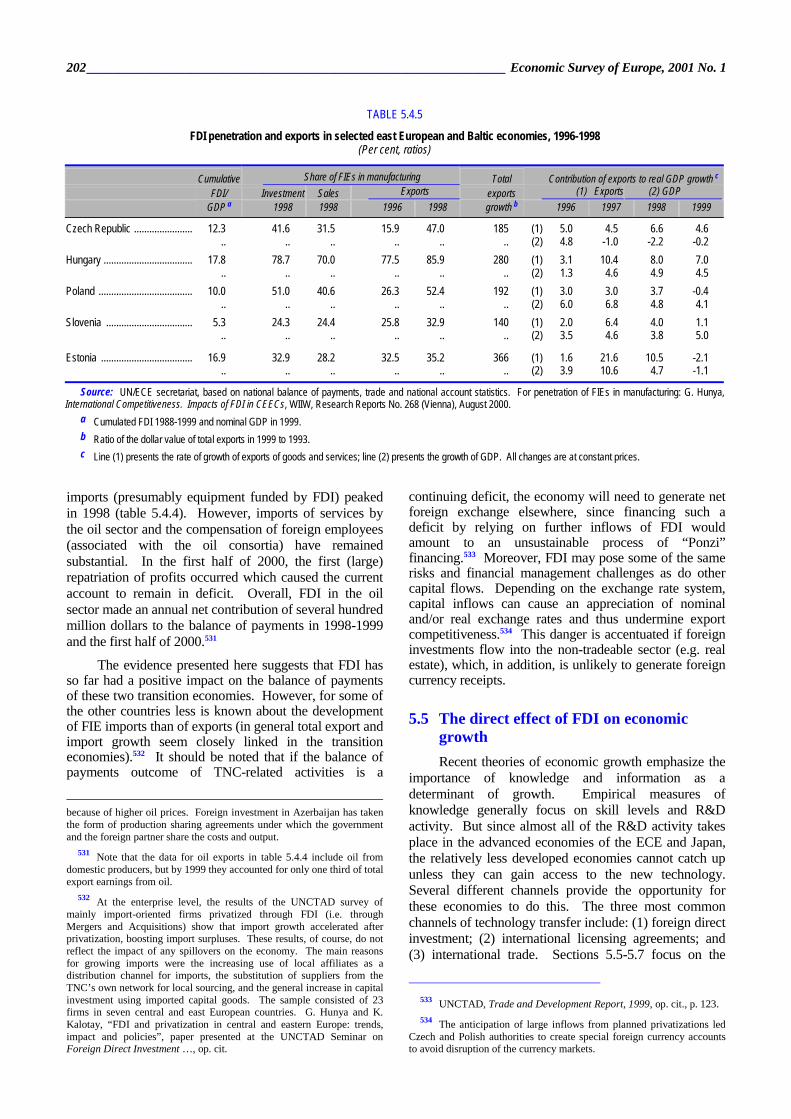
202________________________________________________________________ Economic Survey of Europe, 2001 No. 1
imports (presumably equipment funded by FDI) peaked in 1998 (table 5.4.4). However, imports of services by the oil sector and the compensation of foreign employees (associated with the oil consortia) have remained substantial. In the first half of 2000, the first (large) repatriation of profits occurred which caused the current account to remain in deficit. Overall, FDI in the oil sector made an annual net contribution of several hundred million dollars to the balance of payments in 1998-1999 and the first half of 2000.531
The evidence presented here suggests that FDI has so far had a positive impact on the balance of payments of these two transition economies. However, for some of the other countries less is known about the development of FIE imports than of exports (in general total export and import growth seem closely linked in the transition economies).532 It should be noted that if the balance of payments outcome of TNC-related activities is a
because of higher oil prices. Foreign investment in Azerbaijan has taken the form of production sharing agreements under which the government and the foreign partner share the costs and output.
531 Note that the data for oil exports in table 5.4.4 include oil from domestic producers, but by 1999 they accounted for only one third of total export earnings from oil.
532 At the enterprise level, the results of the UNCTAD survey of mainly import-oriented firms privatized through FDI (i.e. through Mergers and Acquisitions) show that import growth accelerated after privatization, boosting import surpluses. These results, of course, do not reflect the impact of any spillovers on the economy. The main reasons for growing imports were the increasing use of local affiliates as a distribution channel for imports, the substitution of suppliers from the TNC’s own network for local sourcing, and the general increase in capital investment using imported capital goods. The sample consisted of 23 firms in seven central and east European countries. G. Hunya and K. Kalotay, “FDI and privatization in central and eastern Europe: trends, impact and policies”, paper presented at the UNCTAD Seminar on Foreign Direct Investment …, op. cit.
continuing deficit, the economy will need to generate net foreign exchange elsewhere, since financing such a deficit by relying on further inflows of FDI would amount to an unsustainable process of “Ponzi” financing.533 Moreover, FDI may pose some of the same risks and financial management challenges as do other capital flows. Depending on the exchange rate system, capital inflows can cause an appreciation of nominal and/or real exchange rates and thus undermine export competitiveness.534 This danger is accentuated if foreign investments flow into the non-tradeable sector (e.g. real estate), which, in addition, is unlikely to generate foreign currency receipts.
5.5 The direct effect of FDI on economic growth Recent theories of economic growth emphasize the
importance of knowledge and information as a determinant of growth. Empirical measures of knowledge generally focus on skill levels and R&D activity. But since almost all of the R&D activity takes place in the advanced economies of the ECE and Japan, the relatively less developed economies cannot catch up unless they can gain access to the new technology. Several different channels provide the opportunity for these economies to do this. The three most common channels of technology transfer include: (1) foreign direct investment; (2) international licensing agreements; and (3) international trade. Sections 5.5-5.7 focus on the
533 UNCTAD, Trade and Development Report, 1999, op. cit., p. 123. 534 The anticipation of large inflows from planned privatizations led
Czech and Polish authorities to create special foreign currency accounts to avoid disruption of the currency markets.
TABLE 5.4.5
FDI penetration and exports in selected east European and Baltic economies, 1996-1998 (Per cent, ratios)
Cumulative Share of FIEs in manufacturing Total Contribution of exports to real GDP growth c FDI/ Investment Sales Exports exports (1) Exports (2) GDP GDP a 1998 1998 1996 1998 growth b 1996 1997 1998 1999
Czech Republic ....................... 12.3 41.6 31.5 15.9 47.0 185 (1) 5.0 4.5 6.6 4.6 .. .. .. .. .. .. (2) 4.8 -1.0 -2.2 -0.2 Hungary ................................... 17.8 78.7 70.0 77.5 85.9 280 (1) 3.1 10.4 8.0 7.0 .. .. .. .. .. .. (2) 1.3 4.6 4.9 4.5 Poland ..................................... 10.0 51.0 40.6 26.3 52.4 192 (1) 3.0 3.0 3.7 -0.4 .. .. .. .. .. .. (2) 6.0 6.8 4.8 4.1 Slovenia .................................. 5.3 24.3 24.4 25.8 32.9 140 (1) 2.0 6.4 4.0 1.1 .. .. .. .. .. .. (2) 3.5 4.6 3.8 5.0
Estonia .................................... 16.9 32.9 28.2 32.5 35.2 366 (1) 1.6 21.6 10.5 -2.1 .. .. .. .. .. .. (2) 3.9 10.6 4.7 -1.1
Source: UN/ECE secretariat, based on national balance of payments, trade and national account statistics. For penetration of FIEs in manufacturing: G. Hunya, International Competitiveness. Impacts of FDI in CEECs, WIIW, Research Reports No. 268 (Vienna), August 2000.
a Cumulated FDI 1988-1999 and nominal GDP in 1999. b Ratio of the dollar value of total exports in 1999 to 1993. c Line (1) presents the rate of growth of exports of goods and services; line (2) presents the growth of GDP. All changes are at constant prices.
Economic Growth and Foreign Direct Investment in the Transition Economies ________________________________ 203
importance of FDI in transferring knowledge and stimulating economic growth. The remaining parts of this section look at the direct relationship between FDI and economic growth. Section 5.6 expands this analysis to include technology transfer and spillovers. The issue of catching up is then explored in section 5.7.
(i) Evidence from the developing economies A growing number of studies have found a
statistical relationship between FDI inflows and domestic economic activity in the host countries.535 In many cases, they had received FDI for decades although the inflows accelerated in the early 1990s. In this section, some of these empirical findings, generally relating to developing countries in Asia and Latin America, are drawn on. Their experience may hint at the eventual macroeconomic impact of FDI in the transition economies (see below).
The empirical studies of the developing economies generally seek to establish a statistical relationship between FDI inflows and a measure of output growth and/or domestic investment. (Investment is most directly affected by FDI, but FDI may also impact GDP independently of fixed investment.) Such work is of interest because it attempts to capture the net effects of FDI in the economy as a whole. Negative effects may stem from various distortions in an economy – for example, those that offer profit opportunities to foreign investors without improving efficiency. These may occur, for example, if protectionist trade policies encourage TNCs to enter a country purely to obtain market share and monopolistic power.536 Or, governments may attract FDI to strategic industries by offering investment incentives that offset any benefit the TNC may generate. Even FDI that is not motivated by these objectives may create negative spillovers (which affect aggregate output but may be difficult to identify from enterprise or sectoral data).
The three studies cited below have found a significant relation between FDI flows and economic growth in various samples of developing countries. The first, applying a model of endogenous economic growth, finds that FDI stimulated the long-term expansion of per capita GDP.537 The contribution of FDI is likely to come from two effects. The more important seems to be that the productivity of FDI is higher than that of domestic investment.538 This is because FDI embodies advanced
535 For example, E. Borensztein et al., op. cit.; L. De Mello, Jr., op.
cit.; and K. Zhang, “FDI and economic growth: evidence from 10 east Asian economies”, Economia Internationale, November 1999.
536 In an extreme case, a TNC may close down an acquired asset to reduce capacity in the region and increase its market power.
537 E. Borensztein et al., op. cit. The data sample covers the years 1970-1989.
538 Using a different sample of countries Kamin and Wood found a significant positive relation between FDI and real investment. The study covers the period 1983-1994, which includes the first years of the FDI boom. S. Kamin and P. Wood, Capital Inflows, Financial Intermediation, and Aggregate Demand: Empirical Evidence from Mexico and other Pacific Basin Countries, Board of Governors of the Federal Reserve System, International Finance Discussion Papers No. 583 (Washington, D.C.), June 1997.
technology and management skills and enhances access to world markets, factors that can stimulate the host country’s efficiency and internal competition. However, it appears that the higher productivity occurs only when the host country has a minimum threshold stock of human capital (because there is an essential interaction between FDI/technology and human capital in the host economy). Second, FDI has the effect of increasing total domestic investment by more than one-for-one. Estimates of the “crowding in” phenomenon539 put the total increase in investment at between 1.5 and 2.3 times the increase in the flow of FDI.540 This increase in total capital accumulation occurs in addition to the positive impact of FDI on technological progress. Overall, in developing countries with an average stock of human capital, a 1 per cent increase in the FDI-GDP ratio is associated with a 0.4-0.7 per cent rise in long-term GDP per capita growth.541
In the second study542 FDI flows were found to stimulate the long-run growth of China, Indonesia, Hong Kong, Japan and Taiwan, and the short-run growth of Singapore.543 However, no relation between FDI and economic growth was found in South Korea and the Philippines. The third study, examining the impact of different types of capital flows in 18 countries, concluded that the most pronounced positive impact of FDI was on economic growth and domestic savings.544 It had less of an effect in the Asian countries than in Latin America, presumably because domestic savings play a larger role in the Asian economies.
539 FDI may stimulate more domestic investment (“crowding in”) if
there is complementarity in production between FDI and domestic firms. In this case, the FIE may develop backward and forward linkages, perhaps even assisting partner firms (subcontractors or downstream customers) with technology and finance while holding out the prospects of a stable market for their output. On the other hand, FDI may “crowd out” equal amounts of investment by domestic entities through aggressive competition in local product or financial markets, especially in cases where domestic firms are already financially constrained.
540 Estimates by UNCTAD suggest that there are marked regional differences among the developing countries with FDI tending to crowd in investment in much of Asia and crowding it out in Latin America. Also there are sectoral differences: mining and other raw material extraction projects, for example, generate little indirect investment because the FDI firms create few domestic linkages. UNCTAD, World Investment Report 1999:…, op. cit., pp. 172-173.
541 GDP is measured at purchasing power parity (PPP). Human capital stock is measured by the average level of secondary school attainment in a sample of 69 developing countries.
542 K. Zhang, op. cit., has noted two problems with the studies relying on cross-section analysis, applied by E. Borensztein et al. and S. Kamin and P. Wood. All presume a priori that FDI responds to or causes economic growth (see below) and do not consider the possibility of feedback effects and a long-run equilibrium relationship between FDI and economic growth. Second, there is evidence of considerable parametric variation across countries in regard to estimates of growth equations and FDI. In effect the methodology involves the imposition of a common (average) structure, thus masking these differences.
543 Ibid. These countries appear to have experienced FDI-led growth, except for China and Indonesia, where the relationship was found to be bi-directional. The issue of causality is discussed below.
544 W. Gruben and D. McLeod, “Capital flows, savings, and growth in the 1990s”, The Quarterly Review of Economics and Finance, Vol. 38, No. 3, Fall 1998. There is no theoretical reason why FDI ought to increase domestic savings.
204________________________________________________________________ Economic Survey of Europe, 2001 No. 1
(ii) Direction of causation It is usually assumed that FDI inflows stimulate
growth (FDI-led growth). Such a relationship might be expected because FDI can enhance those factors which usually play an important role in promoting economic development: investment, technical progress, and, in the new growth theory, R&D, the accumulation of human capital and various positive externalities. However, the causation may run in the other direction, whereby rapid economic growth attracts FDI (growth-driven FDI). Very briefly, under this hypothesis, expanding domestic economic activity is likely to be associated with an improving investment environment and increased opportunity for boosting profits. The expansion of income and domestic markets makes it possible for TNCs to exploit economies of scale. In the longer term, growth-associated improvements in human capital, labour productivity and infrastructure are likely to increase the marginal return to capital and, thus, the demand for domestic and foreign investment.545 Improved economic performance should also generate profits and encourage their reinvestment (reinvested earnings being a component of FDI). Evidence of a growth-led FDI relationship has been found in Malaysia and Thailand.546
Another possibility is a two-way causal process, in which FDI and growth have a reciprocal causal relationship. Evidence of such a virtuous circle has been found in China and Indonesia.547
In the transition economies, Hungary and Estonia showed early signs of FDI-led growth. In Hungary, there were significant inflows of FDI in the early 1990s (chart 5.5.1) before GDP started to recover (from the transition recession) in 1994. The output of FIEs was already expanding in 1992-1993 while that of domestic firms continued to decline (it was only later that the FIEs dominated economic performance). In Estonia, too, relatively large FDI inflows preceded the economic upturn in 1995. (A similar pattern may be observed somewhat later in Latvia.) In both cases, the governments’ strategies involved an early infusion of FDI through the sale of strategic state assets. On the other hand, in Poland an economic recovery (starting in 1992) preceded the surge in FDI by several years. Due to its size, location etc., Poland was from the very beginning of the transition considered one of the most attractive countries for foreign investment. However, despite this and its early favourable economic performance, foreign direct investors essentially held off until 1996, when the country’s large external debt was reduced in agreements with London and Paris Club creditors. Subsequently, FDI inflows and high rates of economic growth appear to have joined in a virtuous circle (as has probably also been the case in Hungary and the Baltic states). The fact that in Croatia, Slovakia and Slovenia there were extended periods of fairly rapid
545 See K. Zhang, op. cit., for a more systematic development of the
growth-led FDI hypothesis. 546 Ibid. 547 Ibid.
growth without attracting much FDI is explained by domestic policies (as already noted).548 The experiences of Croatia and Slovakia underline the fact that FDI will only begin to flow after a commitment has been made to reform (including a privatization programme) and investor friendly policies are in place.
(iii) FDI and growth in the transition economies Studies of the impact of FDI on GDP in the
transition economies are lacking.549 In most of these countries it might be difficult to find such a relation given the known importance of other factors: the degree of economic reform, the success of stabilization policies, the strength of import demand in major trade partners, and so on. The data in chart 5.5.2 do, however, suggest a positive association between FDI and economic growth, but the correlation falls slightly short of being significant.550 As regards indirect evidence, in Hungary, FDI-driven export growth (see above) appears to have been largely responsible for the improvement in economic performance in the second half of the 1990s.551 Exports were by far the most dynamic component of final demand, far exceeding the combined contribution of consumption and investment (chart 5.5.1).552 This was also the case in the Czech Republic although GDP actually contracted due to falling domestic absorption. In all the countries in this sample, GDP and export growth were nearly always positively related and, given the role of foreign companies in exports (table 5.4.5), FDI is likely to have contributed significantly to this outcome. In Kyrgyzstan, FDI in gold production has contributed considerably to overall output growth, and gold is the only export that has increased in value between 1996 and 1999.553 The contribution of foreign investment to output in Azerbaijan=s oil and gas industry has also been important (see section 5.6).
548 A. Bevan and S. Estrin, op. cit., found a strong relation between
growth in GDP and FDI in their 11 country sample. Perhaps with the exception of Hungary, Poland and the Baltic states in the second half of the 1990s, their results seem at variance with the data presented in chart 5.5.1.
549 The time series covering the transition years are still too short for the types of statistical test applied to the developing economies. At most, 10 years of data are available, less for all the countries of the former Soviet Union. The period includes falls in domestic output early in the transition and external shocks in the late 1990s, events independent of FDI activity. Moreover, in the early phase of the transition, inward FDI was small and, with the exception of Hungary and perhaps one or two other countries, could not have contributed much to economic growth. A recent study of growth factors in the transition economies (1990-1998) excludes FDI for this reason. O. Havrylyshyn et al., Growth Experience in Transition Countries, 1990-1998, IMF Occasional Paper, No. 184 (Washington, D.C.), April 2000.
550 A preliminary statistical analysis suggests that whether or not a country experienced a serious economic crisis (i.e. resulting in a fall in output) is a much more important determinant of its average growth performance in the second half of the 1990s than is FDI. Large foreign investments in the natural resource sector are also important in this regard.
551 Already in 1992-1993 the output of FIEs in the industrial sector increased by 9 per cent, in contrast to a 5 per cent decrease reported by domestic firms.
552 Exports in the national accounts also include traded services such as tourism and transport that have benefited from FDI.
553 National Bank of the Kyrgyz Republic, Bulletin, No. 7, 2000.
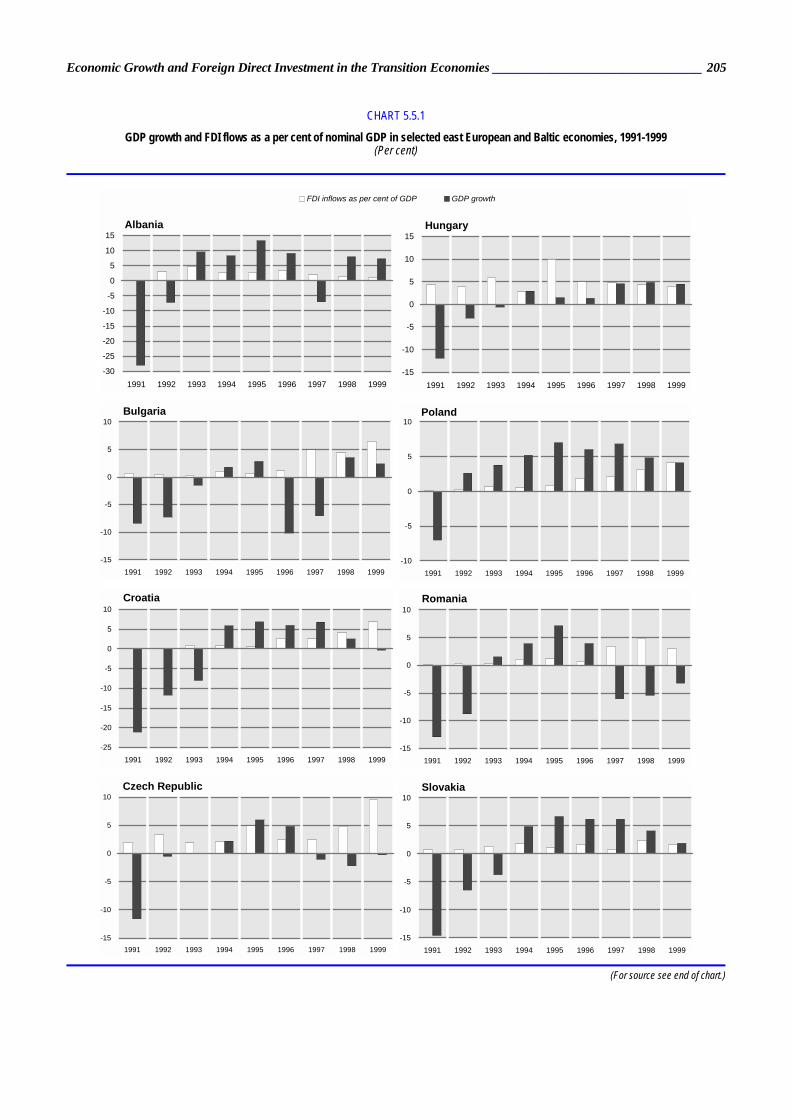
Economic Growth and Foreign Direct Investment in the Transition Economies ________________________________ 205
CHART 5.5.1
GDP growth and FDI flows as a per cent of nominal GDP in selected east European and Baltic economies, 1991-1999 (Per cent)
-30
-25
-20
-15
-10
-5
0
5
10
15
1991 1992 1993 1994 1995 1996 1997 1998 1999
FDI inflows as per cent of GDP GDP growth
Albania
-30
-25
-20
-15
-10
-5
0
5
10
15
1991 1992 1993 1994 1995 1996 1997 1998 1999
Bulgaria
-15
-10
-5
0
5
10
1991 1992 1993 1994 1995 1996 1997 1998 1999
Croatia
-25
-20
-15
-10
-5
0
5
10
1991 1992 1993 1994 1995 1996 1997 1998 1999
Czech Republic
-15
-10
-5
0
5
10
1991 1992 1993 1994 1995 1996 1997 1998 1999
Hungary
-15
-10
-5
0
5
10
15
1991 1992 1993 1994 1995 1996 1997 1998 1999
Poland
-10
-5
0
5
10
1991 1992 1993 1994 1995 1996 1997 1998 1999
Romania
-15
-10
-5
0
5
10
1991 1992 1993 1994 1995 1996 1997 1998 1999
Slovakia
-15
-10
-5
0
5
10
1991 1992 1993 1994 1995 1996 1997 1998 1999
(For source see end of chart.)
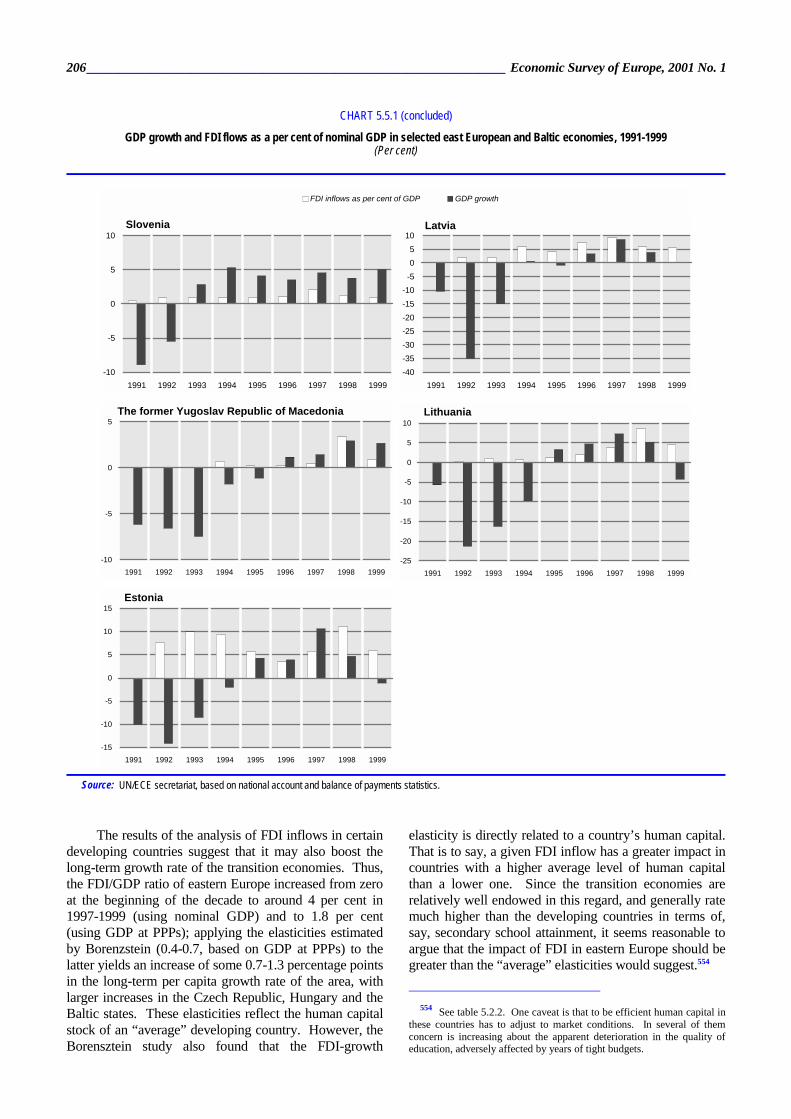
206________________________________________________________________ Economic Survey of Europe, 2001 No. 1
The results of the analysis of FDI inflows in certain developing countries suggest that it may also boost the long-term growth rate of the transition economies. Thus, the FDI/GDP ratio of eastern Europe increased from zero at the beginning of the decade to around 4 per cent in 1997-1999 (using nominal GDP) and to 1.8 per cent (using GDP at PPPs); applying the elasticities estimated by Borenzstein (0.4-0.7, based on GDP at PPPs) to the latter yields an increase of some 0.7-1.3 percentage points in the long-term per capita growth rate of the area, with larger increases in the Czech Republic, Hungary and the Baltic states. These elasticities reflect the human capital stock of an “average” developing country. However, the Borensztein study also found that the FDI-growth
elasticity is directly related to a country’s human capital. That is to say, a given FDI inflow has a greater impact in countries with a higher average level of human capital than a lower one. Since the transition economies are relatively well endowed in this regard, and generally rate much higher than the developing countries in terms of, say, secondary school attainment, it seems reasonable to argue that the impact of FDI in eastern Europe should be greater than the “average” elasticities would suggest.554
554 See table 5.2.2. One caveat is that to be efficient human capital in
these countries has to adjust to market conditions. In several of them concern is increasing about the apparent deterioration in the quality of education, adversely affected by years of tight budgets.
CHART 5.5.1 (concluded)
GDP growth and FDI flows as a per cent of nominal GDP in selected east European and Baltic economies, 1991-1999 (Per cent)
-30
-25
-20
-15
-10
-5
0
5
10
15
1991 1992 1993 1994 1995 1996 1997 1998 1999
FDI inflows as per cent of GDP GDP growth
Slovenia
-10
-5
0
5
10
1991 1992 1993 1994 1995 1996 1997 1998 1999
The former Yugoslav Republic of Macedonia
-10
-5
0
5
1991 1992 1993 1994 1995 1996 1997 1998 1999
Estonia
-15
-10
-5
0
5
10
15
1991 1992 1993 1994 1995 1996 1997 1998 1999
Latvia
-40-35-30-25-20-15-10
-505
10
1991 1992 1993 1994 1995 1996 1997 1998 1999
Lithuania
-25
-20
-15
-10
-5
0
5
10
1991 1992 1993 1994 1995 1996 1997 1998 1999
Source: UN/ECE secretariat, based on national account and balance of payments statistics.
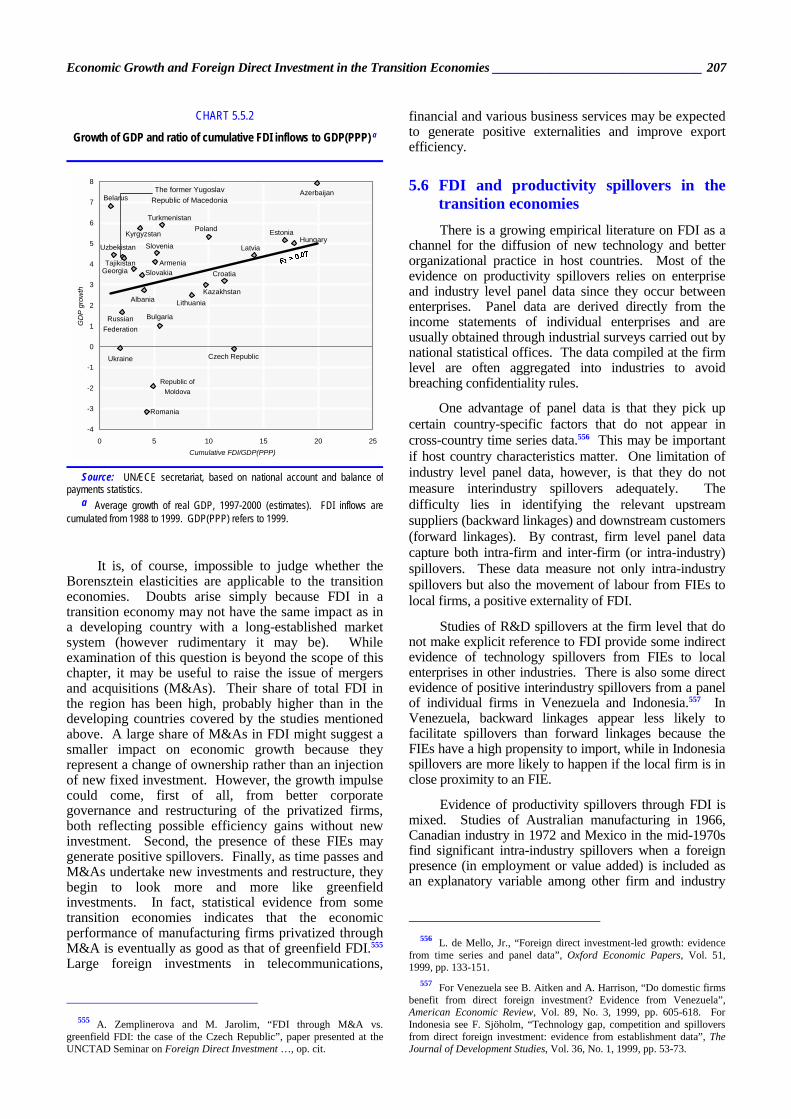
Economic Growth and Foreign Direct Investment in the Transition Economies ________________________________ 207
It is, of course, impossible to judge whether the Borensztein elasticities are applicable to the transition economies. Doubts arise simply because FDI in a transition economy may not have the same impact as in a developing country with a long-established market system (however rudimentary it may be). While examination of this question is beyond the scope of this chapter, it may be useful to raise the issue of mergers and acquisitions (M&As). Their share of total FDI in the region has been high, probably higher than in the developing countries covered by the studies mentioned above. A large share of M&As in FDI might suggest a smaller impact on economic growth because they represent a change of ownership rather than an injection of new fixed investment. However, the growth impulse could come, first of all, from better corporate governance and restructuring of the privatized firms, both reflecting possible efficiency gains without new investment. Second, the presence of these FIEs may generate positive spillovers. Finally, as time passes and M&As undertake new investments and restructure, they begin to look more and more like greenfield investments. In fact, statistical evidence from some transition economies indicates that the economic performance of manufacturing firms privatized through M&A is eventually as good as that of greenfield FDI.555 Large foreign investments in telecommunications,
555 A. Zemplinerova and M. Jarolim, “FDI through M&A vs.
greenfield FDI: the case of the Czech Republic”, paper presented at the UNCTAD Seminar on Foreign Direct Investment …, op. cit.
financial and various business services may be expected to generate positive externalities and improve export efficiency.
5.6 FDI and productivity spillovers in the transition economies There is a growing empirical literature on FDI as a
channel for the diffusion of new technology and better organizational practice in host countries. Most of the evidence on productivity spillovers relies on enterprise and industry level panel data since they occur between enterprises. Panel data are derived directly from the income statements of individual enterprises and are usually obtained through industrial surveys carried out by national statistical offices. The data compiled at the firm level are often aggregated into industries to avoid breaching confidentiality rules.
One advantage of panel data is that they pick up certain country-specific factors that do not appear in cross-country time series data.556 This may be important if host country characteristics matter. One limitation of industry level panel data, however, is that they do not measure interindustry spillovers adequately. The difficulty lies in identifying the relevant upstream suppliers (backward linkages) and downstream customers (forward linkages). By contrast, firm level panel data capture both intra-firm and inter-firm (or intra-industry) spillovers. These data measure not only intra-industry spillovers but also the movement of labour from FIEs to local firms, a positive externality of FDI.
Studies of R&D spillovers at the firm level that do not make explicit reference to FDI provide some indirect evidence of technology spillovers from FIEs to local enterprises in other industries. There is also some direct evidence of positive interindustry spillovers from a panel of individual firms in Venezuela and Indonesia.557 In Venezuela, backward linkages appear less likely to facilitate spillovers than forward linkages because the FIEs have a high propensity to import, while in Indonesia spillovers are more likely to happen if the local firm is in close proximity to an FIE.
Evidence of productivity spillovers through FDI is mixed. Studies of Australian manufacturing in 1966, Canadian industry in 1972 and Mexico in the mid-1970s find significant intra-industry spillovers when a foreign presence (in employment or value added) is included as an explanatory variable among other firm and industry
556 L. de Mello, Jr., “Foreign direct investment-led growth: evidence
from time series and panel data”, Oxford Economic Papers, Vol. 51, 1999, pp. 133-151.
557 For Venezuela see B. Aitken and A. Harrison, “Do domestic firms benefit from direct foreign investment? Evidence from Venezuela”, American Economic Review, Vol. 89, No. 3, 1999, pp. 605-618. For Indonesia see F. Sjöholm, “Technology gap, competition and spillovers from direct foreign investment: evidence from establishment data”, The Journal of Development Studies, Vol. 36, No. 1, 1999, pp. 53-73.
CHART 5.5.2
Growth of GDP and ratio of cumulative FDI inflows to GDP(PPP) a
Ukraine
Russian Federation
Georgia
Belarus
Kyrgyzstan
Albania
Romania
Republic of Moldova
ArmeniaSlovakia
Slovenia
Bulgaria
Uzbekistan
Tajikistan
Azerbaijan
Turkmenistan
Lithuania
Poland
Kazakhstan
Croatia
Czech Republic
Latvia
EstoniaHungary
-4
-3
-2
-1
0
1
2
3
4
5
6
7
8
0 5 10 15 20 25Cumulative FDI/GDP(PPP)
GD
P gr
owth
The former YugoslavRepublic of Macedonia
Source: UN/ECE secretariat, based on national account and balance ofpayments statistics.
a Average growth of real GDP, 1997-2000 (estimates). FDI inflows are cumulated from 1988 to 1999. GDP(PPP) refers to 1999.
208________________________________________________________________ Economic Survey of Europe, 2001 No. 1
characteristics in total factor productivity.558 Similar results were found in a study of United States FDI in France, Germany, Japan and the United Kingdom from 1968 to 1988 and in two studies of United Kingdom manufacturing enterprises covering the periods 1984-1992 and 1991-1995.559 Using a dynamic approach to take into account the different economies of scale across industries, a second study of Mexico confirms that a foreign presence can have a significant influence on local productivity growth.560 These spillover effects were large enough to assist local firms in Mexico to converge on United States productivity levels from 1965 to 1982.
Panel data from developing countries, however, provide little or no empirical support for positive net productivity spillovers from FDI. Panel data from Venezuela show significant technology transfer to the FIEs and some positive spillovers to domestic enterprises located near the FIE, but there were also negative spillovers to the local economy as a whole.561 Other studies at the firm level also find positive spillovers, but they are limited to certain industries, such as those with relatively simple technology (Morocco) or which are export oriented (Indonesia).562 There is also evidence that the presence of United States TNCs in Europe did not result in significant productivity spillovers in many industries, mainly because competitive pressure forced
558 However, none of these studies explain how these productivity
spillovers take place. For the study on Australia, see R. Caves, “Multinational firms, competition and productivity in host-country markets”, Economica, Vol. 41, 1974, pp. 176-193. For the study on Canada see S. Globerman, “Foreign direct investment and ‘spillover’ efficiency benefits in Canadian manufacturing industries”, Canadian Journal of Economics, Vol. 12, 1979, pp. 42-56. For the study on Mexico, see M. Blomström and H. Persson, “Foreign investment and spillover efficiency in an underdeveloped economy: evidence from the Mexican manufacturing industry”, World Development, Vol. 11, 1983, pp. 493-501.
559 M. Nadiri, “US Direct Investment and the Production Structure of the Manufacturing Sector in France, Germany, Japan, and the UK”, New York University, February 1992, mimeo. Using industry level panel data, Hubert and Pain show significant intra-industry and interindustry spillovers in United Kingdom manufacturing from 1984 to 1992. F. Hubert and N. Pain, Inward Investment and Technical Progress in the UK Manufacturing Sector, OECD Economics Department Working Paper, No. 268 (Paris), October 2000. Using panel data for 48 United Kingdom manufacturing industries, Liu et al., show significant intra-industry productivity spillovers to the domestic economy, the extent of which depends on the absorptive capacity of the domestic enterprises. X. Liu, P. Siler, C. Wang and Y. Wei, “Productivity spillovers from foreign direct investment: evidence from UK industry level panel data”, Journal of International Business Studies, Vol. 31, No. 3, 2000, pp. 407-426.
560 M. Blomström and E. Wolff, “Multinational corporations and productivity convergence in Mexico”, in W. Baumol, R. Nelson and E. Wolff (eds.), Convergence of Productivity: Cross-National Studies and Historical Evidence (Oxford, Oxford University Press, 1994).
561 B. Aitken and A. Harrison, op. cit. This study, first published in 1994 as a World Bank Research Paper, No. 1248, is one of the first empirical studies to use firm level panel data to test for spillovers.
562 For Morocco, see M. Haddad and A. Harrison, “Are there positive spillovers from direct foreign investment? Evidence from panel data for Morocco”, Journal of Development Economics, Vol. 42, 1993, pp. 51-74. For Indonesia, see M. Blomström and F. Sjöholm, “Technology transfer and spillovers: does local participation with multinationals matter?”, European Economic Review, Vol. 43, 1999, pp. 915-923.
many local firms with small markets out of business.563 A panel analysis of United Kingdom manufacturing firms from 1991 to 1996 also shows that the presence of foreign firms did not lead to wage and productivity spillovers.564
There is also little evidence of productivity spillovers in eastern Europe. Enterprise level panel data from Bulgaria, Poland and Romania covering the period 1993-1997 suggest that FDI may be important for transferring technology to an affiliate, but there is no evidence of positive productivity spillovers to local enterprises.565 Instead, there is significant evidence of negative spillovers in Poland. Panel data for the Czech Republic between 1992 and 1996 also provide evidence of negative spillovers and suggest that there may not even have been much technology transfer to the FIEs.566 This study also suggests that imports of capital goods appear to be the more important channel for technology transfer in the Czech Republic. A more recent study based on panel data covering 1995-1998 indicates that there are some spillovers in the Czech Republic, but they are limited to enterprises engaged in R&D or in the production of electrical equipment.567 This study suggests that the absorptive capacity of enterprises is an important factor in determining the existence and extent of productivity spillovers. Studies of other transition economies at the firm and industry level find similar results to those in the Czech Republic over the same period.568 Nevertheless, there is significant evidence that FDI is having a direct positive impact on the restructuring of former state enterprises in Hungary.
The rest of this section examines the extent to which TNCs facilitate technology transfer and
563 J. Cantwell, Technological Innovation and Multinational
Corporations (Oxford, Basil Blackwell, 1989). 564 S. Girma, D. Greenaway and K. Wakelin, “Who benefits from
foreign direct investment in the UK”, University of Nottingham, 2000, mimeo.
565 J. Konings, The Effect of Direct Foreign Investment on Domestic Firms: Evidence from Firm Level Panel Data in Emerging Economies, LICOS Discussion Paper, No. 86 (Leuven), 1999.
566 S. Djankov and B. Hoekman, “Foreign investment and productivity growth in Czech enterprises”, The World Bank Economic Review, Vol. 14, No. 1 (Washington, D.C.), 2000, pp. 49-64. By contrast, the study by A. Zemplinerova and M. Jarolim, op. cit., indicates the presence of some spillovers to local enterprises from 1994 to 1998.
567 Y. Kinoshita, R&D and Technology Spillovers via FDI: Innovation and Absorptive Capacity, CERGE Working Paper, No. 163 (Prague), November 2000. The study by J. Damijan and B. Majcen, “Transfer of technology through FDI, spillover effects and recovery of Slovenian manufacturing firms”, University of Ljubljana, 2000, mimeo, and J. Konings, op. cit., also indicate that spillovers in Slovenia are limited to enterprises engaged in R&D activity.
568 A study of the Czech Republic, Hungary, Slovakia and Slovenia found few interindustry spillovers between 1993 and 1996. M. Knell, “FIEs and productivity convergence in central Europe”, in G. Hunya (ed.), Integration Through Foreign Direct Investment (Cheltenham, Edward Elgar, 2000). Evidence from Slovenia also indicates no significant spillovers to the domestic economy as a whole, and that imports of capital goods are the most important channel of technology transfer. J. Damijan and B. Majcen, op. cit.
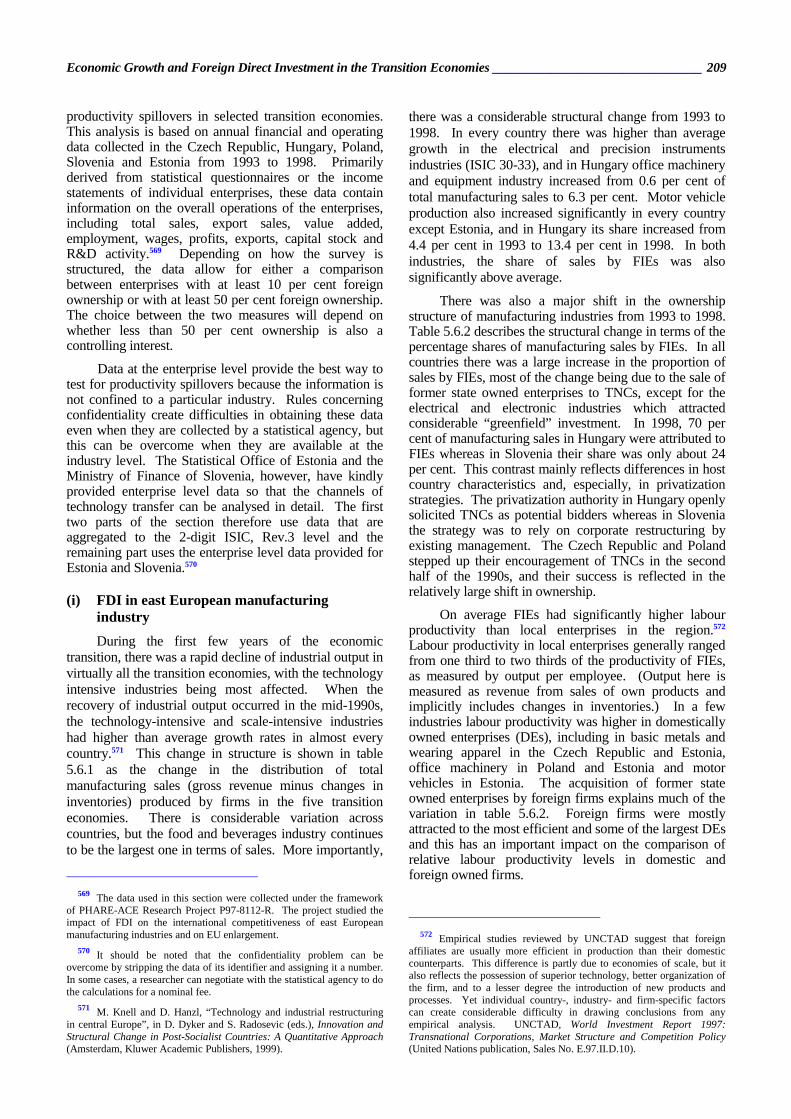
Economic Growth and Foreign Direct Investment in the Transition Economies ________________________________ 209
productivity spillovers in selected transition economies. This analysis is based on annual financial and operating data collected in the Czech Republic, Hungary, Poland, Slovenia and Estonia from 1993 to 1998. Primarily derived from statistical questionnaires or the income statements of individual enterprises, these data contain information on the overall operations of the enterprises, including total sales, export sales, value added, employment, wages, profits, exports, capital stock and R&D activity.569 Depending on how the survey is structured, the data allow for either a comparison between enterprises with at least 10 per cent foreign ownership or with at least 50 per cent foreign ownership. The choice between the two measures will depend on whether less than 50 per cent ownership is also a controlling interest.
Data at the enterprise level provide the best way to test for productivity spillovers because the information is not confined to a particular industry. Rules concerning confidentiality create difficulties in obtaining these data even when they are collected by a statistical agency, but this can be overcome when they are available at the industry level. The Statistical Office of Estonia and the Ministry of Finance of Slovenia, however, have kindly provided enterprise level data so that the channels of technology transfer can be analysed in detail. The first two parts of the section therefore use data that are aggregated to the 2-digit ISIC, Rev.3 level and the remaining part uses the enterprise level data provided for Estonia and Slovenia.570
(i) FDI in east European manufacturing industry During the first few years of the economic
transition, there was a rapid decline of industrial output in virtually all the transition economies, with the technology intensive industries being most affected. When the recovery of industrial output occurred in the mid-1990s, the technology-intensive and scale-intensive industries had higher than average growth rates in almost every country.571 This change in structure is shown in table 5.6.1 as the change in the distribution of total manufacturing sales (gross revenue minus changes in inventories) produced by firms in the five transition economies. There is considerable variation across countries, but the food and beverages industry continues to be the largest one in terms of sales. More importantly,
569 The data used in this section were collected under the framework
of PHARE-ACE Research Project P97-8112-R. The project studied the impact of FDI on the international competitiveness of east European manufacturing industries and on EU enlargement.
570 It should be noted that the confidentiality problem can be overcome by stripping the data of its identifier and assigning it a number. In some cases, a researcher can negotiate with the statistical agency to do the calculations for a nominal fee.
571 M. Knell and D. Hanzl, “Technology and industrial restructuring in central Europe”, in D. Dyker and S. Radosevic (eds.), Innovation and Structural Change in Post-Socialist Countries: A Quantitative Approach (Amsterdam, Kluwer Academic Publishers, 1999).
there was a considerable structural change from 1993 to 1998. In every country there was higher than average growth in the electrical and precision instruments industries (ISIC 30-33), and in Hungary office machinery and equipment industry increased from 0.6 per cent of total manufacturing sales to 6.3 per cent. Motor vehicle production also increased significantly in every country except Estonia, and in Hungary its share increased from 4.4 per cent in 1993 to 13.4 per cent in 1998. In both industries, the share of sales by FIEs was also significantly above average.
There was also a major shift in the ownership structure of manufacturing industries from 1993 to 1998. Table 5.6.2 describes the structural change in terms of the percentage shares of manufacturing sales by FIEs. In all countries there was a large increase in the proportion of sales by FIEs, most of the change being due to the sale of former state owned enterprises to TNCs, except for the electrical and electronic industries which attracted considerable “greenfield” investment. In 1998, 70 per cent of manufacturing sales in Hungary were attributed to FIEs whereas in Slovenia their share was only about 24 per cent. This contrast mainly reflects differences in host country characteristics and, especially, in privatization strategies. The privatization authority in Hungary openly solicited TNCs as potential bidders whereas in Slovenia the strategy was to rely on corporate restructuring by existing management. The Czech Republic and Poland stepped up their encouragement of TNCs in the second half of the 1990s, and their success is reflected in the relatively large shift in ownership.
On average FIEs had significantly higher labour productivity than local enterprises in the region.572 Labour productivity in local enterprises generally ranged from one third to two thirds of the productivity of FIEs, as measured by output per employee. (Output here is measured as revenue from sales of own products and implicitly includes changes in inventories.) In a few industries labour productivity was higher in domestically owned enterprises (DEs), including in basic metals and wearing apparel in the Czech Republic and Estonia, office machinery in Poland and Estonia and motor vehicles in Estonia. The acquisition of former state owned enterprises by foreign firms explains much of the variation in table 5.6.2. Foreign firms were mostly attracted to the most efficient and some of the largest DEs and this has an important impact on the comparison of relative labour productivity levels in domestic and foreign owned firms.
572 Empirical studies reviewed by UNCTAD suggest that foreign
affiliates are usually more efficient in production than their domestic counterparts. This difference is partly due to economies of scale, but it also reflects the possession of superior technology, better organization of the firm, and to a lesser degree the introduction of new products and processes. Yet individual country-, industry- and firm-specific factors can create considerable difficulty in drawing conclusions from any empirical analysis. UNCTAD, World Investment Report 1997: Transnational Corporations, Market Structure and Competition Policy (United Nations publication, Sales No. E.97.II.D.10).
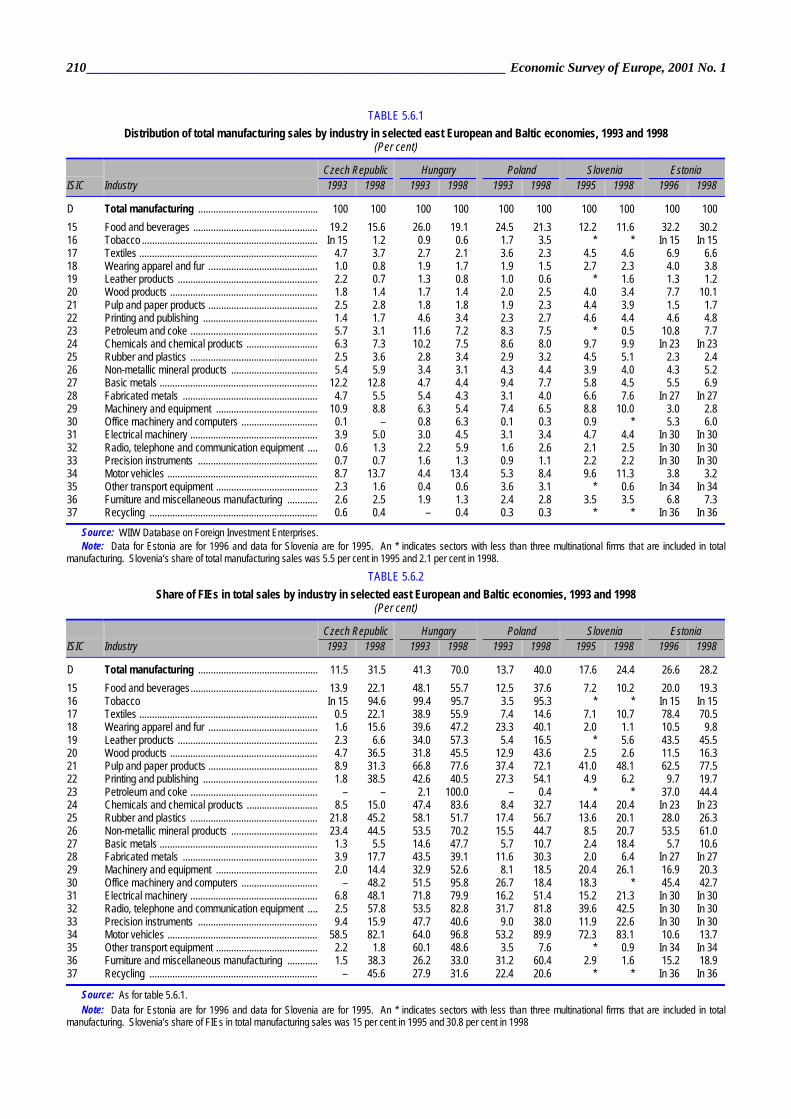
210________________________________________________________________ Economic Survey of Europe, 2001 No. 1
TABLE 5.6.1 Distribution of total manufacturing sales by industry in selected east European and Baltic economies, 1993 and 1998
(Per cent)
Czech Republic Hungary Poland Slovenia Estonia ISIC Industry 1993 1998 1993 1998 1993 1998 1995 1998 1996 1998
D Total manufacturing ............................................... 100 100 100 100 100 100 100 100 100 100 15 Food and beverages ................................................. 19.2 15.6 26.0 19.1 24.5 21.3 12.2 11.6 32.2 30.2 16 Tobacco ..................................................................... In 15 1.2 0.9 0.6 1.7 3.5 * * In 15 In 15 17 Textiles ...................................................................... 4.7 3.7 2.7 2.1 3.6 2.3 4.5 4.6 6.9 6.6 18 Wearing apparel and fur ........................................... 1.0 0.8 1.9 1.7 1.9 1.5 2.7 2.3 4.0 3.8 19 Leather products ....................................................... 2.2 0.7 1.3 0.8 1.0 0.6 * 1.6 1.3 1.2 20 Wood products .......................................................... 1.8 1.4 1.7 1.4 2.0 2.5 4.0 3.4 7.7 10.1 21 Pulp and paper products ........................................... 2.5 2.8 1.8 1.8 1.9 2.3 4.4 3.9 1.5 1.7 22 Printing and publishing ............................................. 1.4 1.7 4.6 3.4 2.3 2.7 4.6 4.4 4.6 4.8 23 Petroleum and coke .................................................. 5.7 3.1 11.6 7.2 8.3 7.5 * 0.5 10.8 7.7 24 Chemicals and chemical products ............................ 6.3 7.3 10.2 7.5 8.6 8.0 9.7 9.9 In 23 In 23 25 Rubber and plastics .................................................. 2.5 3.6 2.8 3.4 2.9 3.2 4.5 5.1 2.3 2.4 26 Non-metallic mineral products .................................. 5.4 5.9 3.4 3.1 4.3 4.4 3.9 4.0 4.3 5.2 27 Basic metals .............................................................. 12.2 12.8 4.7 4.4 9.4 7.7 5.8 4.5 5.5 6.9 28 Fabricated metals ..................................................... 4.7 5.5 5.4 4.3 3.1 4.0 6.6 7.6 In 27 In 27 29 Machinery and equipment ........................................ 10.9 8.8 6.3 5.4 7.4 6.5 8.8 10.0 3.0 2.8 30 Office machinery and computers .............................. 0.1 – 0.8 6.3 0.1 0.3 0.9 * 5.3 6.0 31 Electrical machinery .................................................. 3.9 5.0 3.0 4.5 3.1 3.4 4.7 4.4 In 30 In 30 32 Radio, telephone and communication equipment .... 0.6 1.3 2.2 5.9 1.6 2.6 2.1 2.5 In 30 In 30 33 Precision instruments ............................................... 0.7 0.7 1.6 1.3 0.9 1.1 2.2 2.2 In 30 In 30 34 Motor vehicles ........................................................... 8.7 13.7 4.4 13.4 5.3 8.4 9.6 11.3 3.8 3.2 35 Other transport equipment ........................................ 2.3 1.6 0.4 0.6 3.6 3.1 * 0.6 In 34 In 34 36 Furniture and miscellaneous manufacturing ............ 2.6 2.5 1.9 1.3 2.4 2.8 3.5 3.5 6.8 7.3 37 Recycling .................................................................. 0.6 0.4 – 0.4 0.3 0.3 * * In 36 In 36
Source: WIIW Database on Foreign Investment Enterprises. Note: Data for Estonia are for 1996 and data for Slovenia are for 1995. An * indicates sectors with less than three multinational firms that are included in total
manufacturing. Slovenia’s share of total manufacturing sales was 5.5 per cent in 1995 and 2.1 per cent in 1998. TABLE 5.6.2
Share of FIEs in total sales by industry in selected east European and Baltic economies, 1993 and 1998 (Per cent)
Czech Republic Hungary Poland Slovenia Estonia ISIC Industry 1993 1998 1993 1998 1993 1998 1995 1998 1996 1998
D Total manufacturing ............................................... 11.5 31.5 41.3 70.0 13.7 40.0 17.6 24.4 26.6 28.2 15 Food and beverages.................................................. 13.9 22.1 48.1 55.7 12.5 37.6 7.2 10.2 20.0 19.3 16 Tobacco In 15 94.6 99.4 95.7 3.5 95.3 * * In 15 In 15 17 Textiles ...................................................................... 0.5 22.1 38.9 55.9 7.4 14.6 7.1 10.7 78.4 70.5 18 Wearing apparel and fur ........................................... 1.6 15.6 39.6 47.2 23.3 40.1 2.0 1.1 10.5 9.8 19 Leather products ....................................................... 2.3 6.6 34.0 57.3 5.4 16.5 * 5.6 43.5 45.5 20 Wood products .......................................................... 4.7 36.5 31.8 45.5 12.9 43.6 2.5 2.6 11.5 16.3 21 Pulp and paper products ........................................... 8.9 31.3 66.8 77.6 37.4 72.1 41.0 48.1 62.5 77.5 22 Printing and publishing ............................................. 1.8 38.5 42.6 40.5 27.3 54.1 4.9 6.2 9.7 19.7 23 Petroleum and coke .................................................. – – 2.1 100.0 – 0.4 * * 37.0 44.4 24 Chemicals and chemical products ............................ 8.5 15.0 47.4 83.6 8.4 32.7 14.4 20.4 In 23 In 23 25 Rubber and plastics .................................................. 21.8 45.2 58.1 51.7 17.4 56.7 13.6 20.1 28.0 26.3 26 Non-metallic mineral products .................................. 23.4 44.5 53.5 70.2 15.5 44.7 8.5 20.7 53.5 61.0 27 Basic metals .............................................................. 1.3 5.5 14.6 47.7 5.7 10.7 2.4 18.4 5.7 10.6 28 Fabricated metals ..................................................... 3.9 17.7 43.5 39.1 11.6 30.3 2.0 6.4 In 27 In 27 29 Machinery and equipment ........................................ 2.0 14.4 32.9 52.6 8.1 18.5 20.4 26.1 16.9 20.3 30 Office machinery and computers .............................. – 48.2 51.5 95.8 26.7 18.4 18.3 * 45.4 42.7 31 Electrical machinery .................................................. 6.8 48.1 71.8 79.9 16.2 51.4 15.2 21.3 In 30 In 30 32 Radio, telephone and communication equipment .... 2.5 57.8 53.5 82.8 31.7 81.8 39.6 42.5 In 30 In 30 33 Precision instruments ............................................... 9.4 15.9 47.7 40.6 9.0 38.0 11.9 22.6 In 30 In 30 34 Motor vehicles ........................................................... 58.5 82.1 64.0 96.8 53.2 89.9 72.3 83.1 10.6 13.7 35 Other transport equipment ........................................ 2.2 1.8 60.1 48.6 3.5 7.6 * 0.9 In 34 In 34 36 Furniture and miscellaneous manufacturing ............ 1.5 38.3 26.2 33.0 31.2 60.4 2.9 1.6 15.2 18.9 37 Recycling .................................................................. – 45.6 27.9 31.6 22.4 20.6 * * In 36 In 36
Source: As for table 5.6.1. Note: Data for Estonia are for 1996 and data for Slovenia are for 1995. An * indicates sectors with less than three multinational firms that are included in total
manufacturing. Slovenia’s share of FIEs in total manufacturing sales was 15 per cent in 1995 and 30.8 per cent in 1998
Economic Growth and Foreign Direct Investment in the Transition Economies ________________________________ 211
There is no clear trend of convergence in labour productivity between DEs and FIEs across industries (table 5.6.3). The aggregate productivity gap has narrowed slightly in the Czech Republic, Slovenia and Estonia, but there are many individual industries where it has increased. In Hungary and Poland the gap has widened significantly. Investment related to privatization and uncertainty about the prospects for institutional change explain some of the differences in relative productivity growth. Also, the timing of entry by TNCs plays a role: spillovers only occur over time as competition increases, backward and forward linkages develop and outsourcing becomes more prevalent.
The productivity gap between FIEs and DEs tends to be smaller when measured by value added per employee (table 5.6.4). On this basis, in 1993, the labour productivity of local enterprises was about two thirds of FIEs in the Czech Republic and Slovenia and more than 80 per cent in Poland. Moreover, the productivity gap appears to have widened significantly in the Czech Republic as a whole, a different conclusion from that based on the gross output measure. This may be due to different relative prices of intermediate goods or of factors of production between the FIEs and DEs. The parent firms may also be engaged in transfer pricing.
The difference between DEs and FIEs is especially marked in terms of capital intensity (table 5.6.5), although the interindustry variation across countries is considerable. Nevertheless, capital intensity in general was about two to three times higher in foreign firms than in domestically owned firms (except in Poland where the difference was much smaller in 1993), although there are numerous examples where the ratio is the other way around. This may reflect the fact that, in the centrally planned economies, industries were often too capital intensive – and market forces and TNCs should lower the ratios to more optimal levels. (However, there is probably a lot of noise in these data as there are also lags in the adjustment of employment levels.) By contrast, the difference in capital intensity between FIEs and domestic enterprises fell in the Czech Republic and Estonia indicating that the local enterprises have been increasing their fixed investment faster than the FIEs between 1993 and 1998.
Together, tables 5.6.3-5.6.5 show an uneven pattern of transnational activity that is nevertheless reflected in some rather large productivity differences across central Europe. Changes in the ratio of labour productivity levels between domestic and foreign enterprises in aggregate manufacturing from 1993 to 1998 suggest that there have not been enough intra-industry productivity spillovers for the local enterprises to catch up with the FIEs (chart 5.6.1). The rapidly widening productivity gap in Hungary and Poland illustrates this point. However, the elimination of the coke and petroleum sector reduces the gap between DEs and FIEs significantly in Hungary and shows how a
sector with large changes in ownership can affect relative productivity.573
(ii) A simple test for productivity spillovers at the industry level The data in tables 5.6.1-5.6.5 provide a basis for
analysing the extent to which intra-industry productivity spillovers have taken place in all of the countries except Estonia. This can be done by relating the rate of convergence in labour productivity levels between the DEs and FIEs to the percentage share of sales in FIEs by industry and the initial gap in labour productivity between the two sets of enterprises in 1993.574 The rate of convergence is measured by the ratio of the 1998 relative productivity levels between local enterprises and FIEs to those in 1993 (or the nearest year):
CONVERGE = α + β1FIE + β2GAP + ε where, for each industry in each country, FIE is the share of foreign owned enterprises in total sales, averaged between 1993 or 1995 and 1998, and GAP is the ratio of output per employee in domestically owned enterprises to the ratio of output per employee in foreign owned enterprises in 1993.575 Evidence that TNCs are generating enough spillovers to stimulate productivity convergence is present when β1 > 0, and evidence that the relative size of the productivity gap in 1993 leads to productivity convergence is present when β2 < 0.
Table 5.6.6 summarizes the estimation results for the four countries. The negative signs for the coefficient on FIEs indicate that there are not enough productivity spillovers from FDI to close the productivity gap in central Europe. They also indicate that when there is productivity convergence between FIEs and DEs it is more likely to appear in those industries with a declining share of sales accounted for by FIEs. The coefficient, however, is not significant for either the Czech Republic or Poland. The negative sign for the Czech Republic suggests the evidence does not support the thesis that catching up is occurring in the manufacturing sector as a whole.576 The negative signs for the GAP coefficient suggest that the initial size of the productivity gap influences the probability of productivity convergence in the transition economies. This coefficient is significant in all countries, except Poland.
573 In 1993 the petroleum and coke sector was almost completely sold
to foreign investors. 574 This section adopts the method for testing for intra-industry
productivity spillovers developed by M. Blomström and E. Wolff, loc. cit. In their study, Blomström and Wolff estimate productivity spillovers in two ways: (1) by the rate of labour productivity growth of DEs within an industry; and (2) by the rate of convergence in labour productivity levels between local and foreign firms within an industry. This chapter tests for productivity spillovers using the second approach because it avoids the need to construct price indices for each industry.
575 As in the study by M. Blomström and E. Wolff, loc. cit., this chapter uses an income-based measure of output and productivity.
576 This conclusion is supported by data at the enterprise level. S. Djankov and B. Hoekman, loc. cit., and Y. Kinoshita, op. cit.
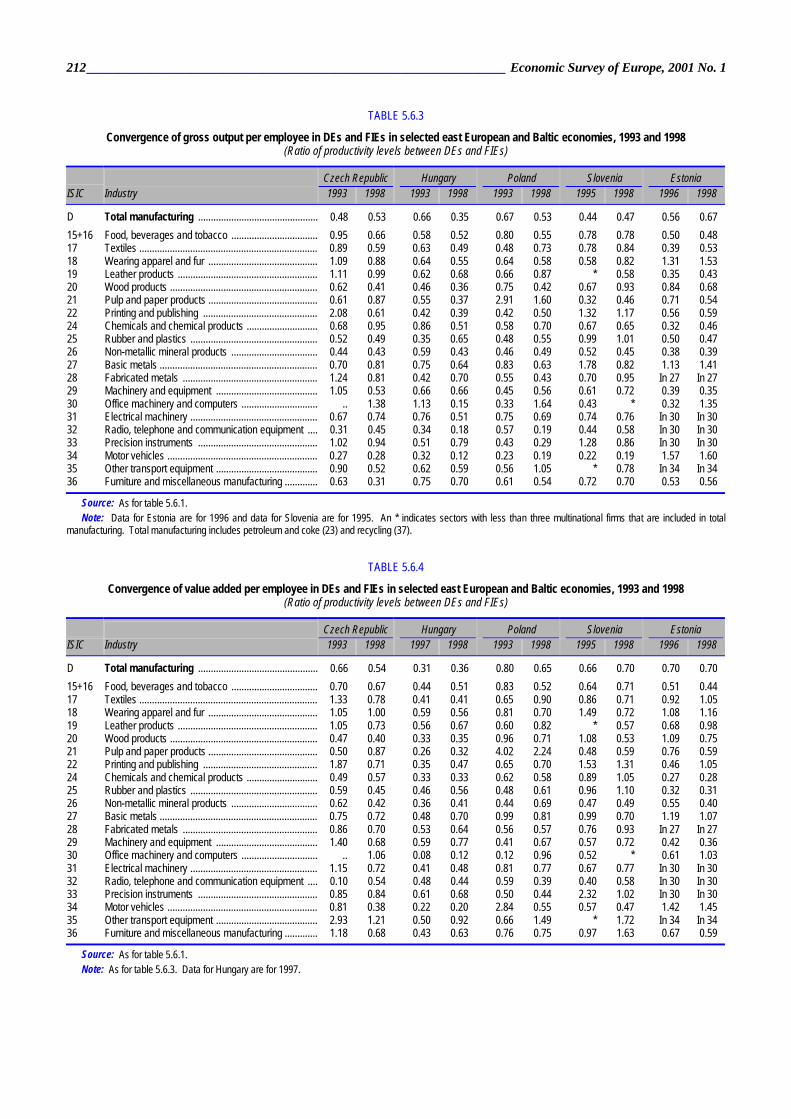
212________________________________________________________________ Economic Survey of Europe, 2001 No. 1
TABLE 5.6.3
Convergence of gross output per employee in DEs and FIEs in selected east European and Baltic economies, 1993 and 1998 (Ratio of productivity levels between DEs and FIEs)
Czech Republic Hungary Poland Slovenia Estonia ISIC Industry 1993 1998 1993 1998 1993 1998 1995 1998 1996 1998
D Total manufacturing ............................................... 0.48 0.53 0.66 0.35 0.67 0.53 0.44 0.47 0.56 0.67 15+16 Food, beverages and tobacco .................................. 0.95 0.66 0.58 0.52 0.80 0.55 0.78 0.78 0.50 0.48 17 Textiles ...................................................................... 0.89 0.59 0.63 0.49 0.48 0.73 0.78 0.84 0.39 0.53 18 Wearing apparel and fur ........................................... 1.09 0.88 0.64 0.55 0.64 0.58 0.58 0.82 1.31 1.53 19 Leather products ....................................................... 1.11 0.99 0.62 0.68 0.66 0.87 * 0.58 0.35 0.43 20 Wood products .......................................................... 0.62 0.41 0.46 0.36 0.75 0.42 0.67 0.93 0.84 0.68 21 Pulp and paper products ........................................... 0.61 0.87 0.55 0.37 2.91 1.60 0.32 0.46 0.71 0.54 22 Printing and publishing ............................................. 2.08 0.61 0.42 0.39 0.42 0.50 1.32 1.17 0.56 0.59 24 Chemicals and chemical products ............................ 0.68 0.95 0.86 0.51 0.58 0.70 0.67 0.65 0.32 0.46 25 Rubber and plastics .................................................. 0.52 0.49 0.35 0.65 0.48 0.55 0.99 1.01 0.50 0.47 26 Non-metallic mineral products .................................. 0.44 0.43 0.59 0.43 0.46 0.49 0.52 0.45 0.38 0.39 27 Basic metals .............................................................. 0.70 0.81 0.75 0.64 0.83 0.63 1.78 0.82 1.13 1.41 28 Fabricated metals ..................................................... 1.24 0.81 0.42 0.70 0.55 0.43 0.70 0.95 In 27 In 27 29 Machinery and equipment ........................................ 1.05 0.53 0.66 0.66 0.45 0.56 0.61 0.72 0.39 0.35 30 Office machinery and computers .............................. .. 1.38 1.13 0.15 0.33 1.64 0.43 * 0.32 1.35 31 Electrical machinery .................................................. 0.67 0.74 0.76 0.51 0.75 0.69 0.74 0.76 In 30 In 30 32 Radio, telephone and communication equipment .... 0.31 0.45 0.34 0.18 0.57 0.19 0.44 0.58 In 30 In 30 33 Precision instruments ............................................... 1.02 0.94 0.51 0.79 0.43 0.29 1.28 0.86 In 30 In 30 34 Motor vehicles ........................................................... 0.27 0.28 0.32 0.12 0.23 0.19 0.22 0.19 1.57 1.60 35 Other transport equipment ........................................ 0.90 0.52 0.62 0.59 0.56 1.05 * 0.78 In 34 In 34 36 Furniture and miscellaneous manufacturing ............. 0.63 0.31 0.75 0.70 0.61 0.54 0.72 0.70 0.53 0.56
Source: As for table 5.6.1. Note: Data for Estonia are for 1996 and data for Slovenia are for 1995. An * indicates sectors with less than three multinational firms that are included in total
manufacturing. Total manufacturing includes petroleum and coke (23) and recycling (37).
TABLE 5.6.4
Convergence of value added per employee in DEs and FIEs in selected east European and Baltic economies, 1993 and 1998 (Ratio of productivity levels between DEs and FIEs)
Czech Republic Hungary Poland Slovenia Estonia ISIC Industry 1993 1998 1997 1998 1993 1998 1995 1998 1996 1998
D Total manufacturing ............................................... 0.66 0.54 0.31 0.36 0.80 0.65 0.66 0.70 0.70 0.70 15+16 Food, beverages and tobacco .................................. 0.70 0.67 0.44 0.51 0.83 0.52 0.64 0.71 0.51 0.44 17 Textiles ...................................................................... 1.33 0.78 0.41 0.41 0.65 0.90 0.86 0.71 0.92 1.05 18 Wearing apparel and fur ........................................... 1.05 1.00 0.59 0.56 0.81 0.70 1.49 0.72 1.08 1.16 19 Leather products ....................................................... 1.05 0.73 0.56 0.67 0.60 0.82 * 0.57 0.68 0.98 20 Wood products .......................................................... 0.47 0.40 0.33 0.35 0.96 0.71 1.08 0.53 1.09 0.75 21 Pulp and paper products ........................................... 0.50 0.87 0.26 0.32 4.02 2.24 0.48 0.59 0.76 0.59 22 Printing and publishing ............................................. 1.87 0.71 0.35 0.47 0.65 0.70 1.53 1.31 0.46 1.05 24 Chemicals and chemical products ............................ 0.49 0.57 0.33 0.33 0.62 0.58 0.89 1.05 0.27 0.28 25 Rubber and plastics .................................................. 0.59 0.45 0.46 0.56 0.48 0.61 0.96 1.10 0.32 0.31 26 Non-metallic mineral products .................................. 0.62 0.42 0.36 0.41 0.44 0.69 0.47 0.49 0.55 0.40 27 Basic metals .............................................................. 0.75 0.72 0.48 0.70 0.99 0.81 0.99 0.70 1.19 1.07 28 Fabricated metals ..................................................... 0.86 0.70 0.53 0.64 0.56 0.57 0.76 0.93 In 27 In 27 29 Machinery and equipment ........................................ 1.40 0.68 0.59 0.77 0.41 0.67 0.57 0.72 0.42 0.36 30 Office machinery and computers .............................. .. 1.06 0.08 0.12 0.12 0.96 0.52 * 0.61 1.03 31 Electrical machinery .................................................. 1.15 0.72 0.41 0.48 0.81 0.77 0.67 0.77 In 30 In 30 32 Radio, telephone and communication equipment .... 0.10 0.54 0.48 0.44 0.59 0.39 0.40 0.58 In 30 In 30 33 Precision instruments ............................................... 0.85 0.84 0.61 0.68 0.50 0.44 2.32 1.02 In 30 In 30 34 Motor vehicles ........................................................... 0.81 0.38 0.22 0.20 2.84 0.55 0.57 0.47 1.42 1.45 35 Other transport equipment ........................................ 2.93 1.21 0.50 0.92 0.66 1.49 * 1.72 In 34 In 34 36 Furniture and miscellaneous manufacturing ............. 1.18 0.68 0.43 0.63 0.76 0.75 0.97 1.63 0.67 0.59
Source: As for table 5.6.1. Note: As for table 5.6.3. Data for Hungary are for 1997.
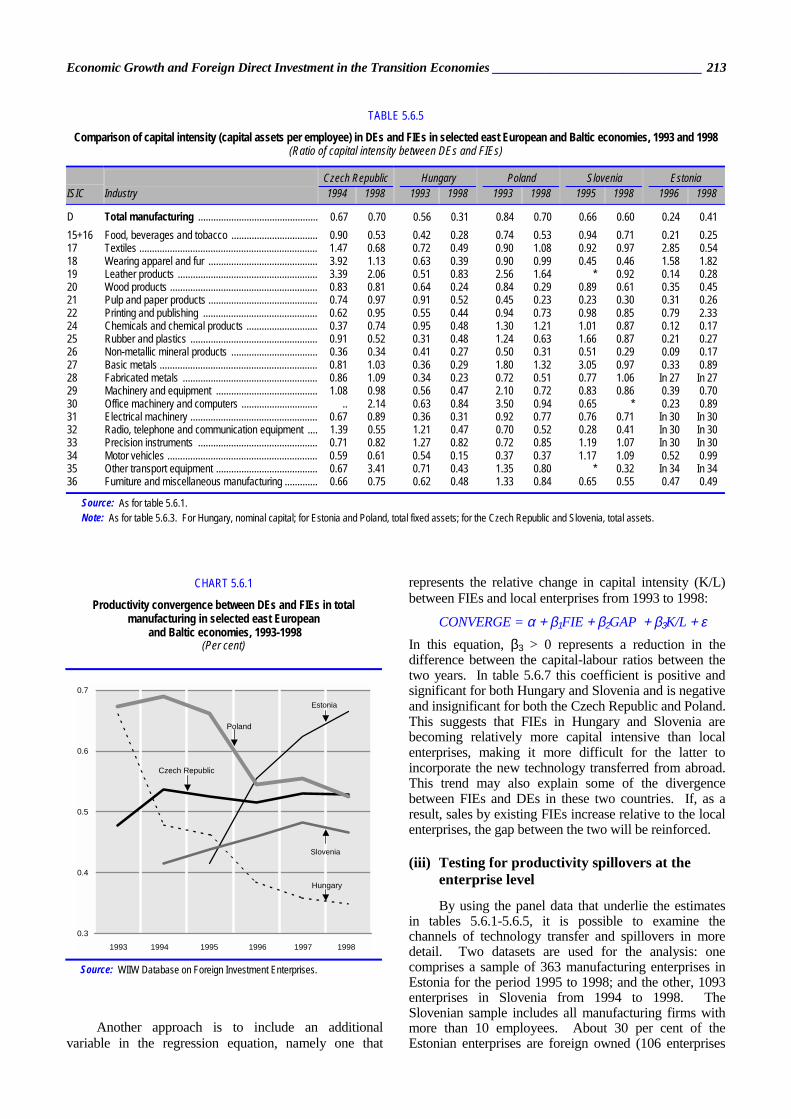
Economic Growth and Foreign Direct Investment in the Transition Economies ________________________________ 213
Another approach is to include an additional variable in the regression equation, namely one that
represents the relative change in capital intensity (K/L) between FIEs and local enterprises from 1993 to 1998:
CONVERGE = α + β1FIE + β2GAP + β3K/L + ε In this equation, β3 > 0 represents a reduction in the difference between the capital-labour ratios between the two years. In table 5.6.7 this coefficient is positive and significant for both Hungary and Slovenia and is negative and insignificant for both the Czech Republic and Poland. This suggests that FIEs in Hungary and Slovenia are becoming relatively more capital intensive than local enterprises, making it more difficult for the latter to incorporate the new technology transferred from abroad. This trend may also explain some of the divergence between FIEs and DEs in these two countries. If, as a result, sales by existing FIEs increase relative to the local enterprises, the gap between the two will be reinforced.
(iii) Testing for productivity spillovers at the enterprise level
By using the panel data that underlie the estimates in tables 5.6.1-5.6.5, it is possible to examine the channels of technology transfer and spillovers in more detail. Two datasets are used for the analysis: one comprises a sample of 363 manufacturing enterprises in Estonia for the period 1995 to 1998; and the other, 1093 enterprises in Slovenia from 1994 to 1998. The Slovenian sample includes all manufacturing firms with more than 10 employees. About 30 per cent of the Estonian enterprises are foreign owned (106 enterprises
TABLE 5.6.5
Comparison of capital intensity (capital assets per employee) in DEs and FIEs in selected east European and Baltic economies, 1993 and 1998 (Ratio of capital intensity between DEs and FIEs)
Czech Republic Hungary Poland Slovenia Estonia ISIC Industry 1994 1998 1993 1998 1993 1998 1995 1998 1996 1998
D Total manufacturing ............................................... 0.67 0.70 0.56 0.31 0.84 0.70 0.66 0.60 0.24 0.41 15+16 Food, beverages and tobacco .................................. 0.90 0.53 0.42 0.28 0.74 0.53 0.94 0.71 0.21 0.25 17 Textiles ...................................................................... 1.47 0.68 0.72 0.49 0.90 1.08 0.92 0.97 2.85 0.54 18 Wearing apparel and fur ........................................... 3.92 1.13 0.63 0.39 0.90 0.99 0.45 0.46 1.58 1.82 19 Leather products ....................................................... 3.39 2.06 0.51 0.83 2.56 1.64 * 0.92 0.14 0.28 20 Wood products .......................................................... 0.83 0.81 0.64 0.24 0.84 0.29 0.89 0.61 0.35 0.45 21 Pulp and paper products ........................................... 0.74 0.97 0.91 0.52 0.45 0.23 0.23 0.30 0.31 0.26 22 Printing and publishing ............................................. 0.62 0.95 0.55 0.44 0.94 0.73 0.98 0.85 0.79 2.33 24 Chemicals and chemical products ............................ 0.37 0.74 0.95 0.48 1.30 1.21 1.01 0.87 0.12 0.17 25 Rubber and plastics .................................................. 0.91 0.52 0.31 0.48 1.24 0.63 1.66 0.87 0.21 0.27 26 Non-metallic mineral products .................................. 0.36 0.34 0.41 0.27 0.50 0.31 0.51 0.29 0.09 0.17 27 Basic metals .............................................................. 0.81 1.03 0.36 0.29 1.80 1.32 3.05 0.97 0.33 0.89 28 Fabricated metals ..................................................... 0.86 1.09 0.34 0.23 0.72 0.51 0.77 1.06 In 27 In 27 29 Machinery and equipment ........................................ 1.08 0.98 0.56 0.47 2.10 0.72 0.83 0.86 0.39 0.70 30 Office machinery and computers .............................. .. 2.14 0.63 0.84 3.50 0.94 0.65 * 0.23 0.89 31 Electrical machinery .................................................. 0.67 0.89 0.36 0.31 0.92 0.77 0.76 0.71 In 30 In 30 32 Radio, telephone and communication equipment .... 1.39 0.55 1.21 0.47 0.70 0.52 0.28 0.41 In 30 In 30 33 Precision instruments ............................................... 0.71 0.82 1.27 0.82 0.72 0.85 1.19 1.07 In 30 In 30 34 Motor vehicles ........................................................... 0.59 0.61 0.54 0.15 0.37 0.37 1.17 1.09 0.52 0.99 35 Other transport equipment ........................................ 0.67 3.41 0.71 0.43 1.35 0.80 * 0.32 In 34 In 34 36 Furniture and miscellaneous manufacturing ............. 0.66 0.75 0.62 0.48 1.33 0.84 0.65 0.55 0.47 0.49
Source: As for table 5.6.1. Note: As for table 5.6.3. For Hungary, nominal capital; for Estonia and Poland, total fixed assets; for the Czech Republic and Slovenia, total assets.
CHART 5.6.1
Productivity convergence between DEs and FIEs in total manufacturing in selected east European
and Baltic economies, 1993-1998 (Per cent)
0.3
0.4
0.5
0.6
0.7
19941993 1996 199819971995
Czech Republic
Hungary
Estonia
Poland
Slovenia
Source: WIIW Database on Foreign Investment Enterprises.
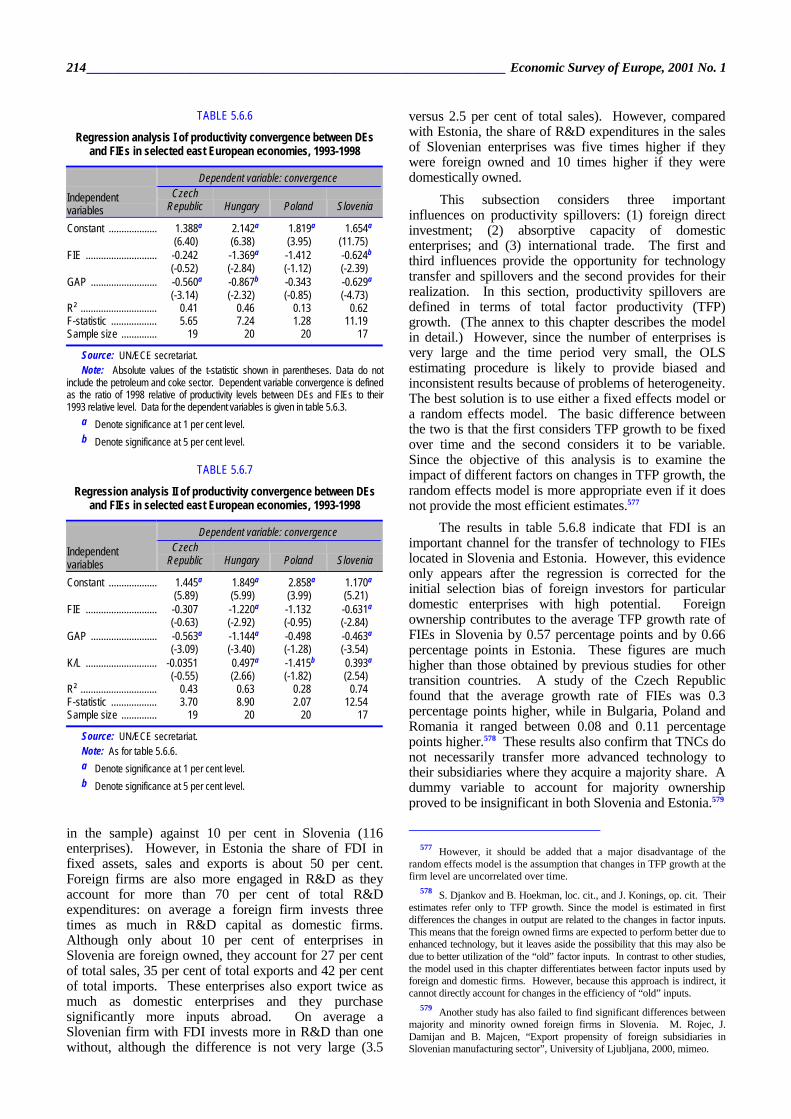
214________________________________________________________________ Economic Survey of Europe, 2001 No. 1
in the sample) against 10 per cent in Slovenia (116 enterprises). However, in Estonia the share of FDI in fixed assets, sales and exports is about 50 per cent. Foreign firms are also more engaged in R&D as they account for more than 70 per cent of total R&D expenditures: on average a foreign firm invests three times as much in R&D capital as domestic firms. Although only about 10 per cent of enterprises in Slovenia are foreign owned, they account for 27 per cent of total sales, 35 per cent of total exports and 42 per cent of total imports. These enterprises also export twice as much as domestic enterprises and they purchase significantly more inputs abroad. On average a Slovenian firm with FDI invests more in R&D than one without, although the difference is not very large (3.5
versus 2.5 per cent of total sales). However, compared with Estonia, the share of R&D expenditures in the sales of Slovenian enterprises was five times higher if they were foreign owned and 10 times higher if they were domestically owned.
This subsection considers three important influences on productivity spillovers: (1) foreign direct investment; (2) absorptive capacity of domestic enterprises; and (3) international trade. The first and third influences provide the opportunity for technology transfer and spillovers and the second provides for their realization. In this section, productivity spillovers are defined in terms of total factor productivity (TFP) growth. (The annex to this chapter describes the model in detail.) However, since the number of enterprises is very large and the time period very small, the OLS estimating procedure is likely to provide biased and inconsistent results because of problems of heterogeneity. The best solution is to use either a fixed effects model or a random effects model. The basic difference between the two is that the first considers TFP growth to be fixed over time and the second considers it to be variable. Since the objective of this analysis is to examine the impact of different factors on changes in TFP growth, the random effects model is more appropriate even if it does not provide the most efficient estimates.577
The results in table 5.6.8 indicate that FDI is an important channel for the transfer of technology to FIEs located in Slovenia and Estonia. However, this evidence only appears after the regression is corrected for the initial selection bias of foreign investors for particular domestic enterprises with high potential. Foreign ownership contributes to the average TFP growth rate of FIEs in Slovenia by 0.57 percentage points and by 0.66 percentage points in Estonia. These figures are much higher than those obtained by previous studies for other transition countries. A study of the Czech Republic found that the average growth rate of FIEs was 0.3 percentage points higher, while in Bulgaria, Poland and Romania it ranged between 0.08 and 0.11 percentage points higher.578 These results also confirm that TNCs do not necessarily transfer more advanced technology to their subsidiaries where they acquire a majority share. A dummy variable to account for majority ownership proved to be insignificant in both Slovenia and Estonia.579
577 However, it should be added that a major disadvantage of the
random effects model is the assumption that changes in TFP growth at the firm level are uncorrelated over time.
578 S. Djankov and B. Hoekman, loc. cit., and J. Konings, op. cit. Their estimates refer only to TFP growth. Since the model is estimated in first differences the changes in output are related to the changes in factor inputs. This means that the foreign owned firms are expected to perform better due to enhanced technology, but it leaves aside the possibility that this may also be due to better utilization of the “old” factor inputs. In contrast to other studies, the model used in this chapter differentiates between factor inputs used by foreign and domestic firms. However, because this approach is indirect, it cannot directly account for changes in the efficiency of “old” inputs.
579 Another study has also failed to find significant differences between majority and minority owned foreign firms in Slovenia. M. Rojec, J. Damijan and B. Majcen, “Export propensity of foreign subsidiaries in Slovenian manufacturing sector”, University of Ljubljana, 2000, mimeo.
TABLE 5.6.6
Regression analysis I of productivity convergence between DEs and FIEs in selected east European economies, 1993-1998
Dependent variable: convergence
Independent variables
Czech Republic Hungary Poland Slovenia
Constant ................... 1.388a 2.142a 1.819a 1.654a (6.40) (6.38) (3.95) (11.75) FIE ............................ -0.242 -1.369a -1.412 -0.624b (-0.52) (-2.84) (-1.12) (-2.39) GAP .......................... -0.560a -0.867b -0.343 -0.629a (-3.14) (-2.32) (-0.85) (-4.73) R² .............................. 0.41 0.46 0.13 0.62 F-statistic .................. 5.65 7.24 1.28 11.19 Sample size .............. 19 20 20 17
Source: UN/ECE secretariat. Note: Absolute values of the t-statistic shown in parentheses. Data do not
include the petroleum and coke sector. Dependent variable convergence is defined as the ratio of 1998 relative of productivity levels between DEs and FIEs to their 1993 relative level. Data for the dependent variables is given in table 5.6.3.
a Denote significance at 1 per cent level. b Denote significance at 5 per cent level.
TABLE 5.6.7
Regression analysis II of productivity convergence between DEs and FIEs in selected east European economies, 1993-1998
Dependent variable: convergence
Independent variables
Czech Republic Hungary Poland Slovenia
Constant ................... 1.445a 1.849a 2.858a 1.170a (5.89) (5.99) (3.99) (5.21) FIE ............................ -0.307 -1.220a -1.132 -0.631a (-0.63) (-2.92) (-0.95) (-2.84) GAP .......................... -0.563a -1.144a -0.498 -0.463a (-3.09) (-3.40) (-1.28) (-3.54) K/L ............................ -0.0351 0.497a -1.415b 0.393a (-0.55) (2.66) (-1.82) (2.54) R² .............................. 0.43 0.63 0.28 0.74 F-statistic .................. 3.70 8.90 2.07 12.54 Sample size .............. 19 20 20 17
Source: UN/ECE secretariat. Note: As for table 5.6.6. a Denote significance at 1 per cent level. b Denote significance at 5 per cent level.
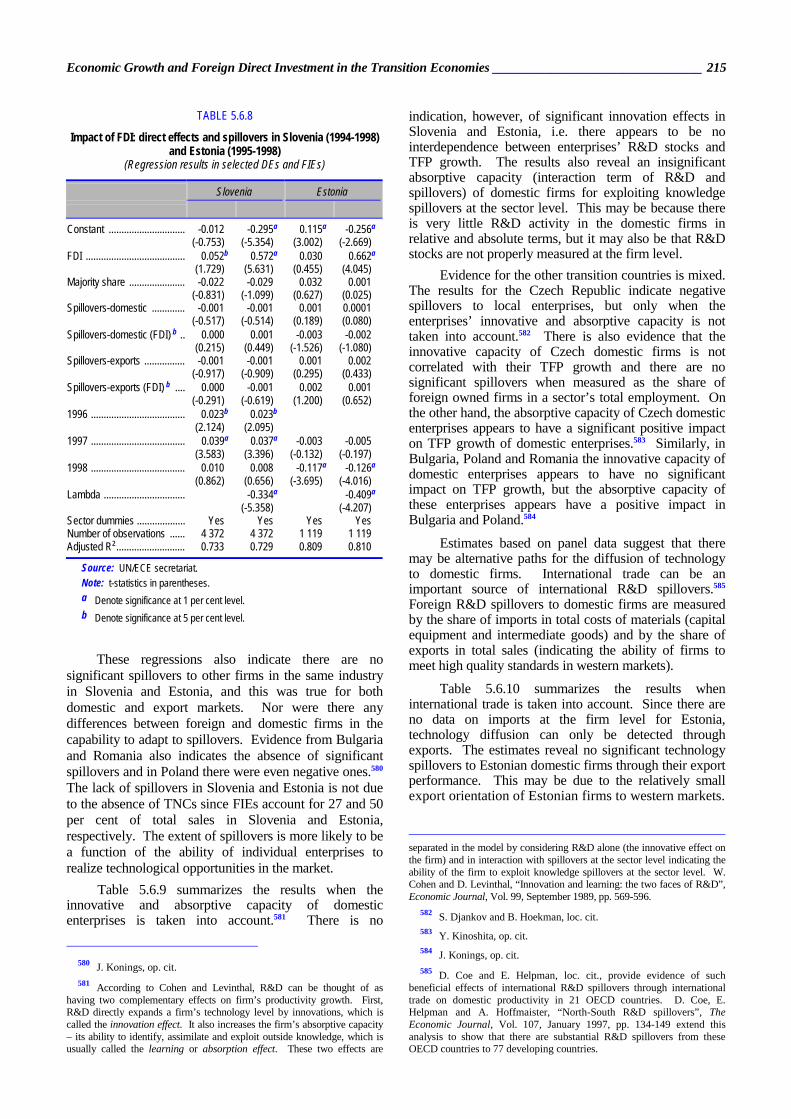
Economic Growth and Foreign Direct Investment in the Transition Economies ________________________________ 215
These regressions also indicate there are no significant spillovers to other firms in the same industry in Slovenia and Estonia, and this was true for both domestic and export markets. Nor were there any differences between foreign and domestic firms in the capability to adapt to spillovers. Evidence from Bulgaria and Romania also indicates the absence of significant spillovers and in Poland there were even negative ones.580 The lack of spillovers in Slovenia and Estonia is not due to the absence of TNCs since FIEs account for 27 and 50 per cent of total sales in Slovenia and Estonia, respectively. The extent of spillovers is more likely to be a function of the ability of individual enterprises to realize technological opportunities in the market.
Table 5.6.9 summarizes the results when the innovative and absorptive capacity of domestic enterprises is taken into account.581 There is no
580 J. Konings, op. cit. 581 According to Cohen and Levinthal, R&D can be thought of as
having two complementary effects on firm’s productivity growth. First, R&D directly expands a firm’s technology level by innovations, which is called the innovation effect. It also increases the firm’s absorptive capacity – its ability to identify, assimilate and exploit outside knowledge, which is usually called the learning or absorption effect. These two effects are
indication, however, of significant innovation effects in Slovenia and Estonia, i.e. there appears to be no interdependence between enterprises’ R&D stocks and TFP growth. The results also reveal an insignificant absorptive capacity (interaction term of R&D and spillovers) of domestic firms for exploiting knowledge spillovers at the sector level. This may be because there is very little R&D activity in the domestic firms in relative and absolute terms, but it may also be that R&D stocks are not properly measured at the firm level.
Evidence for the other transition countries is mixed. The results for the Czech Republic indicate negative spillovers to local enterprises, but only when the enterprises’ innovative and absorptive capacity is not taken into account.582 There is also evidence that the innovative capacity of Czech domestic firms is not correlated with their TFP growth and there are no significant spillovers when measured as the share of foreign owned firms in a sector’s total employment. On the other hand, the absorptive capacity of Czech domestic enterprises appears to have a significant positive impact on TFP growth of domestic enterprises.583 Similarly, in Bulgaria, Poland and Romania the innovative capacity of domestic enterprises appears to have no significant impact on TFP growth, but the absorptive capacity of these enterprises appears have a positive impact in Bulgaria and Poland.584
Estimates based on panel data suggest that there may be alternative paths for the diffusion of technology to domestic firms. International trade can be an important source of international R&D spillovers.585 Foreign R&D spillovers to domestic firms are measured by the share of imports in total costs of materials (capital equipment and intermediate goods) and by the share of exports in total sales (indicating the ability of firms to meet high quality standards in western markets).
Table 5.6.10 summarizes the results when international trade is taken into account. Since there are no data on imports at the firm level for Estonia, technology diffusion can only be detected through exports. The estimates reveal no significant technology spillovers to Estonian domestic firms through their export performance. This may be due to the relatively small export orientation of Estonian firms to western markets.
separated in the model by considering R&D alone (the innovative effect on the firm) and in interaction with spillovers at the sector level indicating the ability of the firm to exploit knowledge spillovers at the sector level. W. Cohen and D. Levinthal, “Innovation and learning: the two faces of R&D”, Economic Journal, Vol. 99, September 1989, pp. 569-596.
582 S. Djankov and B. Hoekman, loc. cit. 583 Y. Kinoshita, op. cit. 584 J. Konings, op. cit. 585 D. Coe and E. Helpman, loc. cit., provide evidence of such
beneficial effects of international R&D spillovers through international trade on domestic productivity in 21 OECD countries. D. Coe, E. Helpman and A. Hoffmaister, “North-South R&D spillovers”, The Economic Journal, Vol. 107, January 1997, pp. 134-149 extend this analysis to show that there are substantial R&D spillovers from these OECD countries to 77 developing countries.
TABLE 5.6.8
Impact of FDI: direct effects and spillovers in Slovenia (1994-1998) and Estonia (1995-1998)
(Regression results in selected DEs and FIEs)
Slovenia Estonia
Constant .............................. -0.012 -0.295a 0.115a -0.256a (-0.753) (-5.354) (3.002) (-2.669) FDI ....................................... 0.052b 0.572a 0.030 0.662a (1.729) (5.631) (0.455) (4.045) Majority share ...................... -0.022 -0.029 0.032 0.001 (-0.831) (-1.099) (0.627) (0.025) Spillovers-domestic ............. -0.001 -0.001 0.001 0.0001 (-0.517) (-0.514) (0.189) (0.080) Spillovers-domestic (FDI) b .. 0.000 0.001 -0.003 -0.002 (0.215) (0.449) (-1.526) (-1.080) Spillovers-exports ................ -0.001 -0.001 0.001 0.002 (-0.917) (-0.909) (0.295) (0.433) Spillovers-exports (FDI) b .... 0.000 -0.001 0.002 0.001 (-0.291) (-0.619) (1.200) (0.652) 1996 ..................................... 0.023b 0.023b (2.124) (2.095) 1997 ..................................... 0.039a 0.037a -0.003 -0.005 (3.583) (3.396) (-0.132) (-0.197) 1998 ..................................... 0.010 0.008 -0.117a -0.126a (0.862) (0.656) (-3.695) (-4.016) Lambda ................................ -0.334a -0.409a (-5.358) (-4.207) Sector dummies ................... Yes Yes Yes Yes Number of observations ...... 4 372 4 372 1 119 1 119 Adjusted R² ........................... 0.733 0.729 0.809 0.810
Source: UN/ECE secretariat. Note: t-statistics in parentheses. a Denote significance at 1 per cent level. b Denote significance at 5 per cent level.
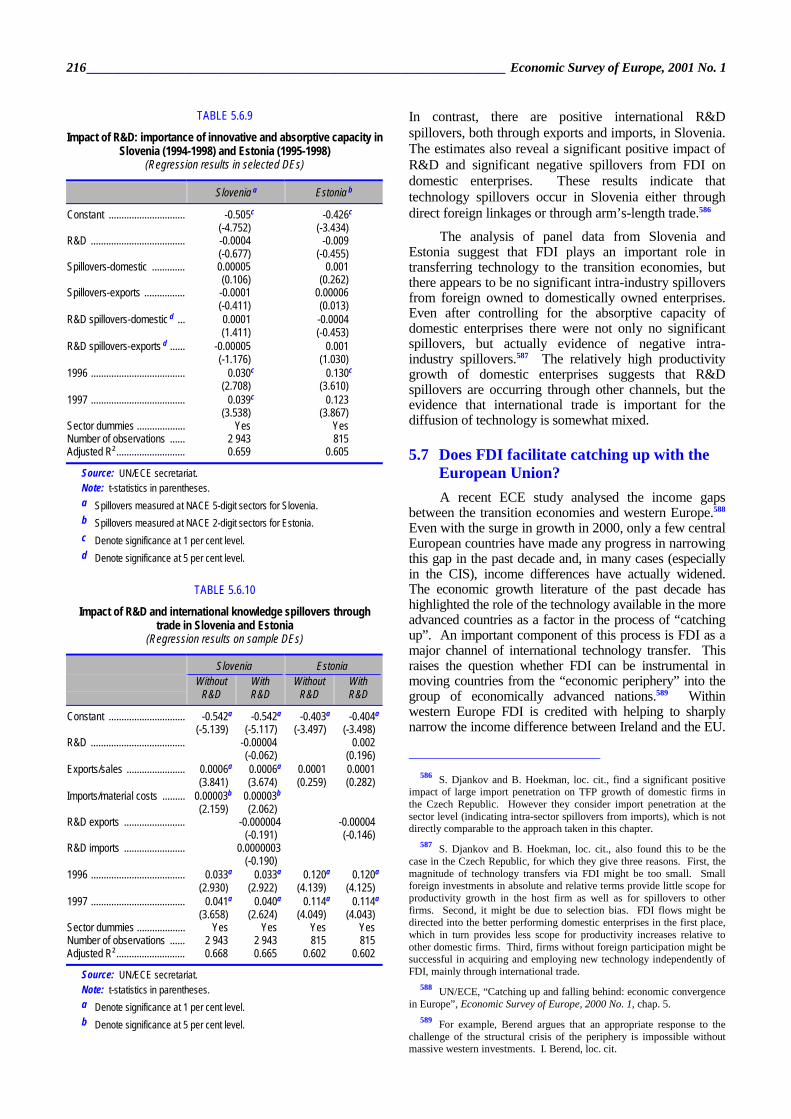
216________________________________________________________________ Economic Survey of Europe, 2001 No. 1
In contrast, there are positive international R&D spillovers, both through exports and imports, in Slovenia. The estimates also reveal a significant positive impact of R&D and significant negative spillovers from FDI on domestic enterprises. These results indicate that technology spillovers occur in Slovenia either through direct foreign linkages or through arm’s-length trade.586
The analysis of panel data from Slovenia and Estonia suggest that FDI plays an important role in transferring technology to the transition economies, but there appears to be no significant intra-industry spillovers from foreign owned to domestically owned enterprises. Even after controlling for the absorptive capacity of domestic enterprises there were not only no significant spillovers, but actually evidence of negative intra-industry spillovers.587 The relatively high productivity growth of domestic enterprises suggests that R&D spillovers are occurring through other channels, but the evidence that international trade is important for the diffusion of technology is somewhat mixed.
5.7 Does FDI facilitate catching up with the European Union? A recent ECE study analysed the income gaps
between the transition economies and western Europe.588 Even with the surge in growth in 2000, only a few central European countries have made any progress in narrowing this gap in the past decade and, in many cases (especially in the CIS), income differences have actually widened. The economic growth literature of the past decade has highlighted the role of the technology available in the more advanced countries as a factor in the process of “catching up”. An important component of this process is FDI as a major channel of international technology transfer. This raises the question whether FDI can be instrumental in moving countries from the “economic periphery” into the group of economically advanced nations.589 Within western Europe FDI is credited with helping to sharply narrow the income difference between Ireland and the EU.
586 S. Djankov and B. Hoekman, loc. cit., find a significant positive
impact of large import penetration on TFP growth of domestic firms in the Czech Republic. However they consider import penetration at the sector level (indicating intra-sector spillovers from imports), which is not directly comparable to the approach taken in this chapter.
587 S. Djankov and B. Hoekman, loc. cit., also found this to be the case in the Czech Republic, for which they give three reasons. First, the magnitude of technology transfers via FDI might be too small. Small foreign investments in absolute and relative terms provide little scope for productivity growth in the host firm as well as for spillovers to other firms. Second, it might be due to selection bias. FDI flows might be directed into the better performing domestic enterprises in the first place, which in turn provides less scope for productivity increases relative to other domestic firms. Third, firms without foreign participation might be successful in acquiring and employing new technology independently of FDI, mainly through international trade.
588 UN/ECE, “Catching up and falling behind: economic convergence in Europe”, Economic Survey of Europe, 2000 No. 1, chap. 5.
589 For example, Berend argues that an appropriate response to the challenge of the structural crisis of the periphery is impossible without massive western investments. I. Berend, loc. cit.
TABLE 5.6.9
Impact of R&D: importance of innovative and absorptive capacity in Slovenia (1994-1998) and Estonia (1995-1998)
(Regression results in selected DEs)
Slovenia a Estonia b
Constant .............................. -0.505c -0.426c (-4.752) (-3.434) R&D ..................................... -0.0004 -0.009 (-0.677) (-0.455) Spillovers-domestic ............. 0.00005 0.001 (0.106) (0.262) Spillovers-exports ................ -0.0001 0.00006 (-0.411) (0.013) R&D spillovers-domestic d ... 0.0001 -0.0004 (1.411) (-0.453) R&D spillovers-exports d ...... -0.00005 0.001 (-1.176) (1.030) 1996 ..................................... 0.030c 0.130c (2.708) (3.610) 1997 ..................................... 0.039c 0.123 (3.538) (3.867) Sector dummies ................... Yes Yes Number of observations ...... 2 943 815 Adjusted R² ........................... 0.659 0.605
Source: UN/ECE secretariat. Note: t-statistics in parentheses. a Spillovers measured at NACE 5-digit sectors for Slovenia. b Spillovers measured at NACE 2-digit sectors for Estonia. c Denote significance at 1 per cent level. d Denote significance at 5 per cent level.
TABLE 5.6.10
Impact of R&D and international knowledge spillovers through trade in Slovenia and Estonia
(Regression results on sample DEs)
Slovenia Estonia
Without
R&D With R&D
Without R&D
With R&D
Constant .............................. -0.542a -0.542a -0.403a -0.404a (-5.139) (-5.117) (-3.497) (-3.498) R&D ..................................... -0.00004 0.002 (-0.062) (0.196) Exports/sales ....................... 0.0006a 0.0006a 0.0001 0.0001 (3.841) (3.674) (0.259) (0.282) Imports/material costs ......... 0.00003b 0.00003b (2.159) (2.062) R&D exports ........................ -0.000004 -0.00004 (-0.191) (-0.146) R&D imports ........................ 0.0000003 (-0.190) 1996 ..................................... 0.033a 0.033a 0.120a 0.120a (2.930) (2.922) (4.139) (4.125) 1997 ..................................... 0.041a 0.040a 0.114a 0.114a (3.658) (2.624) (4.049) (4.043) Sector dummies ................... Yes Yes Yes Yes Number of observations ...... 2 943 2 943 815 815 Adjusted R² ........................... 0.668 0.665 0.602 0.602
Source: UN/ECE secretariat. Note: t-statistics in parentheses. a Denote significance at 1 per cent level. b Denote significance at 5 per cent level.
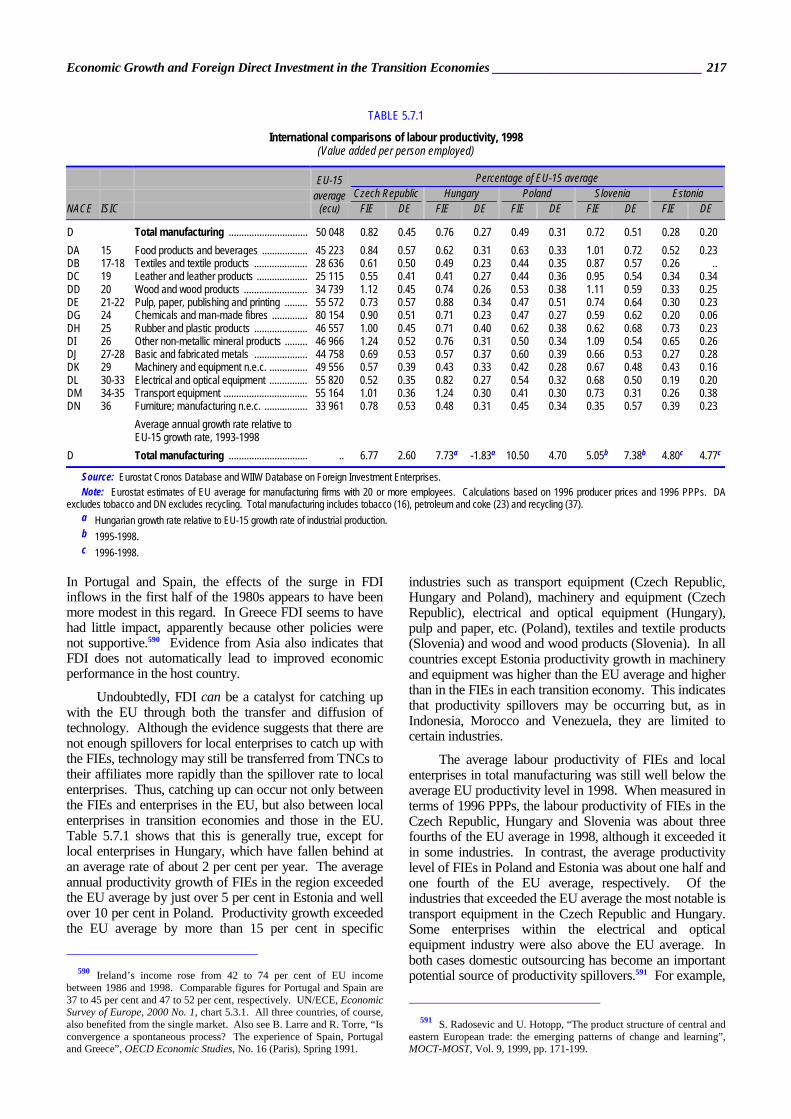
Economic Growth and Foreign Direct Investment in the Transition Economies ________________________________ 217
In Portugal and Spain, the effects of the surge in FDI inflows in the first half of the 1980s appears to have been more modest in this regard. In Greece FDI seems to have had little impact, apparently because other policies were not supportive.590 Evidence from Asia also indicates that FDI does not automatically lead to improved economic performance in the host country.
Undoubtedly, FDI can be a catalyst for catching up with the EU through both the transfer and diffusion of technology. Although the evidence suggests that there are not enough spillovers for local enterprises to catch up with the FIEs, technology may still be transferred from TNCs to their affiliates more rapidly than the spillover rate to local enterprises. Thus, catching up can occur not only between the FIEs and enterprises in the EU, but also between local enterprises in transition economies and those in the EU. Table 5.7.1 shows that this is generally true, except for local enterprises in Hungary, which have fallen behind at an average rate of about 2 per cent per year. The average annual productivity growth of FIEs in the region exceeded the EU average by just over 5 per cent in Estonia and well over 10 per cent in Poland. Productivity growth exceeded the EU average by more than 15 per cent in specific
590 Ireland’s income rose from 42 to 74 per cent of EU income
between 1986 and 1998. Comparable figures for Portugal and Spain are 37 to 45 per cent and 47 to 52 per cent, respectively. UN/ECE, Economic Survey of Europe, 2000 No. 1, chart 5.3.1. All three countries, of course, also benefited from the single market. Also see B. Larre and R. Torre, “Is convergence a spontaneous process? The experience of Spain, Portugal and Greece”, OECD Economic Studies, No. 16 (Paris), Spring 1991.
industries such as transport equipment (Czech Republic, Hungary and Poland), machinery and equipment (Czech Republic), electrical and optical equipment (Hungary), pulp and paper, etc. (Poland), textiles and textile products (Slovenia) and wood and wood products (Slovenia). In all countries except Estonia productivity growth in machinery and equipment was higher than the EU average and higher than in the FIEs in each transition economy. This indicates that productivity spillovers may be occurring but, as in Indonesia, Morocco and Venezuela, they are limited to certain industries.
The average labour productivity of FIEs and local enterprises in total manufacturing was still well below the average EU productivity level in 1998. When measured in terms of 1996 PPPs, the labour productivity of FIEs in the Czech Republic, Hungary and Slovenia was about three fourths of the EU average in 1998, although it exceeded it in some industries. In contrast, the average productivity level of FIEs in Poland and Estonia was about one half and one fourth of the EU average, respectively. Of the industries that exceeded the EU average the most notable is transport equipment in the Czech Republic and Hungary. Some enterprises within the electrical and optical equipment industry were also above the EU average. In both cases domestic outsourcing has become an important potential source of productivity spillovers.591 For example,
591 S. Radosevic and U. Hotopp, “The product structure of central and
eastern European trade: the emerging patterns of change and learning”, MOCT-MOST, Vol. 9, 1999, pp. 171-199.
TABLE 5.7.1
International comparisons of labour productivity, 1998 (Value added per person employed)
EU-15 Percentage of EU-15 average average Czech Republic Hungary Poland Slovenia Estonia NACE ISIC (ecu) FIE DE FIE DE FIE DE FIE DE FIE DE
D Total manufacturing ............................... 50 048 0.82 0.45 0.76 0.27 0.49 0.31 0.72 0.51 0.28 0.20 DA 15 Food products and beverages .................. 45 223 0.84 0.57 0.62 0.31 0.63 0.33 1.01 0.72 0.52 0.23 DB 17-18 Textiles and textile products ..................... 28 636 0.61 0.50 0.49 0.23 0.44 0.35 0.87 0.57 0.26 .. DC 19 Leather and leather products .................... 25 115 0.55 0.41 0.41 0.27 0.44 0.36 0.95 0.54 0.34 0.34 DD 20 Wood and wood products ......................... 34 739 1.12 0.45 0.74 0.26 0.53 0.38 1.11 0.59 0.33 0.25 DE 21-22 Pulp, paper, publishing and printing ......... 55 572 0.73 0.57 0.88 0.34 0.47 0.51 0.74 0.64 0.30 0.23 DG 24 Chemicals and man-made fibres .............. 80 154 0.90 0.51 0.71 0.23 0.47 0.27 0.59 0.62 0.20 0.06 DH 25 Rubber and plastic products ..................... 46 557 1.00 0.45 0.71 0.40 0.62 0.38 0.62 0.68 0.73 0.23 DI 26 Other non-metallic mineral products ......... 46 966 1.24 0.52 0.76 0.31 0.50 0.34 1.09 0.54 0.65 0.26 DJ 27-28 Basic and fabricated metals ..................... 44 758 0.69 0.53 0.57 0.37 0.60 0.39 0.66 0.53 0.27 0.28 DK 29 Machinery and equipment n.e.c. ............... 49 556 0.57 0.39 0.43 0.33 0.42 0.28 0.67 0.48 0.43 0.16 DL 30-33 Electrical and optical equipment ............... 55 820 0.52 0.35 0.82 0.27 0.54 0.32 0.68 0.50 0.19 0.20 DM 34-35 Transport equipment ................................. 55 164 1.01 0.36 1.24 0.30 0.41 0.30 0.73 0.31 0.26 0.38 DN 36 Furniture; manufacturing n.e.c. ................. 33 961 0.78 0.53 0.48 0.31 0.45 0.34 0.35 0.57 0.39 0.23
Average annual growth rate relative to EU-15 growth rate, 1993-1998
D Total manufacturing ............................... .. 6.77 2.60 7.73a -1.83a 10.50 4.70 5.05b 7.38b 4.80c 4.77c
Source: Eurostat Cronos Database and WIIW Database on Foreign Investment Enterprises. Note: Eurostat estimates of EU average for manufacturing firms with 20 or more employees. Calculations based on 1996 producer prices and 1996 PPPs. DA
excludes tobacco and DN excludes recycling. Total manufacturing includes tobacco (16), petroleum and coke (23) and recycling (37). a Hungarian growth rate relative to EU-15 growth rate of industrial production. b 1995-1998. c 1996-1998.

218________________________________________________________________ Economic Survey of Europe, 2001 No. 1
Volkswagen owns a majority share of Skoda Automotive, but often outsources production to Skoda General Manufacturing, a domestic firm. A prominent example of domestic outsourcing is office machinery and computer equipment in Hungary. A concentration of FDI in computing equipment by several well-known European and American firms has resulted in considerable outsourcing to domestically owned firms, especially Videoton.592 These case studies suggest that, despite the limited success so far, there may be considerable scope for the transfer of technology and technology spillovers in central Europe.
By using the data in table 5.7.1, together with the corresponding data for 1993 or thereabouts, it is possible to analyse whether TNCs are an important catalyst for catching up with the EU. This can be done by relating the rate of convergence in labour productivity levels between the FIEs and DEs in the transition economies and all enterprises in the EU, to the percentage share of employment in FIEs by industry and the initial productivity gap in 1993.593 The rate of convergence is defined as the ratio of the 1998 and 1993 values of productivity (value added per employee) in each transition economy industry relative to the corresponding EU average:
EUCONVERGE = α + β1FIE + β2EUGAP + ε
where FIE is value added in foreign owned firms as a share of total value added and EUGAP is the labour productivity gap between the transition economy and EU industries in 1993. The estimates suggest that TNCs have played an important role in the catching-up process in the Czech Republic, Hungary and Poland, but it is statistically insignificant in the case of Estonia (table 5.7.2). TNCs thus appear to be transferring technology, but the evidence of spillovers is inconclusive. TNCs do not appear to be playing an important role in transferring technology to Slovenia, but there is strong evidence that the productivity gap itself is stimulating technical change and technological learning. Other channels of technology transfer may thus be more significant in Slovenia. The initial productivity gap appears to be an important stimulus in all the other countries, but is insignificant in the case of Hungary.
It is difficult to assess fully the role of FDI in the transition economies because the time series are so short. In the case of Hungary, FDI-driven exports and export-led growth appear to be key factors helping to narrow the gap with the EU. It may also be playing an important
592 A. Szalavetz, Sailing Before the Wind of Globalization: Corporate
Restructuring in Hungary, Hungarian Academy of Sciences, Institute for World Economics Working Paper, No. 78, 1997.
593 This section adopts the method for testing for productivity convergence developed by M. Blomström and E. Wolff, loc. cit. The authors estimate productivity convergence in two ways: (1) annual rate of growth of value added per employee in Mexican industry; and (2) the rate of convergence in labour productivity levels between corresponding Mexican and United States industries. This paper tests for productivity convergence using the second approach because it avoids constructing price indices for each industry.
role in other countries. In Poland, however, where the catch-up process started earlier and has been the most significant,594 it is likely that domestic resources have played the leading role. Whatever the impact of FDI, fundamental economic reform has been a precondition for attracting it and using it efficiently. At both the firm and industry levels, the evidence shows that FIEs in the transition economies have been closing the productivity gap with their EU counterparts, generally at a faster pace than domestic firms have been able to. However, there is little evidence that spillovers from FIEs to domestic firms have been important in this process.
5.8 Concluding comments and policies A number of transition economies have attracted
significant amounts of FDI, and several now rank quite high in this regard by global standards. However, large disparities in the distribution of FDI have emerged in the region, and there are signs that the differences are increasing. In particular, the low-income transition economies have lagged behind central Europe in their ability to attract FDI, and it is likely that the current pattern of FDI will exacerbate the income gaps among the transition economies, especially as economic growth and FDI can interact in a virtuous circle.
This chapter has shown that FDI has had a significant direct impact on the exports and economic growth of several transition economies, mostly those that have received substantial amounts of FDI. The analysis provides new evidence that the growth of labour
594 UN/ECE, Economic Survey of Europe, 2000 No. 1, chart 5.3.1
TABLE 5.7.2
Regression analysis of productivity convergence between selected east European and Baltic economies and EU industries, 1993-1998
Dependent variable: EUCONVERGE
Czech
Republic Hungary Poland Slovenia Estonia
Constant .......................... 1.804a 0.385 1.867a 2.218a 2.129a (7.44) (0.836) (8.36) (9.85) (3.48) FIE ................................... 1.219a 2.792a 0.590b -0.423c 0.125 (3.29) (4.44) (1.78) (-1.64) (0.13) GAP ................................. -1.837a -1.274c -2.169a -1.843a -4.126b (-3.61) (-1.50) (-2.56) (-4.11) (-1.97) R² ..................................... 0.71 0.67 0.43 0.67 0.29 F-statistic ......................... 12.22 9.97 3.79 9.23 2.02 Sample size ..................... 13 13 13 12 13
Source: UN/ECE secretariat. Note: Absolute value of the t-statistic shown in parentheses. Data based on
NACE Rev.1 classification and does not include the petroleum and coke sector. EUCONVERGE is defined as the ratio of the 1998 ratio of value added per employee in the transition economy industry to value added per employee in the corresponding average EU industry to their 1993 ratio. FIE for Hungary is the share of sales by foreign owned enterprises in total sales. The starting year for Estonia and Slovenia is 1995 and for the FIE average in Estonia, 1996.
a Denote significance at 1 per cent level. b Denote significance at 5 per cent level. c Denote significance at 10 per cent level.
Economic Growth and Foreign Direct Investment in the Transition Economies ________________________________ 219
productivity of FIEs in the manufacturing sector has generally been faster than that of DEs, although that was not the case in Slovenia. However, even in the countries where the impact of FDI appears to have been greatest, growth rates of GDP are still not sufficient to rapidly narrow income gaps with the EU. Studies of developing countries, however, suggest that FDI has a long-term impact on growth, and the same may be expected in the transition economies.
Despite the case for the importance of positive spillovers made by proponents of FDI, the statistical evidence for their existence in the market economies is mixed. The analysis presented here suggests that there have been few or no positive productivity spillovers from FDI in the transition economies. In manufacturing sectors, the presence of FIEs tends to be associated with relatively poor productivity growth in domestic enterprises. Moreover, on average, DEs perform poorly compared with FIEs in Hungary, the country with the greatest penetration of FDI. By contrast, in Slovenia, which has attracted comparatively little FDI, DEs have outperformed FIEs. Although these results need to be examined further, it is possible that a large FIE presence may hinder the adaptation of domestic enterprises to the market system (i.e. negative spillovers) by a premature intensification of domestic competition. Slovene domestic enterprises seem to have been relatively more successful in coping with this pressure. Determining an optimal degree of FDI penetration – large enough to create positive spillovers, but not so great as to inhibit adaptation by domestic enterprises – deserves greater attention.
It is important to bear in mind the limitations of the methodologies and data used in the analysis of FDI spillovers. Most of the cross-sectoral regressions presented above tested for intra-industry spillovers, but they may be of limited validity if the potential for significant spillovers is sector specific. Case studies may be a more appropriate way to explore this issue. Spillovers from FIEs to upstream and/or downstream DEs (interindustry spillovers) are potentially more important as channels for technology transfer, but it is not possible to test for interindustry spillovers using only sectoral data. Detailed enterprise data are needed, but, even in this case, the application of the necessary econometric techniques requires assumptions about enterprises which are unlikely to have been met, at least during the early stages of the transition. Statistical analyses of FDI spillovers also typically exclude those stemming from the non-manufacturing sectors – agriculture, extraction, financial services and telecommunications (the latter having attracted considerable amounts of FDI through privatization). The impact of service sectors may be particularly important given their underdevelopment during the period of central planning.
Even though FDI spillovers are not always found in long-established market economies, there are particular reasons why they might be absent in the transition economies. Linkages take time to develop and FDI is still a relatively new phenomenon in these countries. More
generally the transition environment has not always been conducive to their creation. With the collapse of central planning, managers focused on keeping enterprises afloat, dealing with payments arrears, beginning restructuring and, in some cases, preparing companies for privatization. To different degrees, enterprises were suddenly exposed to foreign competition when local trade regimes were liberalized with very little time to adjust. Many DEs are likely to have been too weak to respond to the competition from FIEs or to take advantage of the opportunities offered by FIEs as partners. To do so would require effective corporate governance (including managers used to strategic planning in a market environment) and sufficient resources to support adaptation to the new circumstances. Enterprises’ financial difficulties and the rudimentary state of the financial sector have often made it impossible to obtain bank credits, which either were not available or could be had only at high interest rates and short maturities (unlike the finance available to FIEs). Finally, some traditional (foreign) suppliers of FIEs have followed them into their new countries of operation, essentially pre-empting the development of potential domestic partnerships (in fact the FIEs may have actively encouraged traditional suppliers to do so).
Although dynamic FIEs can help to underpin economic growth, the absence of positive spillovers can lead to the emergence of an “enclave” economy, divided between high productivity FIEs and lagging domestic enterprises. Among other things, payment of above average wages by FIEs can lead to increasing income and regional inequalities. At the same time, attempts to match the wage rates of FIEs by domestic enterprises tends to undermine their competitiveness (because of their lower productivity) and increase the risks of bankruptcy. The exit of domestic firms from the market also increases the opportunities for monopolistic behaviour by FIEs.
In addition to their efforts to attract FDI, policy makers might consider more active measures to help maximize the long-term benefits of FDI, particularly those that facilitate the development of backward and forward linkages. Given the international commitments undertaken by many transition economies, the scope for policies to support the development of domestic firms is increasingly limited (e.g. by national treatment clauses). However, the promotion of positive spillovers involves sound stabilization policies (fostering lower domestic interest rates), improving the functioning of the banking system and capital markets, educational reforms to increase the supply of appropriate skills, the provision of new infrastructure, etc. Effective competition policies could help to protect domestic firms from unfair FIE competition (predatory practices). In particular domestic firms may need to be strengthened so that they can compete more effectively with FIEs (i.e. to avoid negative spillovers including the bankruptcy of potentially viable domestic firms) or become more attractive partners for FIEs in upstream and downstream operations. Additional steps might also be taken to improve both the national innovation system and the absorptive capacities of local
220________________________________________________________________ Economic Survey of Europe, 2001 No. 1
enterprises. Since FDI is only one among several channels of technology transfer, such a policy is likely to attract the kinds of FDI that would result in technological spillovers. Small and medium enterprise development programmes, often partially funded by the development banks, including multilateral institutions, could also adopt the potential for spillovers as a criterion for the selection of projects. Overall, such measures could help to avoid the emergence of FDI enclaves.
FDI inflows have helped to ease balance of payments constraints and thus increase the availability of resources for development. As noted above in section 3.6(iv), countries with low levels of FDI (which is usually symptomatic of other problems) have been prone to external payments problems. In recent years, policy makers have often counted on FDI as a major source of external financing, a preference which is likely to continue. However, as large-scale privatization winds down, FDI inflows are expected to diminish – other things being equal.
Although the short-term impact of FDI is often positive, it is possible to overlook the fact that it can eventually have a negative effect on the balance of payments if export revenues fail to offset FDI-related imports and profit repatriation. Estimates for Hungary and Azerbaijan indicate a positive effect of FDI so far, but for different reasons these two countries may not be representative. An issue for policy makers is whether it is possible and desirable to discriminate in favour of FDI, which is likely to have positive rather than negative balance of payments consequences. The issue may be particularly important for the majority of transition economies, which already have structural current account deficits.
A related question is how to channel foreign capital into productive investment and exports, as opposed to, for example, real estate speculation.595 Recent experience has shown that a concentration of FDI in the non-tradeable sector may weaken export performance (due to real exchange rate appreciation) and make the host country more vulnerable to economic crises.596
The current economic situation in the ECE region seems favourable to further increases of FDI in the transition economies. With improved growth prospects for western Europe (the main source of FDI in the transition economies), increased FDI can be expected as part of the continuing process of economic integration and “internationalization” of production processes.
To varying degrees all the transition economies wish to promote FDI. There is considerable international experience of how to do this, but global competition for FDI is now intense (more so than in the 1970s and 1980s). Moreover, in coping with the legacy of industrial
595 Thailand, for example, tried to curb foreign speculation in the real
estate market by taxing foreign investment. 596 Work by UNCTAD has shown that in the later stages of South-
East Asia’s expansion, FDI flows had a reduced impact on export growth because they were directed to the non-tradeable goods sectors. UNCTAD, Trade and Development Report, 1999, p. 122.
development under central planning, the transition economies are often in competition for FDI among themselves, including for large strategic investments.
A general policy approach to FDI promotion necessarily involves strengthening domestic economic fundamentals.597 These include political and macroeconomic stability, long-term growth prospects, market access, the availability of skilled workers and the state of infrastructure. In the transition economies they also include necessary market reforms and structural transformation. While success in these areas may not necessarily result in more foreign investment, they are nevertheless necessary conditions for growth based on domestic resources.598 In the end, domestic and foreign investors tend to be motivated by similar factors.
With the tendency to focus on central Europe in discussions of the transition process, sight is sometimes lost of the fact that about one third of the transition economies have yet to achieve macroeconomic stabilization (as indicated by their very high inflation rates) or to make much progress with structural transformation. Beyond stabilization and the economic “fundamentals”, policies toward FDI do seem to be important. The mode of privatization (via vouchers or management buyouts: Czech Republic, Slovakia, Russia), the discouragement of foreign investors (Slovenia), the introduction of investment incentives (recently the Czech Republic), the nature of science and technology policy (Hungary) can all make a difference as to whether FDI flows into a country or not. In a number of natural resource-rich countries, a workable production-sharing agreement (PSA) law appears to be important: this has attracted foreign investment to large projects in several countries, but in Russia the PSA framework still needs to be improved.
As part of a strategy to attract FDI, some countries have used business surveys to identity and, where possible, eliminate specific obstacles to foreign investment. The experience of Estonia is of particular interest because it has long been one of the most successful countries in this regard. Nevertheless, the survey results indicate that there is still room for improvement (table 5.8.1). This approach may be especially important for countries seeking to maintain FDI as privatization revenues become exhausted: as this occurs, there will be an increasing emphasis on greenfield (and follow-up) investments which may be more sensitive to the types of obstacles listed in table 5.8.1 than are large strategic FDI privatizations.
For the countries that have received very little FDI, fundamental economic and institutional reform is essential (and not only for the sake of attracting FDI), but often the commitment of the authorities (including parliaments) is
597 Interviews with corporate managers indicate that investors, when
selecting the site for a major investment project, tend to attach more importance to the “fundamentals”, than to fiscal or financial incentives provided by the prospective host government. C. Oman, “Policy competition for direct foreign investment”, OECD Development Centre Studies (Paris), 2000.
598 Ibid.
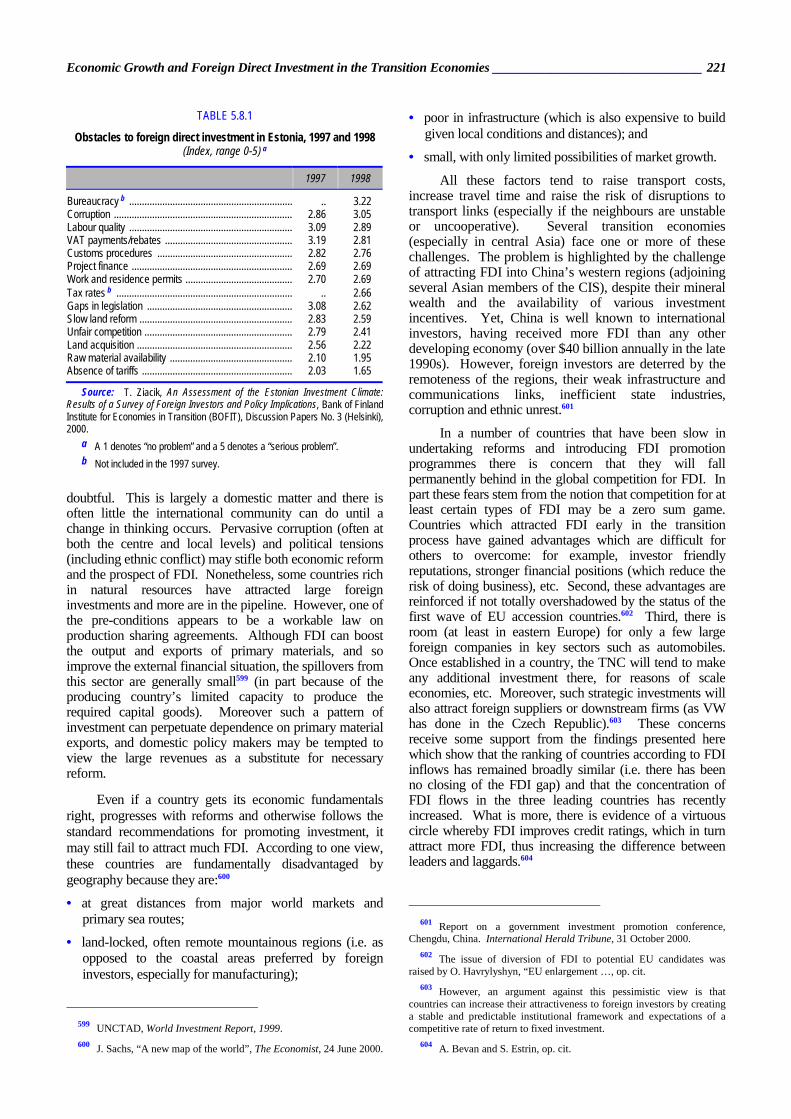
Economic Growth and Foreign Direct Investment in the Transition Economies ________________________________ 221
doubtful. This is largely a domestic matter and there is often little the international community can do until a change in thinking occurs. Pervasive corruption (often at both the centre and local levels) and political tensions (including ethnic conflict) may stifle both economic reform and the prospect of FDI. Nonetheless, some countries rich in natural resources have attracted large foreign investments and more are in the pipeline. However, one of the pre-conditions appears to be a workable law on production sharing agreements. Although FDI can boost the output and exports of primary materials, and so improve the external financial situation, the spillovers from this sector are generally small599 (in part because of the producing country’s limited capacity to produce the required capital goods). Moreover such a pattern of investment can perpetuate dependence on primary material exports, and domestic policy makers may be tempted to view the large revenues as a substitute for necessary reform.
Even if a country gets its economic fundamentals right, progresses with reforms and otherwise follows the standard recommendations for promoting investment, it may still fail to attract much FDI. According to one view, these countries are fundamentally disadvantaged by geography because they are:600
• at great distances from major world markets and primary sea routes;
• land-locked, often remote mountainous regions (i.e. as opposed to the coastal areas preferred by foreign investors, especially for manufacturing);
599 UNCTAD, World Investment Report, 1999. 600 J. Sachs, “A new map of the world”, The Economist, 24 June 2000.
• poor in infrastructure (which is also expensive to build given local conditions and distances); and
• small, with only limited possibilities of market growth.
All these factors tend to raise transport costs, increase travel time and raise the risk of disruptions to transport links (especially if the neighbours are unstable or uncooperative). Several transition economies (especially in central Asia) face one or more of these challenges. The problem is highlighted by the challenge of attracting FDI into China’s western regions (adjoining several Asian members of the CIS), despite their mineral wealth and the availability of various investment incentives. Yet, China is well known to international investors, having received more FDI than any other developing economy (over $40 billion annually in the late 1990s). However, foreign investors are deterred by the remoteness of the regions, their weak infrastructure and communications links, inefficient state industries, corruption and ethnic unrest.601
In a number of countries that have been slow in undertaking reforms and introducing FDI promotion programmes there is concern that they will fall permanently behind in the global competition for FDI. In part these fears stem from the notion that competition for at least certain types of FDI may be a zero sum game. Countries which attracted FDI early in the transition process have gained advantages which are difficult for others to overcome: for example, investor friendly reputations, stronger financial positions (which reduce the risk of doing business), etc. Second, these advantages are reinforced if not totally overshadowed by the status of the first wave of EU accession countries.602 Third, there is room (at least in eastern Europe) for only a few large foreign companies in key sectors such as automobiles. Once established in a country, the TNC will tend to make any additional investment there, for reasons of scale economies, etc. Moreover, such strategic investments will also attract foreign suppliers or downstream firms (as VW has done in the Czech Republic).603 These concerns receive some support from the findings presented here which show that the ranking of countries according to FDI inflows has remained broadly similar (i.e. there has been no closing of the FDI gap) and that the concentration of FDI flows in the three leading countries has recently increased. What is more, there is evidence of a virtuous circle whereby FDI improves credit ratings, which in turn attract more FDI, thus increasing the difference between leaders and laggards.604
601 Report on a government investment promotion conference,
Chengdu, China. International Herald Tribune, 31 October 2000. 602 The issue of diversion of FDI to potential EU candidates was
raised by O. Havrylyshyn, “EU enlargement …, op. cit. 603 However, an argument against this pessimistic view is that
countries can increase their attractiveness to foreign investors by creating a stable and predictable institutional framework and expectations of a competitive rate of return to fixed investment.
604 A. Bevan and S. Estrin, op. cit.
TABLE 5.8.1
Obstacles to foreign direct investment in Estonia, 1997 and 1998 (Index, range 0-5) a
1997 1998
Bureaucracy b ................................................................ .. 3.22 Corruption ...................................................................... 2.86 3.05 Labour quality ................................................................ 3.09 2.89 VAT payments/rebates .................................................. 3.19 2.81 Customs procedures ..................................................... 2.82 2.76 Project finance ............................................................... 2.69 2.69 Work and residence permits .......................................... 2.70 2.69 Tax rates b ..................................................................... .. 2.66 Gaps in legislation ......................................................... 3.08 2.62 Slow land reform ............................................................ 2.83 2.59 Unfair competition .......................................................... 2.79 2.41 Land acquisition ............................................................. 2.56 2.22 Raw material availability ................................................ 2.10 1.95 Absence of tariffs ........................................................... 2.03 1.65
Source: T. Ziacik, An Assessment of the Estonian Investment Climate: Results of a Survey of Foreign Investors and Policy Implications, Bank of Finland Institute for Economies in Transition (BOFIT), Discussion Papers No. 3 (Helsinki), 2000.
a A 1 denotes “no problem” and a 5 denotes a “serious problem”. b Not included in the 1997 survey.

222________________________________________________________________ Economic Survey of Europe, 2001 No. 1
Among other things, transition economies beyond central Europe may currently suffer from a locational disadvantage – the combination of distance from west European markets and inadequate infrastructure. However, this problem should not be insurmountable. The Bulgarian Black Sea coast (as well as all the states of the former SFR of Yugoslavia, the Baltic states, Belarus, the Republic of Moldova, most of Ukraine and parts of Russia) is 1500 kilometres from the centre of Germany, much less than the dimensions of the current EU and the United States single markets. These outlying countries could therefore become more
attractive to foreign investors if they were connected with western Europe by an efficient and integrated telecommunications and transport infrastructure (for example, clearing the Danube waterway will help in the short run). The international investment banks (EBRD, EIB and World Bank) are all engaged in upgrading the infrastructure of the transition economies, but it remains questionable whether the infrastructure plans are sufficiently coherent – and on a sufficient scale – to overcome the locational disadvantages of these economies and integrate them more closely into the broader European economy.
Economic Growth and Foreign Direct Investment in the Transition Economies ________________________________ 223
ANNEX TO CHAPTER 5 MEASURING TECHNOLOGY TRANSFER AND SPILLOVERS
Section 5.6 examined technology transfer and spillovers through the use of panel data. The analysis of the data starts from a standard growth accounting approach,605 the objective of which is to study the various factors that affect overall productivity, including the diffusion of technology. This is done by decomposing total factor productivity (TFP) growth into factors internal and external to the firm, including R&D investments and human capital, and different sources of international technology transfer, respectively.
The model assumes that the production function of enterprise i has the following form: γβαititititit NLKAY = ... (1)
where Yit is gross output, Kit, Lit and Nit represent capital stock, labour input and materials, respectively, and Ait is TFP. The production function is homogenous of degree r in K, L and N, so that r = α+β+γ≠ 1.606 To get the TFP of each enterprise, it is necessary to differentiate the equation with respect to time. Under the assumption that the marginal product of each input is equal to its factor price, the equation can be rewritten as:
ititititit nlkay γβα +++= … (2)
where yit = log (Yit+1/Yit), ait = log (Ait+1/Ait), kit = log (Kit+1/Kit), lit = log (Lit+1/Lit), and nit = log (Nit+1/Nit). TFP growth, or technological progress, is therefore the difference between the growth of output and the weighted sum of the growth of inputs, the weights being the individual shares of the factors in total output.
Estimating these equations at an aggregate level will lose some information concerning the average technology stock and average TFP growth. Since the technology parameter is the residual, i.e. that part of the change in output that cannot be explained by the variance of factor inputs, it says nothing about the factors that influence TFP growth. In reality this residual may capture a number of factors that may have little in common with technology levels or TFP growth. In this specification the technology parameter depends crucially on the goodness of fit of the model. This is especially true in transition economies, in which this estimation approach – due to an inefficient utilization of production factors – may return incorrectly high parameters for technology level or TFP growth.607
Ideally the model should include those factors that determine the level of technology or its growth. This is difficult since technology embodies skills and knowledge that are not easy to measure. The model used in section 5.6 assumes that the firm’s technology level Ait is determined as:
),,,,,,,( tjititjtiititiit ddMXSFHRDGA = ... (3)
where RDit and Hit capture the sources of technology internal to the firm, and factors Fi through Mit capture the sources external to the firm, i.e. international technology spillovers. RDit represents annual R&D expenditures (relative to output), Hit indicates accumulated human capital (measured as average labour costs per employee), Fi is a dummy variable for foreign ownership, Sjt measures intra-industry R&D spillovers stemming from foreign owned firms (measured as the share of foreign owned firms in industry j’s domestic sales and exports), Xit and Mit refer to the export propensity (exports to sales ratio) and import propensity (ratio of imports to material costs) of the firm, respectively, while dj and dt are sector and time dummies.
605 R. Solow, “Technical change and the aggregate production function,” Review of Economics and Statistics, Vol. 39, August 1957, pp. 312-320. 606 S. Basu and J. Fernald, Aggregate Productivity and the Productivity of Aggregates, NBER Working Paper, No. 5382 (Cambridge, MA), December 1995. 607 J. Damijan and S. Polanec, “Is Vintage Capital Important? Efficiency of Foreign vs. Domestic Firms in Slovenia,” University of Ljubljana, 2000,
mimeo. They show that foreign owned firms in Slovenia had significantly lower parameters of technology level as compared with domestic firms from 1994 to 1998.
224________________________________________________________________ Economic Survey of Europe, 2001 No. 1
The term R&D (RDit) captures the absorptive capacity of the enterprise. This factor reflects both the innovation effect and the learning or absorption effect of R&D activity. These two knowledge effects are separated in the model by considering RDit as internal to the firm and RDitSjt as external to it. The stock of human capital (Hit) represents the skills of the workforce, improvements in which raise the overall productivity of the firm. Enterprises employ labour of different skills, which employees acquire through education and training both inside and outside the firm. Human capital is assumed to lie within the firm’s scope in this model since it indicates the firm’s eagerness to enhance its technology level by engaging skilled workers. Inter-firm diffusion of labour (job reallocation) is captured by the variable Sjt, which represents intra-industry spillovers from foreign to domestic firms. The model assumes that some workers trained by foreign firms migrate to domestic firms. Labour costs per employee proxy the human capital stock of the enterprise, which assumes that, on average, firms with higher average per capita labour costs employ relatively more skilled labour. Human capital will thus have a differential impact on TFP growth in foreign relative to domestic firms.
If FDI is an efficient channel of technology transfer, it is reasonable to infer that the “foreign ownership factor” (Fi) not only shifts the technological constant Ait of the host firm but also affects the efficiency of its factor utilization. As a consequence, it is not possible to assume identical production functions across firms: allowance has to be made for the differences in efficiency with which foreign owned and domestic firms use capital, labour and materials. This is allowed for by multiplying K, L and N by foreign ownership dummys (Fikit, Filit, Finit) to obtain different parameters for foreign and domestic firms. A dummy variable is also included in the model to separate majority owned foreign firms from minority owned foreign firms. This is to find out whether majority foreign ownership facilitates the transfer of more complex technology and management skills to local firms.
For firms without foreign participation, knowledge spillovers (Sjt) from foreign firms in the same industry may be important. These externalities, however, may not always be positive, as local enterprises may be “crowded out” by foreign enterprises if they do not have the capability to adapt quickly enough. Foreign enterprises create externalities by demonstrating new technologies and management methods, enhancing competition, and creating backward and forward linkages with local suppliers and by workforce training. Previous studies control for these effects either by taking the foreign share of aggregate employment in an industry or the aggregate foreign share of total output. The model tests for these externalities by including two variables that control for crowding out caused by relatively large domestic sales of foreign enterprises and for the imitation and agglomeration effects stimulated by the export orientation of foreign enterprises. These variables are the share of domestic sales by foreign firms in an industry’s total domestic sales (S.Djt) and the share of foreign exports in an industry’s total exports (S.Xjt). Finally, the model also tests for the importance of international trade by including the export propensity (Xit, the export to output ratio) and import propensity of the firm (Mit, the ratio of imports to material costs).
In addition to allowing foreign and domestic firms to differ in terms of the efficiency with which they use factor inputs, sector specific effects are captured in dummy variables dj. In the transition economies it is also necessary to assume that the efficiency of enterprises will improve over time as more productive capital and skilled labour are employed. The model controls for this by including a time variable dt. In the absence of other proxies, the time variable is also intended to capture time-specific aggregate shocks to the whole economy, shocks which are inherent to transition economies.
The results of three different tests are presented in tables 5.6.8-5.6.10. Table 5.6.8 considers the importance of direct transfers of technology through FDI to selected local firms. The equation supporting this table can be written as:
itttjjjtjtitiititiitiitiitititiitit ddXSDSHFHnFlFkFnlkFby εψθνµλκϕφχγβαδ ++++++++++++++= .. ... (4)
where bit is a log of a constant term (the residual that accounts for alternative sources of TFP growth not accounted for in the model), δ measures the difference in TFP growth rates between domestic and foreign firms, α, β, γ, and χ, φ, ϕ represent shares of factor inputs in domestic and foreign firms, respectively, κ and λ represent the impact of human capital in domestic and foreign firms, µ and ν measure intra-industry spillovers from foreign to domestic firms in domestic and export markets, respectively, θ and ψ are parameters of sector and time dummies, while ε is the error term.
Table 5.6.9 analyzes the associated, indirect intra-industry spillovers from FDI to other firms in the economy. The equation supporting this table considers only domestic firms and can be written as:
itttjjjtit
jtitjtjtititiititiitiitiitititiitit
ddXSRDDSRDXSDSRDHFHnFlFkFnlkFby
εψθτρνµηλκϕφχγβαδ
+++++++++++++++++=
....
… (5)
where η is the rate of return on firms’ R&D investments (the parameter of innovative capacity), and ρ and τ measure absorptive capacity to technology shocks in domestic and exports markets.
Economic Growth and Foreign Direct Investment in the Transition Economies ________________________________ 225
Table 5.6.10 investigates the importance of alternative sources of technology for firms without FDI, including imports of capital and intermediate goods and learning by exporting. The equation supporting this table also considers only domestic firms and can be written as:
itttjjitit
ititititititiititiitiitiitititiitit
ddMRDXRDRDMXHFHnFlFkFnlkFby
εψθωυηπολκϕφχγβαδ
+++++++++++++++++=
... (6)
where, in addition to (4), ο and π represent international R&D spillovers via firms’ exports and imports, η is the rate of return on firms’ R&D investments, υ and ω measure the absorptive capacity of domestic firms to technology shocks through exports and imports. International R&D spillovers to domestic firms are measured by the share of imports in total costs of materials (imports of capital equipment and intermediate goods) and by the share of exports in total sales (indicating capability of firms to meet high quality standards in western markets).
The estimates in tables 5.6.8-5.6.10 use a random effects model to deal with the changes in TFP over time. The reason for this choice is that OLS estimators may give biased and inconsistent estimates of TFP because they suffer from probable correlation between the productivity effects and the output variable.608 As there are no suitable firm-specific instruments to control for this problem, it is necessary to use either the random or fixed effects model to take firm-specific effects into account.609 Though preferable to OLS, neither technique is absolutely accurate for estimating the above equations. Fixed effects models assume constant TFP growth over time for a single firm. Even though the Hausman test shows that the fixed effects model provides a better specification of equations (4)-(6), the assumptions of this model are inappropriate given that the aim of this study is to examine the impact of different factors on changes in TFP. However, the assumption that changes in TFP at the firm level are uncorrelated over time is a major disadvantage of the random effects model.
608 S. Djankov and B. Hoekman, “Foreign investment and productivity growth in Czech enterprises”, The World Bank Economic Review, Vol. 14, No. 1
(Washington, D.C.), 2000, pp. 49-64. 609 For a discussion on the use of different panel data techniques see C. Hsiao, Analysis of Panel Data (Cambridge, Cambridge University Press,
1986), and H. Baltagi, Econometric Analysis of Panel Data (Chichester, John Wiley and Sons, 1995).