Embed Size (px)
Citation preview

170
CHAPTER 5
DETERMINATION OF PERCENTAGE OF HYDROPHILICITY AND HYDROPHOBICITY AND SURFACE FREE ENERGY COMPONENTS AT BASAL AND EDGE SURFACES OF TALC BY FLOW MICROCALORIMETRY
5.1- Introduction
The adhesion between mineral surfaces and organic polymers is important in
many industrial products. Examples range from paints to filled plastics and fiber
reinforced composites. Talc, for example, is well known to be an important reinforcing
filler for polyolefins such as polypropylene (PP) and polyethylene (PE) [1]. Usually, for
this application, there is no need to treat the mineral surfaces since the basal planes of
talc are naturally hydrophobic thus matching the non-polarity of PP and PE.
Nonetheless, it is believed that the interaction between talc and non-polar polyolefins is
more favorable as the ratio basal planes/edge or hydrophobic/hydrophilic surfaces of
talc increases.
However, in many cases the mineral surface has to be modified with coupling
agents, or adhesion promoters, to achieve sufficient adhesion. Indeed, polar minerals
used in the polymer industry such as mica [2], glass fibers [3], calcium carbonate [4]
and nanoclays (montmorillonite) [5] have to be surface treated in many cases. Lewis
acid–base interactions (electron acceptor–donor interactions) between mineral surfaces
and functional groups in surface treatment chemicals or polymers play an important role
for the adhesion in mineral–polymer systems. It is thus important to characterize the
acid–base properties of the mineral surfaces. This information, together with the acid–
base characteristics of the polymer and the additives, make it possible to predict the
Lifshitz-van der Waals and the acid-base interactions between the components. Based

171
on this, one can make an intelligent choice of the best combination of mineral, polymer
and additives to improve adhesion.
Several investigators have used the flow microcalorimetry (FMC) to estimate
the acidic and basic surface properties of minerals and polymers [6-8]. Of significant
importance is Fowkes’ flow microcalorimetic work that led to important advances in the
understanding of the interactions between mineral fillers, polymers, and polymer
additives [9, 10].
In other application fields such as pitch control for the pulp and paper industry,
the dual surface character of talc plays an important hole. The hydrophilic nature of the
edges allows the particles to be dispersed in water, while the hydrophobic basal planes
attract the sticky hydrophobic components of the wood pulp. Since the basal surface of
talc is hydrophobic and the edge surface is hydrophilic, one can expect that the values
of the total surface free energies, TotalSγ , and its parameters and components
( LWSγ , AB
Sγ , Sγ and Sγ
⊕ ) at the basal surfaces should be different compared to those at the
edge surfaces. This same concept was used by van Oss [11, 12] to individually
determine the surface free energy components of the hydrophobic hydrocarbon chain
and the hydrophilic head group of ionic surfactants.
The work of Yildirim [6] was, to the best of our knowledge, the first that
determined individually the acid-base properties from the hydrophobic basal planes and
hydrophilic edges of talc also using FMC combined with thin layer wicking. As pointed
out by that author these pieces of information are crucial for gaining a deeper
understanding of the origin of molecular interaction and strength of adhesion at the
interface of two interacting materials, i.e, talc/polymers, talc/pitch, etc. Additionally, they
would be useful to determine if a given surfactant adsorbs preferentially on the basal or
edge surfaces. From the commercial point of view, such information could be useful for
the selection of surfactant and thus improving the performance of existing products and
developing entirely new product lines.

172
Although calorimetry is one of the older instrumentation-based techniques, FMC
is a comparatively new addition to the field [13]. Most of the calorimeters used to study
adsorption operate under static (or closed-system) conditions. The FMC is unique
because it makes its measurements from a flowing fluid stream and it has been proved
to be a powerful tool for characterizing solids surfaces/interfaces and their interactions
with fluids. This method has several advantages: fast response times for kinetics
measurements in controlled gaseous and liquid environments, use of multiple and
different probes, quantification of reversibility, differentiation between reversible
adsorption (physisorption) and irreversible (chemisorption).
The technique was invented and improved by Groszek [14]. One of the early
applications of flow calorimetry was to estimate surface areas of minerals [15, 16]. The
first commercial flow microcalorimeter was developed by Microscal in the beginning of
the seventies [17, 18]. Since then, it has been widely used in various studies at liquid-
solid and gas-solid interfaces and review of this work has been published elsewhere
[19, 20].
Some authors have considered this technique the most useful for gaining insight
into adsorption interactions between a range of probe molecules and filler surfaces [21].
In this chapter, the FMC was used aiming two main objectives:
• determination of percentage of hydrophilicity and hydrophobicity of talc surface
by flow microcalorimetry;
• surface free energy characterization of basal and edge surfaces of talc by
combining FMC and thin layer wicking.
5.2- Description of the calorimetric device and technique
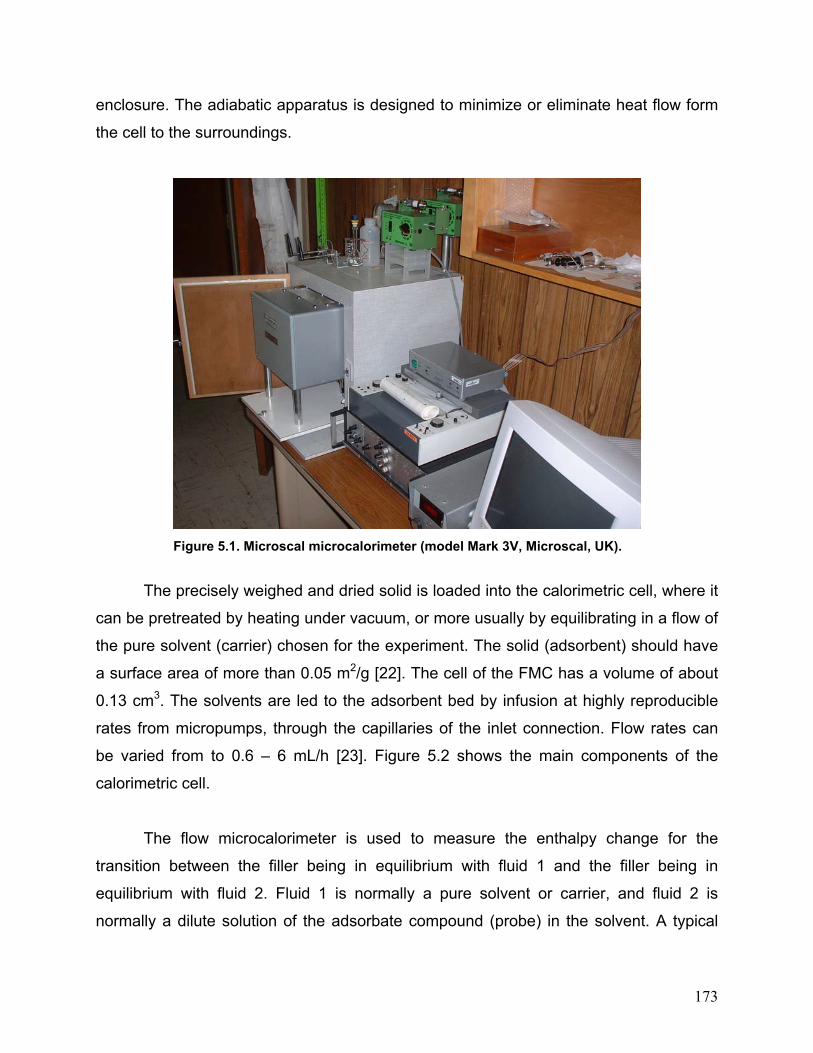
Figure 5.1 shows the FMC in the draft proof enclosure on the left-hand side and
the electronics and read-out to the right; two micro-pumps are located on the top of the
173
enclosure. The adiabatic apparatus is designed to minimize or eliminate heat flow form
the cell to the surroundings.
Figure 5.1. Microscal microcalorimeter (model Mark 3V, Microscal, UK).
The precisely weighed and dried solid is loaded into the calorimetric cell, where it
can be pretreated by heating under vacuum, or more usually by equilibrating in a flow of
the pure solvent (carrier) chosen for the experiment. The solid (adsorbent) should have
a surface area of more than 0.05 m2/g [22]. The cell of the FMC has a volume of about
0.13 cm3. The solvents are led to the adsorbent bed by infusion at highly reproducible
rates from micropumps, through the capillaries of the inlet connection. Flow rates can
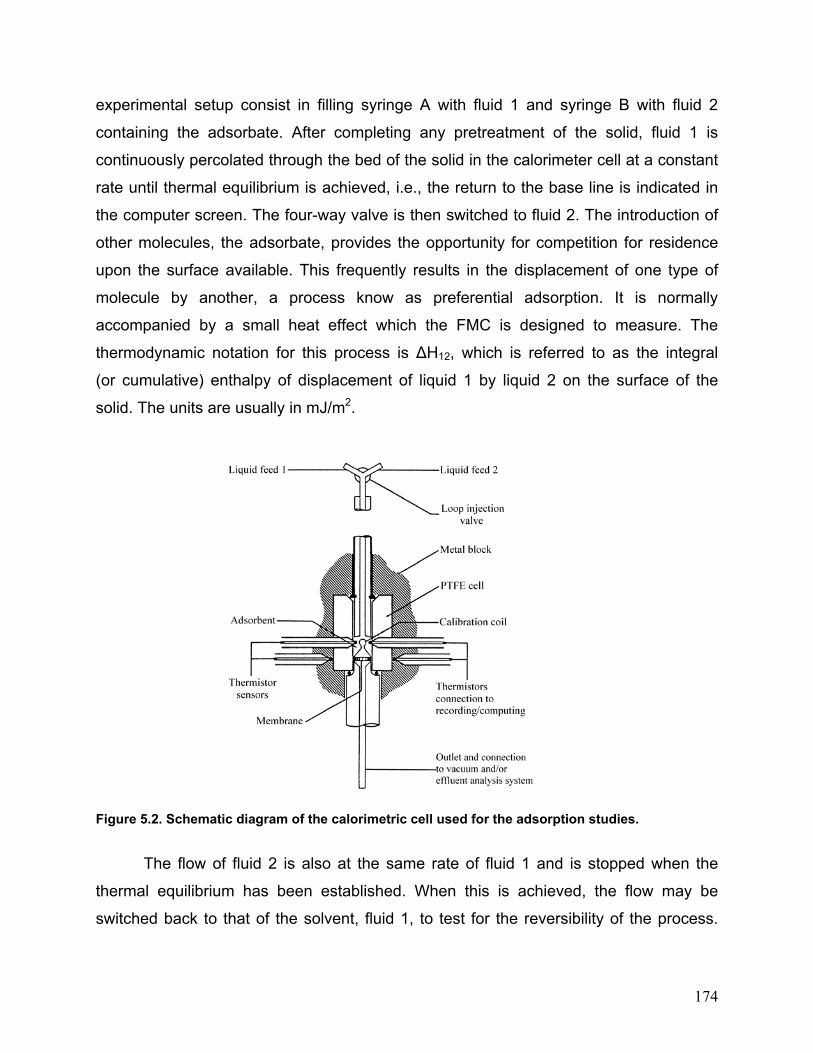
be varied from to 0.6 – 6 mL/h [23]. Figure 5.2 shows the main components of the
calorimetric cell.
The flow microcalorimeter is used to measure the enthalpy change for the
transition between the filler being in equilibrium with fluid 1 and the filler being in
equilibrium with fluid 2. Fluid 1 is normally a pure solvent or carrier, and fluid 2 is
normally a dilute solution of the adsorbate compound (probe) in the solvent. A typical
174
experimental setup consist in filling syringe A with fluid 1 and syringe B with fluid 2
containing the adsorbate. After completing any pretreatment of the solid, fluid 1 is
continuously percolated through the bed of the solid in the calorimeter cell at a constant
rate until thermal equilibrium is achieved, i.e., the return to the base line is indicated in
the computer screen. The four-way valve is then switched to fluid 2. The introduction of
other molecules, the adsorbate, provides the opportunity for competition for residence
upon the surface available. This frequently results in the displacement of one type of
molecule by another, a process know as preferential adsorption. It is normally
accompanied by a small heat effect which the FMC is designed to measure. The
thermodynamic notation for this process is ∆H12, which is referred to as the integral
(or cumulative) enthalpy of displacement of liquid 1 by liquid 2 on the surface of the
solid. The units are usually in mJ/m2.
Figure 5.2. Schematic diagram of the calorimetric cell used for the adsorption studies.
The flow of fluid 2 is also at the same rate of fluid 1 and is stopped when the
thermal equilibrium has been established. When this is achieved, the flow may be
switched back to that of the solvent, fluid 1, to test for the reversibility of the process.

175
Desorption will then commence and go to completion for physically adsorbed species. If
the adsorbate was chemisorbed, little or no desorption takes place.
The Microscal FMC has a moderately rapid response time; about 1-3 s at the
recommended flow rate of 3 mL/h. Observed leg time after switching fluids is primarily
related to the length of connecting tubing [22].
The heat (and hence temperature) change during the adsorption process is
measured by four highly sensitive thermistors. In the Microscal Mark 3V model, two
glass encapsulated thermistors are in direct contact with the calorimetric cell and the
other two, used as reference, are embedded in the metal block. The thermistors thus
form a Wheatstone bridge circuit that can respond to differences in temperature of
10-5 oC. Microscal have produced their own PC-based software for control and data
analysis system called Calorimeter Digital Output and Sequencer (CALDOS).
Calibration can be performed at any time by using the proper outlet connection. A
known voltage from a battery is passed for a timed interval through the coil, which must
be completely introduced into the adsorbent, and the corresponding dissipated energy
can be determined. Injection of a known amount of heat results in a pulse being
produced on the chart, its area being proportional to the amount of heat injected. As
determined by Allen and Patel [24], the thermistors and the calibration coil must be
completely covered by the test solid for an accurate and reproducible calibration. A
typical thermogram output from a calorimetric experiment is shown in Figure 5.3 below.
Figure 5.3. Typical thermogram output from a FMC experiment.

176
The peak areas in the thermal data are proportional to the energy changes that
have occurred. They are integrated and then converted into absolute values of energy
using the calibration constant.
Lastly, HPLC1 and refractometer detectors can be connected in series with the
microcalorimeter and used to determine simultaneously the adsorption and integral
enthalpy isotherms on the same sample of solid, thus avoiding some sampling problems
[25, 26]. These conditions are crucial for studying industrially significant surface
interactions with substances such as catalysts, metals, surfactants, oxides, pigments
and fillers, in process that are better modeled using a flow-through (or open-system)
method.
5.3- Determination of hydrophobic and hydrophilic surface sites of talc using FMC
Solid surfaces usually consist of a number of chemically different sites, some of
which may be hydrophobic and others hydrophilic. This is indeed the case of the
mineral talc which has a hydrophobic basal plane and hydrophilic edges, as discussed
in Chapter 1. Of particular interest for the purpose of this study is the application of FMC
for the determination of the percentage of hydrophilic (polar) and hydrophobic (apolar)
surface sites on powdered talc surfaces.
The hydrophilicity or hydrophobicity of a powdered solid is of vital importance in
various fields such as polymers, ceramics, electronics etc [13]. When dealing with
liquids this property is readily measured by miscibility and enthalpy of mixing. The
situation is more complicated with solid surfaces. The shape of the adsorption isotherm
of water [27], the heat of immersion [28-30] and contact angle measurements [31] have
been proposed so far as criteria for assessment of hydrophilicity/hydrophobicity ratio of
different solids. All these methods are valuable tools particularly when dealing with
highly hydrophobic solids or with highly hydrophilic ones, e.g. hydroxides. When at the 1 HPLC – High Performance Liquid Chromatography.

177
same surface both hydrophobic and hydrophilic parches are present, the detection and
evaluation of both kind of sites is not easy to achieve.
Groszek and Partyka’s [32, 33] method may be used for estimating the
hydrophobic and hydrophilic surface sites of talc samples. These authors suggested
that instead of measuring the heats of wetting or adsorption of individual polar or apolar
liquids, as done by some researches in the field [34, 35], the measurement of heats of
butanol adsorption from polar and apolar liquids on a solid surface would permit a more
accurate evaluation of relative hydrophobicity/hydrophilicity.
To determine the percentage of hydrophobicity, the heat of adsorption of butanol
is measured from a butanol-in-water solution (10 g/l). It is believed that the heat effect is
mostly due to the adsorption of butanol on the hydrophobic sites of the sample, with the
hydrocarbon tails interacting with the hydrophobic surface via van der Waals force, and
the OH-groups pointing towards the aqueous phase, as schematically shown in Figure
5.4-a. In this case, the butanol cannot displace water from the edges since water has a
higher dipole moment and is more strongly attracted. Thus, the heat of adsorption of
butanol form water is therefore related to the total accessible hydrophobic surface area.
By dividing this heat effect, given in units of mJ/m2, to the reference heat of adsorption
of butanol from water on Graphon at the monolayer coverage (∆H12 = 17.6 mJ/m2)
[32, 36], one can determine the hydrophobic surface area of the test solid. Graphon is a
graphitized carbon black prepared by heating a carbon black in an inert atmosphere to
2700oC. It was chosen as reference material since it is a very homogeneous and
considered almost hydrophobic on all sites [37, 38].
One can also determine the area of the hydrophilic surface (i.e., edge surface) by
contacting a talc sample with a butanol-in-n-heptane solution (2 g/l). The heat effect is
largely due to the adsorption of butanol on the hydrophilic edge surface with the polar
head (-OH groups) interacting, probably via hydrogen bonds, with the talc’s edge
surface and its hydrocarbon tails stretched in the n-heptane phase, as schematically
shown in Figure 5.4-b. Therefore, the heat of preferential adsorption of butanol form

178
n-heptane, i.e. the heat of solvent displacement, is related to the total accessible polar
surface. One can determine the percentage of hydrophilic surface by dividing the heat
effect with the heat of adsorption of butanol from n-heptane on silica at the monolayer
coverage (∆H12 = 197 mJ/m2) [39]. In this case, a specific silica sample [39] is chosen
as a model reference solid, since it was considered hydrophilic on all sites, i.e., 100%
hydrophilic. It is important to stress that different silica samples will have different
degrees of hydrophilicity/hydrophobicity ratio [34].
Figure 5.4. Idealized orientations of butanol from water (a) and butanol from heptane (b) adsorption onto talc basal and edge surfaces, respectively.
In conclusion, this method allows to independently determine the hydrophobic
and hydrophilic surface areas of practically any solid that has dual surface character
[32].

179
One might argue that the changes of solution concentration required to obtain
adsorption isotherms produce heat effects which may be large enough in relation to the
heats of adsorption to affect accuracy. However, as determined experimentally by
Groszek [20], changes of concentration of the order of 1-2 percent by weight produce
heats of mixing which can be considered negligible compared to much larger heats of
adsorption.
5.4- Determination of area ratios of talc samples
As described in Chapter 4, the shape and aspect ratios of particles have usually
been evaluated by means of Transmission Electron Microscopy (TEM) and Scanning
Electron Microscopy (SEM). The use of different particle size methods to determine the
aspect ratio of lamellar particles is relatively a new procedure that was prove to be
reliable and easy to perform.
In the present work, another simple method is used for determining the basal
surface area to edge surface area ratio (area aspect ratio) values of talc particles.
Essentially, the method of determining the values of the area ratios of talc samples is
the same as that of the estimation of the hydrophobic and hydrophilic surface area of
talc samples, as described in section 5.3. The area ratio is then obtained from the ratio
between the hydrophobic (basal) and hydrophilic (edge) surface area using the
following relation:
The area of basal (hydrophobic) surfaceAreal aspect ratio The area of edge (hydrophilic) surface
= (5.1)
In this method, the heat of adsorption (-∆Hads) of n-butanol on a talc sample is
measured from a 2 g/l butanol-in-heptane solution. According to Malandrini, et al. [39],
the n-butanol molecules adsorb on the edge surfaces of the talc particles with the
hydroxyl groups in contact with the surface. By dividing the heat effect, given in mJ/m2,

180
with the heat of adsorption of butanol on silica (197 mJ/m2), one obtains the percentage
of area of the hydrophilic edge surface.
In another method, the heats of adsorption measurements are conducted in a
10 g/l butanol-in-water solution. The heat effect, which is due to the inverse orientation
of n-butanol in the basal surface, is divided by the heat of adsorption of butanol on
Graphon (17.6 mJ/m2) to obtain the area of the hydrophobic basal surface [32].
The summation of the hydrophobic and hydrophilic surface areas, determined in
the manner described above, should give the total surface area of the talc sample under
consideration. If the total surface area determined using this approach is in agreement
with those obtained from the standard method, e.g. BET, one can confidently determine
the ratio (or lamellarity) between the basal and edge surface areas.
The area aspect ratio values obtained from the calorimetric heat of adsorption
measurements were compared with those of dimensional aspect ratio values obtained
using other techniques such as particle size measurement.
5.5- Surface free energy characterization of basal and edge surfaces
In order to determine the surface free energy components at the basal and edge
surfaces of talc, surface free energy characterization studies must be conducted at two
different sizes (at size x1 and x2). Each sample is subjected to surface free energy
characterization studies as described in Chapter 3. The values of TotalSγ , LW
Sγ , Sγ , Sγ
⊕
and ABSγ can be determined for each size (x1 and x2) using Eqs. (3.10) and (3.11).
From the basal to edge surface area ratios of the talc samples as determined
using the procedure described in Section 5.4, the fraction of the basal surface ( 1xbf ) and
that of the edge surface ( 1xef ) at size x1 will be determined. One can then set up the
following equation:

181
1 1 1x x xb eS b S e Sf fγ γ γ= + (5.2)
in which b
Sγ is the total surface free energy ( Sγ ) at the basal surface and eSγ is the same
at the edge surface. Eq. (5.2) suggests that the value of Sγ determined using Eq. (3.11)
is a composite of bSγ and e
Sγ in proportion to 1xbf and 1x
ef . Similarly, one can set up the
following equation at size x2:
2 2 2x x xb eS b S e Sf fγ γ γ= + (5.3)
An explicit assumption in writing Eqs. (5.2) and (5.3) is that bSγ and e
Sγ do not
change with particle size, which is a reasonable assumption. Solving Eqs. (5.2) and
(5.3) simultaneously, one can determine the values of bSγ and e
Sγ .
Likewise, one can set up simultaneous equations for LW ABS, , , and S S Sγ γ γ γ⊕ , and
obtain the respective values at the basal and edge surfaces of talc.
It was one of the objectives of the present work to determine the surface free
energies and their components at the basal and edge surfaces of powdered talc
samples. In order to meet this objective, the contact angle values of a talc sample that is
ground to two different sizes were determined using the thin layer wicking technique.
In addition, the hydrophobic-hydrophilic surface area ratios of talc samples were
obtained from flow microcalorimetric measurements. Thus, the surface free energy
parameters at the basal and edge surfaces of talc could be estimated from the
hydrophobic-hydrophilic surface fractions obtained and contact angles measured.
Finally, it is advisable that in selecting sizes x1 and x2, it may be beneficial to
have the two sizes farther apart so that the values 1xbf and 1x
ef are sufficiently different
from those of 2xbf and 2x
ef .
182
5.6- Experimental
5.6.1- Determination of the hydrophilic and hydrophobic sites on talc
A FMC Mark 3V (Microsccal, UK) was used. All the work was carried out in a
thermostatted laboratory at 20 ± 2oC, using 2 g/L solutions of butanol in n-heptane
which was previously dried over 4 Å molecular sieves. Talc samples were dried
overnight at 150oC and removed form the oven, weighed in an analytical balance and
poured slowly into the calorimetric cell. The total mass in the cell varied according to the
particle size of the talc being used, ranging form 30 to 60 mg.
Of further importance is the need to use a consistently pure solvent, with special
attention paid to the water content [40]. Excess adsorbed water or other materials on
the original solid can give rise to an initial heat of mixing with the solute affecting
adversely the accuracy and reproducibility of the results. Ashton and co-workers have
found drying solvents over freshly activated molecular sieves (3Å or 4Å) achieves low
and consistent water levels [21]. All the solvents used were HPLC grade (> 99.5%
purity) from Aldrich Chemical Company.
Initially, pure heptane was percolated though the calorimetric cell until thermal
equilibrium was reached, i.e., the system returned to a stable base line. Saturation of
dry talc with heptane occurred rapidly, usually thermal equilibrium being achieved in
about 5 minutes and a steady base line established on the computer screen. At this
point the flow of n-heptane was stopped and the flow of the solution commenced.
Adsorption of butanol from n-heptane (2g/L) onto talc surfaces gave rise to heat
evolution registered in a form of a peak. When the adsorption was completed the heat
evolution stopped and thermal equilibrium was established again. Usually, the
adsorption peak did not last longer than 5 minutes.

183
Calibration of the calorimeter was carried out by generating heat in each
adsorbent bed by a fine wire coil through which electric current of fixed magnitude were
passed corresponding to an energy value of 900 mJ.
After the base line was again achieved, the reversibility of butanol adsorption
was tested by switching back the solution to pure heptane. The desorption processes
usually lasted longer than the corresponding adsorption and were accompanied by a
negative heat effect, i.e. and endotherm. For completely reversible adsorption
processes where just physical adsorption takes place the heat of adsorption is expected
to be equal to the heat of desorption.
The flow rate of both syringe micropumps was maintained constant (3.3 mL/h)
throughout the adsorption run.
In order to evaluate the reproducibility of the measurements, at least 6
independent runs were carried out for each different talc sample. The recorded
experimental data was analyzed using the Microscal CALDOS software. This program
enables the analysis of the calibration and experimental data and converts them into the
heat of adsorption.
In the present work, a series of tests were also conducted to determine the heat
of butanol adsorption from water (10g/L) onto talc. However, no measurable quantity of
heat was observed. Higher alcohols such as pentanol, hexanol and heptanol and an
anionic surfactant – sodium dodecyl sulfate (SDS) – were also tested at different
concentrations but again no heat effect could be detected.
In the case of SDS, the talc samples were previously thoroughly washed with
hydrochloric acid (HCl) 0.01 M to avoid the problems of surfactant precipitation with
calcium cations as described by Charnay et al. [41]. Then, with the sample inside of the
calorimetric cell, it was rinsed with 1.5% butanol/water solution until thermal
equilibration was reached (about 10 minutes), as recommended by Kiraly [42]. Pure

184
water was then percolated followed by the SDS solution at 10 concentration steps
starting with pure water up to the critical micelle concentration (c.m.c.) at 25oC which is
8 mM [43]. For dilute solution and if small concentration steps are applied (as for the
present experiments), the enthalpy of mixing of SDS can be safely neglected [44].
Due to this limitation in the experimental part, i.e. the absence of a thermal effect,
the hydrophobic surface area was calculated by subtracting the hydrophilic surface area
from the total surface area. The area ratios of talc samples were determined using
Eq. (5.1).
5.6.2- Determination of Surface Free Energy Components at the Basal and Edge Surfaces of Talc
The estimation of the surface free energies of basal and edge surfaces requires
the knowledge of the fraction of the basal surface (fb) and that of the edge surface (fe) at
two different size fractions, along with the surface free energy components of the two
size fractions.
In the present work, a talc ore from the Cabeceiras Mine, City of Brumado, Brazil,
was used for surface free energy characterization of basal and edge surfaces. The
fractions of basal surface (fb) and edge surface (fe) of each talc sample were determined
using the Groszek and Partyka method [32].
The surface free energy parameters of these two talc samples were estimated
using Eq. (2.8). In using Eq. (2.8), the contact angle values of various liquids on talc
samples were obtained from the thin layer wicking measurements. In these
measurements, diiodomethane, water and formamide were utilized as the test liquids.
The contact angles measured with diiodomethane, water and formamide were used to
calculate the values of the surface free energy parameters ( LWSγ , Sγ
and Sγ⊕ ) of the talc
samples. The details of measuring contact angles using the thin layer wicking technique
are given in Chapter 3. It was considered that the contact angle results obtained from

185
the thin layer wicking technique are more reliable than those determined using other
techniques. Therefore, these results were chosen for the estimation of the surface free
energy components at the basal and edge surfaces of talc.
5.7- Results and discussion 5.7.1- Determination of the hydrophilic sites on talc
Table 5.1 shows the values of the heats of adsorption (-∆Hads) of butanol on
various talc samples from n-heptane with the standard deviations given in parentheses.
It is also shown at the bottom of the table the reference heat of adsorption of butanol on
a specific silica sample (197 mJ/m2), as reported by Malandrini et al. [39]. Knowing that
the silica sample investigate by those authors is almost 100% hydrophilic, which is
responsible for the high heat of adsorption, one can normalize the value of -∆Hads for
talc with respect to that for silica. The values obtained in this manner should give the
percentage hydrophilic sites at talc’s surface. Table 5.1 also lists the number of
experiments carried out for each sample, the values of percent hydrophilic surface with
their respective standard deviations, and the total and specific hydrophilic surface area,
given in m2/g, along with the average particle size of each talc powder.
As shown in Table 5.1, the hydrophilic surface percentage of talc samples varies
from 17.4% to 36.5%. The results show that the most hydrophobic talc is sample D
(17.4% hydrophilic surface), while the most hydrophilic talc is sample F (36.5%
hydrophilic). Note also that as the particle size decreases form sample A to sample D
the hydrophobicity increases. As the particle size is further decreased from sample D to
sample H it seems that a maximum hydrophobicity is achieved, irrespective to the
grinding technology, and then the hydrophilicity starts to increase again. These findings
are consistent with the contact angle measurement results as reported in Chapter 3.
It is hypothesized that after this maxima the talc particles start to fracture and
proportionally more edge surface areas are then exposed. In other words, fracture

186
prevails over delamination after a given average particle size which was estimated to be
in the range D50 = 1 – 1.5 µm. In order to check this hypothesis, a sample of nanotalcTM
(2) was obtained from the company Nanova LLC (www.nanomat.com) and tested. It was
determined that nanotalcTM (D50 = 0.15 µm) was much easily dispersed in water when
compared with all other samples which was the first indication that the percentage of
hydrophilic area was probably be high. The microcalorimetric tests showed that indeed
the percentage of hydrophilicity was much higher than the other samples tested in this
investigation, which is again an evidence that there is a limit on the delamination of talc
using the grinding technology tested here. The chemical analyis of the nanotalcTM,
showed in Table 5.2, had no signal of significant contamination with hydrophilic
minerals. The percentage of hydrophilicity and the standard deviation for all samples
are plotted against the particle size in Figure 5.5. The results of nanotalcTM were also
included.
2 NanotalcTM is trade mark of Nanova LLC.

187
Table 5.1. Percentage of hydrophilic surface and specific hydrophilic surface of the talc samples
-∆Had Specific surface area of butanol (m2/g)
on talc
from n-heptane (mJ/m2)
Total Hydrophilic surface
Talc sample number measurements
Hydrophilic surface
(%)
d50 (µm)
A 7 71.84 (7.6) 36.47 (3.8) 28.8 1.14 0.42
B 7 50.54 (5.2) 25.66 (2.6) 7.5 9.28 2.38
C 10 43.38 (4.5) 21.54 (2.6) 4.5 10.88 2.34
D 9 34.38 (4.9) 17.42 (2.5) 1.5 9.29 1.62
E 8 44.21 (6.0) 22.45 (3.0) 1.35 26.32 5.91
F 20 36.75 (10.7) 18.66 (5.4) 1.2 13.31 2.48
G 9 47.97 (5.1) 24.53 (4.0) 0.5 24.64 6.04
H 6 44.53 (3.9) 22.61 (2.0) 0.4 29.35 6.64
NanotalcTM 6 117.72 (14.9) 59.76 (7.6) 0.15 214.17 127.99 Silica
(Rhone Poulenc X015 LS) –– 197(1) 100 –– 22.0 22.00

188
Table 5.2. Chemical analysis of NanotalcTM
% L.O.I. 12.70 SiO2 56.98 TiO2 0.03 Al2O3 0.71 Cr2O3 0.01 Fe2O3 0.96 MnO 0.01 CaO 0.41 MgO 28.20 Crystalline silica none
Note: L.O.I. – Loss on ignition
The chemical characterization shown in Table 5.2 represents only the analysis in
the specific sample studied here and cannot be considered typical from NanotalcTM
products.
0.1 1 100
10
20
30
40
50
60
70
80
90
100
90
80
70
60
50
40
30
20
10
% h
ydro
phili
c ed
ge s
urfa
ce
% h
ydro
phob
ic b
asal
sur
face
D50 (µm)
nanotalc
HG
F
E
D
CB
A
Figure 5.5. Change in the hydrophobicity/hydrophilicity percentage of talc surface as a function of average particle size (determined by sedimentation analysis).
The shape of the data on Figure 5.5 follows the same profile of the aspect ratio
as a function of the average particle size (Figure 4.17). The excellent agreement

189
between two independent tests, particle size measurement and flow microcalorimetry,
that are based on different principles is rather encouraging and they both tend to
indicate that there is indeed a limit in terms of maximum delamination that can be
achieved using the talc samples and the grinding technology employed in this
investigation.
The work of Yildirim [6] with talc using flow microcalorimetry covered, between
other things, a much coarse particle size fraction than the one investigated here.
Yildirim showed that the higher the particle size, the higher the heat of butanol
adsorption, i. e. the higher the hydrophilicity. Figure 5.6 shows the results from Yildirim
research (in red) and the ones from this investigation (in black).
0.0 0.1 0.2 0.3 0.4 0.5 20 40 60 80 100 120 140 160 180 20020
40
60
80
100
120
140
160
180
Nanotalc
HF
D50 (µm)
∆Had
s but
anol
from
hep
tane
(mJ/
m2 )
incr
ease
hyd
roph
ilici
ty
G
Figure 5.6. Change in enthalpies of adsorption of butanol from heptane onto talc surface as a function of particle size. In red: results from reference [6]. In black: Samples F, G, H and NanotalcTM.
As predicted by Yildirim [6], it was expected that the surface hydrophobicity of
talc would further increase by grinding it to smaller particle size. This is confirmed by
sample F which follows the same behavior as determined by that author. Additionally, it

190
seems that after a given particle size the hydrophobicity cannot be further enhanced
and the particles become more and more hydrophilic as is indicated by the enthalpy of
butanol adsorption.
5.7.2- Determination of the hydrophobic sites on talc
Although the butanol-in-heptane method gave reasonable results, the butanol-in-
water technique did not work well since no heat could be detected by the
microcalorimeter. Longer chain alcohols such as pentanol, hexanol and heptanol which
theoretically would have a stronger interaction with the hydrophobic basal planes were
also tested at their maximum solubility concentration in water at 20oC. Again any
detectable heat effect could be determined. As a last trial, an anionic surfactant sodium
dodecyl sulfate – SDS (supplier, purity) was tested at different concentrations
(10 consecutive steps starting from pure water up to c.m.c.) at 25oC and the same
negative result (no heat effect) was attained. As pointed out by Kiraly [44], for dilute
solutions and if small concentration steps are applied (as for the present experiments),
the enthalpy of mixing in this boundary region can safely be neglected.
As also suggested by Kiraly [42], before the percolation of pure water for the
SDS experiments, a butanol-in-water solution (1.5% w/w) was percolated to make it
easier the complete wetting of the talc sample with pure water. It is well established on
literature that SDS does adsorb onto talc surface with inverse orientation, i.e. the with
the polar head groups point towards the aqueous media and the tails interacting,
probably via van der Waals forces, with the hydrophobic basal planes. Numerous
experimental evidences support this inverse orientation model. Ouyang and co-workers
[45] demonstrated that the contact angle of talc decreased from 60o to about 10o and
that the zeta potential became more negative going from -50 mV to about -63 mV after
treatment with SDS at 0.2 mM. More recently, Charnay et al. [41] determined the
adsorption isotherms of SDS onto talc. For some talc samples an amount of about 30
µmol/g (mol SDS/g talc) at the plateau region was reported. They also showed that the
interaction of highly water-soluble benzene sulfonate anion with the hydrophilic talc

191
edge is negligible. Indeed in water the M-OH groups at the edges tend to become
negatively charged due to deprotonation and, consequently, an electrostatic repulsion
is the interaction expected between the negatively charged polar head group of SDS
and talc’s edges.
If SDS does absorb onto talc basal planes why no heat effect could be
determined by FMC? One possible explanation for this observed phenomenon is the
fact the water is more strongly attracted to talc’s basal plane compared to Graphon’s
basal plane. A careful observation of talc’s crystal structure reveals that the hydroxyl
groups of the octahedral sheet are located in the middle of the ditrigonal cavity formed
by the silica tetrahedra and they are pointing towards the external basal planes, as
shown in Figure 1.9 and 5.7 As a result, besides the predominant hydrophobicity arising
from the siloxane bridges (van der Waals forces), there is a small net ionic attraction on
the basal planes [46-48] due to, among other reasons, the influence of these hydroxyl
groups [49] which could explain the stronger interaction of water with talc’s basal
planes.
Recent computer simulations studies done by Skipper and co-workers [50-52]
confirmed that minimum-energy configuration for water onto talc’s surface occurs when
water molecules are situated above talc’s hydroxyl group in the center of the ditrigonal
cavity formed by the silica tetrahedra. The binding energy of water in this site is equal to
21.6 kcal/mol whereas the binding energy is equal to ~ 1.0 kcal/mol (i.e. hydrophobic)
on all the other sites of the basal faces, which explains the macroscopic hydrophobicity
of the mineral [49].
Complementary, the heat of immersion of solids in water is one of useful physical
properties which represents strength of the interaction between water molecules and
solid surfaces [53, 54]. The heat of immersion (∆Himm) of talc in water was determined
by Yildirim [55] to be in the range from -220 to -320 mJ/m2 and by Malandrini et al. [39]
from -(311 – 356) mJ/m2. In both cases the variation was due to the change in aspect
ratio and chemical composition of the talc samples. The ∆Himm for Graphon in water was

192
determined as -32 mJ/m2 [56]. This is a clear evidence that water is more strongly
attracted by talc surface and that compared to Graphon talc is more hydrophilic.
Figure 5.7. Talc’s crystal structure showing the location of the OH groups (yellow spheres) in the center of the ditrigonal cavities. View down c-axis.
As pointed out by Yoon [57] the degree of hydration of solids seems to play a
decisive role in determining the heats of adsorption. Burkin and Halsey [58] showed that
for the adsorption from aqueous solution the adsorbates must displace water molecules
from the hydrated solid surface, which requires energy. One may, then, expect a
relatively small heat of adsorption from systems involving strongly hydrated solids, and
vice-versa. As a good example, the heat of adsorption of lauryl sulphate is -1.36
kcal/mole on hematite [59] and -8.5 kcal/mole on Graphon [60] although the surfactant
adsorbs on the latter solid with inverse orientation through London-van der Waals
forces. This may be attributed to the fact that the heat of immersion of hematite in water
is -532 mJ/m2 [61], while that of Graphon in only -32 mJ/m2 [56].

193
It is then possible that the exothermic enthalpy of adsorption of any of the
adsorbates tested (alcohols and SDS) is being masked by the endothermic enthalpy of
desorption of water or, in other words, the energy gained by forming the talc/SDS
interaction is consumed in displacing the water molecules from the surface. As a result,
only the net heat effect is measured as ads∆H in a calorimetric experiment, explaining
the non-detectable magnitude of ads∆H .
In the light of these considerations, one cannot assume that even butanol was
not adsorbed onto the surface. In order to draw this conclusion, a downstream detector,
e.g. HPLC, refractometer, with the exit port of FMC for the simultaneous determination
of the integral enthalpy of displacement and adsorption excess isotherms in future
works. Having those pieces of information would allow the determination of the mass
balance related to adsorption process and the differential enthalpy of displacement
which is important in gaining a fundamental understanding of many aspects of the
adsorption mechanisms (distribution of energy on surface sites [25].
As stated by Groszek [62], full thermodynamic analysis of the heat effect
measured in the flow microcalorimeter requires also the knowledge of the amount of
adsorption taking place during the heat evolution.
Additionally, the mechanisms of surfactant adsorption onto the substrate surface
could also play in important role and help to explain the absence of heat during alcohols
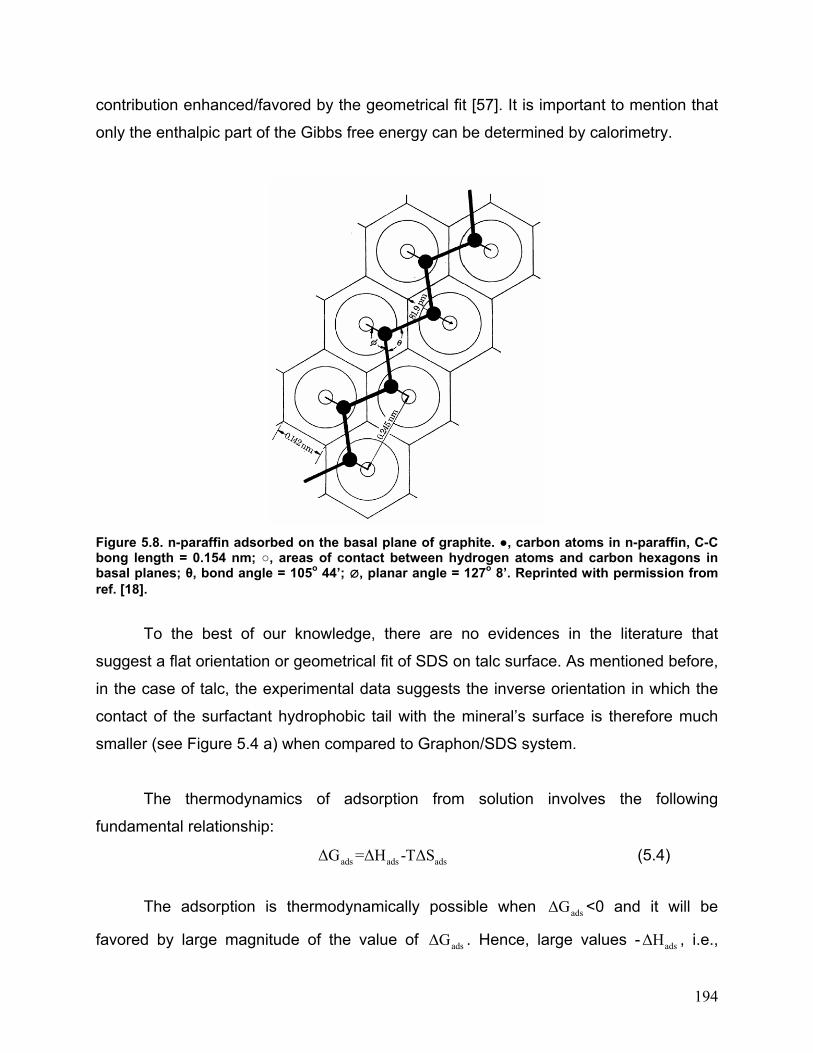
and SDS adsorption. According to Groszek [18], n-paraffin adsorbs on Graphon basal
surface in a flat orientation due to the geometrical fit between the carbons of
hydrocarbon chain and the centers of carbon hexagons of graphite’s basal plane
(Figure 5.8). It is reasonable to assume that the hydrophobic tail of SDS adsorbs also
with the flat orientation. Indeed, many researches have recently shown several atomic
force microscopy micrographs [43, 63, 64] that confirm the presence of a flat layer at
graphite surface at low surfactant concentrations. Thus, the Gibbs free energy of
adsorption of SDS onto Graphon/graphite surface (∆Gads) may have a marginal entropic
contribution due to water displacement from the surface and a significant enthalpic
194
contribution enhanced/favored by the geometrical fit [57]. It is important to mention that
only the enthalpic part of the Gibbs free energy can be determined by calorimetry.
Figure 5.8. n-paraffin adsorbed on the basal plane of graphite. ●, carbon atoms in n-paraffin, C-C bong length = 0.154 nm; ○, areas of contact between hydrogen atoms and carbon hexagons in basal planes; θ, bond angle = 105o 44’; ¯, planar angle = 127o 8’. Reprinted with permission from ref. [18].
To the best of our knowledge, there are no evidences in the literature that
suggest a flat orientation or geometrical fit of SDS on talc surface. As mentioned before,
in the case of talc, the experimental data suggests the inverse orientation in which the
contact of the surfactant hydrophobic tail with the mineral’s surface is therefore much
smaller (see Figure 5.4 a) when compared to Graphon/SDS system.
The thermodynamics of adsorption from solution involves the following
fundamental relationship:
ads ads ads∆G =∆H -T∆S (5.4)
The adsorption is thermodynamically possible when ads∆G <0 and it will be
favored by large magnitude of the value of ads∆G . Hence, large values - ads∆H , i.e.,

195
highly exothermic reactions, and large positive values of adsT∆S will favor the interaction
at the interface. However, the adsorption of SDS onto talc’s surface gave a non-
detectable amount of ads∆H for the reasons outlined above. It appears, then, that adsT∆S
is positive and the entropy increase becomes a significant driving force for the
adsorption process.
As pointed out by Yoon [57], the positive ads∆S can be attributed to the steric
displacement of water molecules from the solid surface. The entropy of water molecules
close to the solid surface must have a low degree of freedom, and as they are displaced
from the surface into the solution the entropy will increase. The surfactant molecules, on
the other hand, loose its degree of freedom upon adsorption, and the entropy will
decrease. It is plausible, however, that the total entropy gained by the sterically
displaced water molecules is greater than the entropy lost by the surfactant species,
since a large number of water molecules has to be displaced from the surface for each
single surfactant adsorbed. Hence, the entropy of the system as a whole will increase,
contributing significantly to a negative value for ads∆G . In addition, the inverse
orientation favors the entropic contribution to the total free energy of adsorption since it
is believed that many more molecules of water are desorbed form the solid surface
when compared to the flat orientation. Similar findings for others surfactant/mineral
systems have been thoroughly discussed by Yoon [57].
One might also argue that the lateral interaction between the hydrocarbon tails
(∆GCH2)3 in the inverse orientation should be accompanied of some evolution of heat.
However, either this heat is very small and/or again the endothermic displacement of
water is masking the total enthalpic contribution of adsorption.
Had one succeeded with the experiments using SDS, a new reference value for
the total specific energy (mJ/m2) at the monolayer coverage had to be adopted since
the interaction between SDS and Graphon has to be stronger than the interaction 3 ∆GCH2 represents the interaction due to association of hydrocarbon chains of adsorbed surfactant molecules at the interface (sometimes called hydrophobic bonding) [56].
196
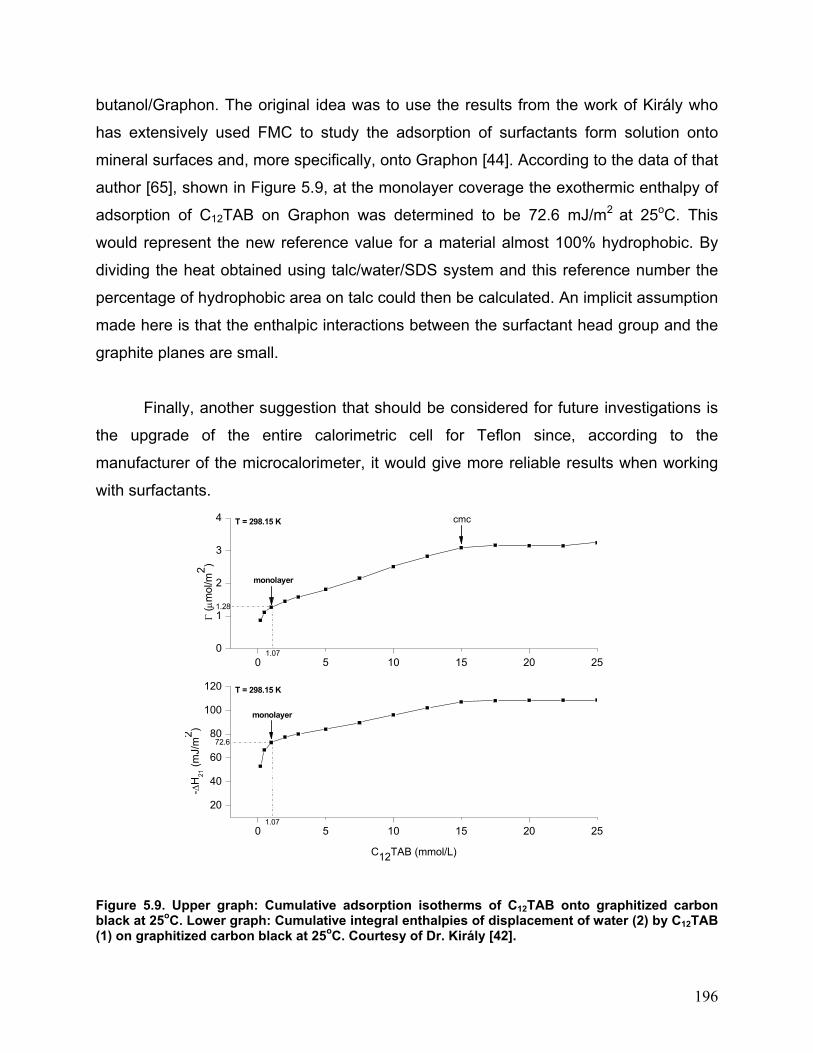
butanol/Graphon. The original idea was to use the results from the work of Király who
has extensively used FMC to study the adsorption of surfactants form solution onto
mineral surfaces and, more specifically, onto Graphon [44]. According to the data of that
author [65], shown in Figure 5.9, at the monolayer coverage the exothermic enthalpy of
adsorption of C12TAB on Graphon was determined to be 72.6 mJ/m2 at 25oC. This
would represent the new reference value for a material almost 100% hydrophobic. By
dividing the heat obtained using talc/water/SDS system and this reference number the
percentage of hydrophobic area on talc could then be calculated. An implicit assumption
made here is that the enthalpic interactions between the surfactant head group and the
graphite planes are small.
Finally, another suggestion that should be considered for future investigations is
the upgrade of the entire calorimetric cell for Teflon since, according to the
manufacturer of the microcalorimeter, it would give more reliable results when working
with surfactants.
0 5 10 15 20 25
20
40
60
80
100
120
1.07
72.6
1.28
-∆H
21 (m
J/m
2 )
C12TAB (mmol/L)
1.070 5 10 15 20 25
0
1
2
3
4
T = 298.15 K
T = 298.15 K
Γ (µ
mol
/m2 )
cmc
monolayer
monolayer
Figure 5.9. Upper graph: Cumulative adsorption isotherms of C12TAB onto graphitized carbon black at 25oC. Lower graph: Cumulative integral enthalpies of displacement of water (2) by C12TAB (1) on graphitized carbon black at 25oC. Courtesy of Dr. Király [42].

197
5.7.3- Surface area ratios of talc samples
Table 5.3 shows the values of basal to edge surface area ratios obtained for
various powdered talc samples using the flow microcalorimeter. The values of the
average size, d50, and the total, hydrophobic and hydrophilic surface area for each talc
sample are also listed in this table. The values of area ratios for each talc sample were
calculated using Eq. (5.1) and they derived directly from the measurements of the
percentage of hydrophilic and hydrophobic areas.
As can be seen in Table 5.3, sample D had the highest basal-to-edge surface
area ratio among the talc samples studied, and sample A had the lowest. The
microcalorimetric measurement results given in this chapter and the contact angle
results presented in Chapter 3 showed that sample D is the most hydrophobic surface;
hence, the ratio between basal and edge surfaces should be the highest.
The results presented in Table 5.3 show that there is a correlation between the
average particle size and the values of area ratios. For example, the sample A, which
has the highest value of d50 (28.8 µm), has the lowest value of area ratio, 1.74. This
result is in accordance with the electron micrograph shown in Figure 4.15.
It can also be seen from Table 5.3 and Figure 5.10 that the values of area ratios
increase with decreasing particle size from sample A to D which is associated with an
increase in the basal surface area. These results indicate that the basal (hydrophobic)
to edge (hydrophilic) surface area ratio increases with decreasing particle size up to a
certain limit or maxima after which the ratio hydrophobicity/hydrophilicity decreases, i.e.,
the fracture mechanisms prevail over the delamination for very fine particles
(D50 < 1.5 µm, based on sedimentation).

198
28.8 7.5 4.5 1.5 1.35 1.2 0.5 0.40.0
0.5
1.0
1.5
2.0
2.5
3.0
3.5
4.0
4.5
A B C D E F G H
D50(µm)
Experimental data Polynomial fit
Figure 5.10. Basal-to-edge area ratio with the average particle size D50 (based on sedimentation).
One of the most important advantages of using microcalorimetry technique for
determining the area ratios of solid surfaces is that it is fast, simple and reliable. It gives
the area ratio values of bulk particles, rather than a single particle or few particles. The
evaluation of results is objective, unlike the TEM or SEM measurements as thoroughly
discussed in Chapter 4.

199
Table 5.3. Basal-to-edge ratio values of various talc samples determined using flow microcalorimetry
Specific surface area
(m2/g) d50
Hydrophilic Hydrophobic (µm) Talc Sample
Total surface surface
Basal-to-edge area ratio(1)
A 1.14 0.42 0.72 28.8 1.74
B 9.28 2.38 6.90 7.5 2.90
C 10.88 2.34 8.54 4.5 3.64
D 9.29 1.62 7.67 1.5 4.74
E 26.32 5.91 20.41 1.35 3.45
F 13.31 2.48 10.83 1.2 4.36
G 24.64 6.04 18.60 0.5 3.08
H 29.35 6.64 22.71 0.4 3.42

200
5.7.4- Surface free energies of talc at basal and edge surfaces
The results presented in the previous sections suggest that the surface
hydrophobicity and area ratios of talc particles increase with decreasing particle size up
to a certain limit after which it becomes more and more hydrophilic. However, a more
complete characterization of talc surface properties demands the knowledge of the
individual surface free energy components and parameters at the basal and edge
surfaces.
The principal idea of this work is summarized in Table 5.7. However, in order to
estimate the surface free energies of basal and edge surfaces, it was necessary to
know the fraction of the basal surface (fb) and that of the edge surface (fe) at two
different size fractions and also the surface free energy components of these two size
fractions.
Two talc duets were select for this investigation. Duet I, composed of samples B
(d50=7.46 µm) and H (d50=0.39 µm) are the farthest apart in terms of particle size,
although they were ground in different equipments. Duet II, composed of samples F
(d50=1.15 µm) and H (d50=0.39 µm), represents two samples ground using the same
technology. The fractions of basal and edge surfaces for samples B, F and H were
obtained from microcalorimetric measurements. The results are presented in Table 5.4.
As shown, for duet I the value of fb is higher for the finer sample H (0.774) than the
coarser sample B (0.743). However, for duet II, the inverse was observed. The finer
sample H had a lower fb than sample F, since its average particle size lies bellow the
optimum particle size range for maximum delamination as explained in Section 5.7.3.
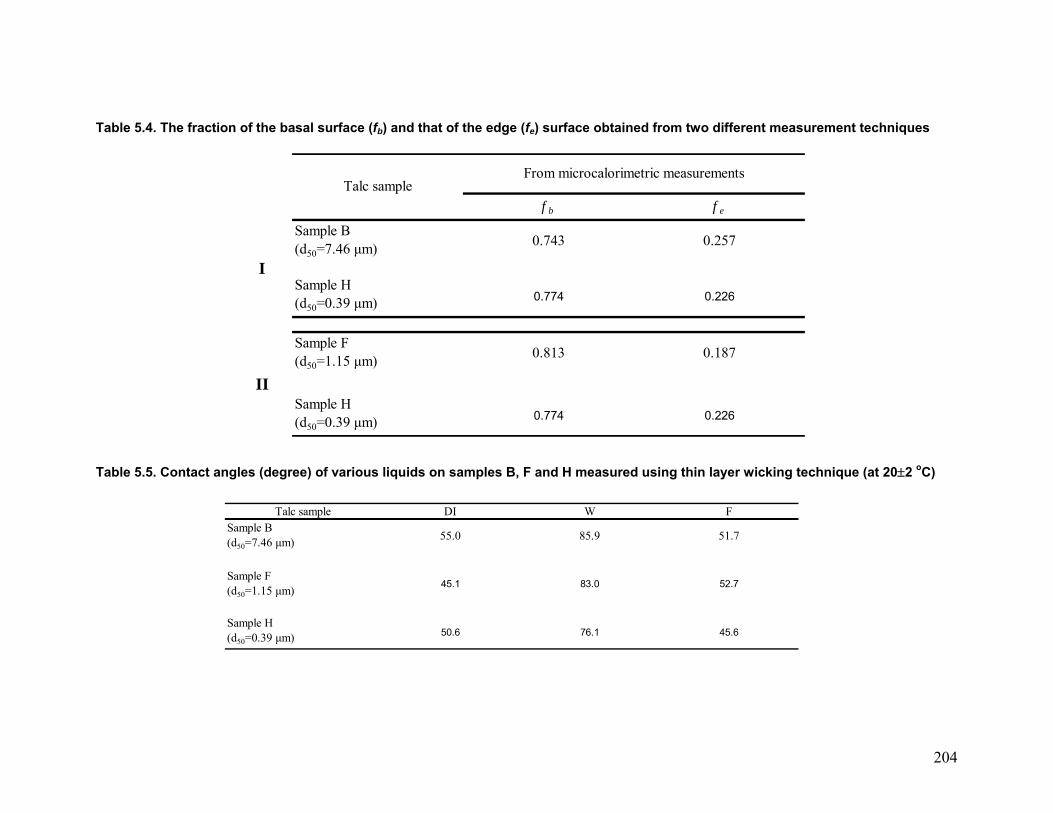
Table 5.5 gives the advancing contact angle values of various liquids on samples
B, F and H obtained from thin layer wicking measurements. It is interesting to note that
the sample with the lowest basal fraction (sample H) had the lowest contact angle with
water, as expected.

201
The values of contact angles given in Table 5.5 for the thin layer wicking
technique were used to calculate the Lifshitz-van der Waals ( LWSγ ) Lewis electron donor
( Sγ ) and electron acceptor ( Sγ
⊕ ) components of the surface free energy on the talc
samples using Eq. (3.9). As discussed in previous chapters, the calculation requires a
set of three contact angles for three different liquids, along with their surface tension
components. The values of LWLγ , Lγ
and Lγ⊕ for liquids were taken from literature (see
Table 3.1). For a given talc surface, the contact angles measured using three test
liquids - bromonaphthalene, water and formamide- were used for calculating the surface
free energy components of talc samples. The results are shown in Table 5.6. Also
shown in this table are the values of ABSγ (= 2 S Sγ γ⊕ ) and Sγ calculated using Eq. (3.11)
from the values of the surface free energy components.
It can be seen from Table 5.6 that the values of both the ABSγ component on the
sample H is higher than those obtained on the samples B and F. Possibly, this could be
related to the higher percentage of edge surfaces where most of the talc’s acidic sites,
i.e. the silanol groups, are located.
Table 5.7 shows the values of surface free energy ( Sγ ) and its components LWSγ ,
Sγ , Sγ
⊕ and ABSγ for the basal and edge surfaces of talc obtained using FMC. Based on
the values of basal fraction (fb) and edge fraction (fe) and the surface free energy
components obtained for combinations 2 by 2 of two sizes, Eqs. (5.2) and (5.3) were
solved simultaneously to calculate the values of relevant surface free energy
parameters at the basal and edge surfaces. The values of fb and fe obtained from flow
microcalorimetry are given in Table 5.4. The values of surface free energy parameters
obtained from contact angle measurements at two size fractions are shown in Table 5.6.
The results given in Table 5.7 show some important information. First of all, the
magnitude of the total surface free energy, TotalSγ , at the basal surface of talc is smaller
than that obtained at the edge surface for both duets. For duet II, for example, the value
202
of TotalSγ at the basal surface obtained from microcalorimetric measurements is
38.5 mJ/m2, whereas it is 45.9 mJ/m2 at the edge surface. This observation is in
agreement with that reported by Yildirim [6].
Second, LWSγ component at the basal surface of talc is much higher than that
obtained at the edge surface for both duets. According to Table 5.7, the LWSγ value,
obtained from microcalorimetric measurements, at the basal surface is 52.7 mJ/m2,
while it is -30.3 mJ/m2 at the edge surface for duet I and 51.0 mJ/m2 and -24.6 mJ/m2
for duet II respectively. It is well established that in a normal alkanes series, the greater
the number of carbons the more hydrophobic is the compound and the greater the value
of LWLγ . Similarly, the more hydrophobic basal plane surface has a larger LW
Lγ compared
to the edge surface.
Third, the value of Sγ is much higher than the value of Sγ
⊕ for the basal surfaces
of talc for duet I. The results indeed did show that the Sγ⊕ component at the basal
surface has a negative value. Again, this observation is in agreement with those from
Yildirim. For duet II the same trend could not be observed and this may be related to the
proximity of the particle sizes between samples F and H which is undesirable for the
determination of the surface free energy components at basal and edge surfaces.
On the contrary, the Sγ⊕ component is higher than the Sγ
component at the edge
surface of talc for duet I. Interestingly, the Sγ component exhibited a negative value in
the case of the edge surface. The negative values reported here explain that some
more corrections are still needed to determine the values of fb and fe. The negative
values given in Table 5.7, however, can be assumed to be zero. Nevertheless, these
results suggest that both the basal surface and edge surface of talc are monofunctional,
i.e., the basal surface is basic and the edge surface is acidic. The contradictory result
for duet II with respect of the significant basic character of the edges might again be
related to the proximity of the particle sizes of samples F and H.

203
Finally, from the results presented in Table 5.7, it becomes clear now why the
basal surfaces of talc are basic and the edge surfaces are acidic. Recall that the basal
planes of talc are made up of fully compensated oxygen atoms, linked together by
siloxane (Si-0-Si) bonds, and the edges are composed of Mg–OH, Si–OH and the other
substituted cations, e.g. Al3+, Fe2+. Hence, the basic nature of the basal plane surface of
talc reported here should be attributed to the weak basic character of the oxygen atoms
oriented at the basal planes, while the acidic character of the edge surfaces should be
attributed to the surface silanol groups (Si–OH) and other substituted cations which tend
to accept electrons during acid-base interactions.
204
Table 5.4. The fraction of the basal surface (fb) and that of the edge (fe) surface obtained from two different measurement techniques
f b f e
Sample B (d50=7.46 µm) 0.743 0.257
ISample H (d50=0.39 µm) 0.774 0.226
Sample F (d50=1.15 µm) 0.813 0.187
IISample H (d50=0.39 µm) 0.774 0.226
From microcalorimetric measurementsTalc sample
Table 5.5. Contact angles (degree) of various liquids on samples B, F and H measured using thin layer wicking technique (at 20±2 oC)
Talc sample DI W FSample B (d50=7.46 µm) 55.0 85.9 51.7
Sample F (d50=1.15 µm) 45.1 83.0 52.7
Sample H (d50=0.39 µm) 50.6 76.1 45.6

205
Table 5.6. Surface Free energy components and parameters (mJ/m2) for samples B, F and H talc powders obtained from thin layer wicking measurements
Sample B (d50=7.46 µm)
Sample F (d50=1.15 µm)
Sample H (d50=0.39 µm)
(based on diiodomethane) 31.4 36.9 34.0
0.7 2.1 3.9
2.9 1.0 2.5
2.9 3.0 6.2
34.3 39.9 40.2
Sγ⊕
LWSγ
Sγ
ABSγ
TotalSγ
Table 5.7. Surface free energy components and parameters (mJ/m2) at the basal and edge surfaces of talc obtained using flow microcalorimetry
Basal surface Edge surface Basal surface Edge surface (based on diiodomethane) 52.7 -30.3 51.0 -24.6
27.7 -77.5 -6.4 39.4
-0.5 12.8 -5.8 30.8
31.2 -79.2 -12.5 70.5
83.9 -109.4 38.5 45.9
Duet I (sample B/sample H) Duet II (sample F/sample H)
Sγ⊕
LWSγ
Sγ
ABSγ
TotalSγ

206
5.8- Conclusions
The results showed that there is a relationship between particle size and the
basal-to-edge surface area ratios, and as the particle size decreases the area ratio
increases up to a certain limit. This can be attributed due to the fact that more apolar
basal plane surfaces are created and hence, the ratio between the basal to edge area
increases when the particles become finer. However, after achieving a limit average
ratio the basal-to-edge ratio decreases due to the creation of more edge surfaces. In
other words, after a certain particle size the fracture of the particles prevails over
delamination. It is important to emphasize that these results are in excellent accordance
with those obtained using particle size analysis, as discussed in Chapter 4.
Heats of adsorption measurements were conducted to determine the values of
basal-to-edge surface ratios of talc particles and the surface free energy components at
the basal and edge surfaces of the talc mineral. The surface free energy components
( LWSγ , Sγ
, Sγ⊕ and AB
Sγ ) at the basal and edge surfaces of talc were obtained using the
van Oss, Chaudhury and Good (OCG) thermodynamic approach.
The results showed also that the basal surfaces of talc contains only the basic
component of surface free energy ( Sγ ), suggesting the mono-functionality of basal
surfaces of talc, e.g. basic. Interestingly, the edge surfaces contains only acidic
component ( Sγ⊕ ), which also suggest the mono-functionality of edge surfaces, e.g.
acidic. The results also showed that the surface free energy ( TotalSγ ) at the basal surface
is substantially smaller compared to that obtained at the edge surface. These findings
reflect very well the surface chemistry behavior expected from the analysis of the crystal
structure of talc (Chapter 1).
When characterizing individually the surface free energy at basal planes and
edge surfaces, it would be advisable for future work to use the same equipment for

207
grinding of the talc sample at different particle sizes and to keep them apart from each
other as much as possible.
208
5.9 – References
1. Katz, H. and J.V. Milewski, Handbook of Fillers for Plastics. 1987, New York: Van Nostrand Reinhold. 216-231.
2. Canova, L.A., Effect of surface treatments in mica-filled polypropylene. Plastics Compounding, 1990(July/August): p. 38-43.
3. Rothon, R.N., Fillers and surface treatment. Plastics Additives and Compounding, 2002. May: p. 12-14.
4. Fekete, E. and B. Pukanszky, Surface coverage and its determination: role of acid-base interactions in the surface treatment of mineral fillers. Journal of Colloid and Interface Science, 1997. 194: p. 269-275.
5. LeBaron, P.C., et al., Polymer-layered silicate nanocomposites: an overview. Applied Clay Science, 1999. 15: p. 11-29.
6. Yildirim, I., Surface Free Energy Characterization of Powders. 2001, Virginia Tech.
7. Malhammar, G., Determination of some surface properties of talc. Colloids and Surfaces, 1990. 44: p. 61-69.
8. Fowkes, F.M., Role of acid-base interfacial bonding in adhesion. Journal of Adhesion Science and Technology, 1987. 1(1): p. 7-27.
9. Joslin, S.T. and F.M. Fowkes, Surface acidity of ferric oxides studied by flow microcalorimetry. Industrial and Engineering Chemistry - Product Research and Development, 1985. 24(3): p. 369-375.
10. Lloyd, T.B., et al., Surface studies of hydrous oxide coated rutile in nonaqueous media. Journal of Coatings Technology, 1992. 64(813): p. 91-99.
11. van Oss, C.J. and R.J. Good, Relation between the apolar and polar components of the interaction energy between the chains of nonionic surfactants and their CMC in water. Journal of Dispersion Science and Technology, 1991. 12(1): p. 95-105.
12. van Oss, C.J. and P.M. Constanzo, Adhesion of anionic surfactants to polymer surfaces and low-energy materials. Journal of Adhesion Science and Technology, 1992. 6(4): p. 477-487.

209
13. Fubini, B., Adsorption calorimetry in surface chemistry. Thermochimica Acta, 1988. 135: p. 19-29.
14. Groszek, A.J., A calorimeter for determination of heats of wetting. Nature, 1958. 182: p. 1152-1153.
15. Groszek, A.J., Determination of surface areas of powders by flow microcalorimetry. Chemistry and Industry, 1996: p. 1754-1756.
16. Allen, T. and R.M. Patel, Determination of specific surface using the flow microcalorimeter. Powder Technology, 1968. 2(2): p. 111-120.
17. Templer, C.E., The study of surface properties with the flow microcalorimeter. Particle Size Analysis, 1970: p. 301-310.
18. Groszek, A.J., Selective adsorption at graphite/hydrocarbon interfaces. Proceedings of Royal Society of London A, 1970. 314: p. 473-498.
19. Groszek, A.J., Flow adsorption microcalorimetry. Thermochimica Acta, 1998. 312: p. 133-143.
20. Groszek, A.J., Advances in characterization of adsorbents by flow microcalorimetry, in Studies in Surface Sciences and Catalysis, A. Dabrowski, Editor. 1998, Elsevier Science: New York.
21. Ashton, D.P., et al., Analytical techniques for characterizing filler surfaces, in Particulate-Filled Polymer Composites, R.N. Rothon, Editor. 2003, Rapra Technology: Shropshire. p. 101-148.
22. Steinberg, G., What you can do with surface calorimetry. Chemtech, 1981: p. 730-737.
23. Operating instructions for the flow microcalorimeter Mark 3V, Microscal.
24. Allen, T. and R.M. Patel, Adsorption of alcohols on finely divided powders. Journal of Applied Chemisty, 1970. 20: p. 165-171.
25. Groszek, A.J. and M.J. Templer, Innovative flow-adsorption microcalorimetry. Chemtech, 1999: p. 19-26.
26. Noll, L.A., Adsorption calorimetry of surfactant interaction with minerals. Colloids and Surfaces, 1987. 26: p. 43-54.

210
27. Malandrini, H., et al., Characterization of quartz particle surfaces by immersion calorimetry. Langmuir, 1997. 13: p. 1337-1341.
28. Zettlemoyer, A.C., Immersional wetting of solid surfaces. Industrial and Engineering Chemistry, 1965. 57(2): p. 26-36.
29. Melkus, T.G., et al., An experimental study of heat of immersion of coal. Colloids and Surfaces, 1987. 28: p. 109-121.
30. Gonzalez-Martin, M.L., et al., Determination of carbon black surface free energy components from the heat of immersion mearurements. Langmuir, 1997. 13: p. 5991-5994.
31. Fuerstenau, D.W., et al., On the native floatability and surface properties of naturally hydrophobic solids. AIChe Symposium Series, 1975. 71(150): p. 183-188.
32. Groszek, A.J. and S. Partyka, Measurements of hydrophobic and hydrophilic surface sites by flow microcalorimetry. Langmuir, 1993. 9: p. 2721-2725.
33. Groszek, A.J. and S. Partyka, Measurements of hydrophobic and hydrophilic surface sites by flow microcalorimetry. [Erratum to document cited in CA119189257]. Langmuir, 1994. 10: p. 1634.
34. Bolis, V., et al., Hydrophilic and hydrophobic sites on dehydrated crystalline and amorphous silicas. Journal of Chemical Society, Faraday Transactions I, 1991. 87(3): p. 497-505.
35. Nakamoto, H. and H. Takahashi, Hydrophobic natures of zeolite ZSM-5. Zeolites, 1982. 2: p. 67-68.
36. Kiraly, Z. and I. Dekany, Thermodynamics of multilayer adsorption of aqueous butanol solution onto printex and graphitised printex carbon blacks. Journal of Chemical Society, Faraday Transactions I, 1989. 85(10): p. 3373-3383.
37. Bassett, D.R., et al., Adsorption of isopropyl alcohol on graphon. Journal of Physical Chemistry, 1967. 71(9): p. 2787-2790.
38. Groszek, A.J., Graphitic and polar surface sites in carbonaceous solids. Carbon, 1987. 25(6): p. 717-722.
39. Malandrini, H., et al., Interactions between Talc Particles and Water and Organic Solvents. Journal of Colloid and Interface Science, 1997. 194(1): p. 183-193.

211
40. Heal, G.R. and I.J. McEwen, The effect of water on the characteristics of the flow microcalorimeter. Powder Technology, 1981. 30: p. 243-254.
41. Charnay, C., et al., Assessment of the Surface Heterogeneity of Talc Materials. Journal of Colloid and Interface Science, 2001. 233(2): p. 250-258.
42. Kiraly, Z., Personal communication. 2004.
43. Wanless, E.J. and W.A. Ducker, Organization of sodium dodecyl sulfate at the graphite - solution interface. Journal of Physical Chemistry, 1996. 100: p. 3207 - 3214.
44. Kiraly, Z., et al., Adsorption calorimetric study of the organiztion of sodium n-decyl sulfate at the graphite/solution interface. Langmuir, 2001. 17: p. 2420-2425.
45. Ouyang, J., et al. Dispersion and aggregation of fine talc particles in aqueous solution. in 1st UBC-McGill bi-annual International Symposium on Fundamentals of Mineral Processing. 1995. Vancouver.
46. Giese, J., R. F., Interlayer bonding in talc and pyrophyllite. Clays and Clay Minerals, 1974. 23: p. 165-166.
47. Giese, J., R. F., The electrostatic interlayer forces of layer structure minerals. Clays and Clay Minerals, 1978. 26(1): p. 51-57.
48. Alcover, J.F. and J. Giese, R. F., Energie de liaison des fueillets de talc, pyrophyllite, muscovite et phlogopite. Clay Minerals, 1986. 21: p. 159-169.
49. Michot, L.J., et al., The structural microscopic hydrophilicity of talc. Langmuir, 1994. 10: p. 3765-3773.
50. Skipper, N.T., et al., Computer calculation of water-clay interactions using atomic pair potentials. Clay Minerals, 1989. 24: p. 411-425.
51. Bridgeman, C.H., et al., Ab-initio total energy study of uncharged 2:1 clays and their interaction with water. Molecular physics, 1996. 89(3): p. 879-888.
52. Bridgeman, C.H. and N.T. Skipper, A Monte Carlo study of water at an uncharged clay surface. Journal of Physics: Condensed Matter, 1997. 9: p. 4081-4087.
53. Takei, T., et al., Heat of immersion of amorphous and crystalline silicas in water: effect of crystallinity. Thermochimica Acta, 1998. 308(1-2): p. 139-145.

212
54. Takei, T. and M. Chikazawa, Origin of Differences in Heats of Immersion of Silicas in Water. Journal of Colloid and Interface Science, 1998. 208(2): p. 570-574.
55. Yildirim, I. and R.H. Yoon. Contact angles of powders from heat of immersion. in SME Annual Meeting. 2001. Denver, Colorado.
56. Healey, F.H., et al., The heats of immersional wetting of rutile and graphon in organic liquids. Journal of Physical Chemistry, 1954. 58(10): p. 887-890.
57. Yoon, R.-H., The Role of Crystal Structure in the Surface Chemistry of Flotation, in Department of MIning and Metllurgical Engineering. 1977, McGill University: Montreal. p. 290.
58. Burkin, A.R. and G. Halsey, Chemisorption at solid-liquid interface. Nature, 1961. 191: p. 348-349.
59. Shergold, H.L. and J.A. Kitchener, A surface-chemical study of adsorption of flotation collectors ona Swedish hematite. International Journal of Mineral Processing, 1975. 2: p. 249-265.
60. Skewis, J.D. and A.C. Zettlemoyer. Heats of adsorption of surfactant ions to the Graphon/solution interface. in 3rd International Congress of Surface Activity. 1960.
61. Chessick, J.J. and A.C. Zettlemoyer, Immersional heats and the nature of solid surfaces. Advances in Catalysis, 1959. 11: p. 263-299.
62. Groszek, A.J. Heats of preferential adsorption of surfactants on mineral surfaces. in Physical Chemistry of Colloids and Interfaces in Oil Production. 1991. Paris.
63. Manne, S. and H.E. Gaub, Molecular Organization of Surfactants at Solid-Liquid Interfaces. Science, 1995. 270(5241): p. 1480-1482.
64. Manne, S., Visualizing self-assembly: force microscopy of ionic surfactant aggregates at solid-liquid interfaces. Progress in Colloid and Polymer Science, 1997. 103: p. 226-233.
65. Kiraly, Z. and G.H. Findenegg, Calorimetric evidence of the formation of half-cylindrical aggregates of a cationic surfactant at the graphite/water interface. Journal of Physical Chemistry B, 1998. 102: p. 1203-1211.