Embed Size (px)
Citation preview
MIAP20S Date: _______________
Chapter 5 – Relations and Functions
Outcome R1 Review 1. The following relation is represented by this graph. Write the following relation as: a) A set of ordered pairs. b) An arrow diagram. 2. Consider the following relation represented by this graph. Write the following relation as: a) In words. b) As a table. c) As a set of ordered pairs.
MIAP20S Date: _______________
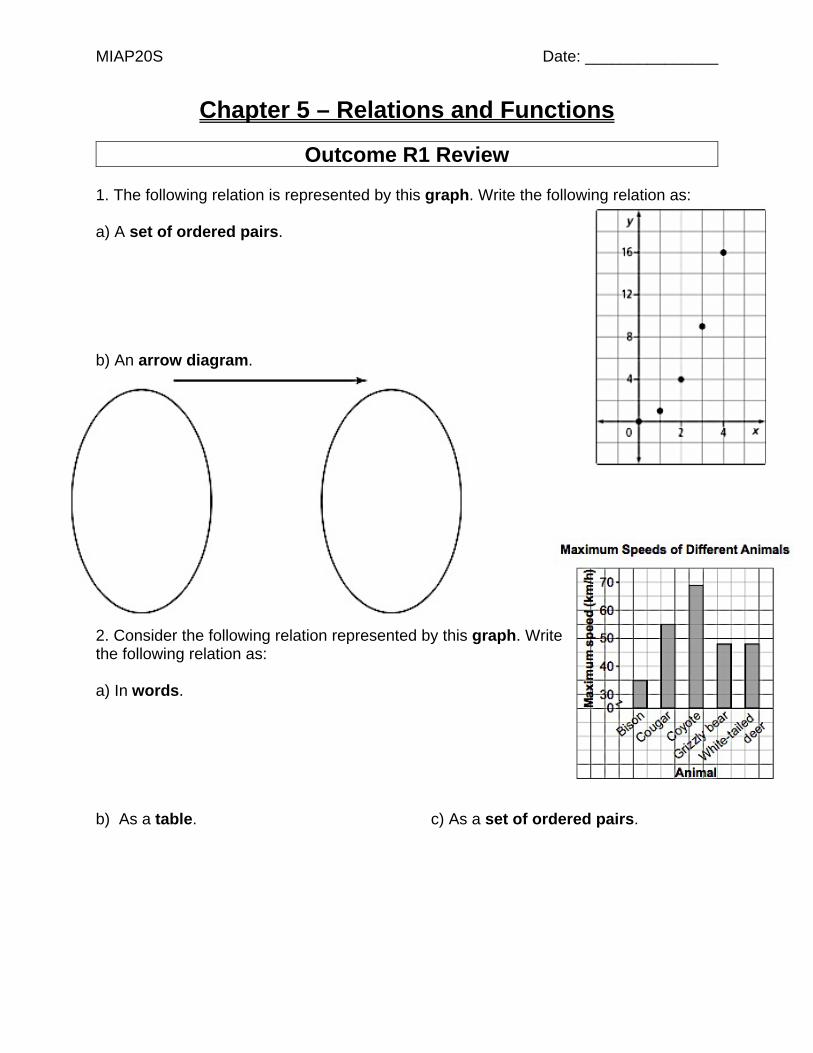
3. Each point on the following graph represnets a package of AA batteries. a) Which package is the most expensive? How much doe is cost? b) Which package has the greatest number of batteries? How many batterie are in this package? c) Which two packages cost the same amount? Which of these packages is the better deal? d) Which two packages have the same number of batteries? Which of these packages is the better deal? 4. The following relation shows the volume of water in Emiko’s water bottle. Use the following table to de scribe a possible situation for this graph.
MIAP20S Date: _______________
Chapter 5 – Relations and Functions
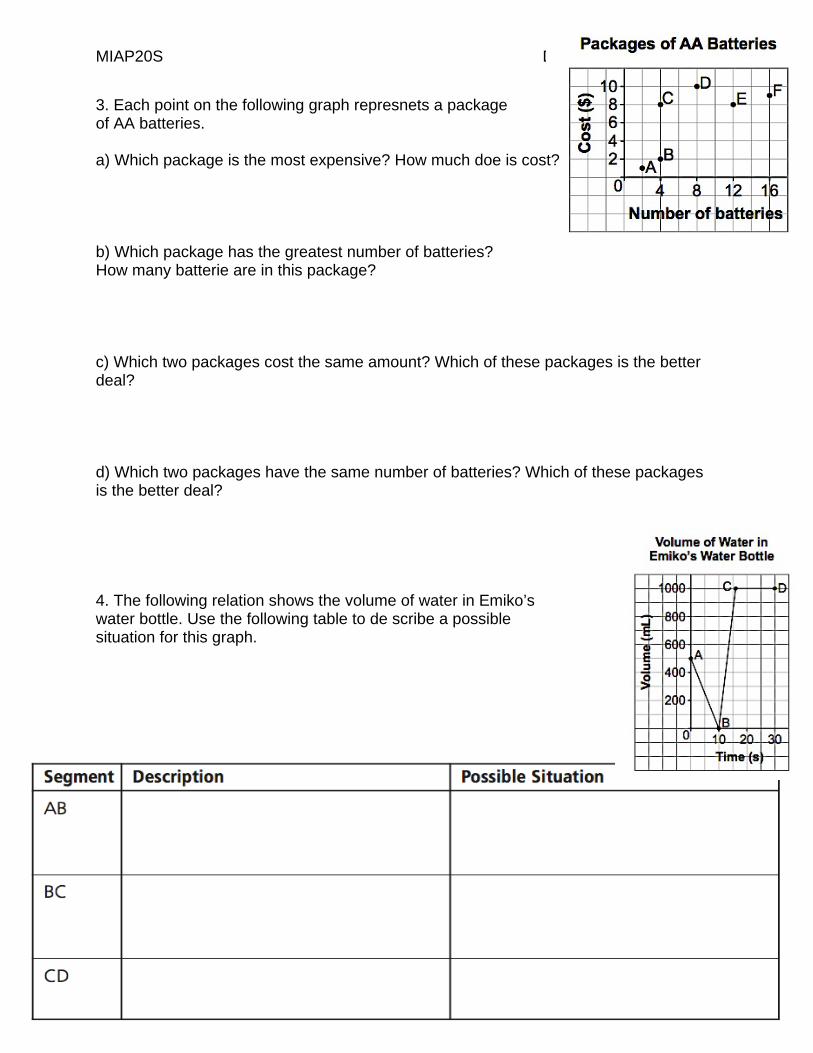
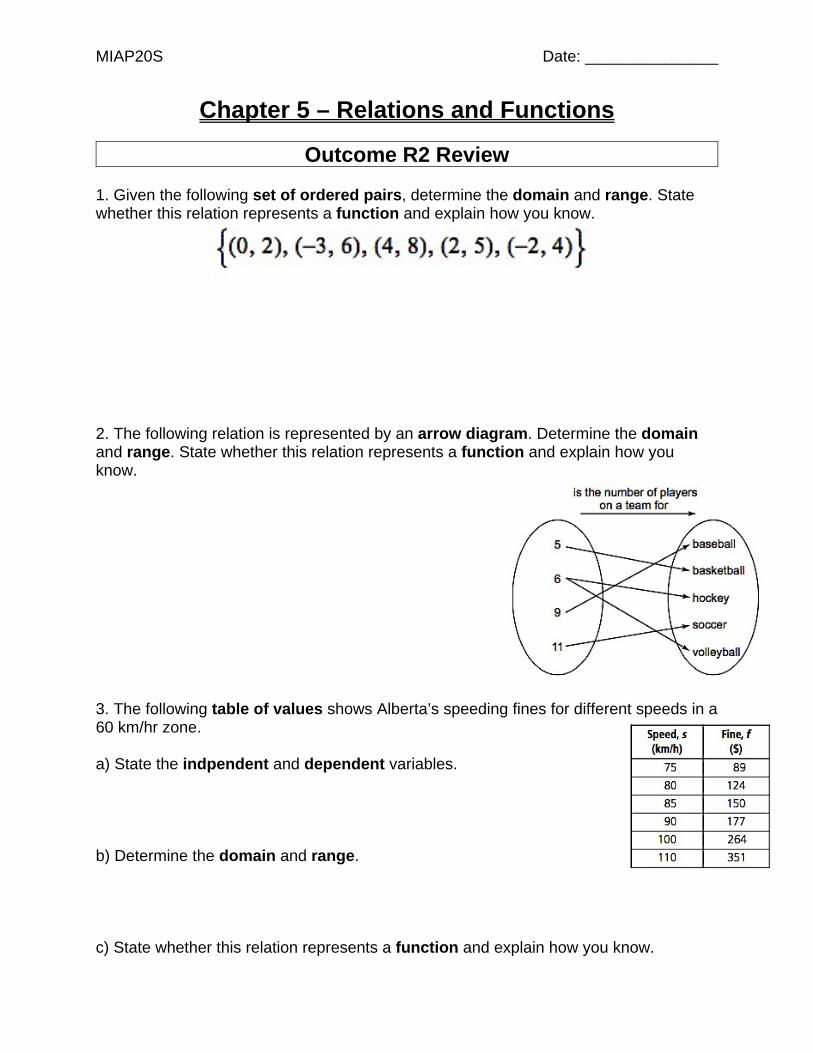
Outcome R2 Review 1. Given the following set of ordered pairs, determine the domain and range. State whether this relation represents a function and explain how you know. 2. The following relation is represented by an arrow diagram. Determine the domain and range. State whether this relation represents a function and explain how you know. 3. The following table of values shows Alberta’s speeding fines for different speeds in a 60 km/hr zone. a) State the indpendent and dependent variables. b) Determine the domain and range. c) State whether this relation represents a function and explain how you know.
MIAP20S Date: _______________
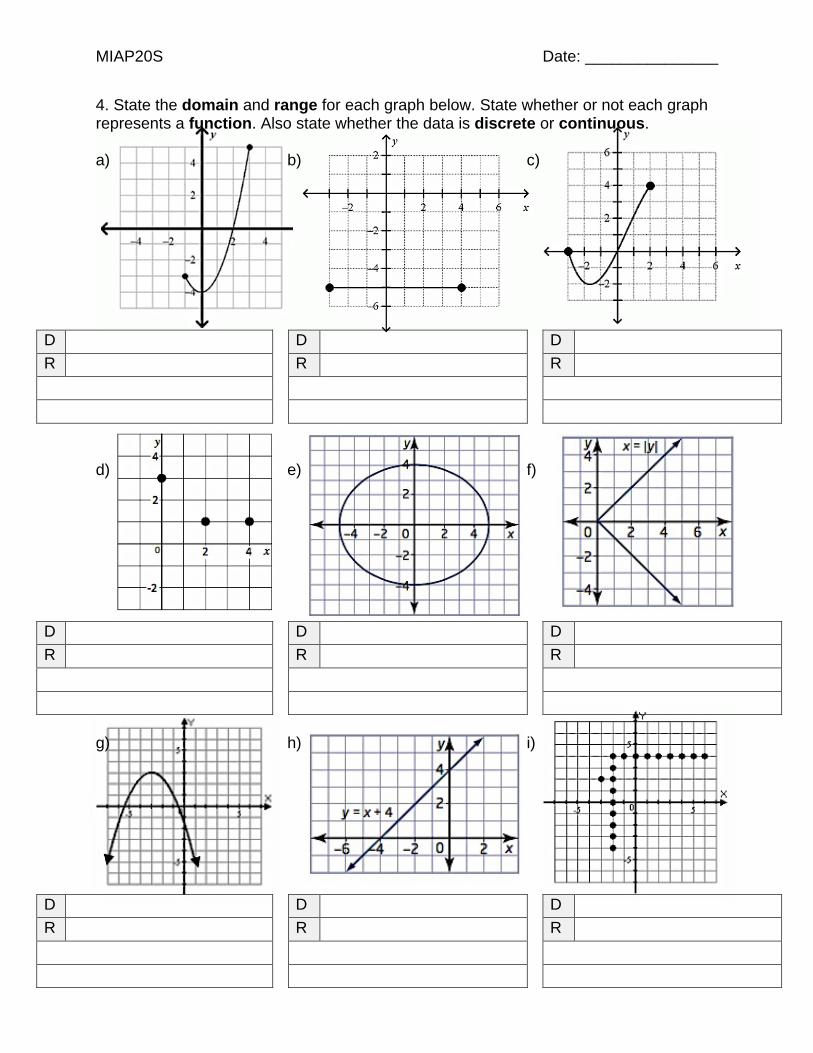
4. State the domain and range for each graph below. State whether or not each graph represents a function. Also state whether the data is discrete or continuous. a) b) c)
d) e) f)
g) h) i)
D D D R R R
D D D R R R
D D D R R R
MIAP20S Date: _______________
Chapter 5 – Relations and Functions
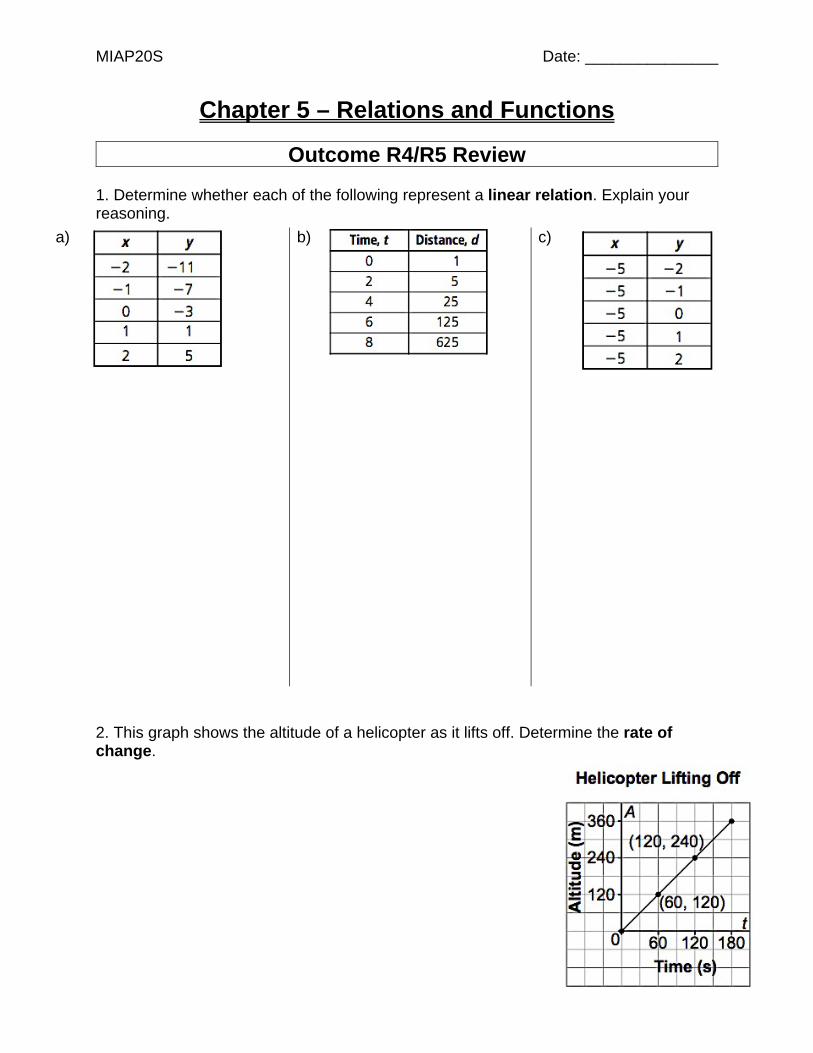
Outcome R4/R5 Review 1. Determine whether each of the following represent a linear relation. Explain your reasoning.
2. This graph shows the altitude of a helicopter as it lifts off. Determine the rate of change.
a) b) c)
MIAP20S Date: _______________
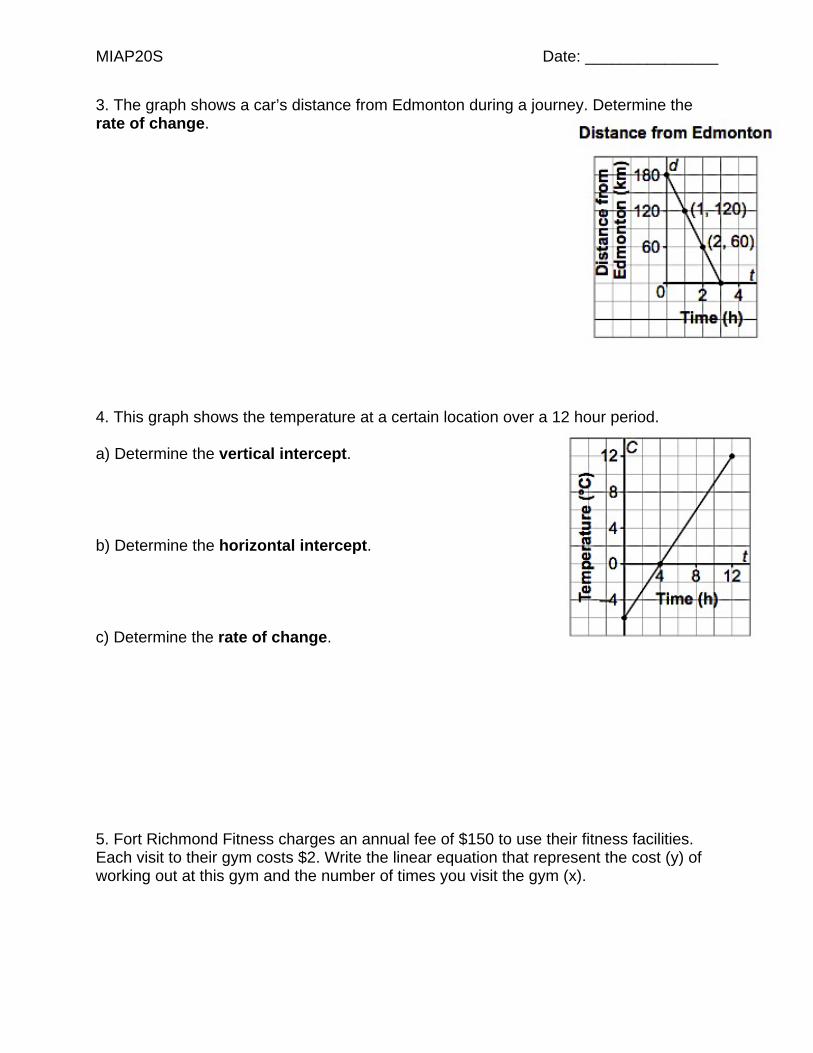
3. The graph shows a car’s distance from Edmonton during a journey. Determine the rate of change. 4. This graph shows the temperature at a certain location over a 12 hour period. a) Determine the vertical intercept. b) Determine the horizontal intercept. c) Determine the rate of change. 5. Fort Richmond Fitness charges an annual fee of $150 to use their fitness facilities. Each visit to their gym costs $2. Write the linear equation that represent the cost (y) of working out at this gym and the number of times you visit the gym (x).
MIAP20S Date: _______________
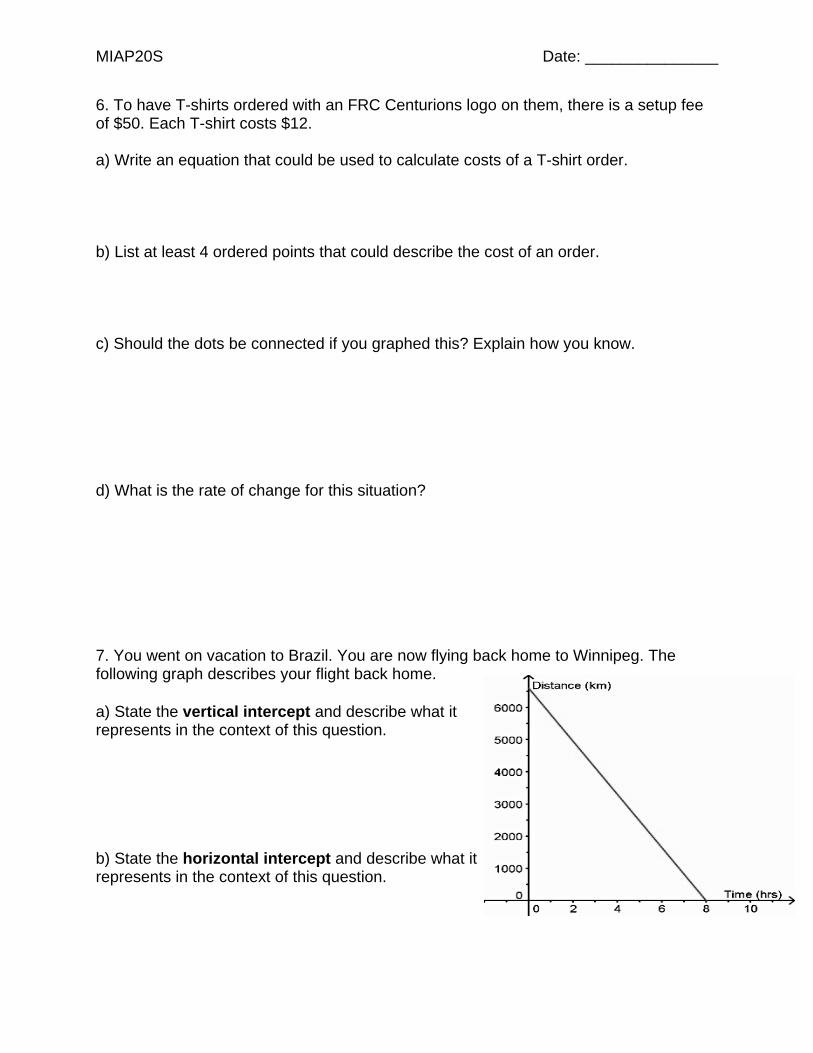
6. To have T-shirts ordered with an FRC Centurions logo on them, there is a setup fee of $50. Each T-shirt costs $12. a) Write an equation that could be used to calculate costs of a T-shirt order. b) List at least 4 ordered points that could describe the cost of an order. c) Should the dots be connected if you graphed this? Explain how you know. d) What is the rate of change for this situation? 7. You went on vacation to Brazil. You are now flying back home to Winnipeg. The following graph describes your flight back home.
a) State the vertical intercept and describe what it represents in the context of this question. b) State the horizontal intercept and describe what it represents in the context of this question.
MIAP20S Date: _______________
Chapter 5 – Relations and Functions
Outcome R8 Review 1. Carmen works for a research company in a shopping mall The equation 𝑃𝑃(𝑛𝑛) = 5𝑛𝑛 + 30 represents her daily pay, P dollars, when she conducts n surveys. a) Determine the value of P(8). Explain what this number represents. b) Determine the value of n when P(n) = 90. Explain what this number represents. 2. Given 𝑓𝑓(𝑥𝑥) = −3𝑥𝑥 + 5, determine each of the following.
a) 𝑓𝑓(0) b) 𝑓𝑓(2) c) 𝑓𝑓(−1) d) 𝑓𝑓 �43�
e) Determine the value of x when 𝑓𝑓(𝑥𝑥) = 17
f) Determine the value of x when 𝑓𝑓(𝑥𝑥) = −10
MIAP20S Date: _______________
3. Kate lifts weights at the local gym. The equation 𝑀𝑀(𝑛𝑛) = 5𝑛𝑛 + 2.5 represents the mass lifted, M kilograms, when the number of 5-kg weights on the bar is n. a) Determine the value of M(6). Explain what this number represents. b) Determine the value of n when M(n) = 42.5. Explain what this number represents. 4. Given 𝑔𝑔(𝑥𝑥) = 4𝑥𝑥 − 7, determine each of the following.
a) 𝑔𝑔 �12� b) 𝑔𝑔(−2) c) 𝑔𝑔(0) d) 𝑔𝑔(1)
e) Determine the value of x when 𝑔𝑔(𝑥𝑥) = 9
f) Determine the value of x when 𝑔𝑔(𝑥𝑥) = 0
MIAP20S Date: _______________
Chapter 5 Review
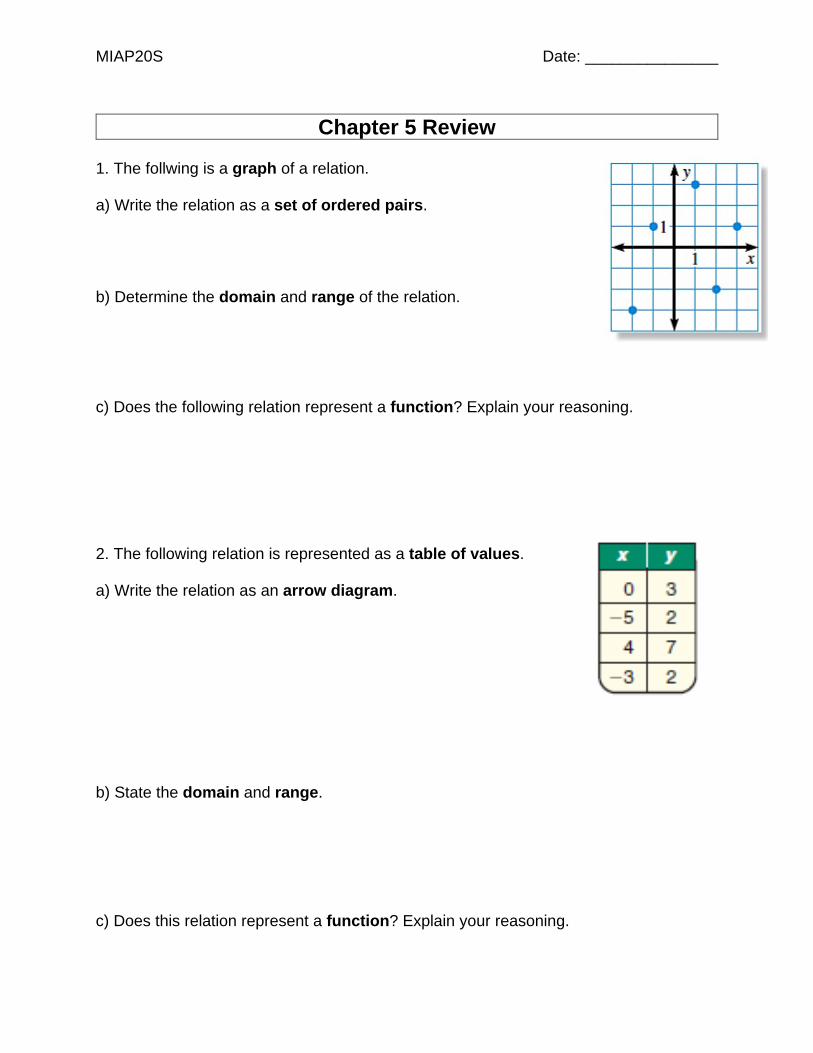
1. The follwing is a graph of a relation. a) Write the relation as a set of ordered pairs. b) Determine the domain and range of the relation. c) Does the following relation represent a function? Explain your reasoning. 2. The following relation is represented as a table of values. a) Write the relation as an arrow diagram. b) State the domain and range. c) Does this relation represent a function? Explain your reasoning.
MIAP20S Date: _______________
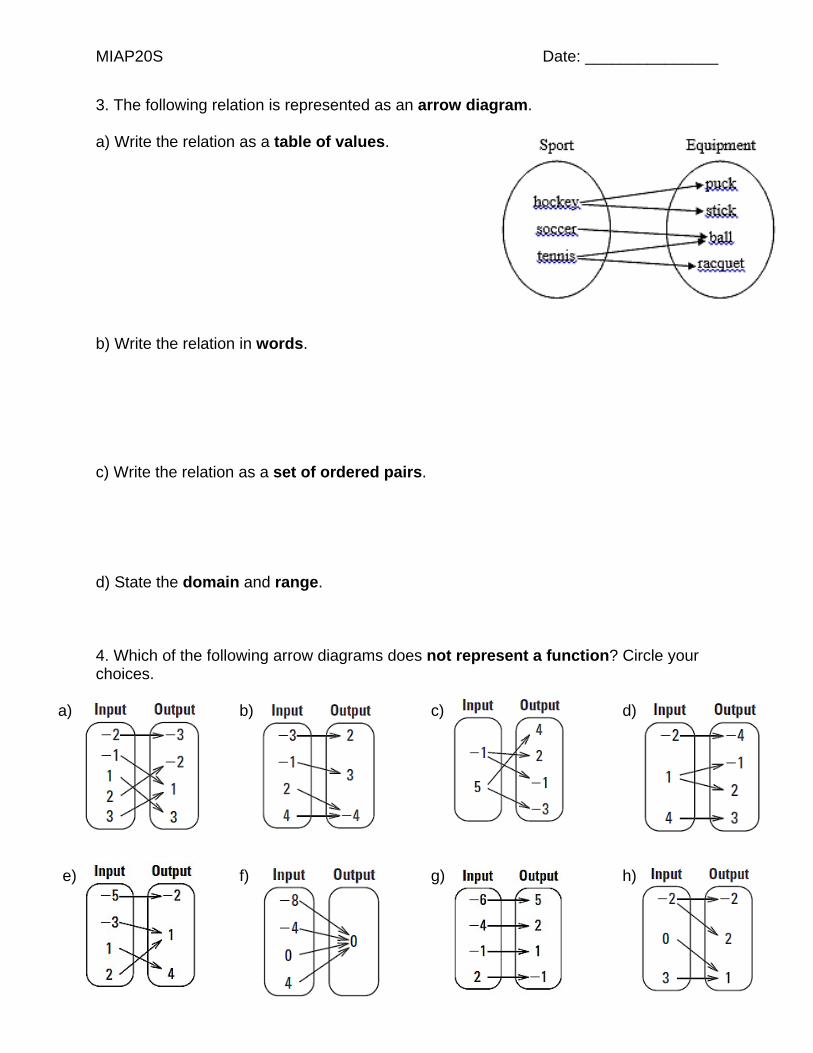
3. The following relation is represented as an arrow diagram. a) Write the relation as a table of values. b) Write the relation in words. c) Write the relation as a set of ordered pairs. d) State the domain and range. 4. Which of the following arrow diagrams does not represent a function? Circle your choices.
a) b) c) d)
e) f) g) h)
MIAP20S Date: _______________
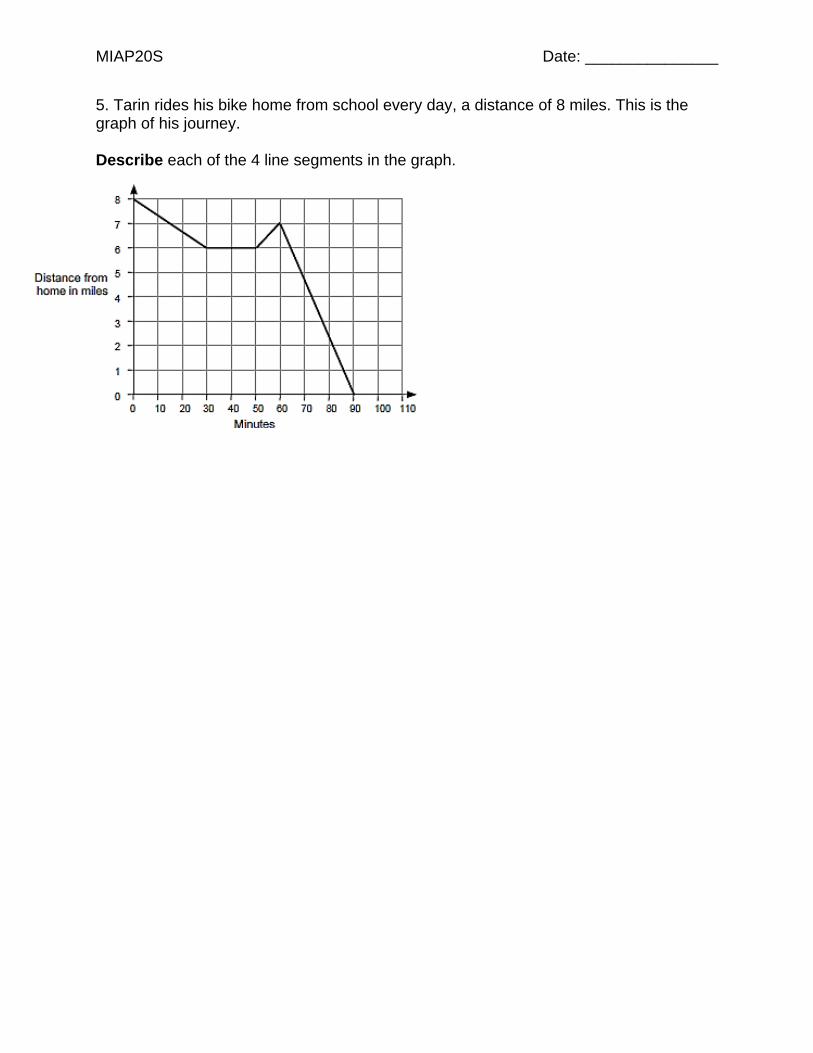
5. Tarin rides his bike home from school every day, a distance of 8 miles. This is the graph of his journey. Describe each of the 4 line segments in the graph.
MIAP20S Date: _______________
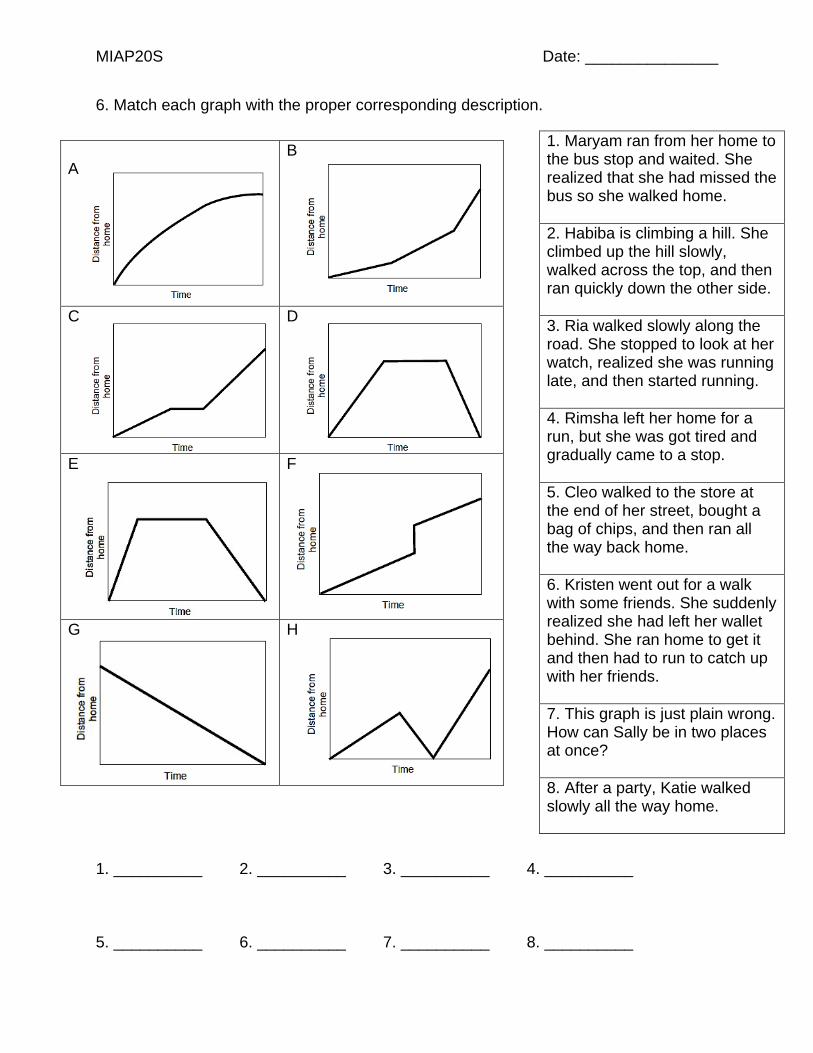
6. Match each graph with the proper corresponding description.
1. __________ 2. __________ 3. __________ 4. __________ 5. __________ 6. __________ 7. __________ 8. __________
1. Maryam ran from her home to the bus stop and waited. She realized that she had missed the bus so she walked home. 2. Habiba is climbing a hill. She climbed up the hill slowly, walked across the top, and then ran quickly down the other side. 3. Ria walked slowly along the road. She stopped to look at her watch, realized she was running late, and then started running. 4. Rimsha left her home for a run, but she was got tired and gradually came to a stop. 5. Cleo walked to the store at the end of her street, bought a bag of chips, and then ran all the way back home. 6. Kristen went out for a walk with some friends. She suddenly realized she had left her wallet behind. She ran home to get it and then had to run to catch up with her friends. 7. This graph is just plain wrong. How can Sally be in two places at once? 8. After a party, Katie walked slowly all the way home.
A
B
C
D
E
F
G
H
MIAP20S Date: _______________
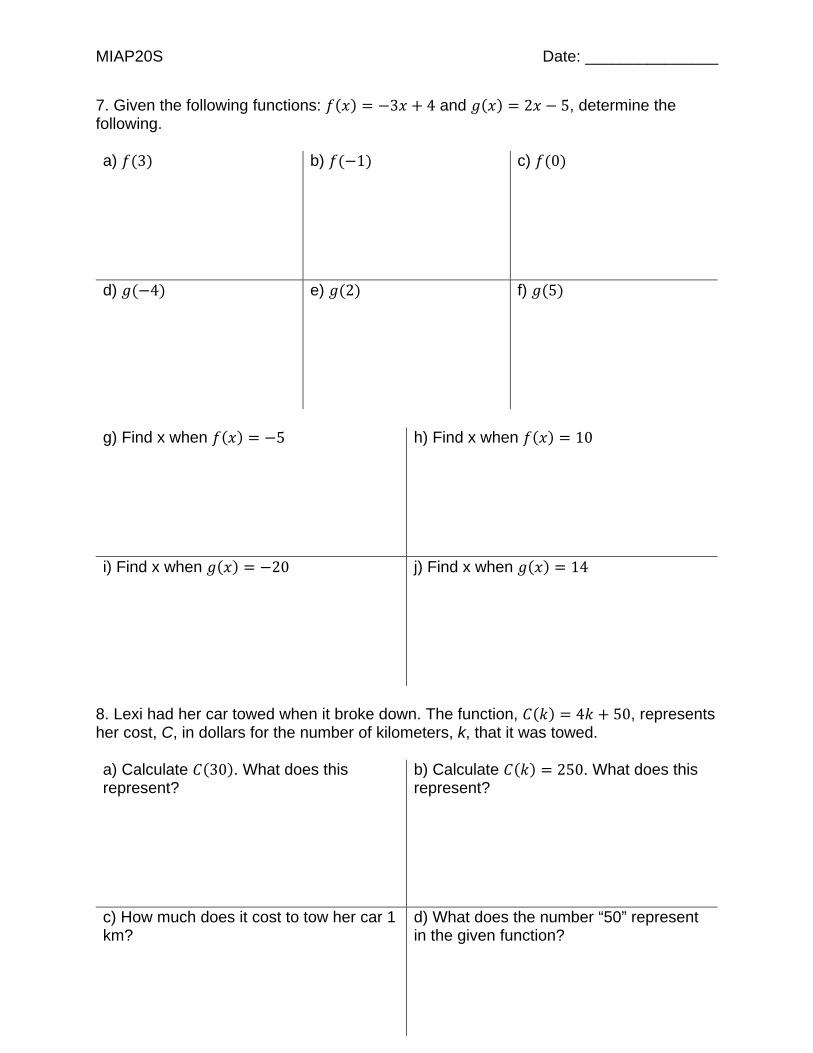
7. Given the following functions: 𝑓𝑓(𝑥𝑥) = −3𝑥𝑥 + 4 and 𝑔𝑔(𝑥𝑥) = 2𝑥𝑥 − 5, determine the following. a) 𝑓𝑓(3) b) 𝑓𝑓(−1) c) 𝑓𝑓(0)
d) 𝑔𝑔(−4) e) 𝑔𝑔(2) f) 𝑔𝑔(5)
g) Find x when 𝑓𝑓(𝑥𝑥) = −5
h) Find x when 𝑓𝑓(𝑥𝑥) = 10
i) Find x when 𝑔𝑔(𝑥𝑥) = −20
j) Find x when 𝑔𝑔(𝑥𝑥) = 14
8. Lexi had her car towed when it broke down. The function, 𝐶𝐶(𝑘𝑘) = 4𝑘𝑘 + 50, represents her cost, C, in dollars for the number of kilometers, k, that it was towed. a) Calculate 𝐶𝐶(30). What does this represent?
b) Calculate 𝐶𝐶(𝑘𝑘) = 250. What does this represent?
c) How much does it cost to tow her car 1 km?
d) What does the number “50” represent in the given function?
MIAP20S Date: _______________
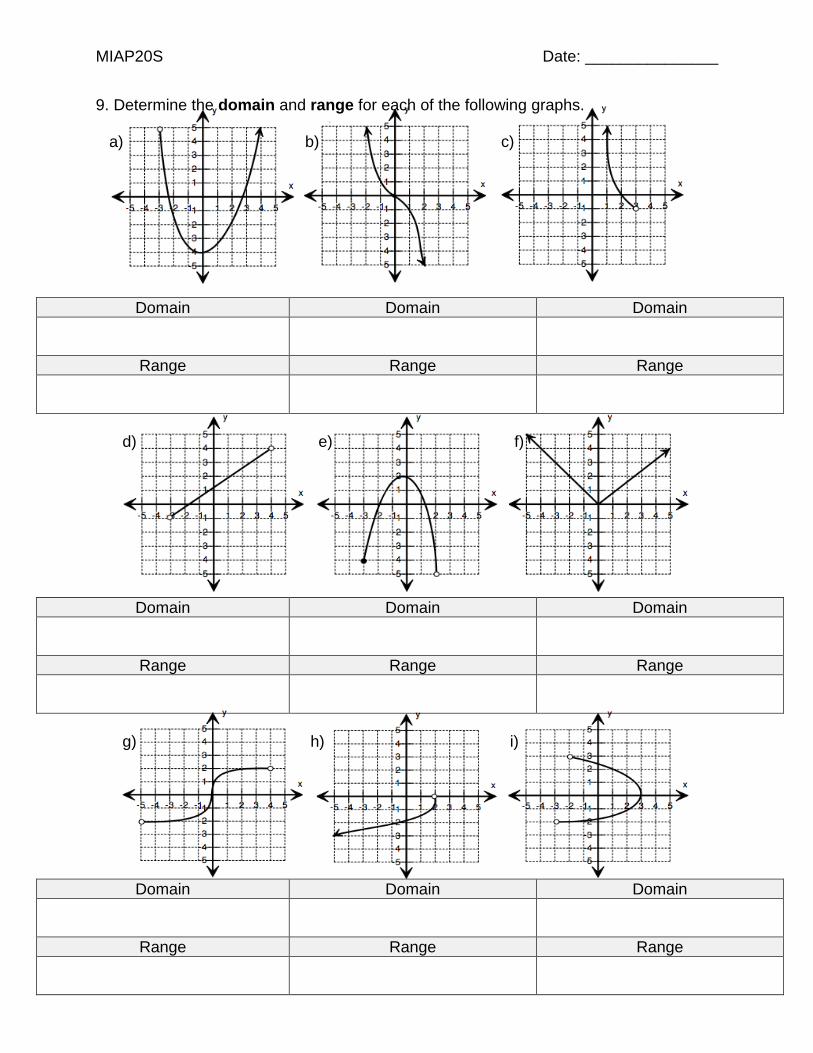
9. Determine the domain and range for each of the following graphs. a) b) c)
Domain Domain Domain
Range Range Range
d) e) f)
Domain Domain Domain
Range Range Range
g) h) i)
Domain Domain Domain
Range Range Range
MIAP20S Date: _______________
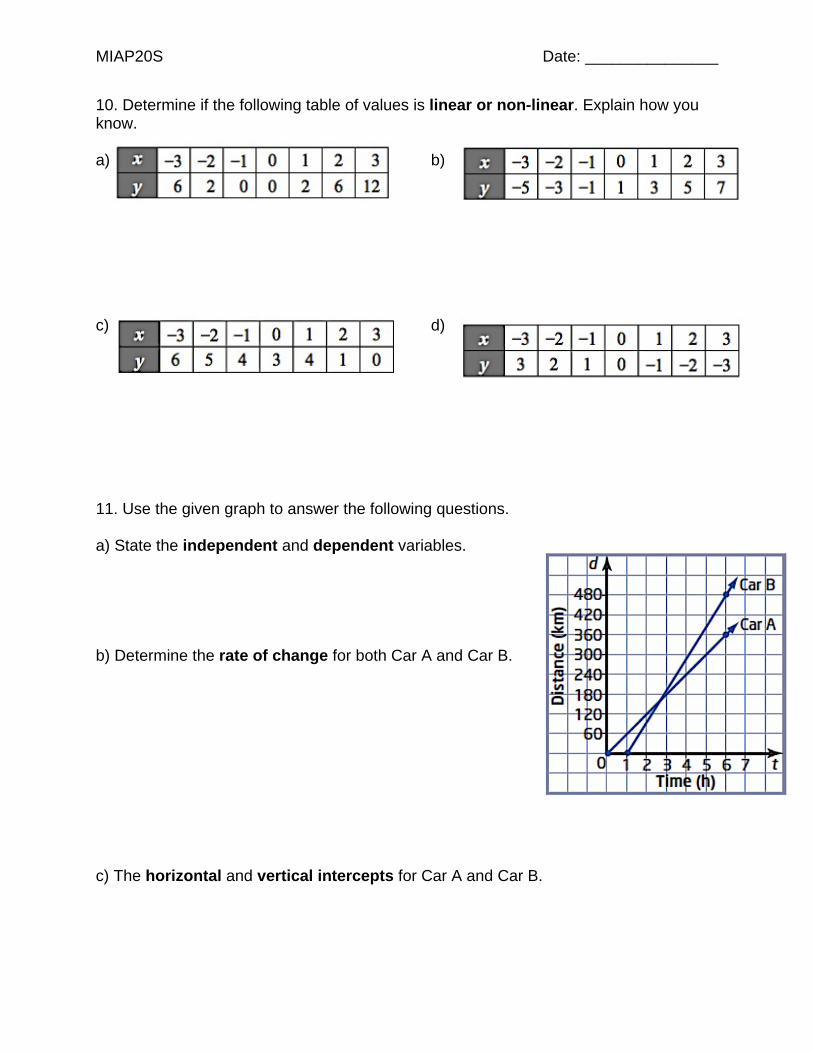
10. Determine if the following table of values is linear or non-linear. Explain how you know. a) b) c) d) 11. Use the given graph to answer the following questions. a) State the independent and dependent variables. b) Determine the rate of change for both Car A and Car B. c) The horizontal and vertical intercepts for Car A and Car B.