Embed Size (px)
Citation preview
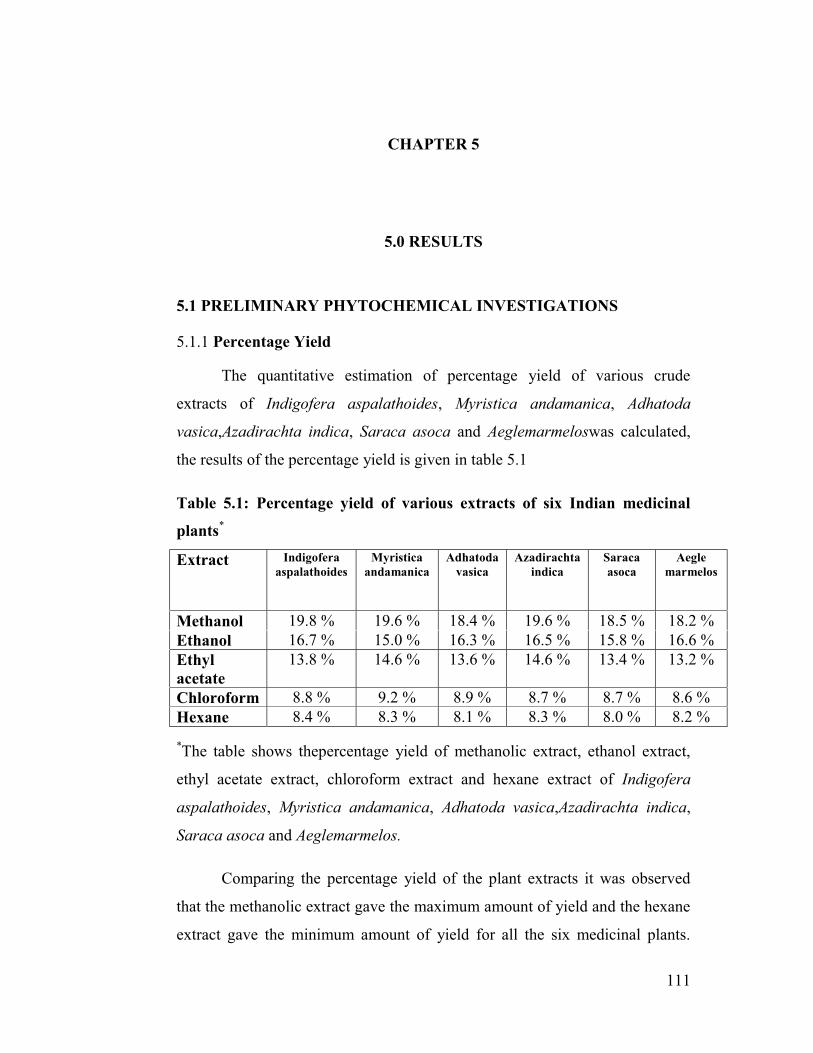
111
CHAPTER 5
5.0 RESULTS
5.1 PRELIMINARY PHYTOCHEMICAL INVESTIGATIONS
5.1.1 Percentage Yield
The quantitative estimation of percentage yield of various crude
extracts of Indigofera aspalathoides, Myristica andamanica, Adhatoda
vasica,Azadirachta indica, Saraca asoca and Aeglemarmeloswas calculated,
the results of the percentage yield is given in table 5.1
Table 5.1: Percentage yield of various extracts of six Indian medicinal
plants*
Extract Indigofera aspalathoides
Myristica andamanica
Adhatoda vasica
Azadirachta indica
Saraca asoca
Aegle marmelos
Methanol 19.8 % 19.6 % 18.4 % 19.6 % 18.5 % 18.2 %Ethanol 16.7 % 15.0 % 16.3 % 16.5 % 15.8 % 16.6 %Ethyl acetate
13.8 % 14.6 % 13.6 % 14.6 % 13.4 % 13.2 %
Chloroform 8.8 % 9.2 % 8.9 % 8.7 % 8.7 % 8.6 %Hexane 8.4 % 8.3 % 8.1 % 8.3 % 8.0 % 8.2 %
*The table shows thepercentage yield of methanolic extract, ethanol extract,
ethyl acetate extract, chloroform extract and hexane extract of Indigofera
aspalathoides, Myristica andamanica, Adhatoda vasica,Azadirachta indica,
Saraca asoca and Aeglemarmelos.
Comparing the percentage yield of the plant extracts it was observed
that the methanolic extract gave the maximum amount of yield and the hexane
extract gave the minimum amount of yield for all the six medicinal plants.
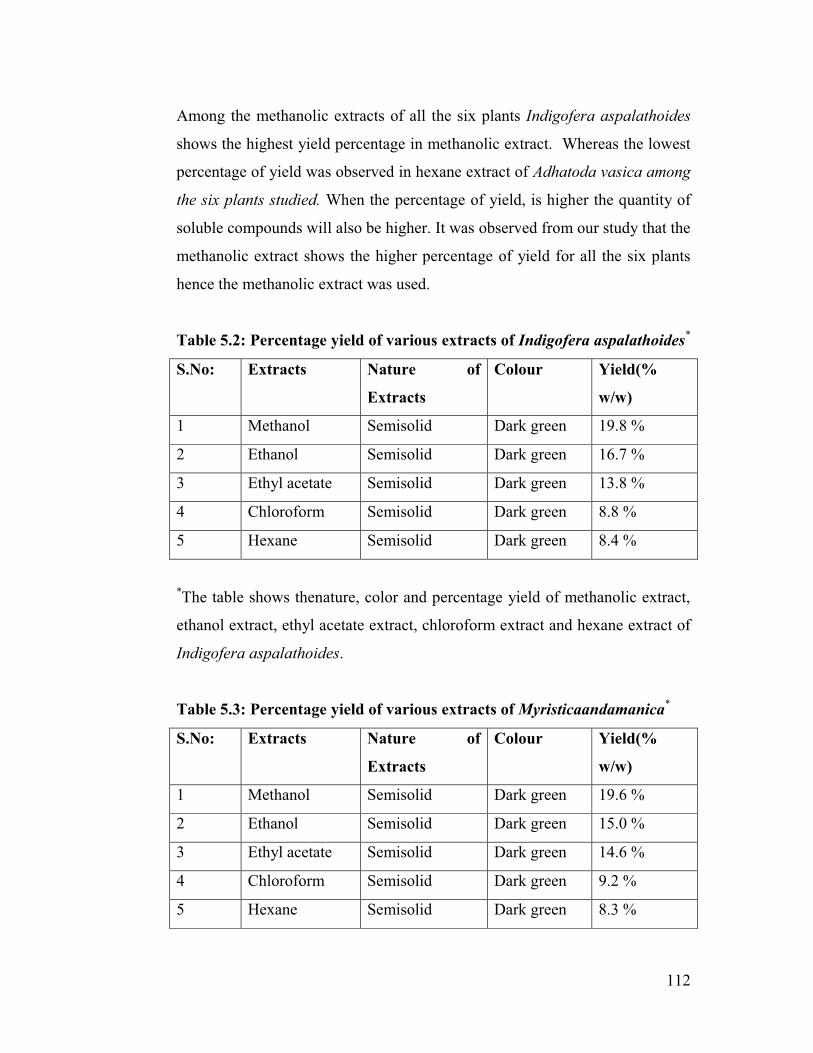
112
Among the methanolic extracts of all the six plants Indigofera aspalathoides
shows the highest yield percentage in methanolic extract. Whereas the lowest
percentage of yield was observed in hexane extract of Adhatoda vasica among
the six plants studied. When the percentage of yield, is higher the quantity of
soluble compounds will also be higher. It was observed from our study that the
methanolic extract shows the higher percentage of yield for all the six plants
hence the methanolic extract was used.
Table 5.2: Percentage yield of various extracts of Indigofera aspalathoides*
S.No: Extracts Nature of
Extracts
Colour Yield(%
w/w)
1 Methanol Semisolid Dark green 19.8 %
2 Ethanol Semisolid Dark green 16.7 %
3 Ethyl acetate Semisolid Dark green 13.8 %
4 Chloroform Semisolid Dark green 8.8 %
5 Hexane Semisolid Dark green 8.4 %
*The table shows thenature, color and percentage yield of methanolic extract,
ethanol extract, ethyl acetate extract, chloroform extract and hexane extract of
Indigofera aspalathoides.
Table 5.3: Percentage yield of various extracts of Myristicaandamanica*
S.No: Extracts Nature of
Extracts
Colour Yield(%
w/w)
1 Methanol Semisolid Dark green 19.6 %
2 Ethanol Semisolid Dark green 15.0 %
3 Ethyl acetate Semisolid Dark green 14.6 %
4 Chloroform Semisolid Dark green 9.2 %
5 Hexane Semisolid Dark green 8.3 %
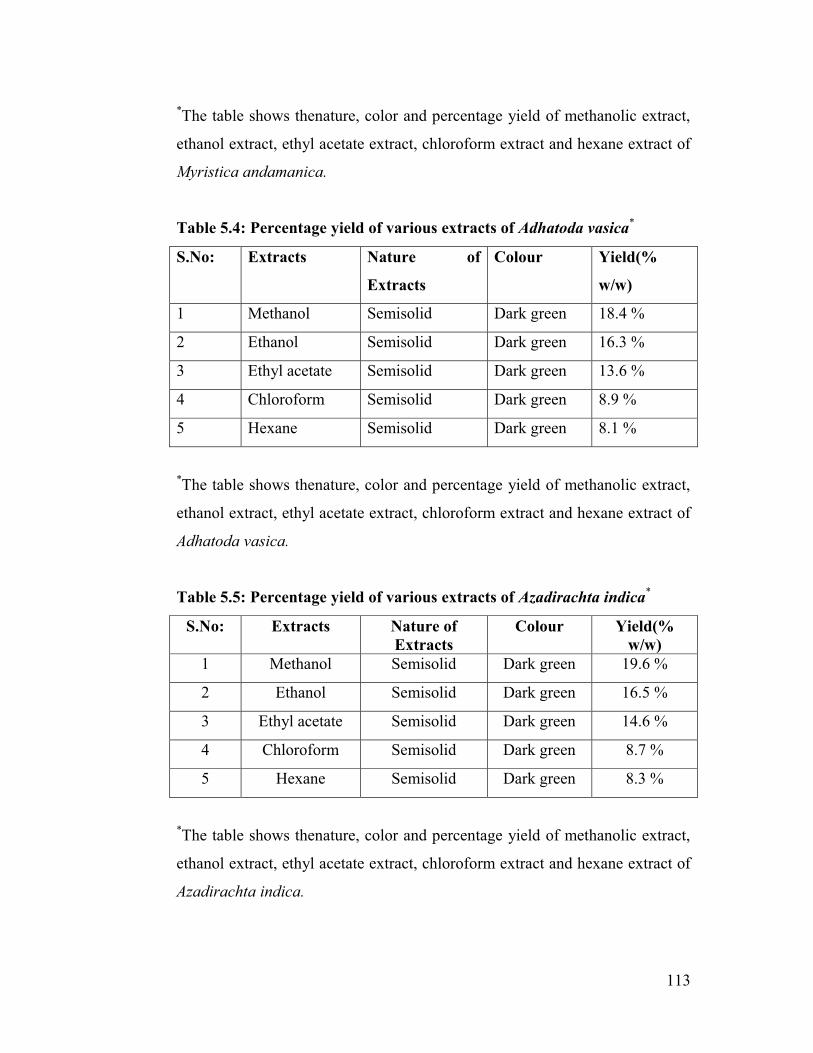
113
*The table shows thenature, color and percentage yield of methanolic extract,
ethanol extract, ethyl acetate extract, chloroform extract and hexane extract of
Myristica andamanica.
Table 5.4: Percentage yield of various extracts of Adhatoda vasica*
S.No: Extracts Nature of
Extracts
Colour Yield(%
w/w)
1 Methanol Semisolid Dark green 18.4 %
2 Ethanol Semisolid Dark green 16.3 %
3 Ethyl acetate Semisolid Dark green 13.6 %
4 Chloroform Semisolid Dark green 8.9 %
5 Hexane Semisolid Dark green 8.1 %
*The table shows thenature, color and percentage yield of methanolic extract,
ethanol extract, ethyl acetate extract, chloroform extract and hexane extract of
Adhatoda vasica.
Table 5.5: Percentage yield of various extracts of Azadirachta indica*
S.No: Extracts Nature of Extracts
Colour Yield(% w/w)
1 Methanol Semisolid Dark green 19.6 %
2 Ethanol Semisolid Dark green 16.5 %
3 Ethyl acetate Semisolid Dark green 14.6 %
4 Chloroform Semisolid Dark green 8.7 %
5 Hexane Semisolid Dark green 8.3 %
*The table shows thenature, color and percentage yield of methanolic extract,
ethanol extract, ethyl acetate extract, chloroform extract and hexane extract of
Azadirachta indica.
114
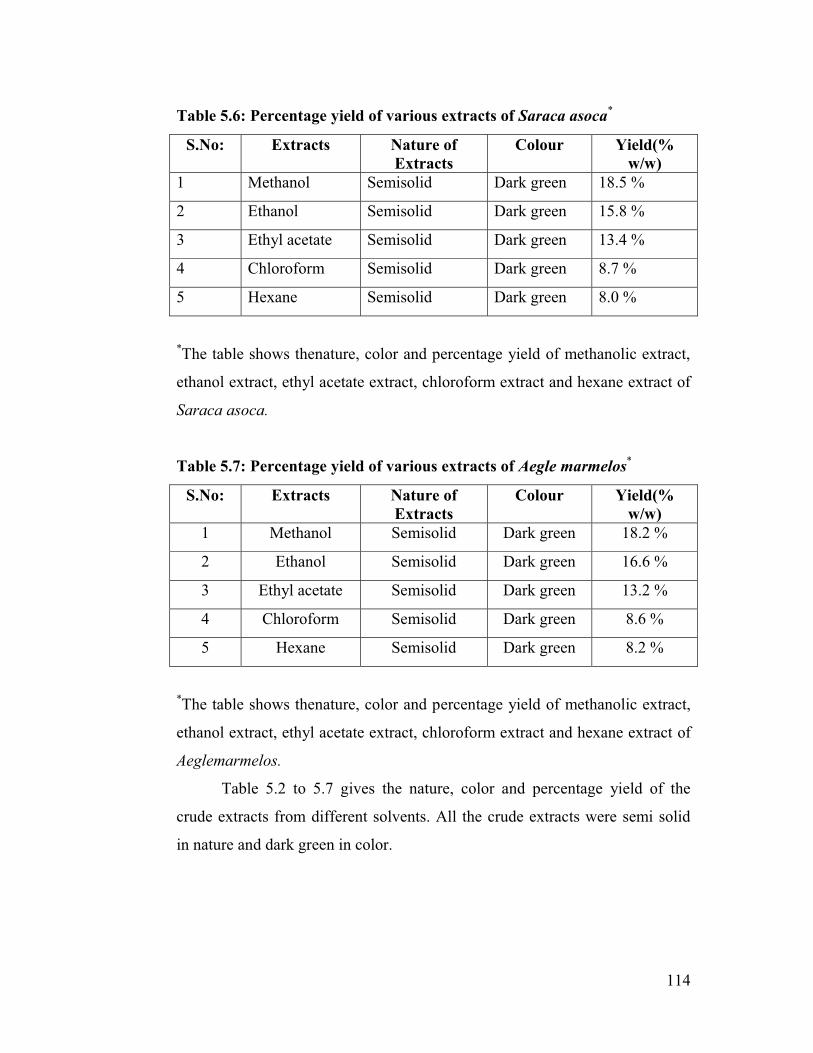
Table 5.6: Percentage yield of various extracts of Saraca asoca*
S.No: Extracts Nature of Extracts
Colour Yield(% w/w)
1 Methanol Semisolid Dark green 18.5 %
2 Ethanol Semisolid Dark green 15.8 %
3 Ethyl acetate Semisolid Dark green 13.4 %
4 Chloroform Semisolid Dark green 8.7 %
5 Hexane Semisolid Dark green 8.0 %
*The table shows thenature, color and percentage yield of methanolic extract,
ethanol extract, ethyl acetate extract, chloroform extract and hexane extract of
Saraca asoca.
Table 5.7: Percentage yield of various extracts of Aegle marmelos*
S.No: Extracts Nature of Extracts
Colour Yield(% w/w)
1 Methanol Semisolid Dark green 18.2 %
2 Ethanol Semisolid Dark green 16.6 %
3 Ethyl acetate Semisolid Dark green 13.2 %
4 Chloroform Semisolid Dark green 8.6 %
5 Hexane Semisolid Dark green 8.2 %
*The table shows thenature, color and percentage yield of methanolic extract,
ethanol extract, ethyl acetate extract, chloroform extract and hexane extract of
Aeglemarmelos.
Table 5.2 to 5.7 gives the nature, color and percentage yield of the
crude extracts from different solvents. All the crude extracts were semi solid
in nature and dark green in color.
115
5.2 PRELIMINARY PHYTOCHEMICAL ANALYSIS OF SIX INDIAN MEDICINAL PLANTS
5.2.1 Phytochemical Screening Methods
Methanol extract was evaluated for presence of various
phytoconstituents by performing different qualitative chemical tests reported
[280,184]. It showed the presence of anthraquinone glycosides, saponins,
tannins and phytosterols.
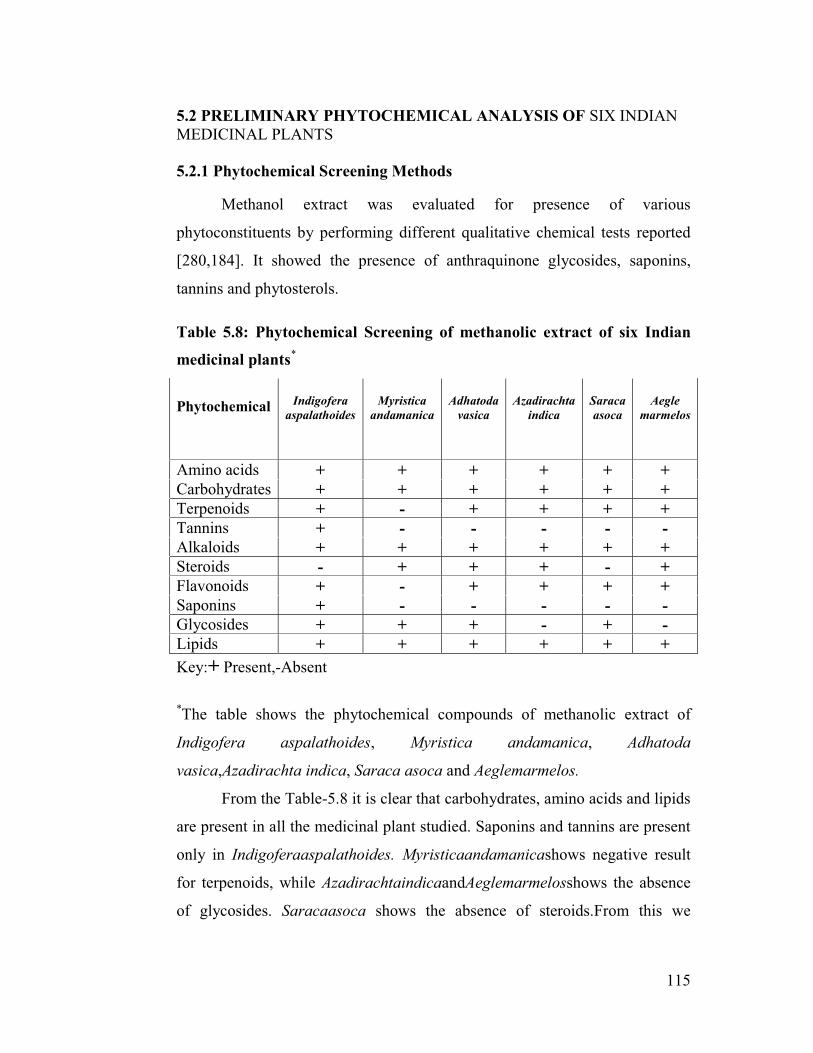
Table 5.8: Phytochemical Screening of methanolic extract of six Indian
medicinal plants*
Phytochemical Indigofera aspalathoides
Myristica andamanica
Adhatoda vasica
Azadirachta indica
Saraca asoca
Aegle marmelos
Amino acids + + + + + +Carbohydrates + + + + + +Terpenoids + - + + + +Tannins + - - - - -Alkaloids + + + + + +Steroids - + + + - +Flavonoids + - + + + +Saponins + - - - - -Glycosides + + + - + -Lipids + + + + + +Key:+ Present,-Absent
*The table shows the phytochemical compounds of methanolic extract of
Indigofera aspalathoides, Myristica andamanica, Adhatoda
vasica,Azadirachta indica, Saraca asoca and Aeglemarmelos.
From the Table-5.8 it is clear that carbohydrates, amino acids and lipids
are present in all the medicinal plant studied. Saponins and tannins are present
only in Indigoferaaspalathoides. Myristicaandamanicashows negative result
for terpenoids, while AzadirachtaindicaandAeglemarmelosshows the absence
of glycosides. Saracaasoca shows the absence of steroids.From this we
116
conclude that the methanolic extract of Indigofera aspalathoides primarily
contains amino acids, carbohydrates, terpenoids, tannins, alkaloids,
flavonoids, saponins, glycosides and lipids.
Preliminary phytochemical analysis revealed thepresence of alkaloids
and saponins. The other secondary metabolites liketannins, flavonoids,
steroids, glycosides, etc. were also present in Indigoferaaspalathoides. Since
most of the phytochemicals were present in Indigofera aspalathoides the
plant extract ofIndigofera aspalathoideswas used for the characterization of
the bio active components by UV visible spectroscopy, FTIR, 13C NMR and 1H NMR studies .
5.3 ANTIOXIDANT ASSAYS OF SIX INDIAN MEDICINAL PLANTS:
5.3.1 2,2- Diphenyl 1-picra Hydrazyl (DPPH)ASSAY
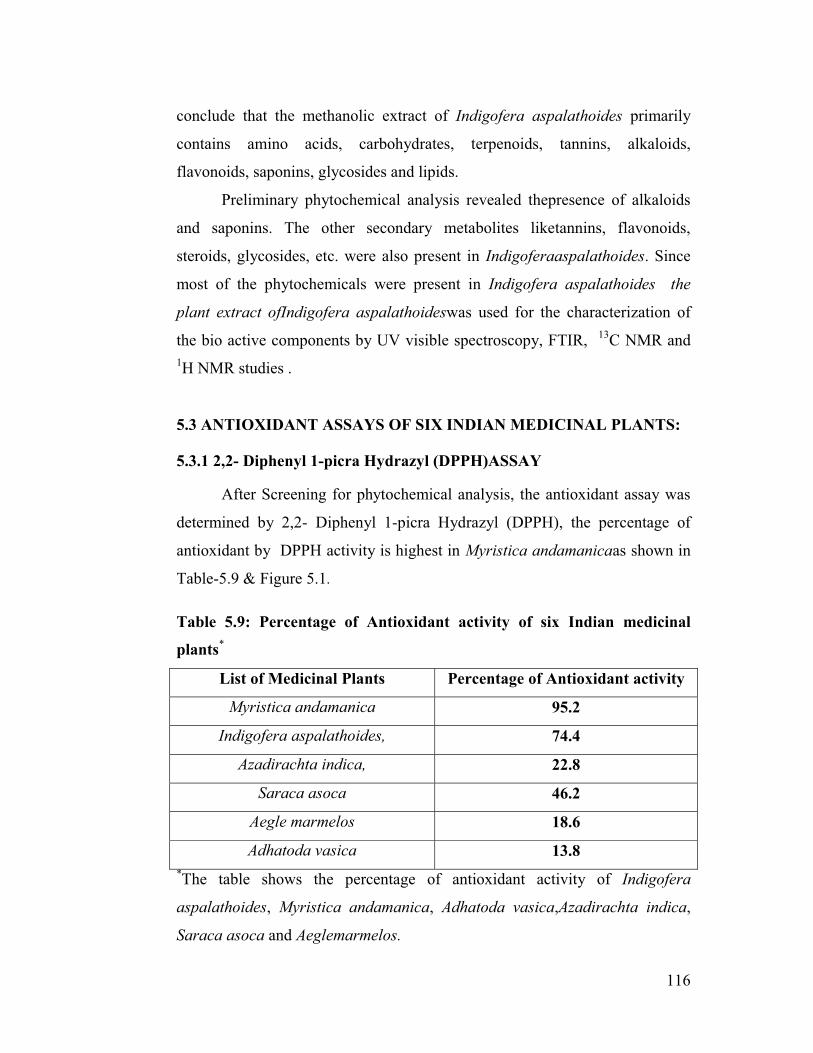
After Screening for phytochemical analysis, the antioxidant assay was
determined by 2,2- Diphenyl 1-picra Hydrazyl (DPPH), the percentage of
antioxidant by DPPH activity is highest in Myristica andamanicaas shown in
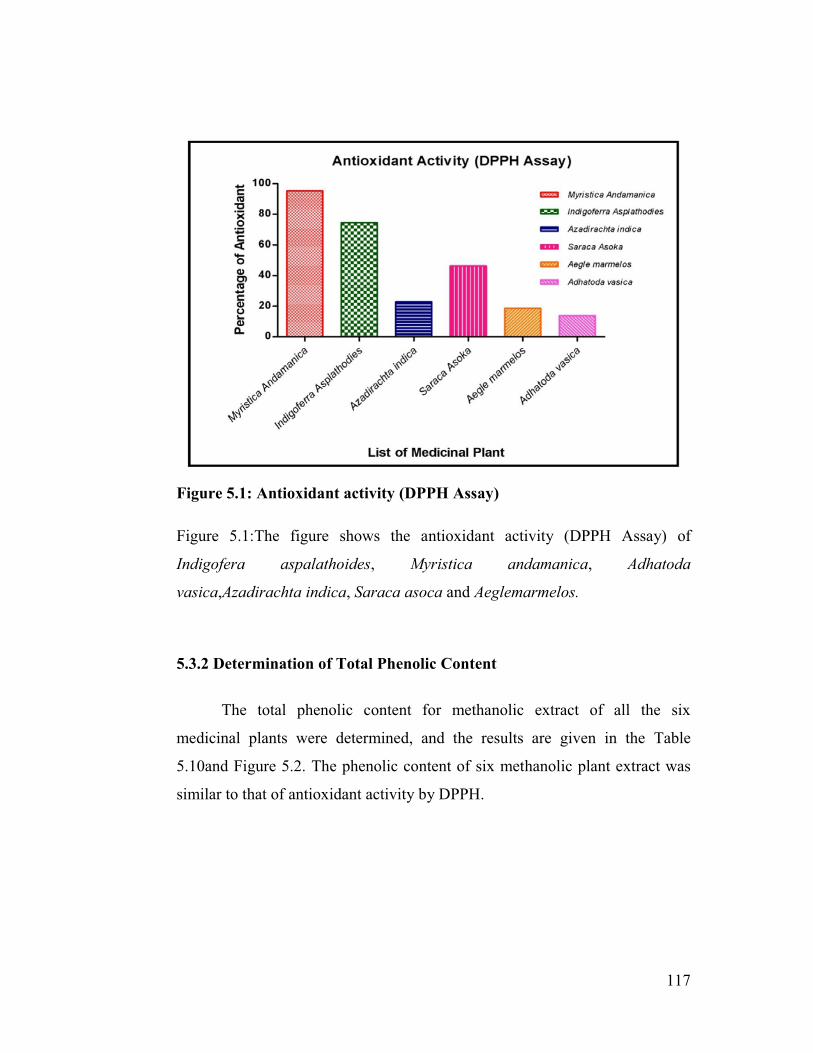
Table-5.9 & Figure 5.1.
Table 5.9: Percentage of Antioxidant activity of six Indian medicinal
plants*
List of Medicinal Plants Percentage of Antioxidant activity
Myristica andamanica 95.2
Indigofera aspalathoides, 74.4
Azadirachta indica, 22.8
Saraca asoca 46.2
Aegle marmelos 18.6
Adhatoda vasica 13.8*The table shows the percentage of antioxidant activity of Indigofera
aspalathoides, Myristica andamanica, Adhatoda vasica,Azadirachta indica,
Saraca asoca and Aeglemarmelos.
117
Figure 5.1: Antioxidant activity (DPPH Assay)
Figure 5.1:The figure shows the antioxidant activity (DPPH Assay) of
Indigofera aspalathoides, Myristica andamanica, Adhatoda
vasica,Azadirachta indica, Saraca asoca and Aeglemarmelos.
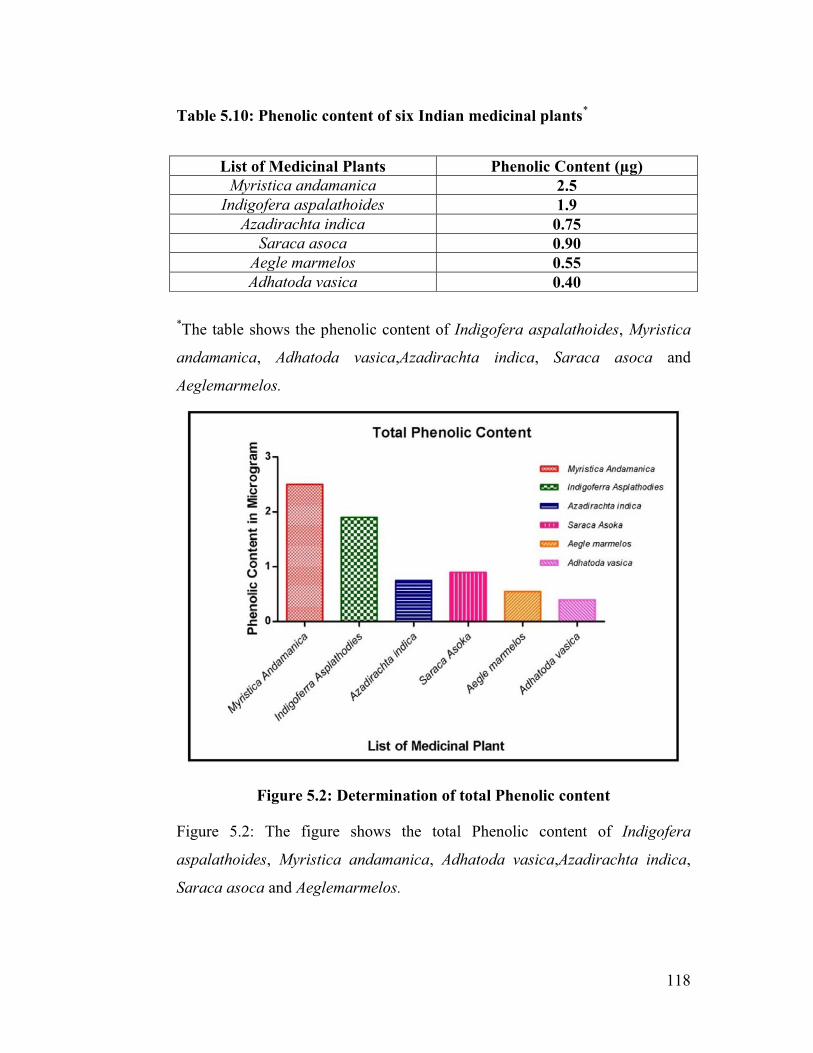
5.3.2 Determination of Total Phenolic Content
The total phenolic content for methanolic extract of all the six
medicinal plants were determined, and the results are given in the Table
5.10and Figure 5.2. The phenolic content of six methanolic plant extract was
similar to that of antioxidant activity by DPPH.
118
Table 5.10: Phenolic content of six Indian medicinal plants*
List of Medicinal Plants Phenolic Content (µg)Myristica andamanica 2.5
Indigofera aspalathoides 1.9Azadirachta indica 0.75
Saraca asoca 0.90Aegle marmelos 0.55Adhatoda vasica 0.40
*The table shows the phenolic content of Indigofera aspalathoides, Myristica
andamanica, Adhatoda vasica,Azadirachta indica, Saraca asoca and
Aeglemarmelos.
Figure 5.2: Determination of total Phenolic content
Figure 5.2: The figure shows the total Phenolic content of Indigofera
aspalathoides, Myristica andamanica, Adhatoda vasica,Azadirachta indica,
Saraca asoca and Aeglemarmelos.
119
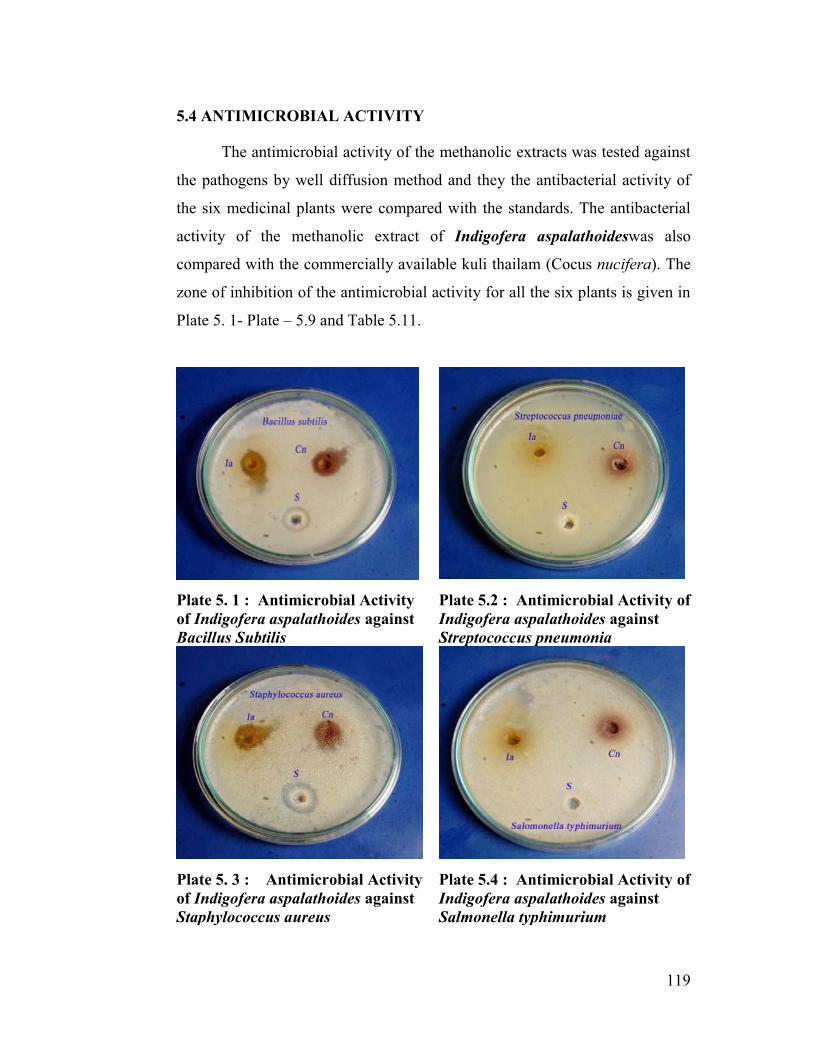
5.4 ANTIMICROBIAL ACTIVITY
The antimicrobial activity of the methanolic extracts was tested against
the pathogens by well diffusion method and they the antibacterial activity of
the six medicinal plants were compared with the standards. The antibacterial
activity of the methanolic extract of Indigofera aspalathoideswas also
compared with the commercially available kuli thailam (Cocus nucifera). The
zone of inhibition of the antimicrobial activity for all the six plants is given in
Plate 5. 1- Plate – 5.9 and Table 5.11.
Plate 5. 1 : Antimicrobial Activity of Indigofera aspalathoides againstBacillus Subtilis
Plate 5.2 : Antimicrobial Activity of Indigofera aspalathoides against Streptococcus pneumonia
Plate 5. 3 : Antimicrobial Activity of Indigofera aspalathoides againstStaphylococcus aureus
Plate 5.4 : Antimicrobial Activity of Indigofera aspalathoides against Salmonella typhimurium
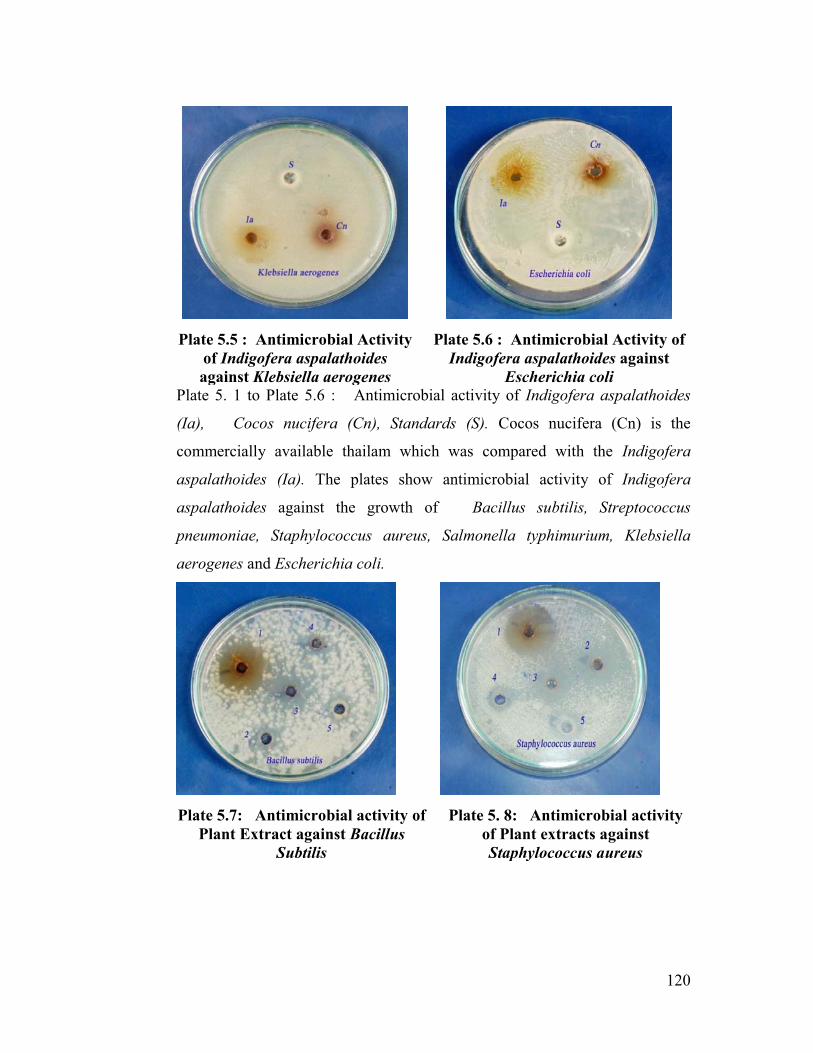
120
Plate 5.5 : Antimicrobial Activity of Indigofera aspalathoides against Klebsiella aerogenes
Plate 5.6 : Antimicrobial Activity of Indigofera aspalathoides against
Escherichia coliPlate 5. 1 to Plate 5.6 : Antimicrobial activity of Indigofera aspalathoides
(Ia), Cocos nucifera (Cn), Standards (S). Cocos nucifera (Cn) is the
commercially available thailam which was compared with the Indigofera
aspalathoides (Ia). The plates show antimicrobial activity of Indigofera
aspalathoides against the growth of Bacillus subtilis, Streptococcus
pneumoniae, Staphylococcus aureus, Salmonella typhimurium, Klebsiella
aerogenes and Escherichia coli.
Plate 5.7: Antimicrobial activity of Plant Extract against Bacillus
Subtilis
Plate 5. 8: Antimicrobial activity of Plant extracts against Staphylococcus aureus
121
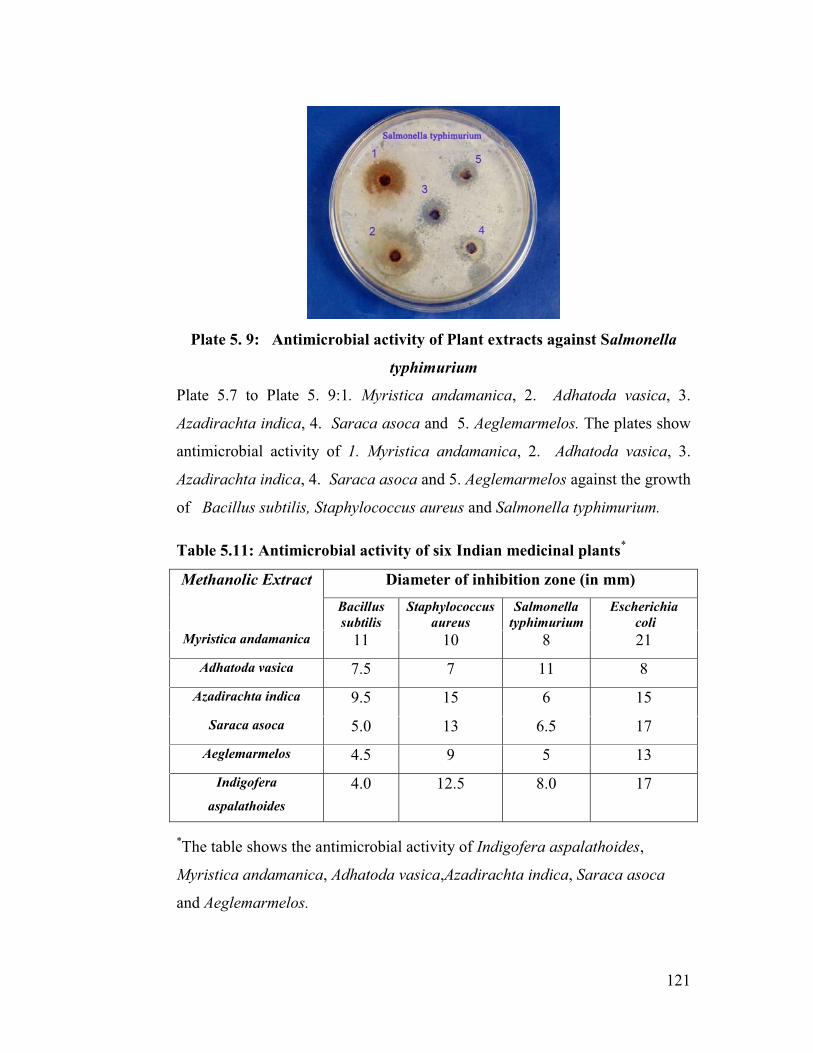
Plate 5. 9: Antimicrobial activity of Plant extracts against Salmonella
typhimurium
Plate 5.7 to Plate 5. 9:1. Myristica andamanica, 2. Adhatoda vasica, 3.
Azadirachta indica, 4. Saraca asoca and 5. Aeglemarmelos. The plates show
antimicrobial activity of 1. Myristica andamanica, 2. Adhatoda vasica, 3.
Azadirachta indica, 4. Saraca asoca and 5. Aeglemarmelos against the growth
of Bacillus subtilis, Staphylococcus aureus and Salmonella typhimurium.
Table 5.11: Antimicrobial activity of six Indian medicinal plants*
Methanolic Extract Diameter of inhibition zone (in mm)Bacillus subtilis
Staphylococcus aureus
Salmonella typhimurium
Escherichiacoli
Myristica andamanica 11 10 8 21
Adhatoda vasica 7.5 7 11 8
Azadirachta indica 9.5 15 6 15
Saraca asoca 5.0 13 6.5 17
Aeglemarmelos 4.5 9 5 13
Indigofera
aspalathoides4.0 12.5 8.0 17
*The table shows the antimicrobial activity of Indigofera aspalathoides,
Myristica andamanica, Adhatoda vasica,Azadirachta indica, Saraca asoca
and Aeglemarmelos.
122
Myristica andamanica showed the highest antimicrobial activity
against Bacillus subtilis and Escherichia coli. Adhatoda vasica was effective
against Salmonella typhimurium, andAzadirachta indica showed the highest
inhibitory zone against Staphylococcus aureus.
The order of antimicrobial activity against the Gram positive, catalase-
positive (rod) bacterium Bacillus subtilis is Myristica andamanica>
Azadirachta indica>Adhatoda vasica >Saraca asoca
>Aeglemarmelos>Indigofera aspalathoides.
The inhibitory activity of facultative anaerobic Gram-positive coccal
bacterium Staphylococcus aureus is in the order ofAzadirachta indica >Saraca
asoca > Indigofera aspalathoides >Myristica andamanica > Aeglemarmelos
>Adhatoda vasica.
The growth of the organism Salmonellae typhimurium a Gram-
negative, facultative anaerobic bacteria was inhibited by all the six plant
extract and the order of inhibition is as follows : Adhatoda vasica >Indigofera
aspalathoides = Myristica andamanica > Saraca asoca > Azadirachta
indica > Aeglemarmelos(plate 5.9 and table 5.11).
The order of antimicrobial activity against Escherichia coli a Gram-
negative, rod-shaped bacterium is Myristica andamanica > Saraca asoca =
Indigofera aspalathoides > Azadirachta indica > Aeglemarmelos > Adhatoda
vasica(Plate 5.6)
Based on the results of antimicrobial studies all the methanolic plant
extracts were tested for the wound healing activity in Swiss albino mice by
excision wound model.
123
5.5 HPTLC RESULTS
The HPTLC reports of all the six Indian medicinal plants are given below for
the following extracts in the figures 5.3 - figure 5.32
1. Methanol
2. Ethanol
3. Ethyl Acetate
4. Chloroform
5. Hexane
Figure 5.3 – figure 5.7 shows the HPTLC reports of methanolic extract,
ethanol extract, ethyl acetate extract, chloroform extract and hexane extract of
Indigofera aspalathoides. Figure 5.8 – figure 5.12 shows the HPTLC reports
of methanolic extract, ethanol extract, ethyl acetate extract, chloroform extract
and hexane extract of Myristica andamanica. Figure 5.13 – figure 5.17 shows
the HPTLC reports of methanolic extract, ethanol extract, ethyl acetate extract,
chloroform extract and hexane extract of Adhatoda vasica. Figure 5.18 –
figure 5.22 shows the HPTLC reports of methanolic extract, ethanol extract,
ethyl acetate extract, chloroform extract and hexane extract of Azadirachta
indica. Figure 5.23 – figure 5.27 shows the HPTLC reports of methanolic
extract, ethanol extract, ethyl acetate extract, chloroform extract and hexane
extract of Saraca asoca. Figure 5.28 – figure 5.32 shows the HPTLC reports
of methanolic extract, ethanol extract, ethyl acetate extract, chloroform extract
and hexane extract of Aeglemarmelos.
124
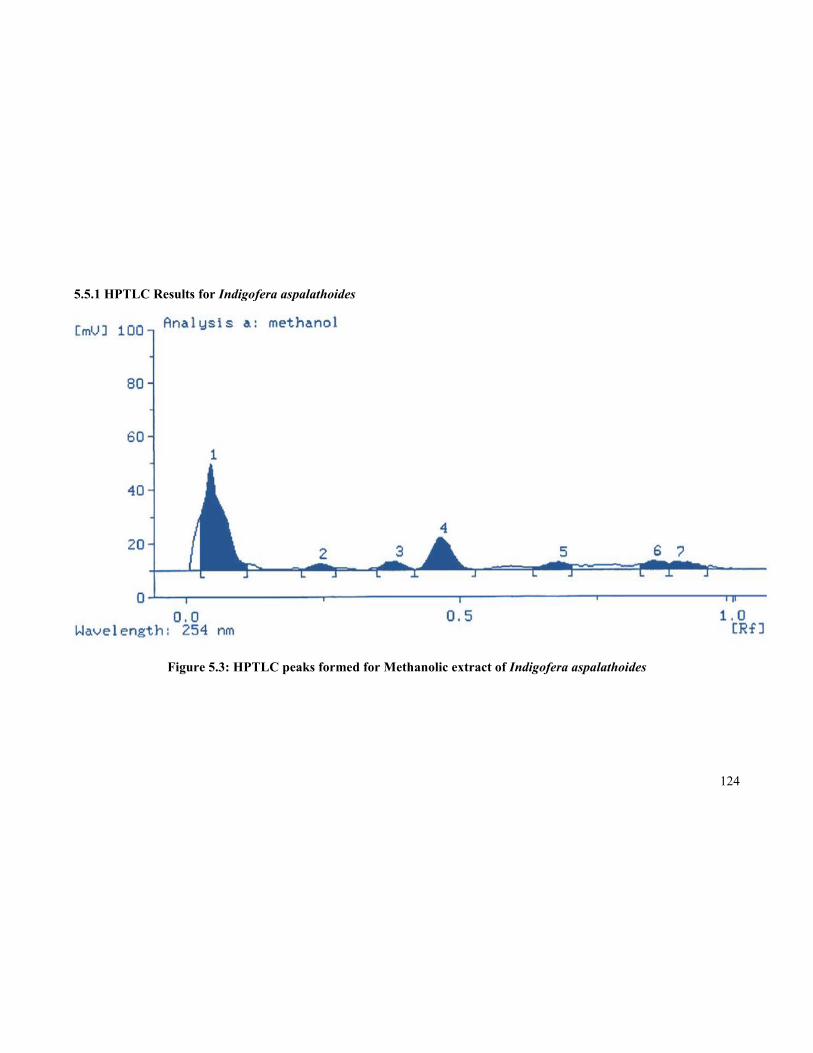
5.5.1 HPTLC Results for Indigofera aspalathoides
Figure 5.3: HPTLC peaks formed for Methanolic extract of Indigofera aspalathoides
125
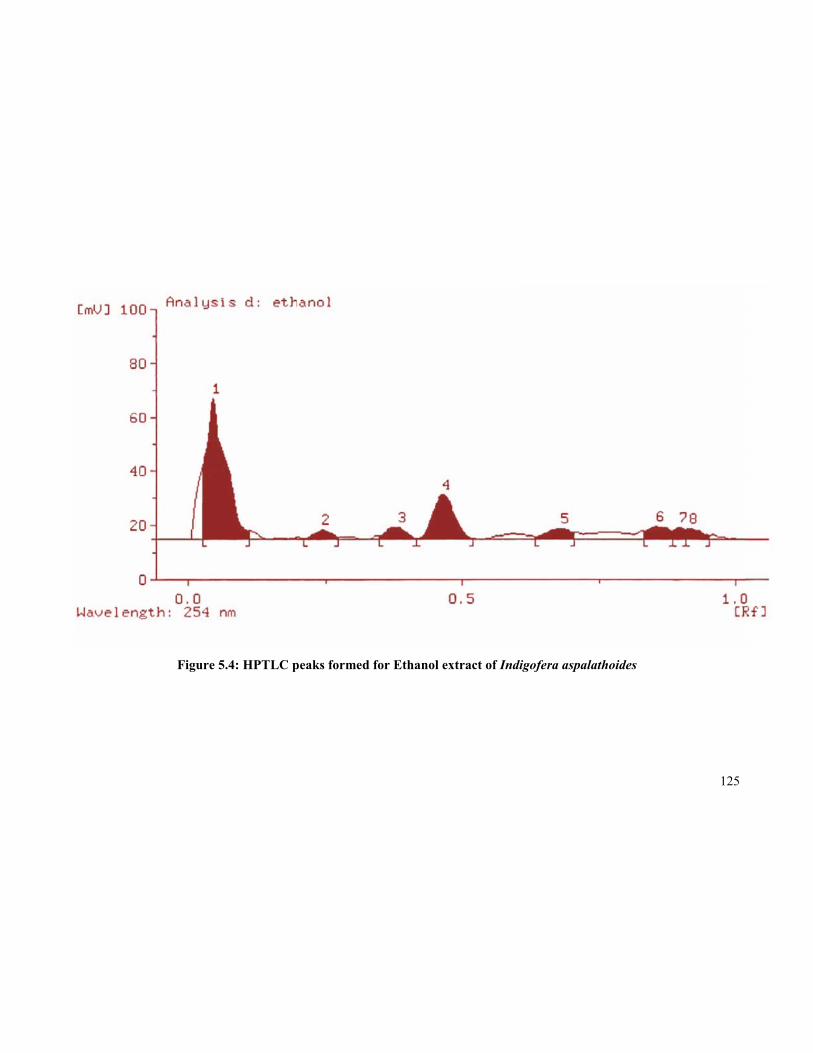
Figure 5.4: HPTLC peaks formed for Ethanol extract of Indigofera aspalathoides
126
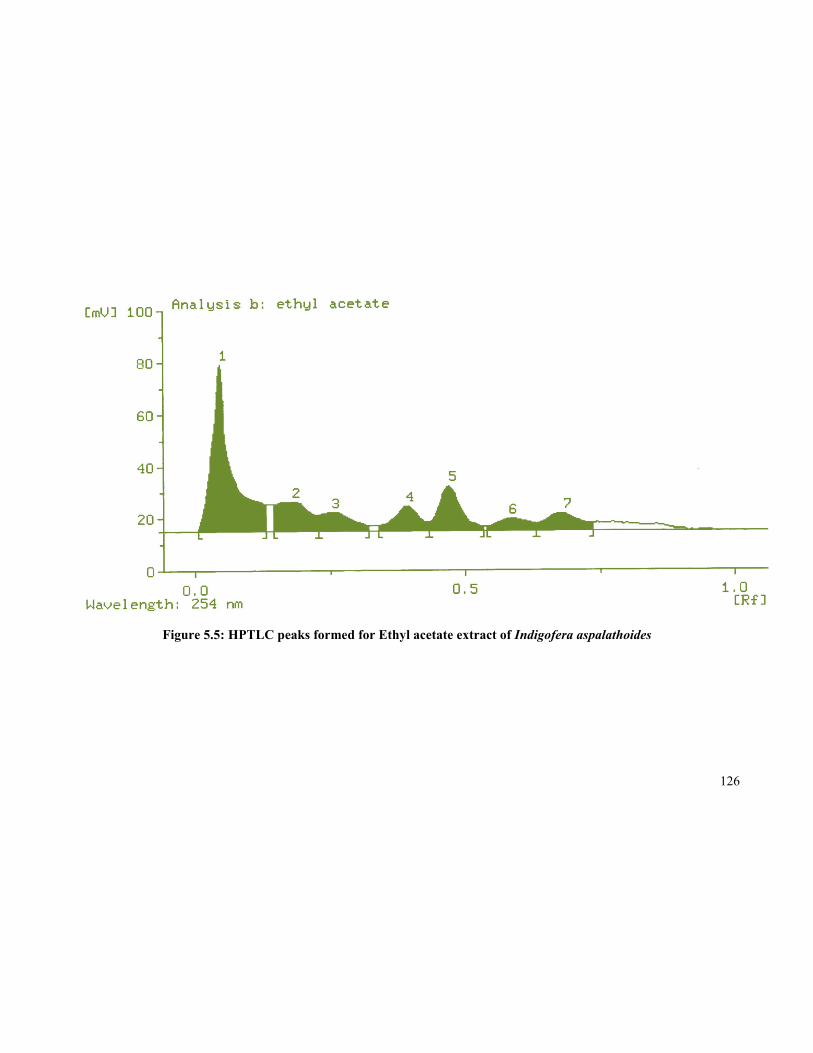
Figure 5.5: HPTLC peaks formed for Ethyl acetate extract of Indigofera aspalathoides
127
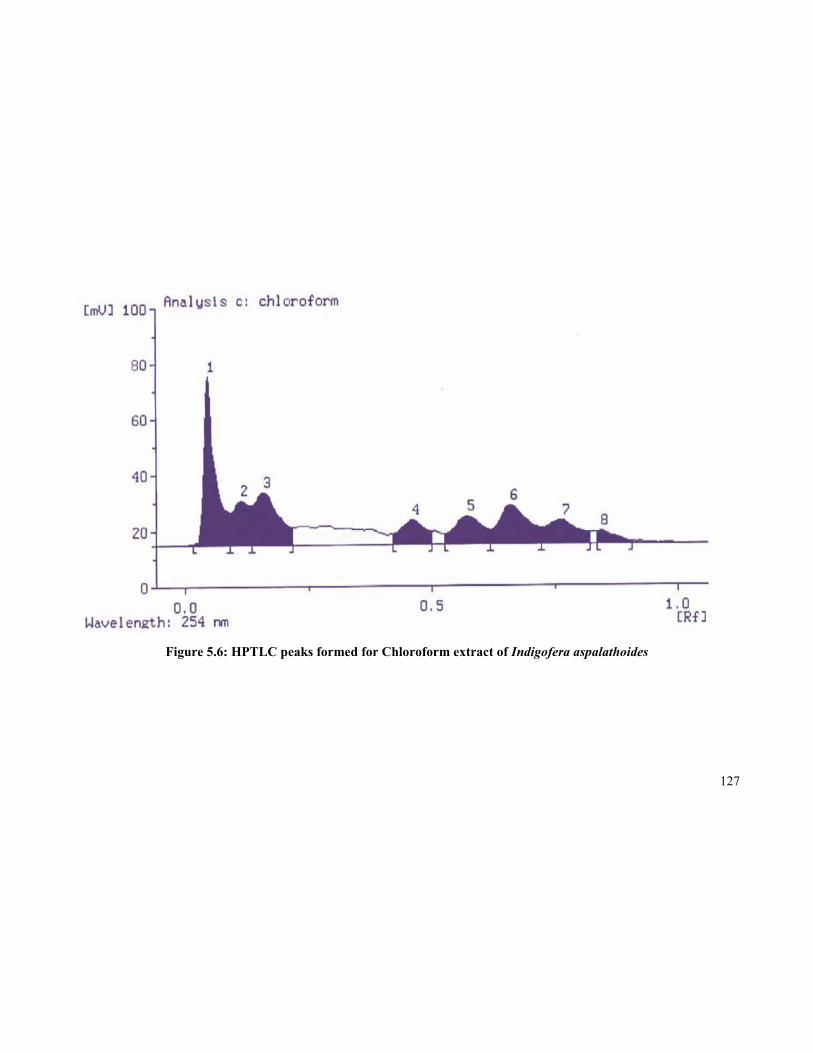
Figure 5.6: HPTLC peaks formed for Chloroform extract of Indigofera aspalathoides

128
Figure 5.7: HPTLC peaks formed for Hexane extract of Indigofera aspalathoides
129
5.5.2 HPTLC Results for Myristica andamanica
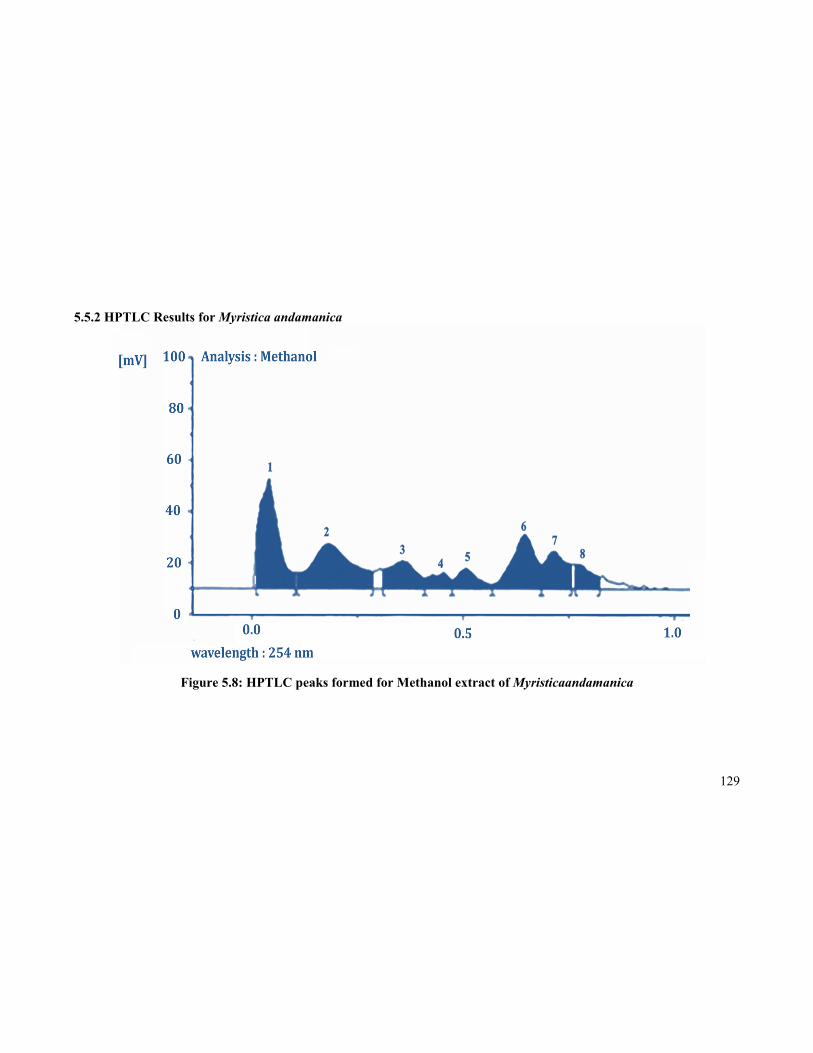
Figure 5.8: HPTLC peaks formed for Methanol extract of Myristicaandamanica
130
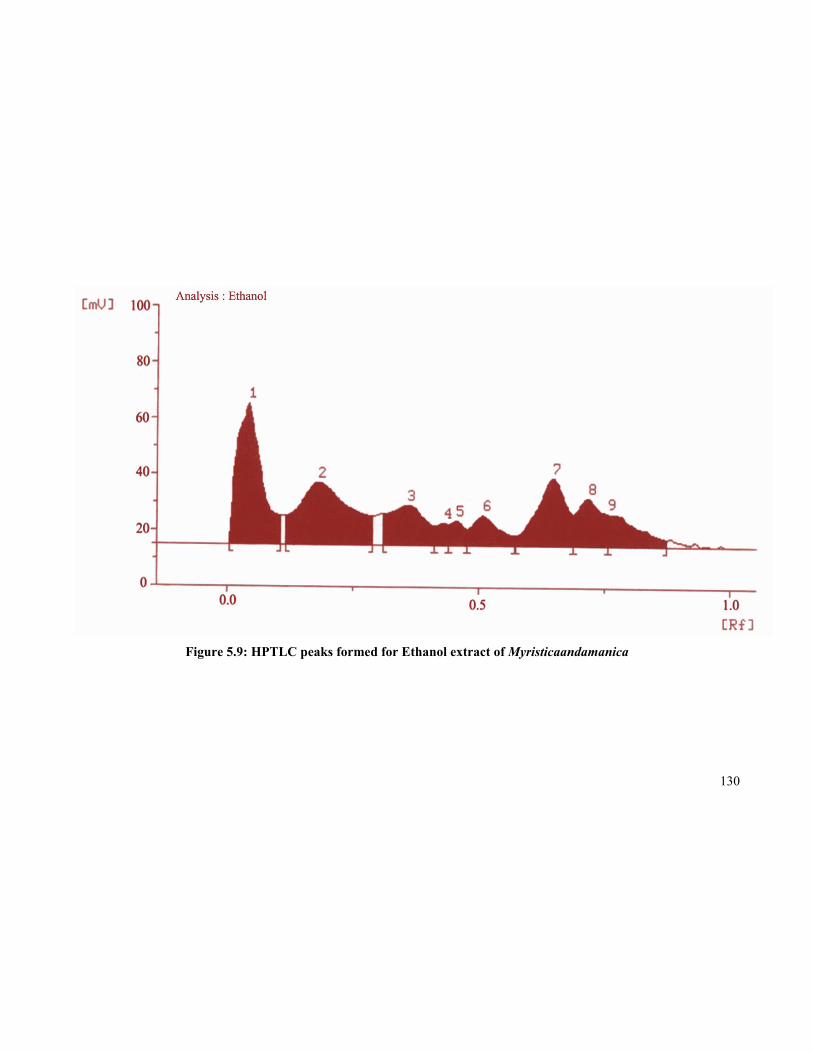
Figure 5.9: HPTLC peaks formed for Ethanol extract of Myristicaandamanica
131
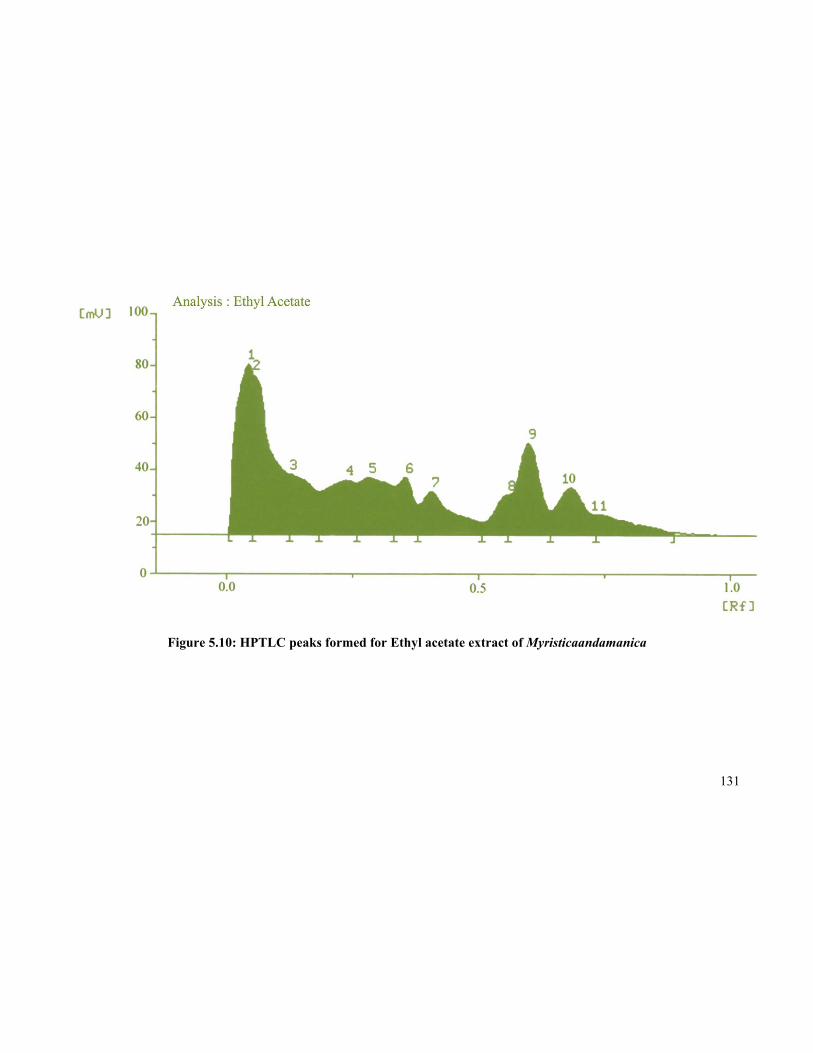
Figure 5.10: HPTLC peaks formed for Ethyl acetate extract of Myristicaandamanica
132
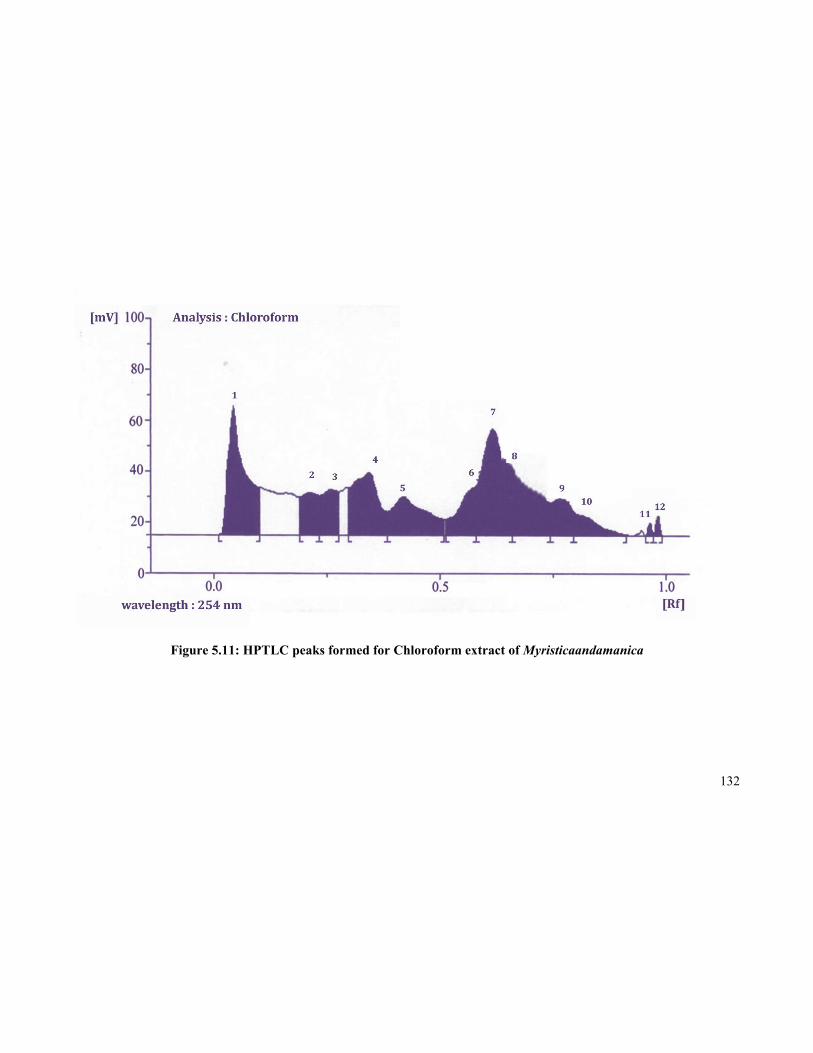
Figure 5.11: HPTLC peaks formed for Chloroform extract of Myristicaandamanica
133
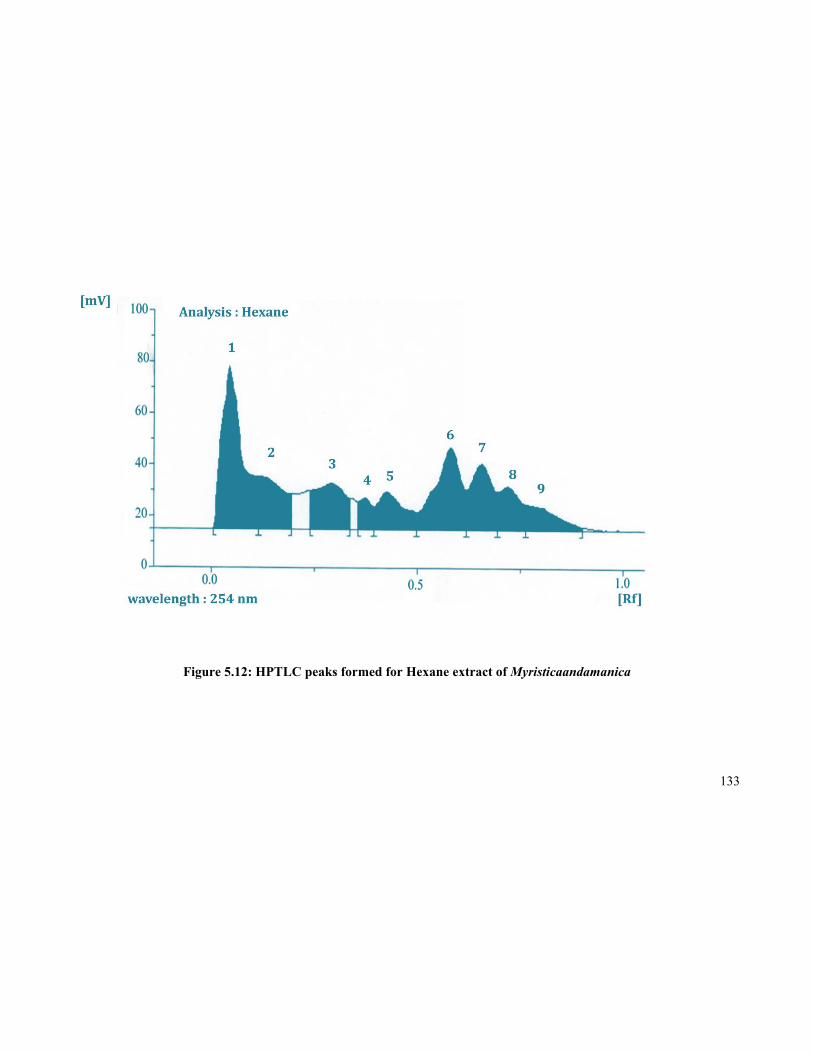
Figure 5.12: HPTLC peaks formed for Hexane extract of Myristicaandamanica
134
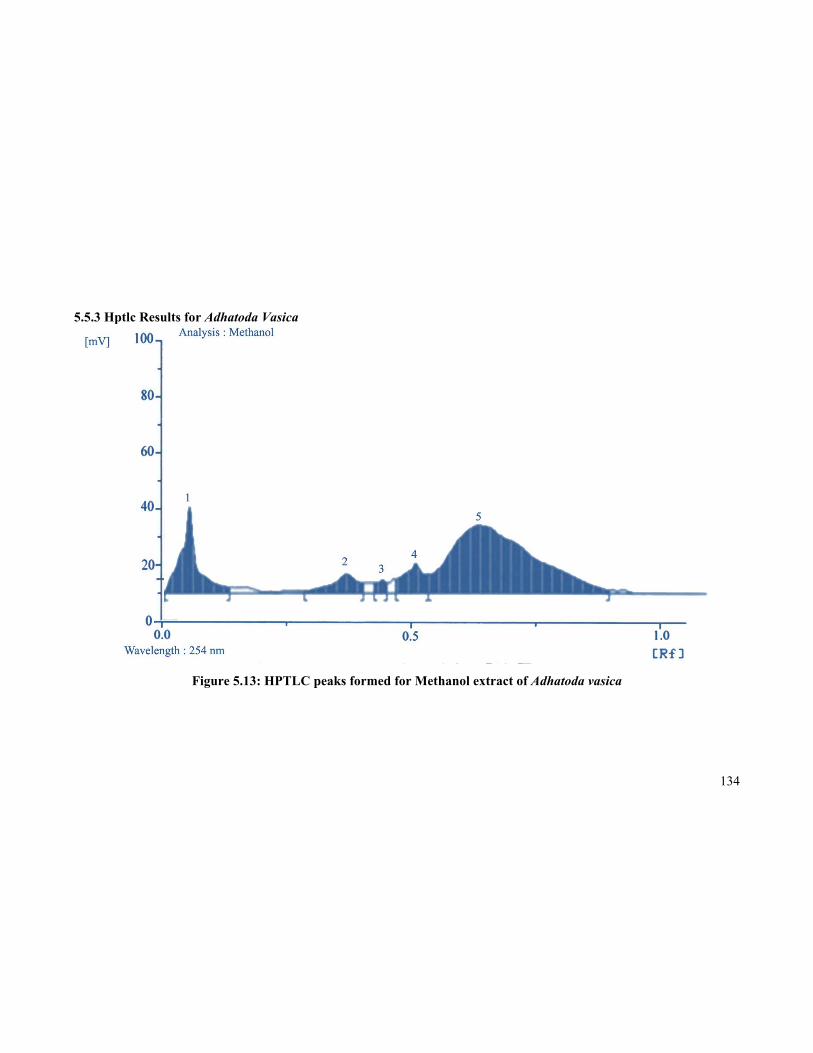
5.5.3 Hptlc Results for Adhatoda Vasica
Figure 5.13: HPTLC peaks formed for Methanol extract of Adhatoda vasica
135
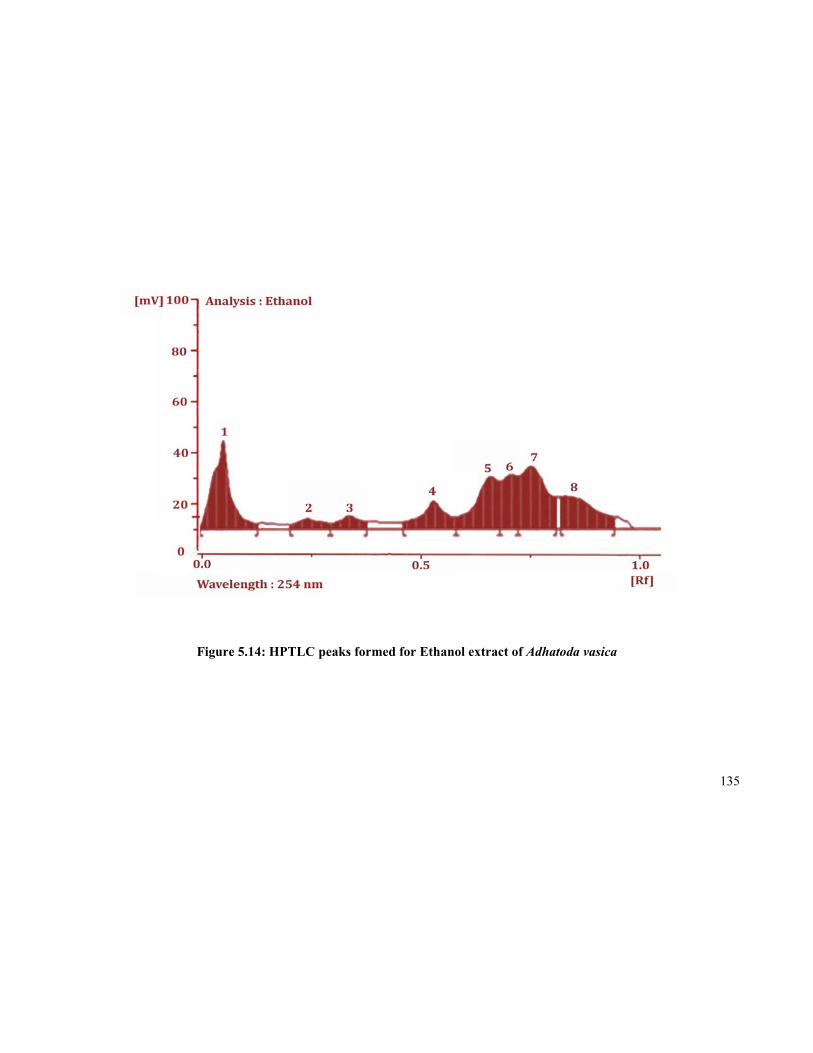
Figure 5.14: HPTLC peaks formed for Ethanol extract of Adhatoda vasica
136
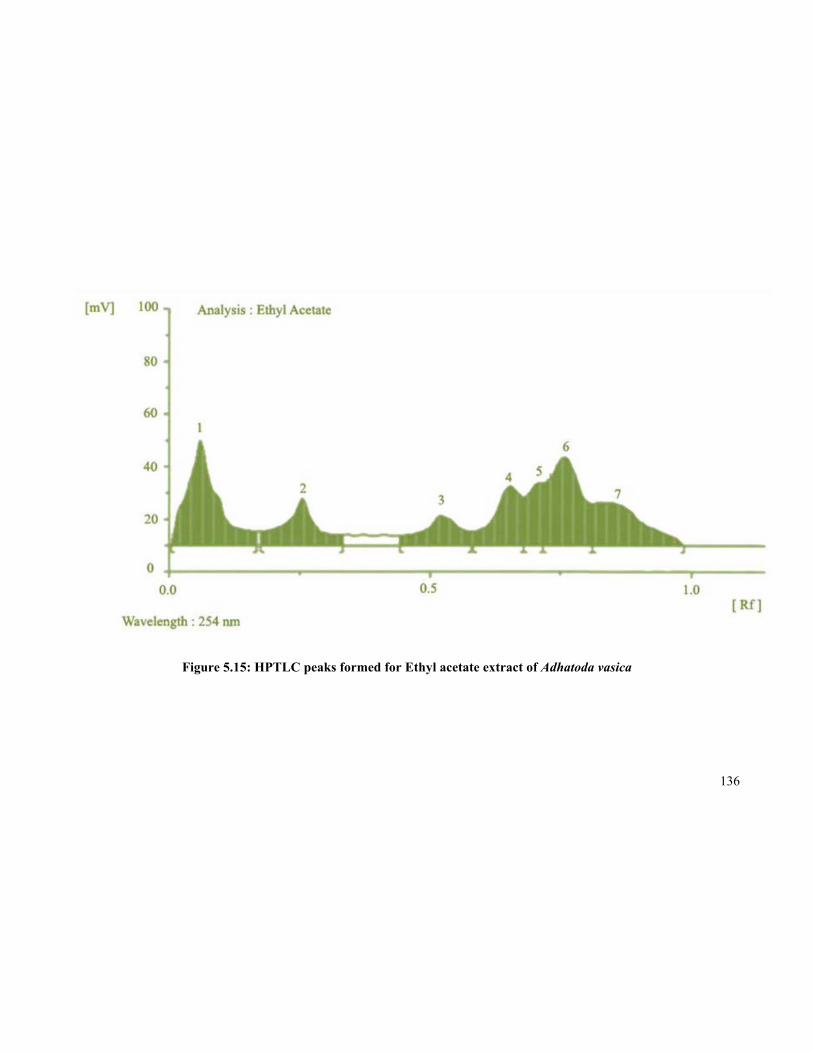
Figure 5.15: HPTLC peaks formed for Ethyl acetate extract of Adhatoda vasica
137
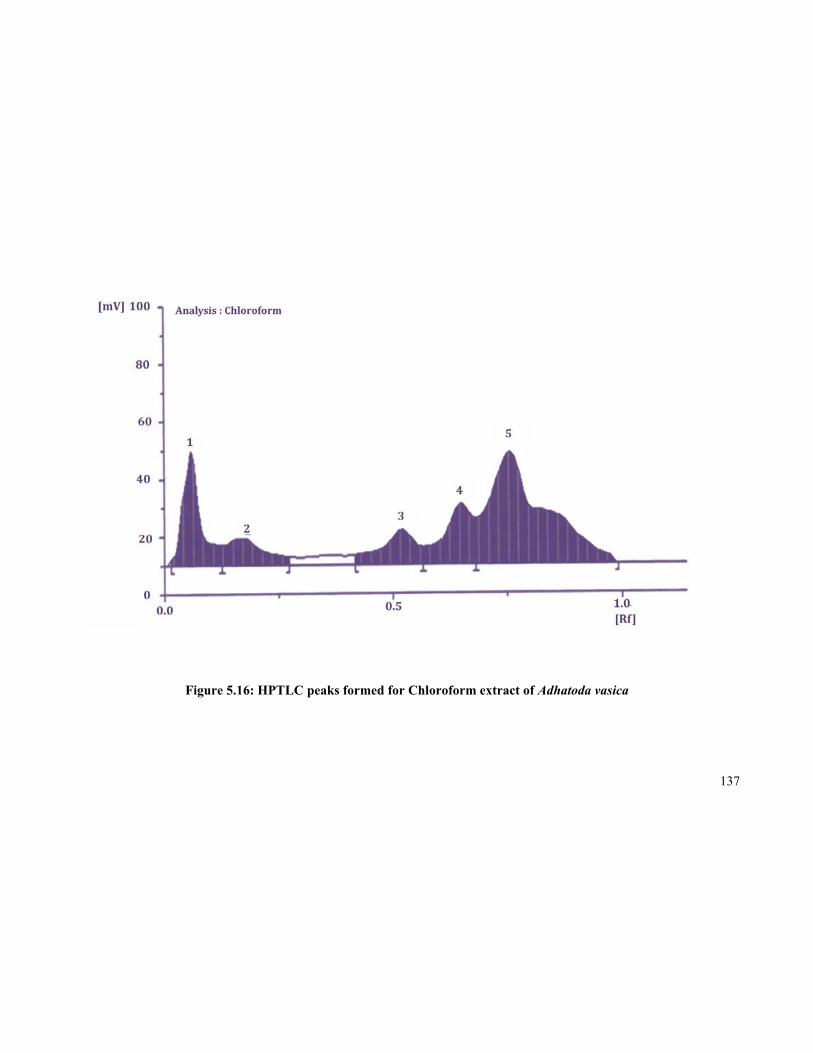
Figure 5.16: HPTLC peaks formed for Chloroform extract of Adhatoda vasica
138
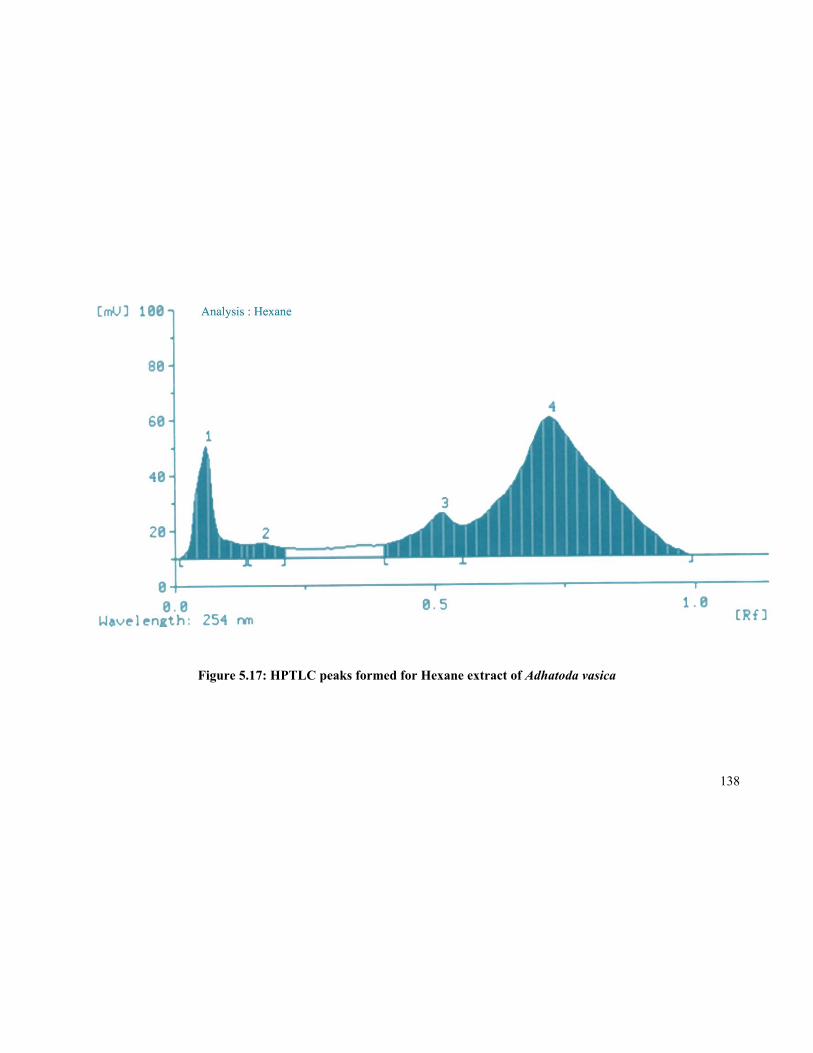
Figure 5.17: HPTLC peaks formed for Hexane extract of Adhatoda vasica
139
5.5.4 HPTLC Results for Azadirachta indica
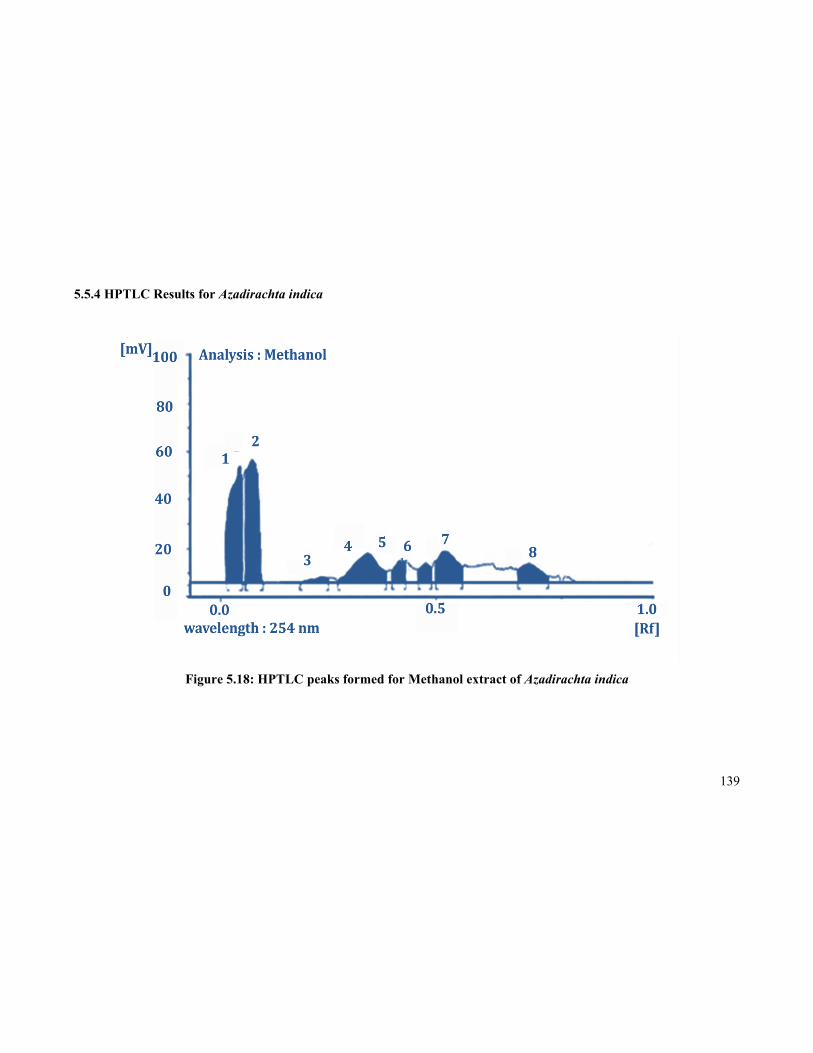
Figure 5.18: HPTLC peaks formed for Methanol extract of Azadirachta indica
140
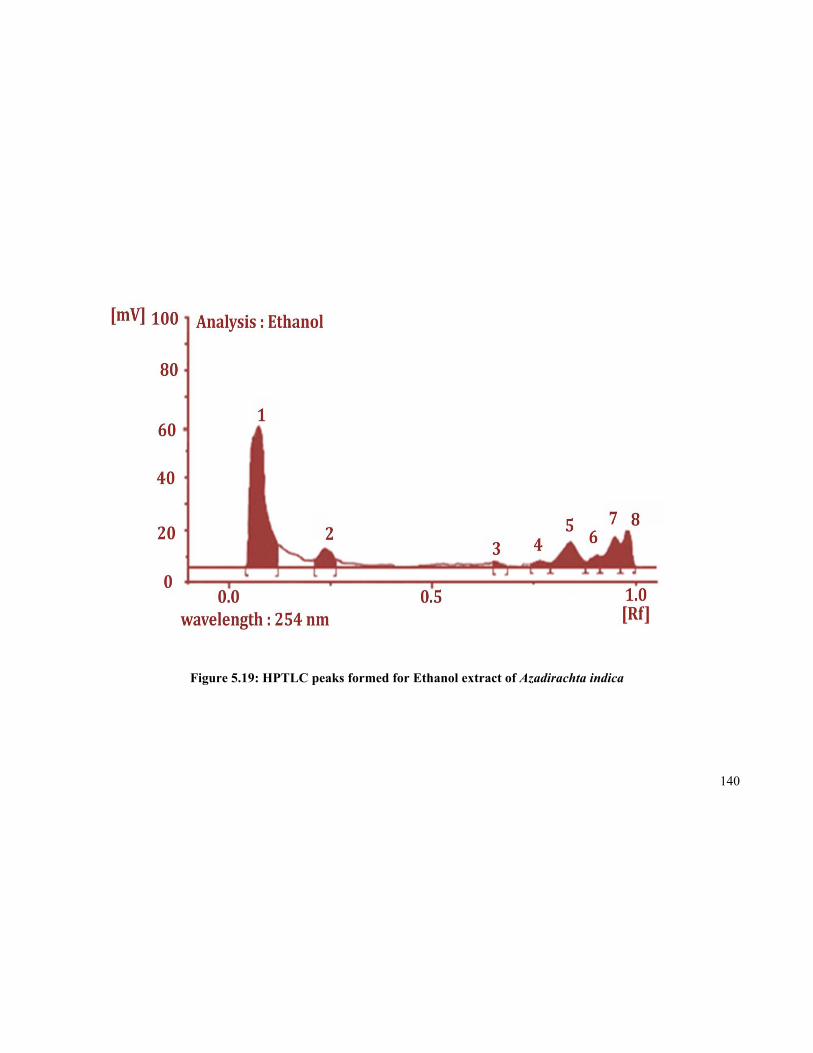
Figure 5.19: HPTLC peaks formed for Ethanol extract of Azadirachta indica
141
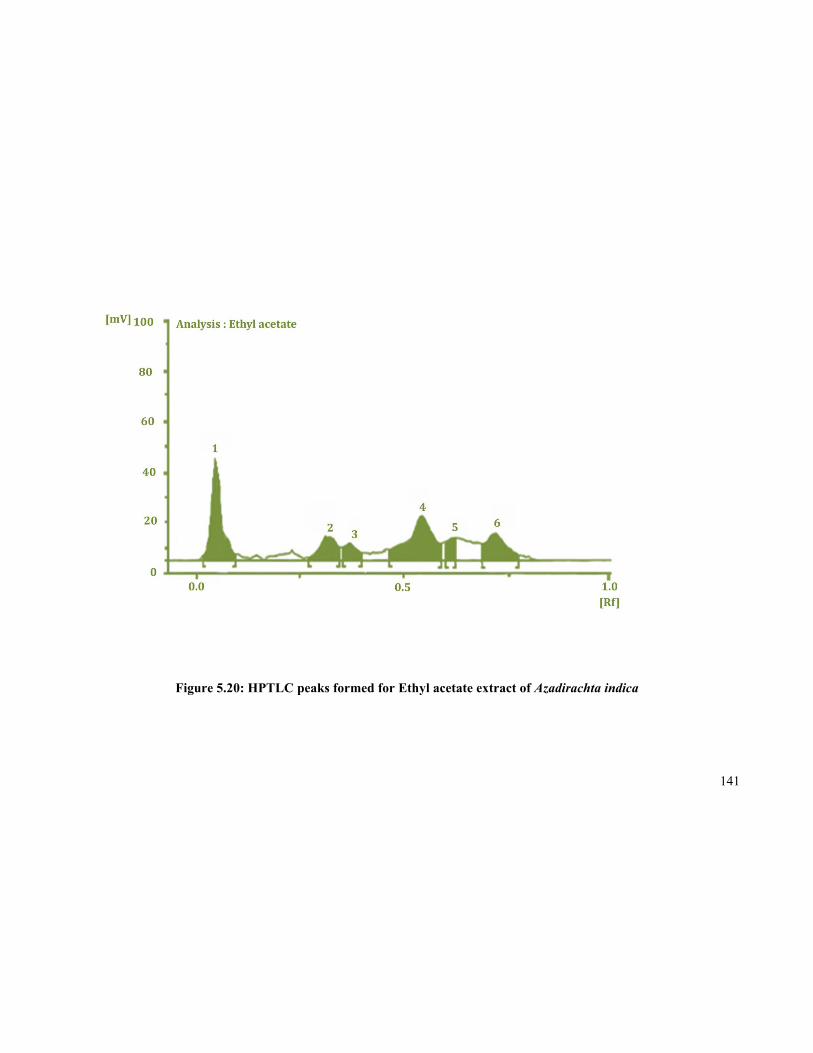
Figure 5.20: HPTLC peaks formed for Ethyl acetate extract of Azadirachta indica
142
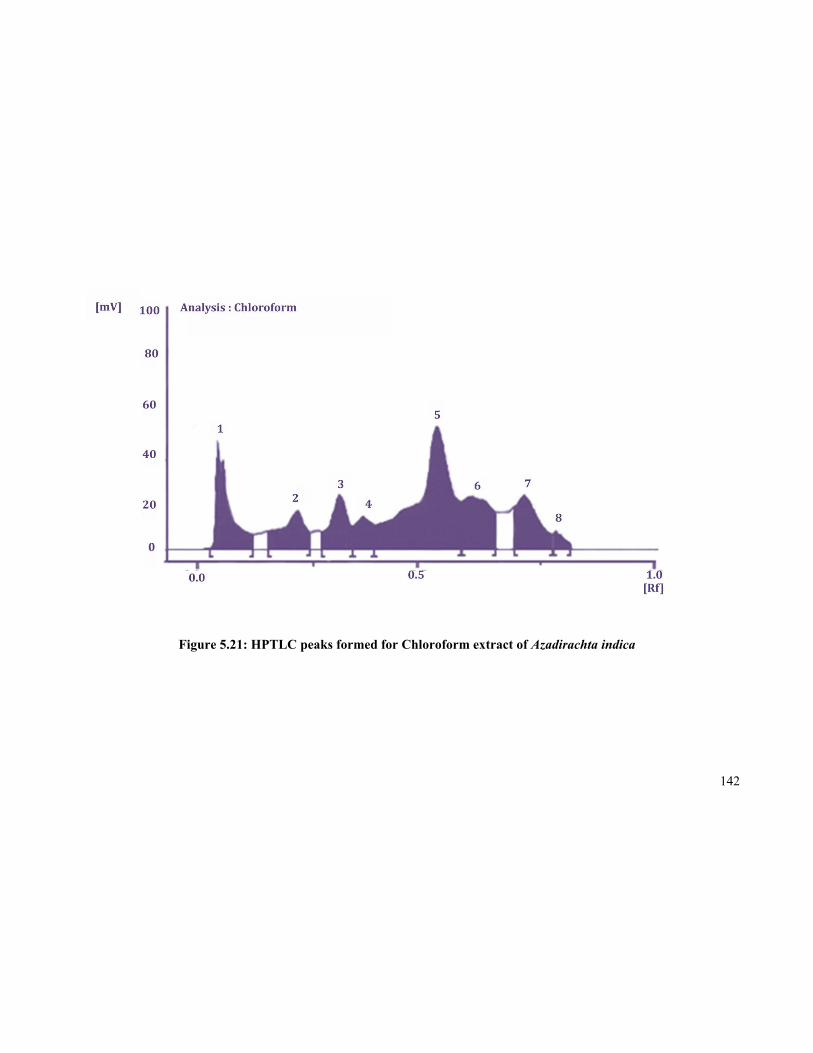
Figure 5.21: HPTLC peaks formed for Chloroform extract of Azadirachta indica
143
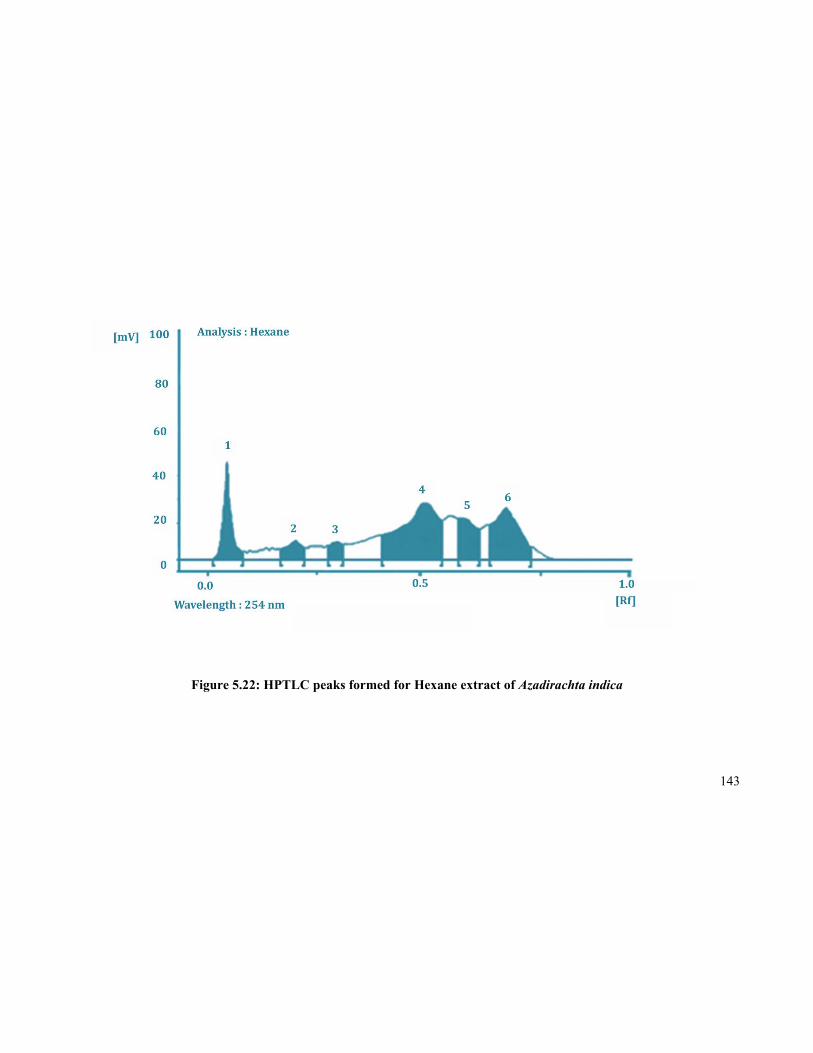
Figure 5.22: HPTLC peaks formed for Hexane extract of Azadirachta indica
144
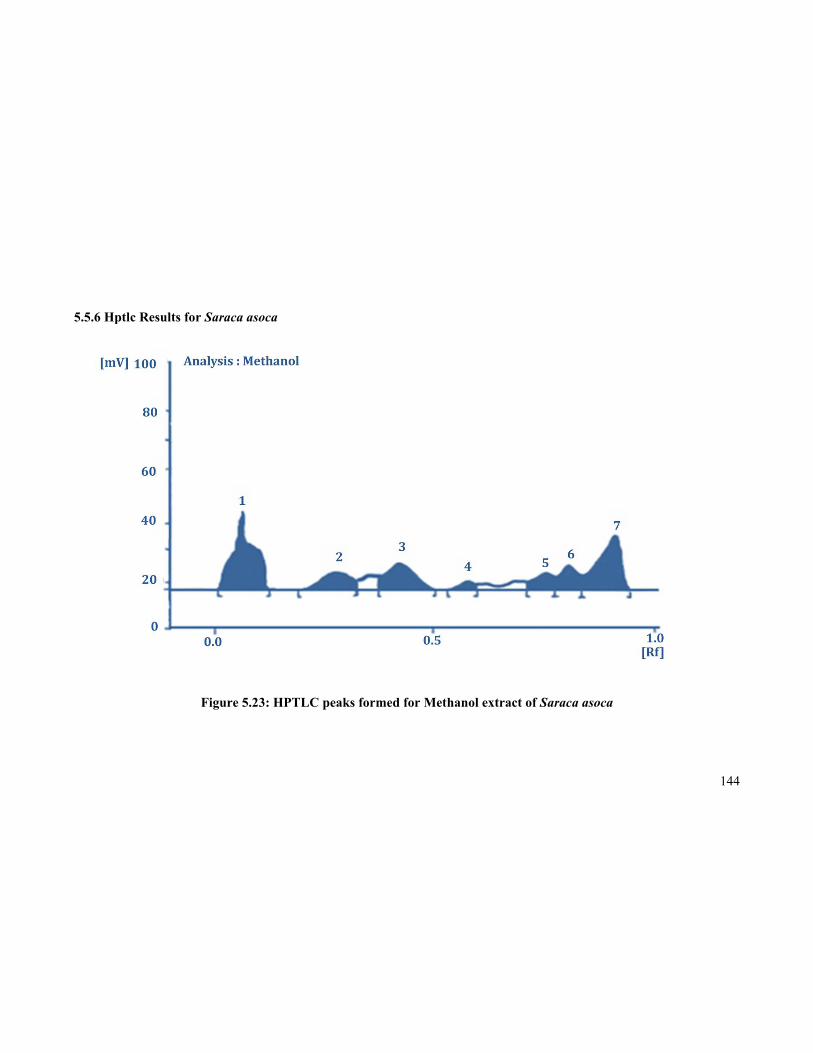
5.5.6 Hptlc Results for Saraca asoca
Figure 5.23: HPTLC peaks formed for Methanol extract of Saraca asoca
145
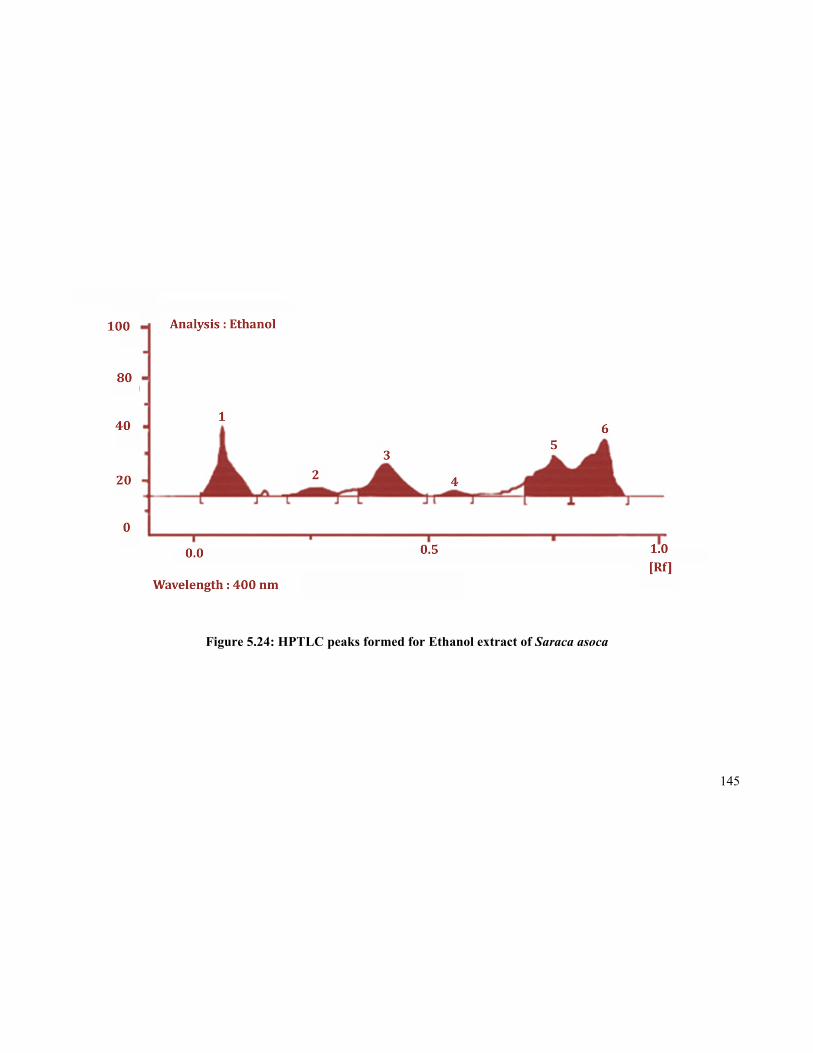
Figure 5.24: HPTLC peaks formed for Ethanol extract of Saraca asoca
146
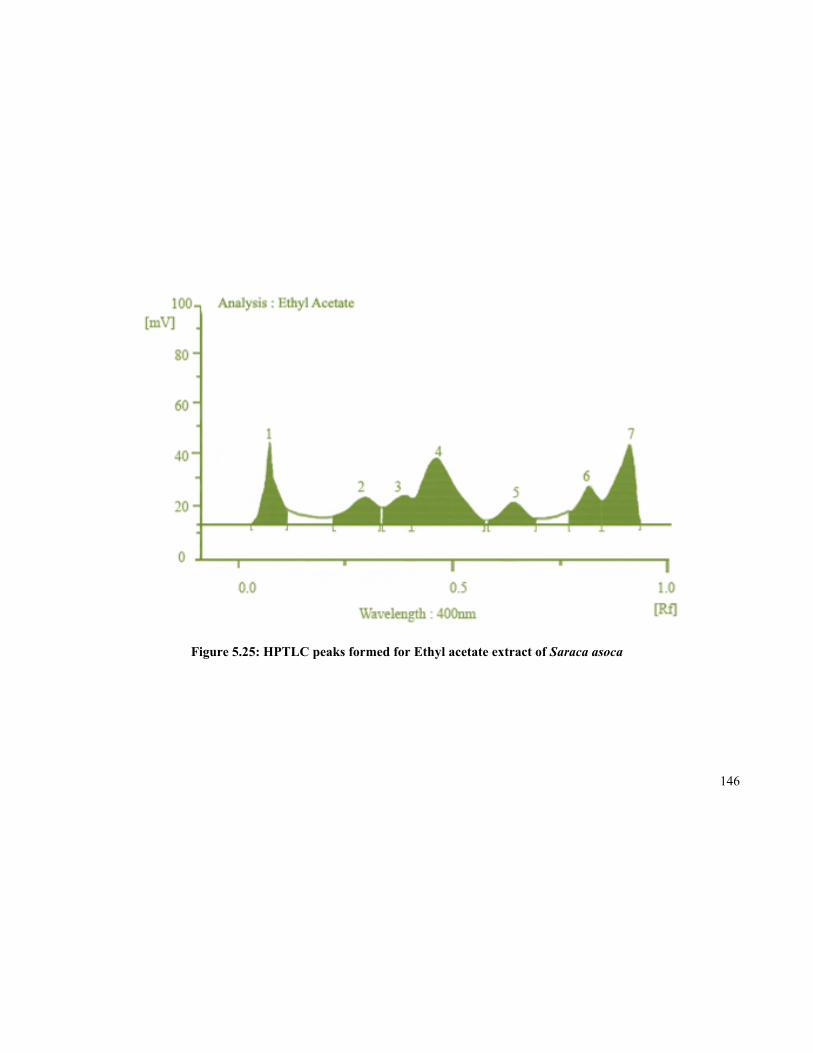
Figure 5.25: HPTLC peaks formed for Ethyl acetate extract of Saraca asoca

147
Figure 5.26: HPTLC peaks formed for Chloroform extract of Saraca asoca
148
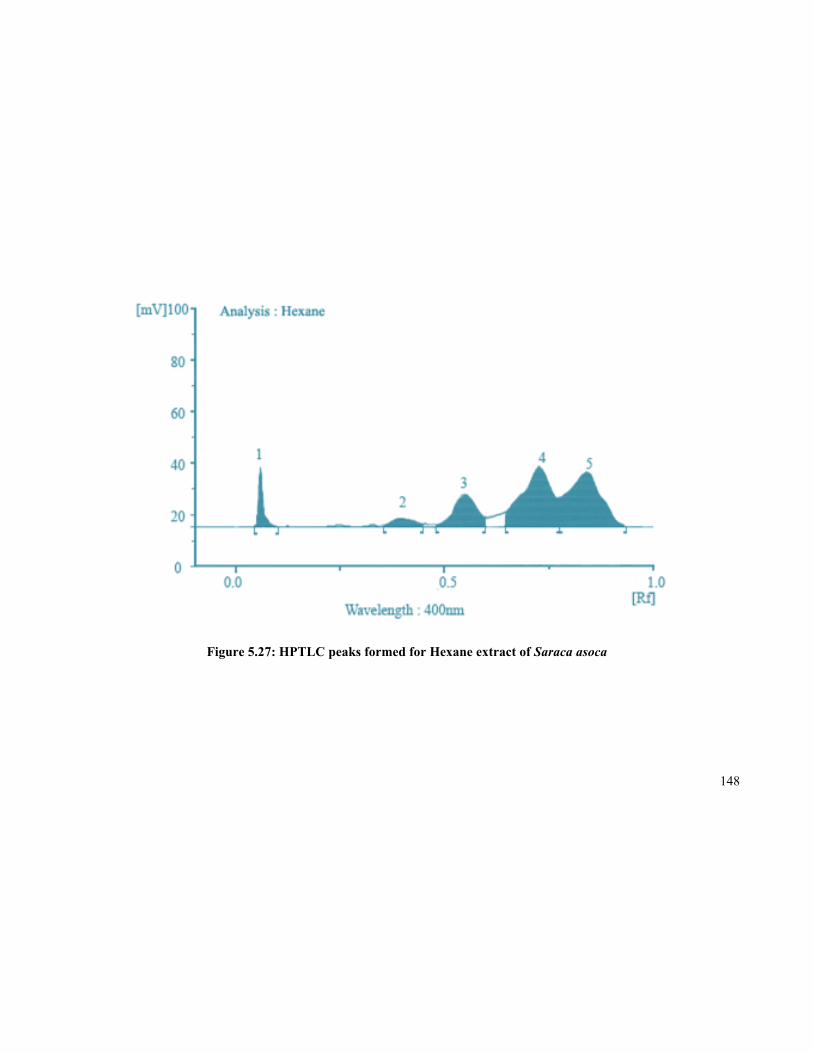
Figure 5.27: HPTLC peaks formed for Hexane extract of Saraca asoca
149
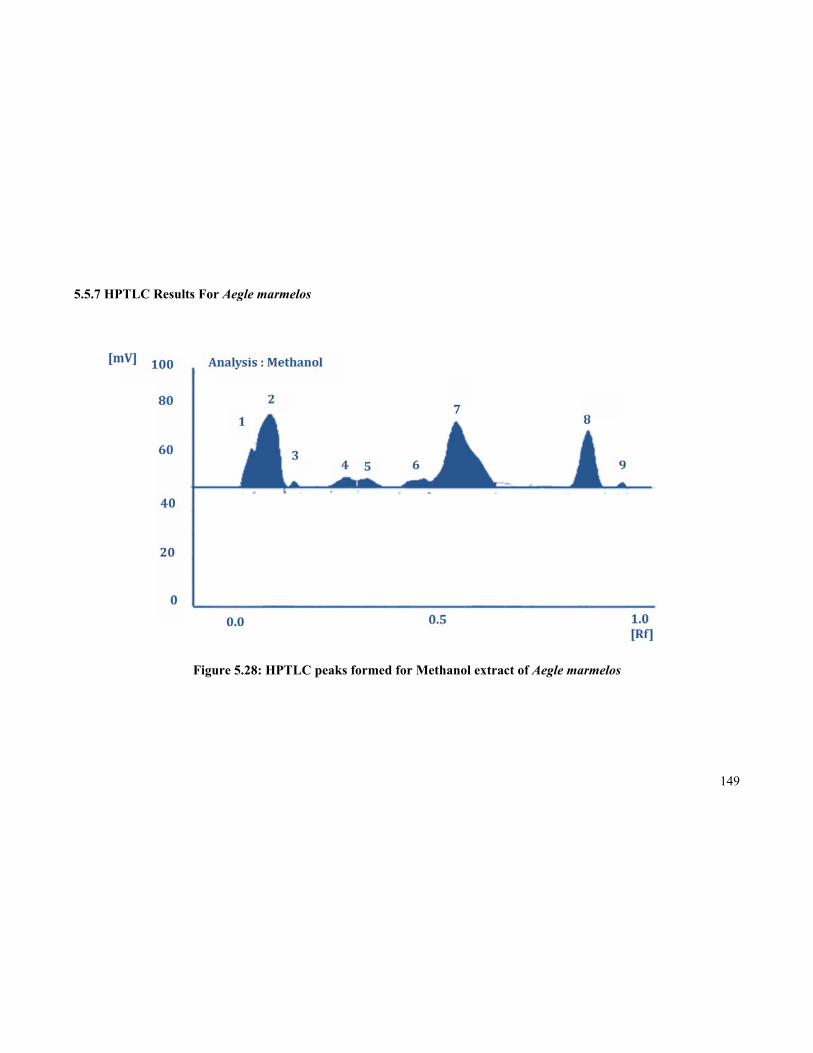
5.5.7 HPTLC Results For Aegle marmelos
Figure 5.28: HPTLC peaks formed for Methanol extract of Aegle marmelos
150
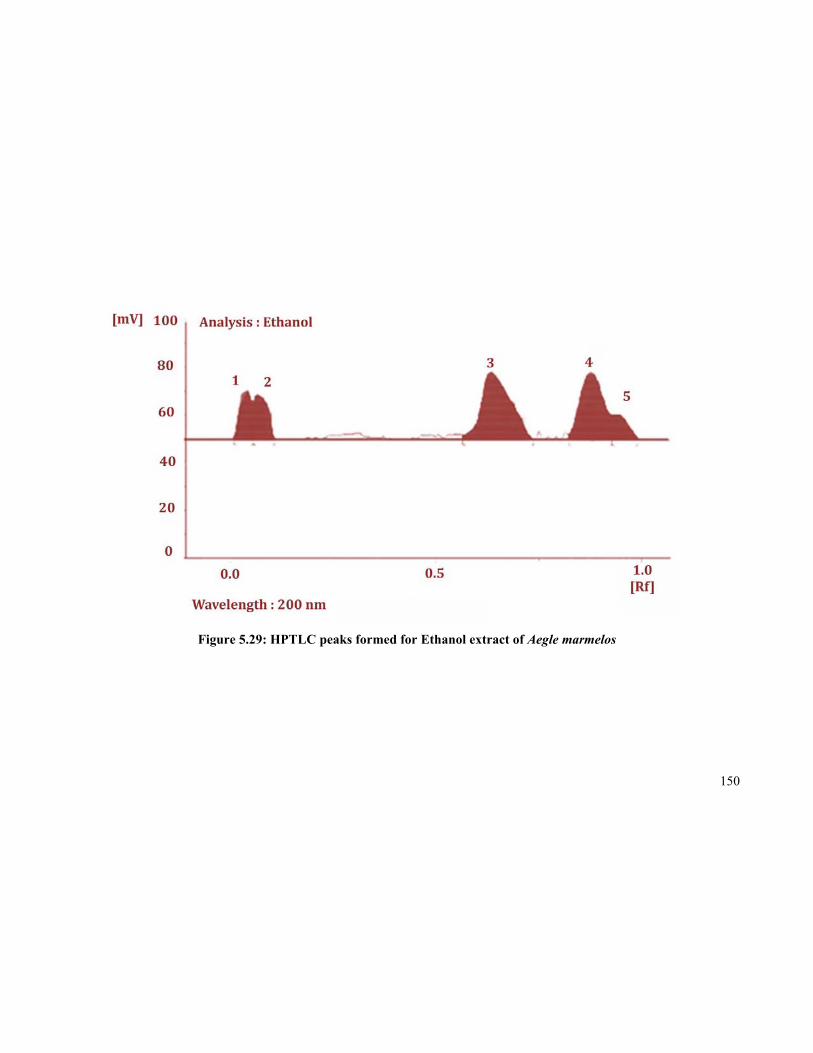
Figure 5.29: HPTLC peaks formed for Ethanol extract of Aegle marmelos

151
Figure 5.30: HPTLC peaks formed for Ethyl acetate extract of Aegle marmelos

152
Figure 5.31: HPTLC peaks formed for Chloroform extract of Aegle marmelos
153
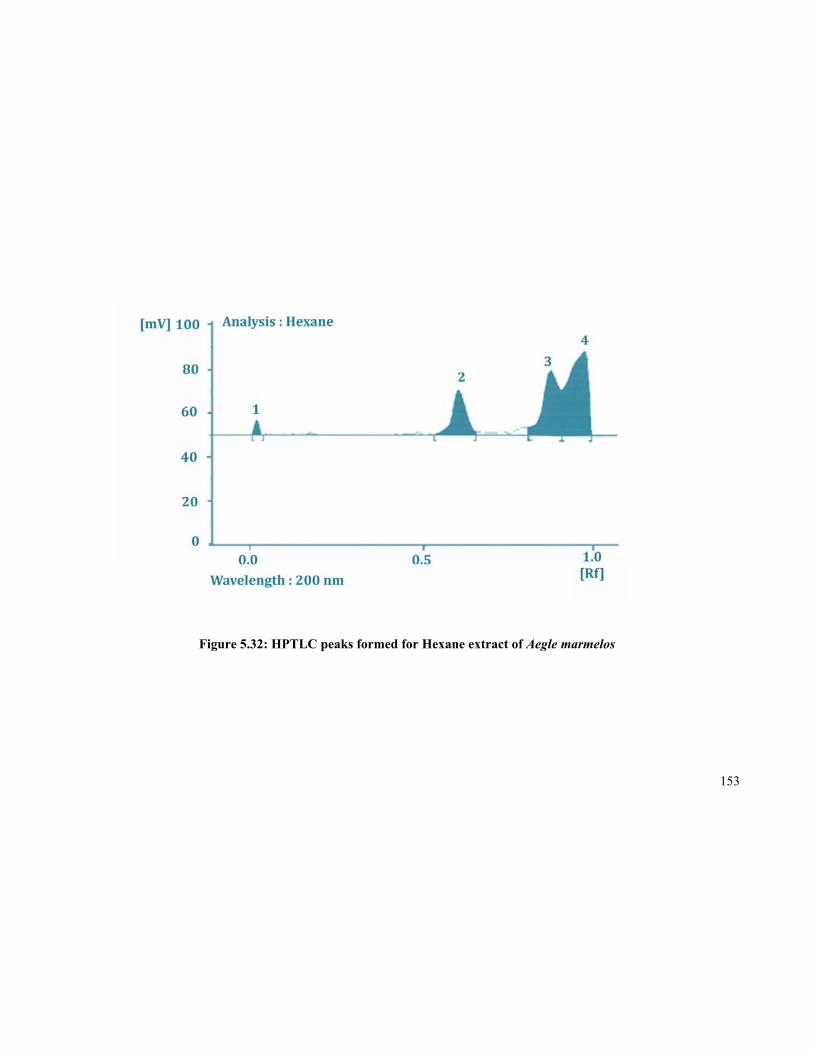
Figure 5.32: HPTLC peaks formed for Hexane extract of Aegle marmelos
154
The above HPTLC figures 5.3 – 5.32 of all the six plants studied showed
that the polyphenolic compound peak is the major peak in the methanolic extract
while other solvents like ethanol, ethyl acetate, chloroform and hexane showed
the fat soluble and other non-polar soluble compounds.
Many different methods have been established and are being carried out to
isolate and extractantioxidant compounds from the plant material. When choosing
an extractionmethod, the major priority must be to preserve the bioactive
compounds and extractmost if not all the desired compounds from the plant
material.
Antioxidants can be physically classified by their solubility into two
groups(i) hydrophilic antioxidants, such as the majority of polyphenolic
compounds andvitamin C and (ii) lipophilic antioxidants, mainly carotenoids and
vitamin E.
Since the methanolic extract of the six selected Indian medicinal plants
contains the polyphenolic compounds necessary for the antioxidant activities,
wound healing activities and antigenotoxic activities the Methanolic extract of the
six plants were further characterized for its wound healing and antigenotoxic
activities.
This concept has been clearly explained from the HPTLC results of the six
selected Indian medicinal plants. So the methanolic extract containing the most
desired bio active compounds from the plant material was used for our further
pharmacological activity studies.
155
5.5.8Reason for the Selection of the Methanol Extract for Gel Formulation
The methanolic extracts of Indigofera aspalathoides, Myristica
andamanica, Adhatoda vasica, Azadirachta indica, Saraca asoca and Aegle
marmelos were observed tocontain the maximum active ingredients as it is
evident from the figures 5.3, 5.8, 5.13, 5.18. 5.23. 5.28 of the HPTLC analysis.
Therefore, the bioactive compounds extracted by the methanolic extracts of
Indigofera aspalathoides, Myristica andamanica, Adhatoda vasica, Azadirachta
indica, Saraca asoca and Aegle marmelos were used in the treatment of wounds
on Swiss albino mice by excision wound models to verify the claim of traditional
medicine..
5.6 WOUND HEALING ACTIVITIES OF THE METHANOLIC EXTRACT
To study the effect of phytochemical activities of methanolic extracts from
the medicinal plants on wound healing was done bycreating wound on the dorsal
interscapular region of swiss albino mice by excising a predetermined area of
7mm x 7mm skin under ether anaesthesia (Suguna et al, 1996). Wounds were left
open and the medicine was applied topically twice a day (once in the morning and
once in the evening) to each mouse till the wound was completely healed for up
to twelve days. The progressive changes in wound area were monitored by a
camera every fourth day.
The wound area was measured and calculated on a daily basis . The
percentage of wound contractionwas monitored every day from the 0th day till
the 12th day. On the 12th day all the six mice under positivecontrol were healed,
whereas, in the mice under negativecontrol, the healing is delayed. The wound
healing activity is similar to the case of mice under treatment group(Figure 8).
The size of the wound was also measured using a scale daily and the wound area
156
was calculated. Wound contraction was calculated as percentage of the reduction
in wound area (Table 5.12 & 5.13).
The preliminary phytochemical investigation of the leafextract showed the
presence of tannins, triterpenes andalkaloids. Any one of the observed
phytochemical constituents present in the medicinal plant extractmay be
responsible for the wound healing activities. Studies have shown
thatphytochemical constituents like flavonoids [300](Tsuchiya etal., 1996) and
triterpenoids [301](Scortichini and Pia, 1991)are known to promote the wound
healing process mainlydue to their astringent and antimicrobial properties
whichappear to be responsible for the wound healing andincreased rate of
epithelialisation [300](Tsuchiya et al., 1996).
157
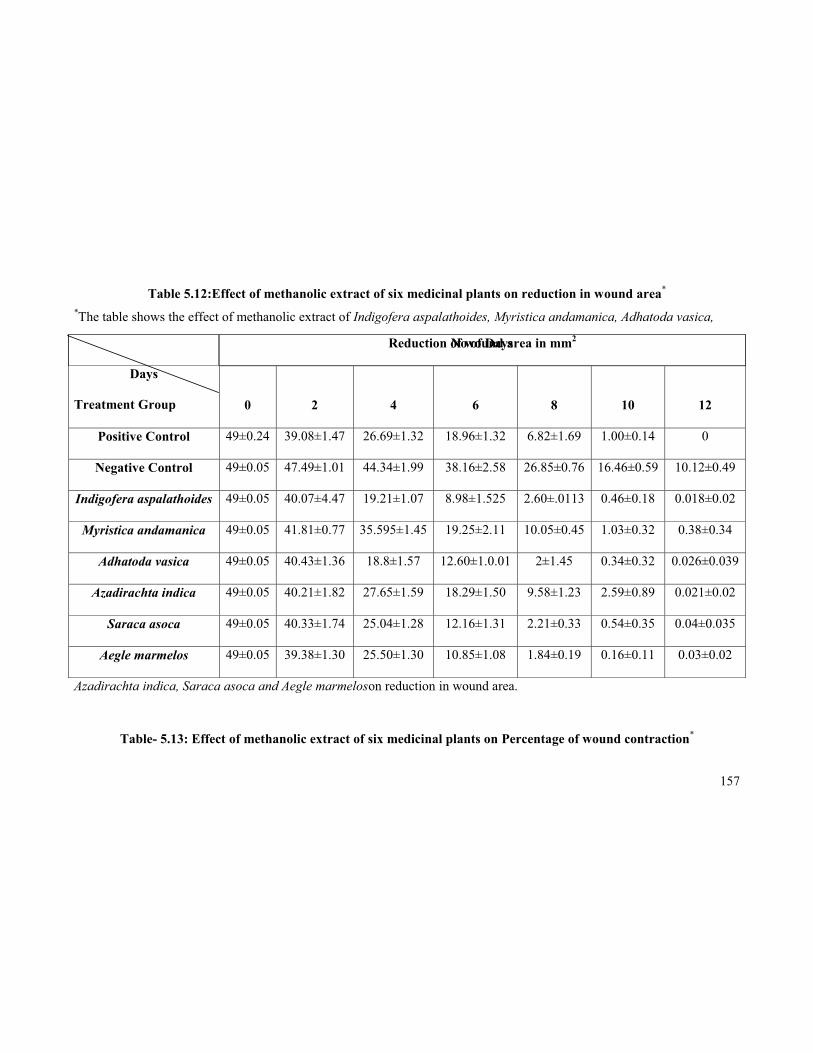
Table 5.12:Effect of methanolic extract of six medicinal plants on reduction in wound area*
*The table shows the effect of methanolic extract of Indigofera aspalathoides, Myristica andamanica, Adhatoda vasica,
Azadirachta indica, Saraca asoca and Aegle marmeloson reduction in wound area.
Table- 5.13: Effect of methanolic extract of six medicinal plants on Percentage of wound contraction*
Days
Treatment Group
Reduction of wound area in mm2
0 2 4 6 8 10 12
Positive Control 49±0.24 39.08±1.47 26.69±1.32 18.96±1.32 6.82±1.69 1.00±0.14 0
Negative Control 49±0.05 47.49±1.01 44.34±1.99 38.16±2.58 26.85±0.76 16.46±0.59 10.12±0.49
Indigofera aspalathoides 49±0.05 40.07±4.47 19.21±1.07 8.98±1.525 2.60±.0113 0.46±0.18 0.018±0.02
Myristica andamanica 49±0.05 41.81±0.77 35.595±1.45 19.25±2.11 10.05±0.45 1.03±0.32 0.38±0.34
Adhatoda vasica 49±0.05 40.43±1.36 18.8±1.57 12.60±1.0.01 2±1.45 0.34±0.32 0.026±0.039
Azadirachta indica 49±0.05 40.21±1.82 27.65±1.59 18.29±1.50 9.58±1.23 2.59±0.89 0.021±0.02
Saraca asoca 49±0.05 40.33±1.74 25.04±1.28 12.16±1.31 2.21±0.33 0.54±0.35 0.04±0.035
Aegle marmelos 49±0.05 39.38±1.30 25.50±1.30 10.85±1.08 1.84±0.19 0.16±0.11 0.03±0.02
No of Days
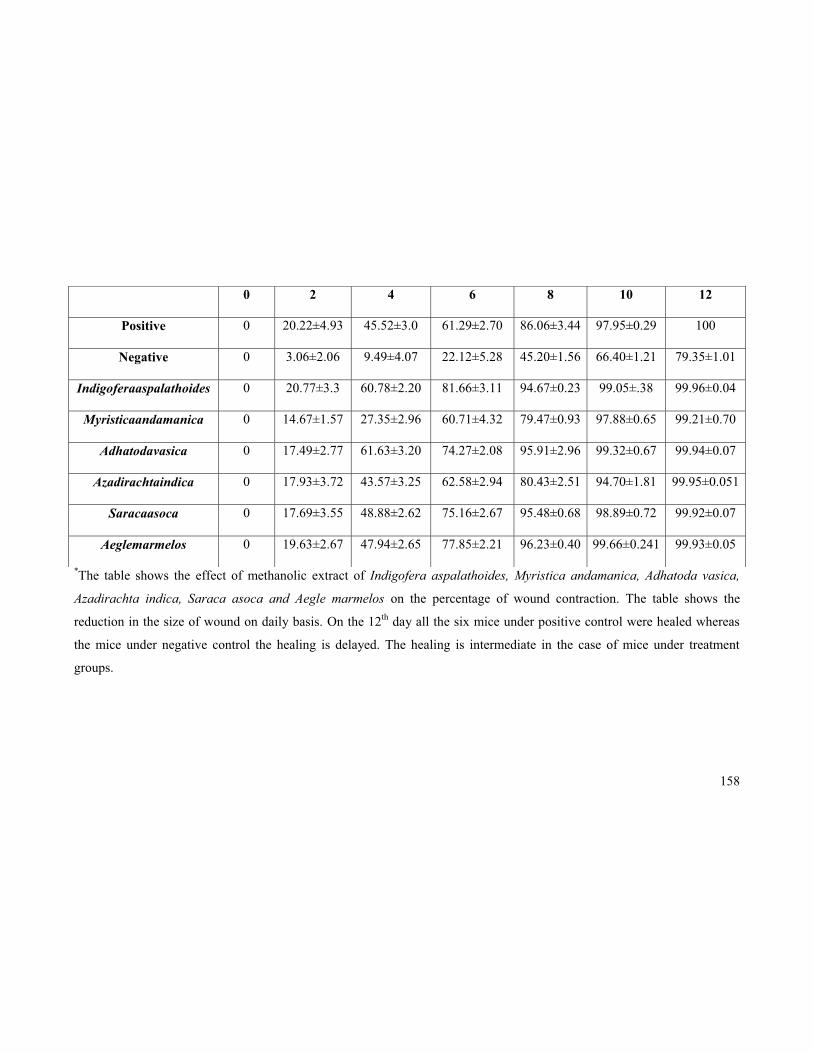
158
*The table shows the effect of methanolic extract of Indigofera aspalathoides, Myristica andamanica, Adhatoda vasica,
Azadirachta indica, Saraca asoca and Aegle marmelos on the percentage of wound contraction. The table shows the
reduction in the size of wound on daily basis. On the 12th day all the six mice under positive control were healed whereas
the mice under negative control the healing is delayed. The healing is intermediate in the case of mice under treatment
groups.
0 2 4 6 8 10 12
Positive 0 20.22±4.93 45.52±3.0 61.29±2.70 86.06±3.44 97.95±0.29 100
Negative 0 3.06±2.06 9.49±4.07 22.12±5.28 45.20±1.56 66.40±1.21 79.35±1.01
Indigoferaaspalathoides 0 20.77±3.3 60.78±2.20 81.66±3.11 94.67±0.23 99.05±.38 99.96±0.04
Myristicaandamanica 0 14.67±1.57 27.35±2.96 60.71±4.32 79.47±0.93 97.88±0.65 99.21±0.70
Adhatodavasica 0 17.49±2.77 61.63±3.20 74.27±2.08 95.91±2.96 99.32±0.67 99.94±0.07
Azadirachtaindica 0 17.93±3.72 43.57±3.25 62.58±2.94 80.43±2.51 94.70±1.81 99.95±0.051
Saracaasoca 0 17.69±3.55 48.88±2.62 75.16±2.67 95.48±0.68 98.89±0.72 99.92±0.07
Aeglemarmelos 0 19.63±2.67 47.94±2.65 77.85±2.21 96.23±0.40 99.66±0.241 99.93±0.05
159
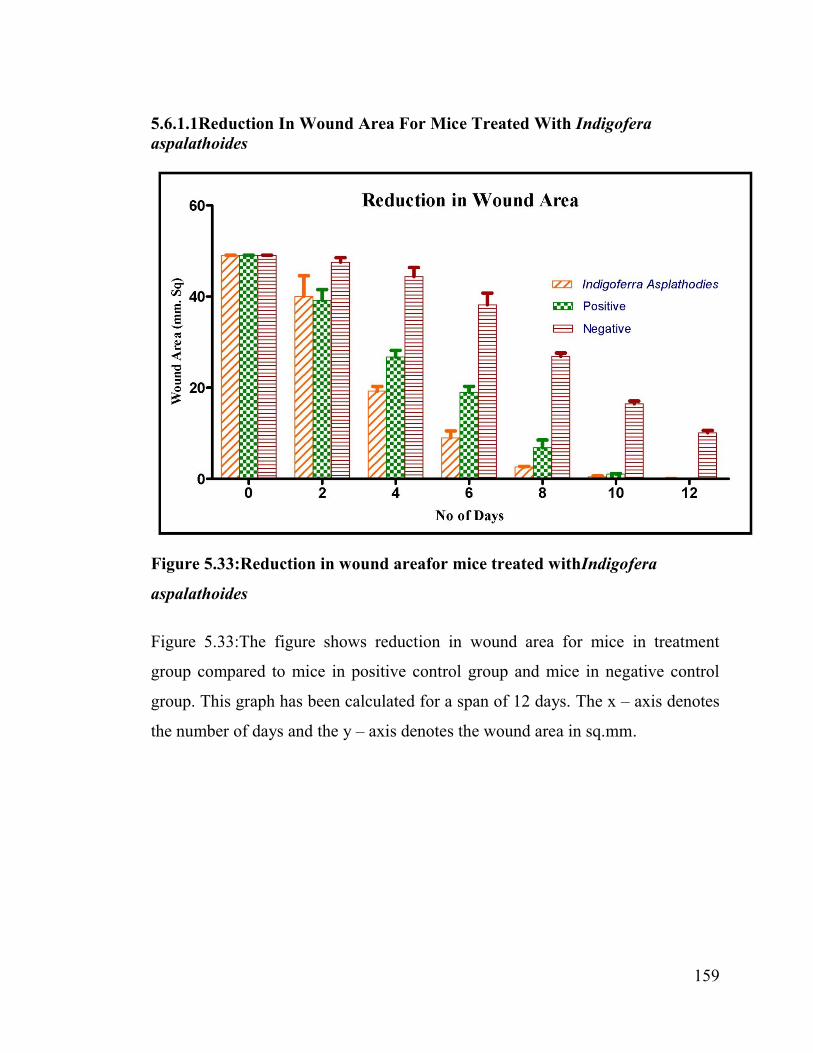
5.6.1.1Reduction In Wound Area For Mice Treated With Indigofera aspalathoides
Figure 5.33:Reduction in wound areafor mice treated withIndigofera
aspalathoides
Figure 5.33:The figure shows reduction in wound area for mice in treatment
group compared to mice in positive control group and mice in negative control
group. This graph has been calculated for a span of 12 days. The x – axis denotes
the number of days and the y – axis denotes the wound area in sq.mm.
160
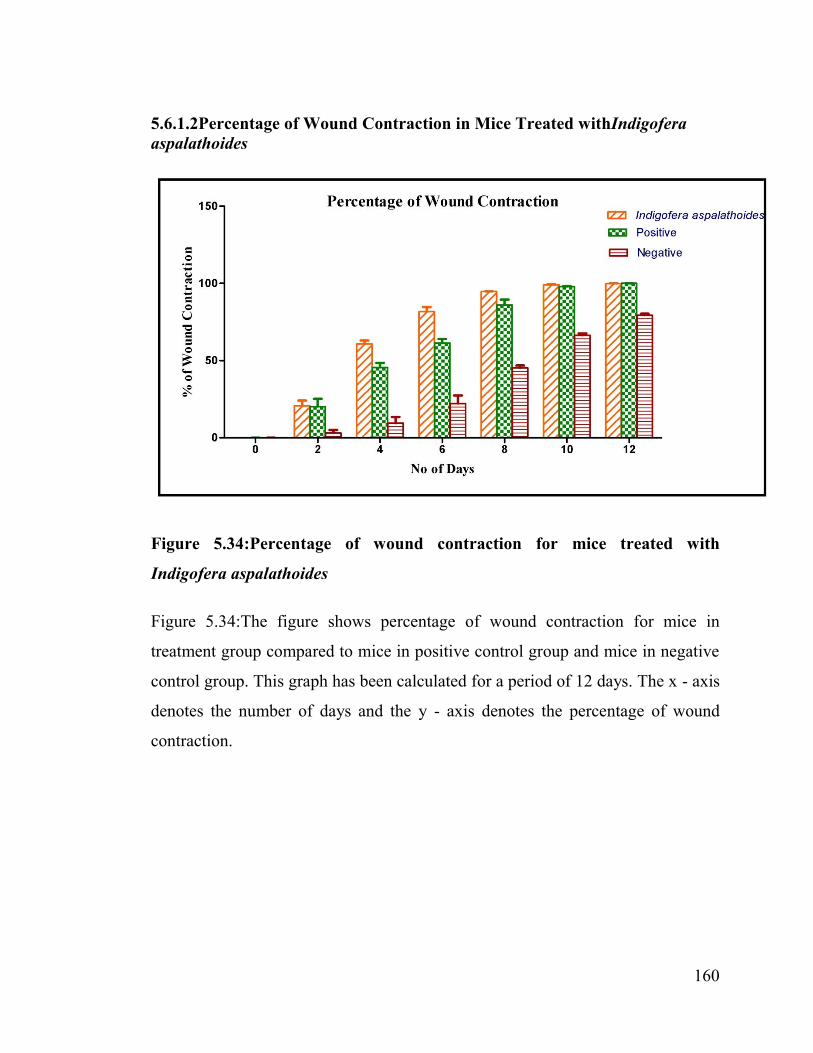
5.6.1.2Percentage of Wound Contraction in Mice Treated withIndigoferaaspalathoides
Figure 5.34:Percentage of wound contraction for mice treated with
Indigofera aspalathoides
Figure 5.34:The figure shows percentage of wound contraction for mice in
treatment group compared to mice in positive control group and mice in negative
control group. This graph has been calculated for a period of 12 days. The x - axis
denotes the number of days and the y - axis denotes the percentage of wound
contraction.
161
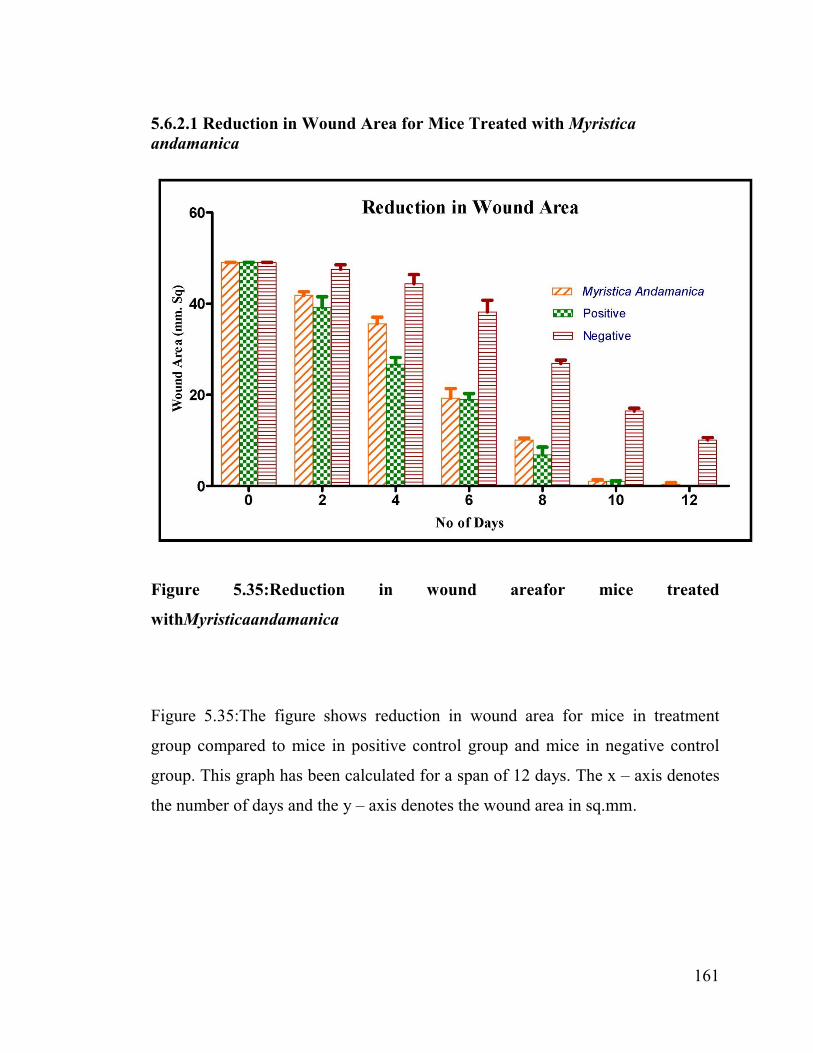
5.6.2.1 Reduction in Wound Area for Mice Treated with Myristica andamanica
Figure 5.35:Reduction in wound areafor mice treated
withMyristicaandamanica
Figure 5.35:The figure shows reduction in wound area for mice in treatment
group compared to mice in positive control group and mice in negative control
group. This graph has been calculated for a span of 12 days. The x – axis denotes
the number of days and the y – axis denotes the wound area in sq.mm.
162
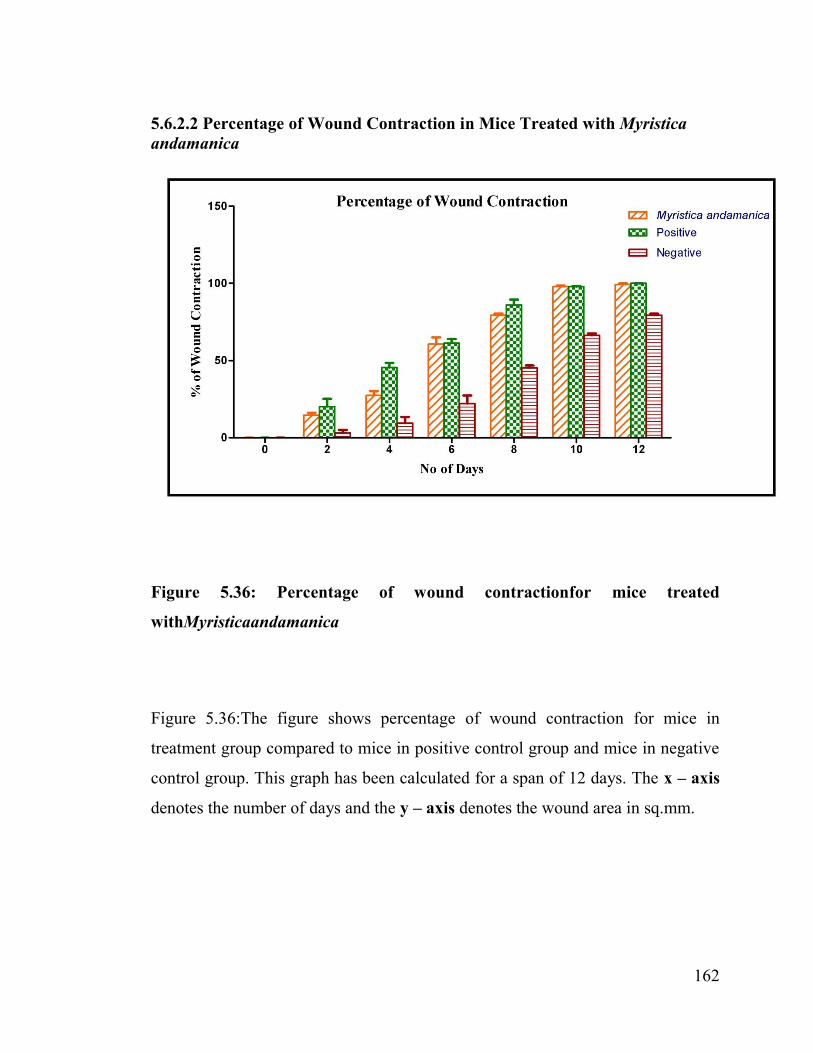
5.6.2.2 Percentage of Wound Contraction in Mice Treated with Myristicaandamanica
Figure 5.36: Percentage of wound contractionfor mice treated
withMyristicaandamanica
Figure 5.36:The figure shows percentage of wound contraction for mice in
treatment group compared to mice in positive control group and mice in negative
control group. This graph has been calculated for a span of 12 days. The x – axis
denotes the number of days and the y – axis denotes the wound area in sq.mm.
163
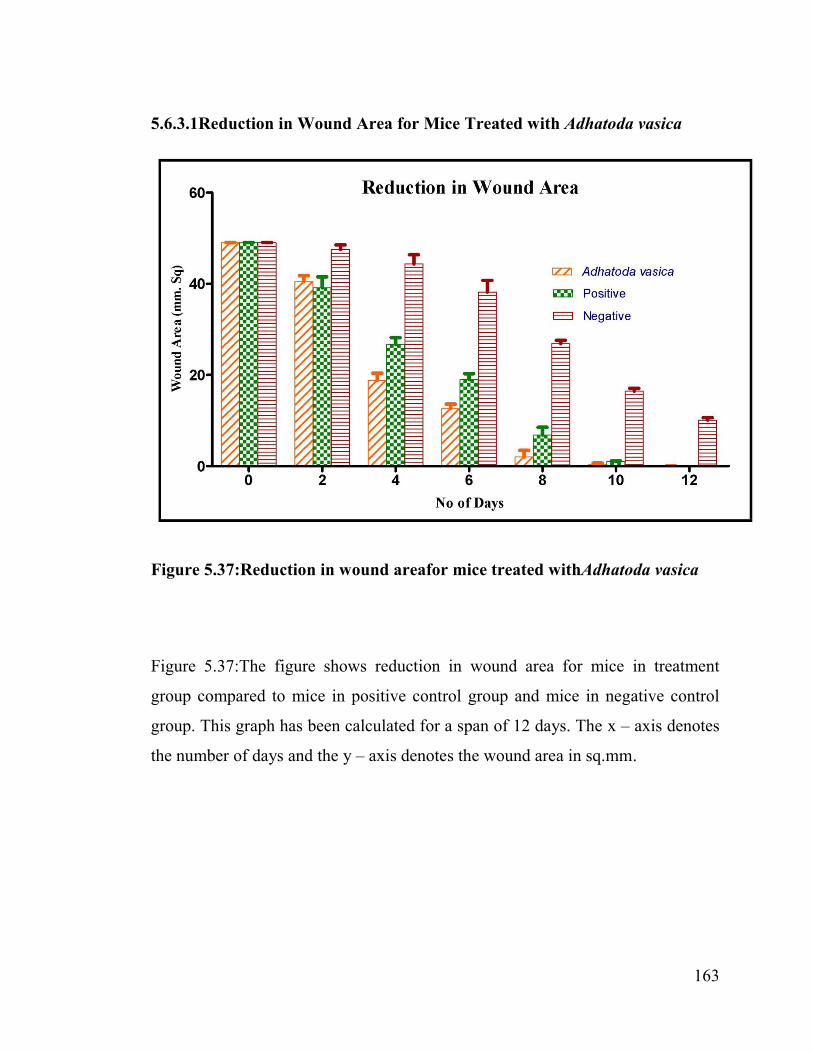
5.6.3.1Reduction in Wound Area for Mice Treated with Adhatoda vasica
Figure 5.37:Reduction in wound areafor mice treated withAdhatoda vasica
Figure 5.37:The figure shows reduction in wound area for mice in treatment
group compared to mice in positive control group and mice in negative control
group. This graph has been calculated for a span of 12 days. The x – axis denotes
the number of days and the y – axis denotes the wound area in sq.mm.
164
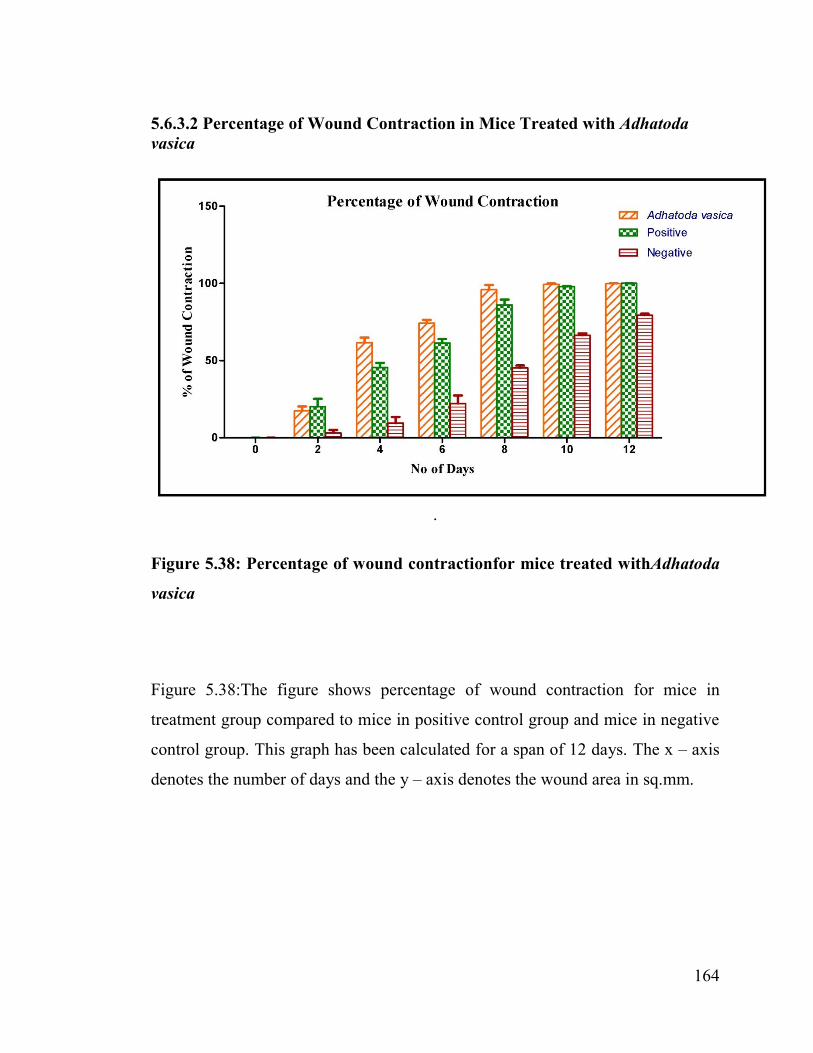
5.6.3.2 Percentage of Wound Contraction in Mice Treated with Adhatoda vasica
.
Figure 5.38: Percentage of wound contractionfor mice treated withAdhatoda
vasica
Figure 5.38:The figure shows percentage of wound contraction for mice in
treatment group compared to mice in positive control group and mice in negative
control group. This graph has been calculated for a span of 12 days. The x – axis
denotes the number of days and the y – axis denotes the wound area in sq.mm.
165
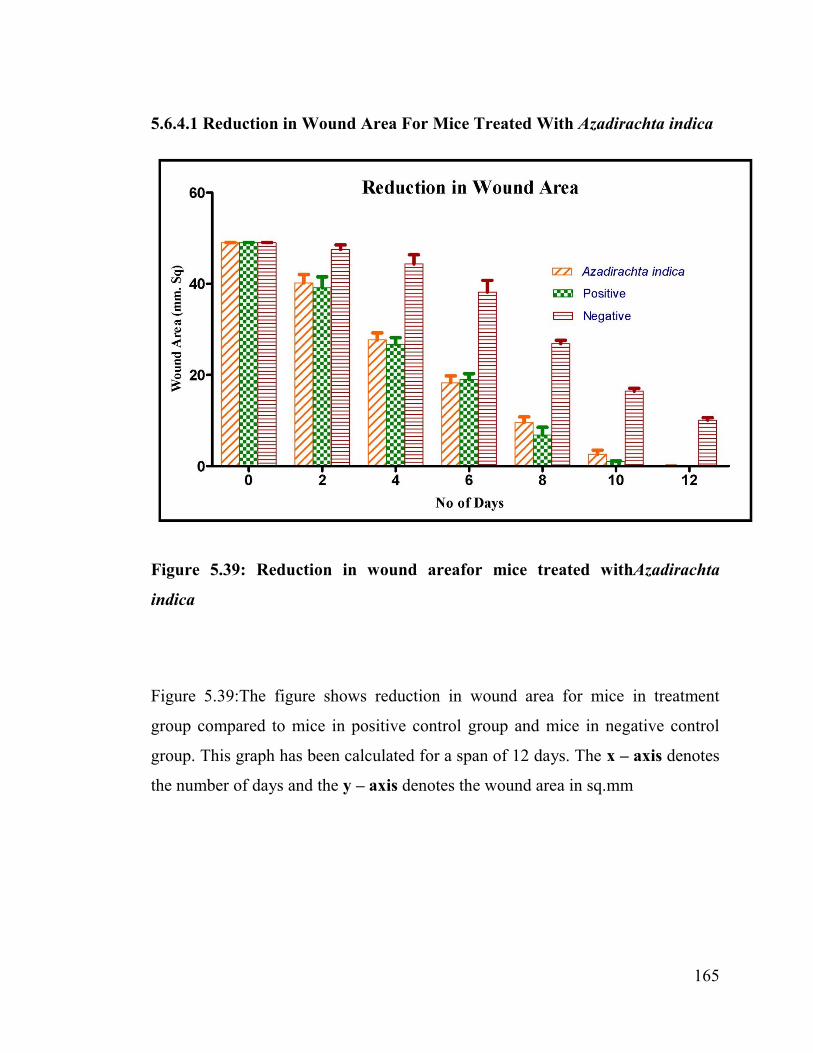
5.6.4.1 Reduction in Wound Area For Mice Treated With Azadirachta indica
Figure 5.39: Reduction in wound areafor mice treated withAzadirachta
indica
Figure 5.39:The figure shows reduction in wound area for mice in treatment
group compared to mice in positive control group and mice in negative control
group. This graph has been calculated for a span of 12 days. The x – axis denotes
the number of days and the y – axis denotes the wound area in sq.mm
166
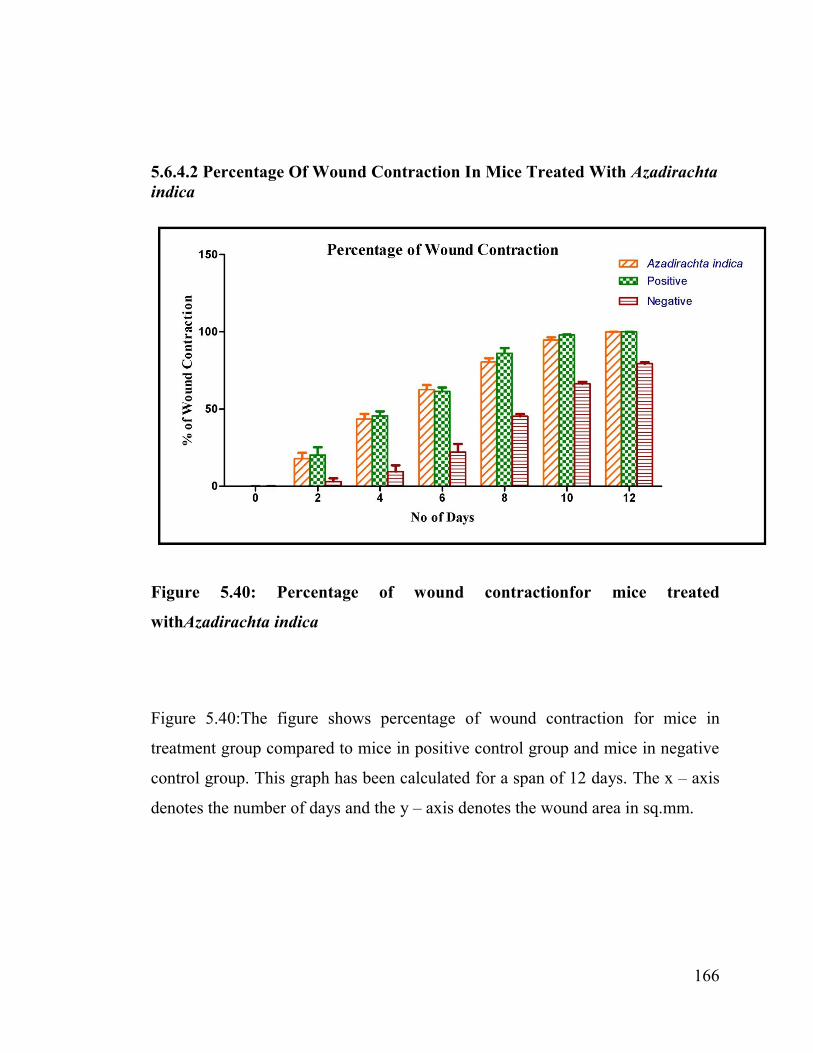
5.6.4.2 Percentage Of Wound Contraction In Mice Treated With Azadirachta indica
Figure 5.40: Percentage of wound contractionfor mice treated
withAzadirachta indica
Figure 5.40:The figure shows percentage of wound contraction for mice in
treatment group compared to mice in positive control group and mice in negative
control group. This graph has been calculated for a span of 12 days. The x – axis
denotes the number of days and the y – axis denotes the wound area in sq.mm.
167
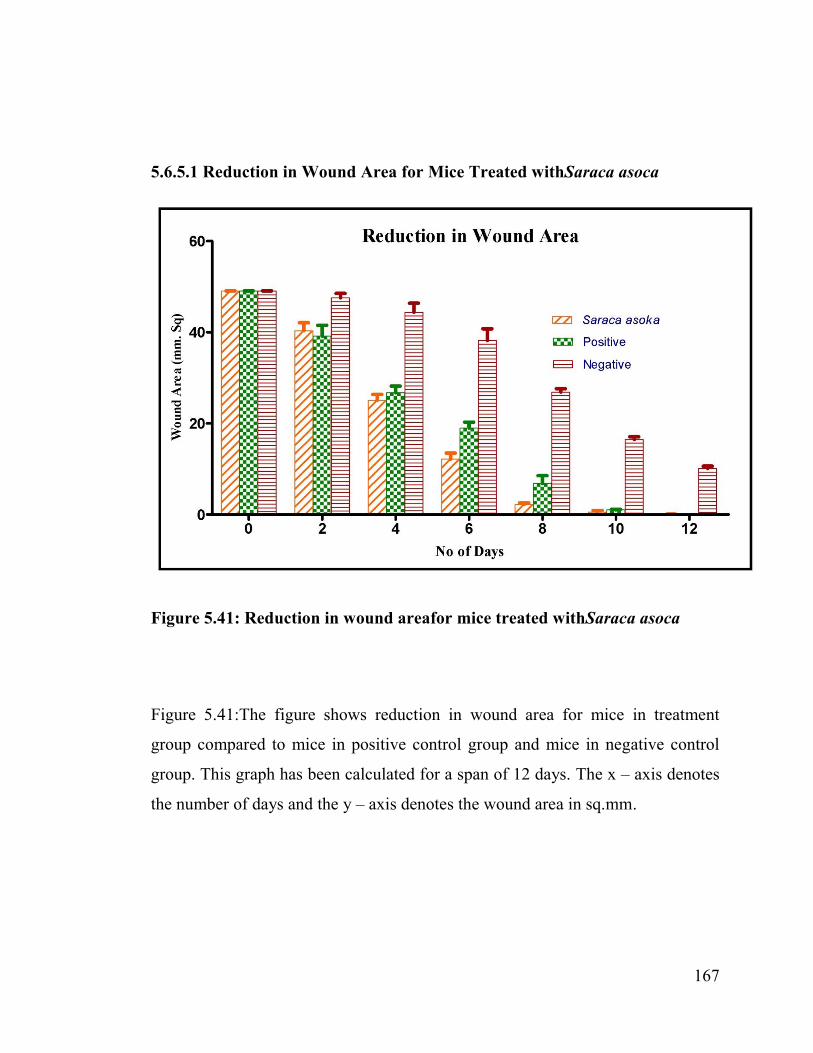
5.6.5.1 Reduction in Wound Area for Mice Treated withSaraca asoca
Figure 5.41: Reduction in wound areafor mice treated withSaraca asoca
Figure 5.41:The figure shows reduction in wound area for mice in treatment
group compared to mice in positive control group and mice in negative control
group. This graph has been calculated for a span of 12 days. The x – axis denotes
the number of days and the y – axis denotes the wound area in sq.mm.
168
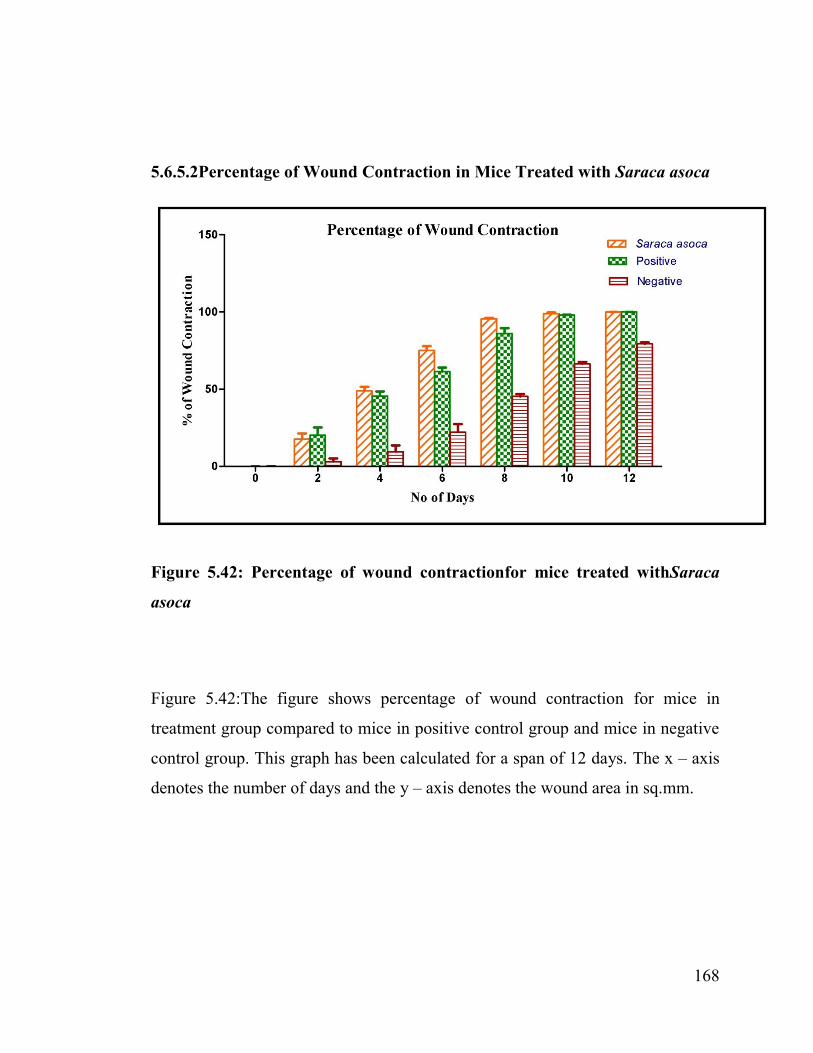
5.6.5.2Percentage of Wound Contraction in Mice Treated with Saraca asoca
Figure 5.42: Percentage of wound contractionfor mice treated withSaraca
asoca
Figure 5.42:The figure shows percentage of wound contraction for mice in
treatment group compared to mice in positive control group and mice in negative
control group. This graph has been calculated for a span of 12 days. The x – axis
denotes the number of days and the y – axis denotes the wound area in sq.mm.
169
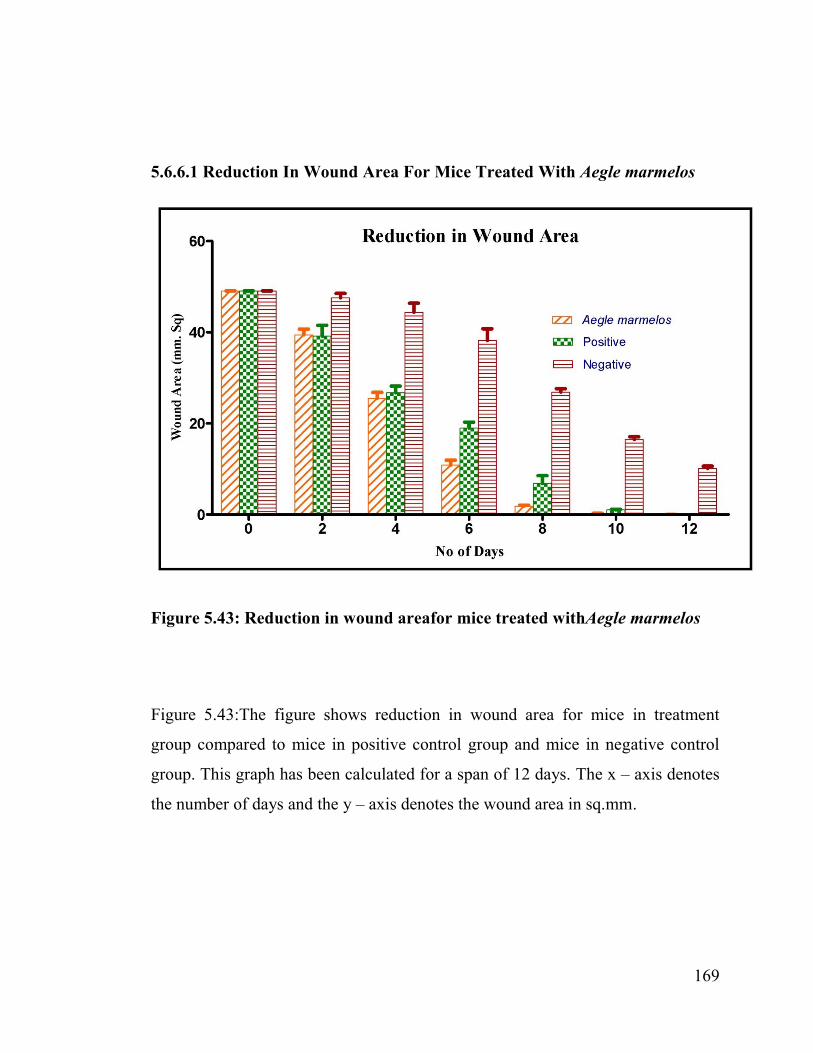
5.6.6.1 Reduction In Wound Area For Mice Treated With Aegle marmelos
Figure 5.43: Reduction in wound areafor mice treated withAegle marmelos
Figure 5.43:The figure shows reduction in wound area for mice in treatment
group compared to mice in positive control group and mice in negative control
group. This graph has been calculated for a span of 12 days. The x – axis denotes
the number of days and the y – axis denotes the wound area in sq.mm.
170
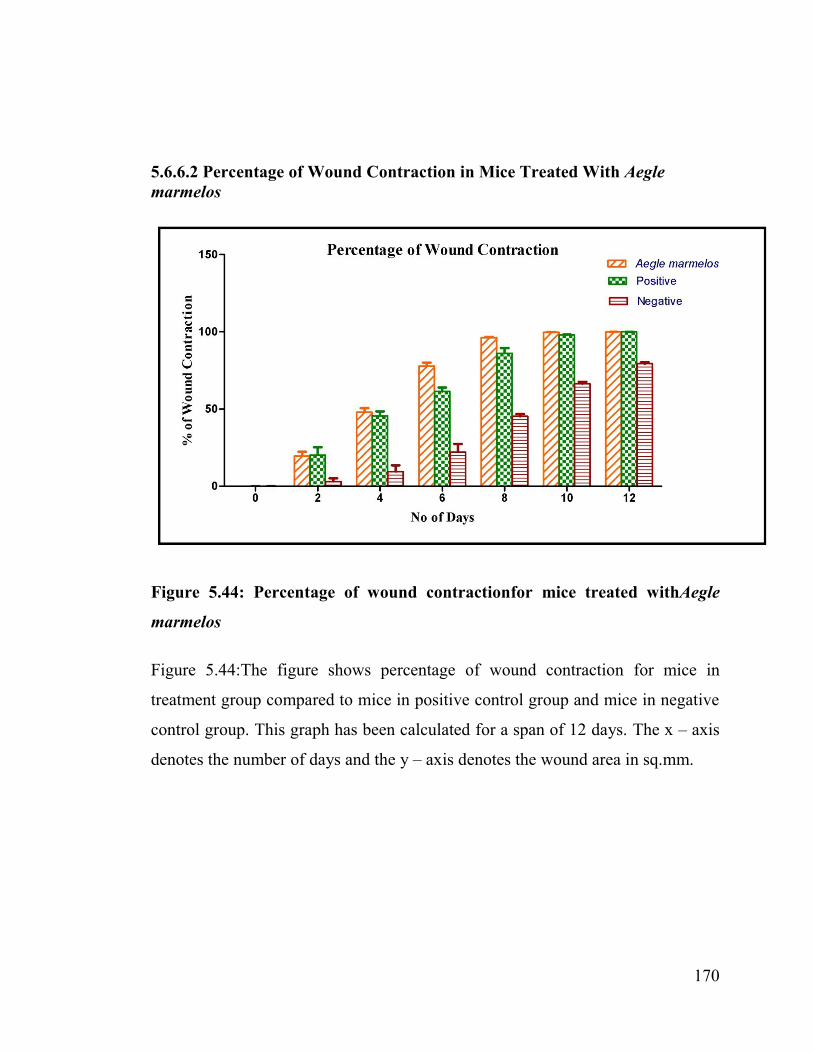
5.6.6.2 Percentage of Wound Contraction in Mice Treated With Aegle marmelos
Figure 5.44: Percentage of wound contractionfor mice treated withAegle
marmelos
Figure 5.44:The figure shows percentage of wound contraction for mice in
treatment group compared to mice in positive control group and mice in negative
control group. This graph has been calculated for a span of 12 days. The x – axis
denotes the number of days and the y – axis denotes the wound area in sq.mm.
171
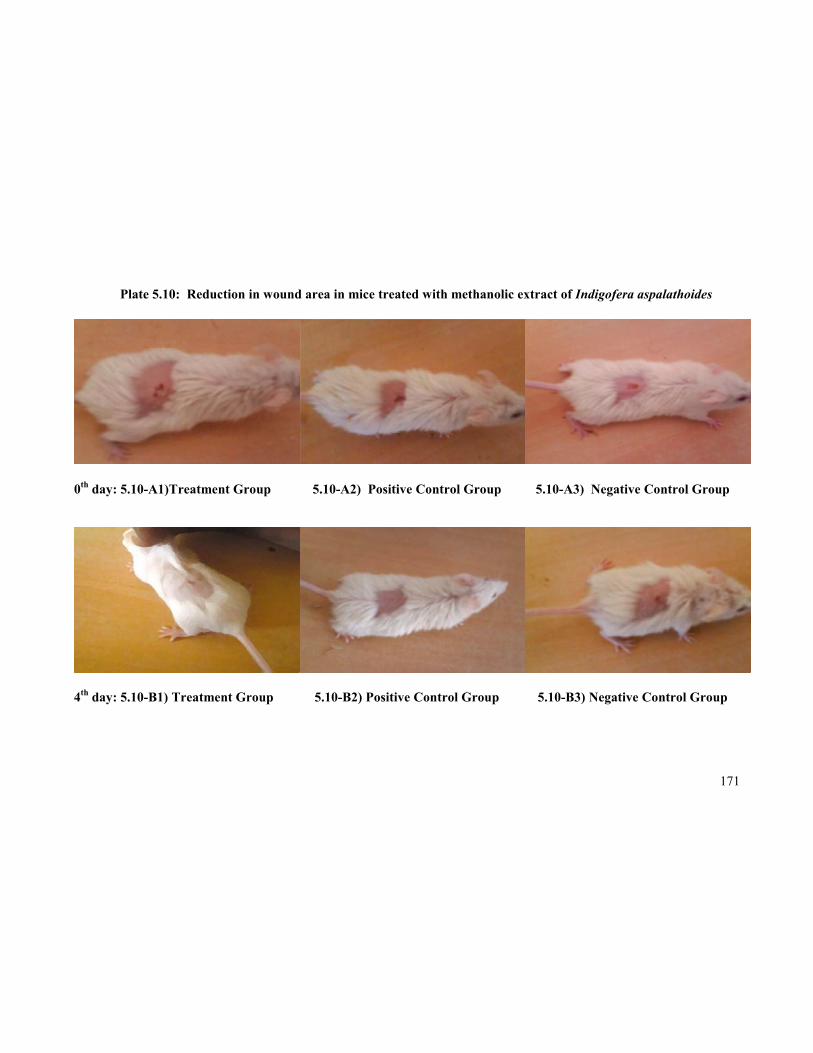
Plate 5.10: Reduction in wound area in mice treated with methanolic extract of Indigofera aspalathoides
0th day: 5.10-A1)Treatment Group 5.10-A2) Positive Control Group 5.10-A3) Negative Control Group
4th day: 5.10-B1) Treatment Group 5.10-B2) Positive Control Group 5.10-B3) Negative Control Group
172
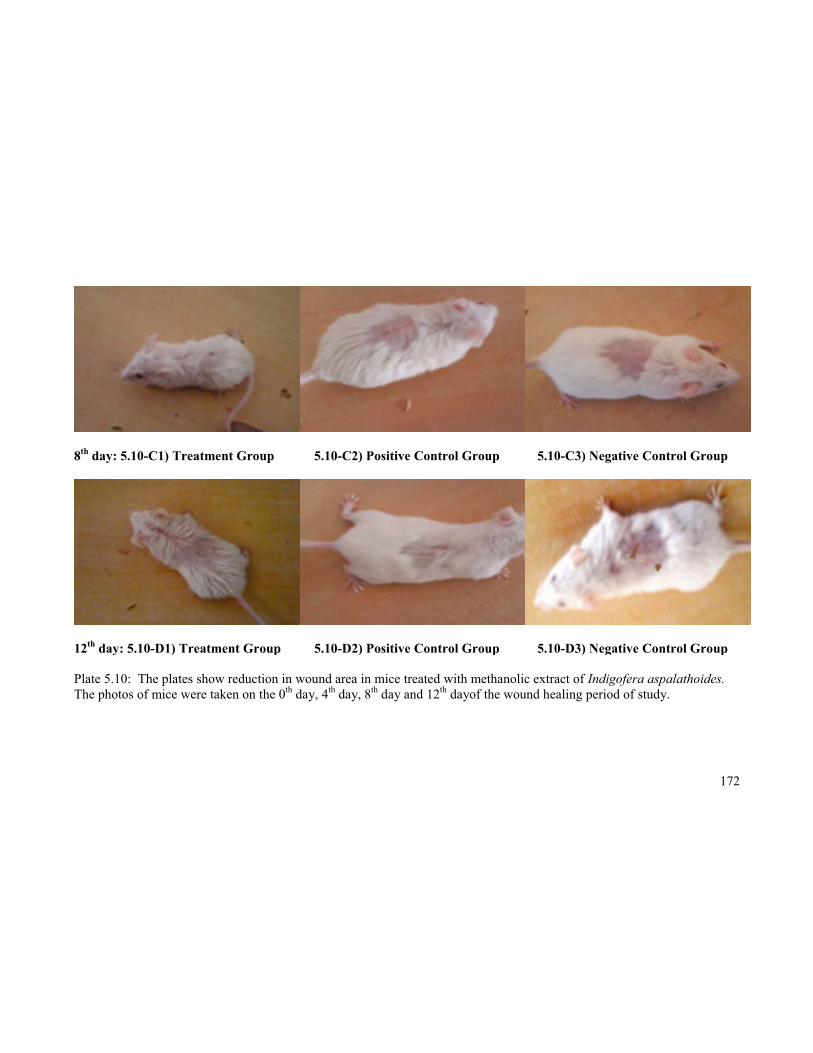
8th day: 5.10-C1) Treatment Group 5.10-C2) Positive Control Group 5.10-C3) Negative Control Group
12th day: 5.10-D1) Treatment Group 5.10-D2) Positive Control Group 5.10-D3) Negative Control Group
Plate 5.10: The plates show reduction in wound area in mice treated with methanolic extract of Indigofera aspalathoides. The photos of mice were taken on the 0th day, 4th day, 8th day and 12th dayof the wound healing period of study.
173
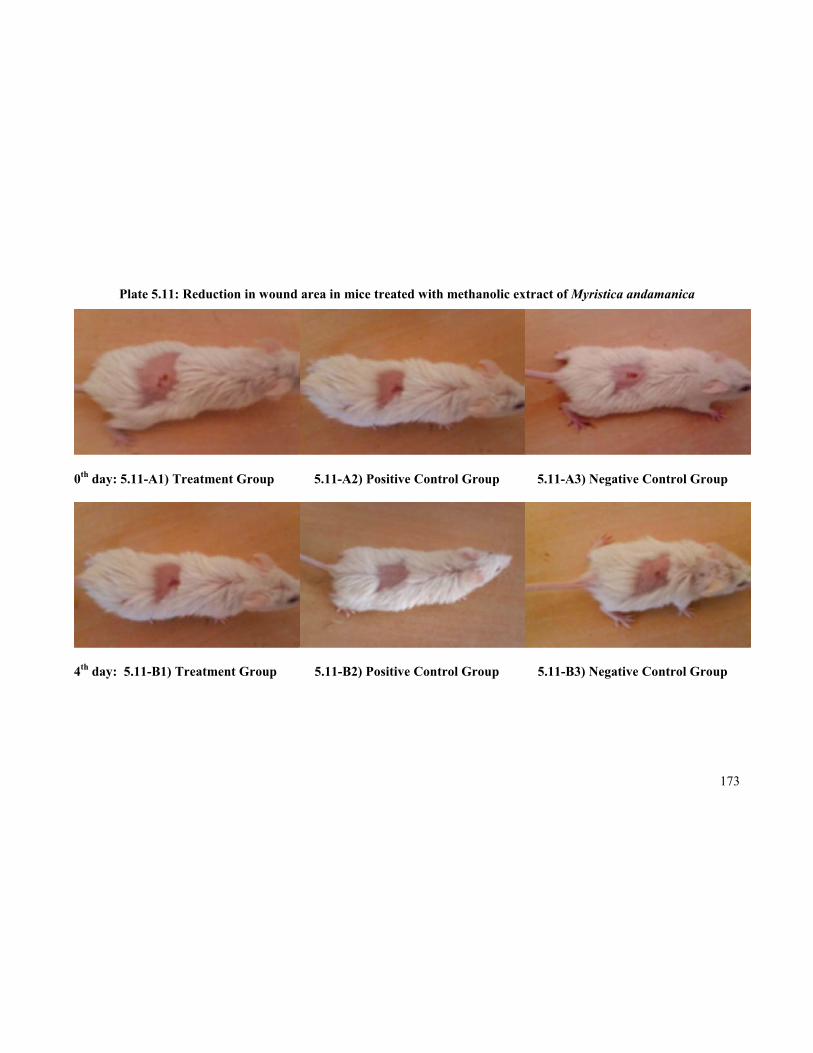
Plate 5.11: Reduction in wound area in mice treated with methanolic extract of Myristica andamanica
0th day: 5.11-A1) Treatment Group 5.11-A2) Positive Control Group 5.11-A3) Negative Control Group
4th day: 5.11-B1) Treatment Group 5.11-B2) Positive Control Group 5.11-B3) Negative Control Group
174
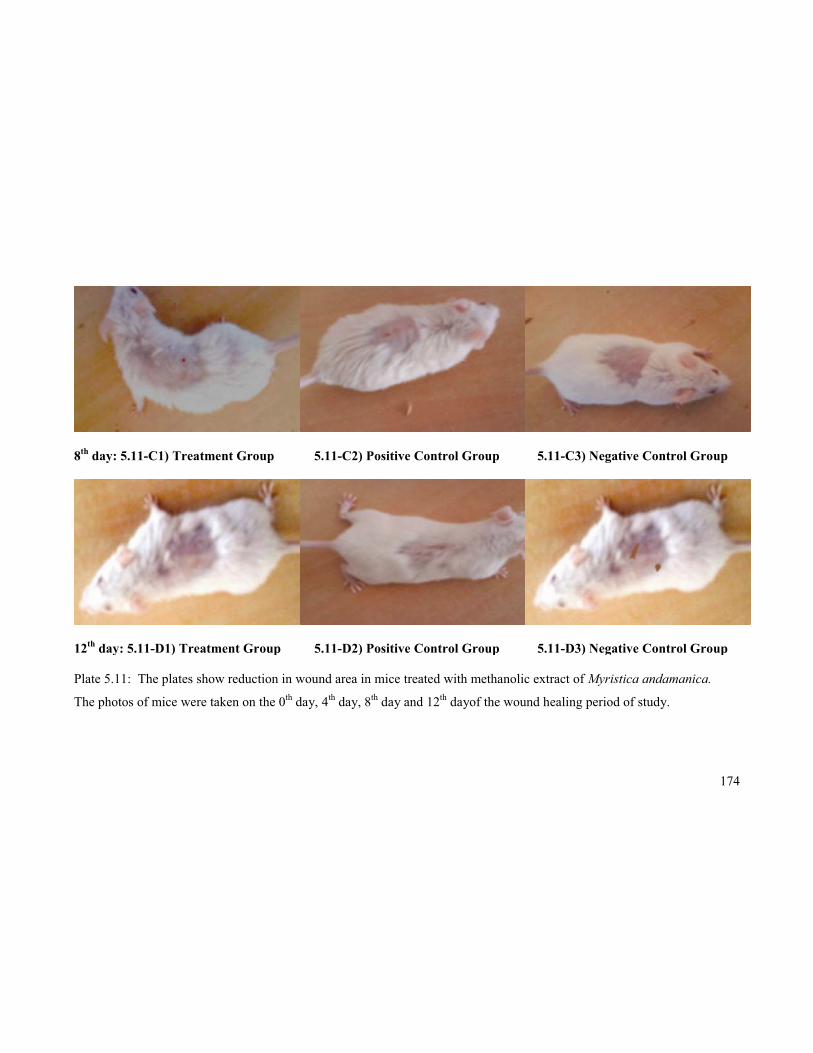
8th day: 5.11-C1) Treatment Group 5.11-C2) Positive Control Group 5.11-C3) Negative Control Group
12th day: 5.11-D1) Treatment Group 5.11-D2) Positive Control Group 5.11-D3) Negative Control Group
Plate 5.11: The plates show reduction in wound area in mice treated with methanolic extract of Myristica andamanica.
The photos of mice were taken on the 0th day, 4th day, 8th day and 12th dayof the wound healing period of study.
175
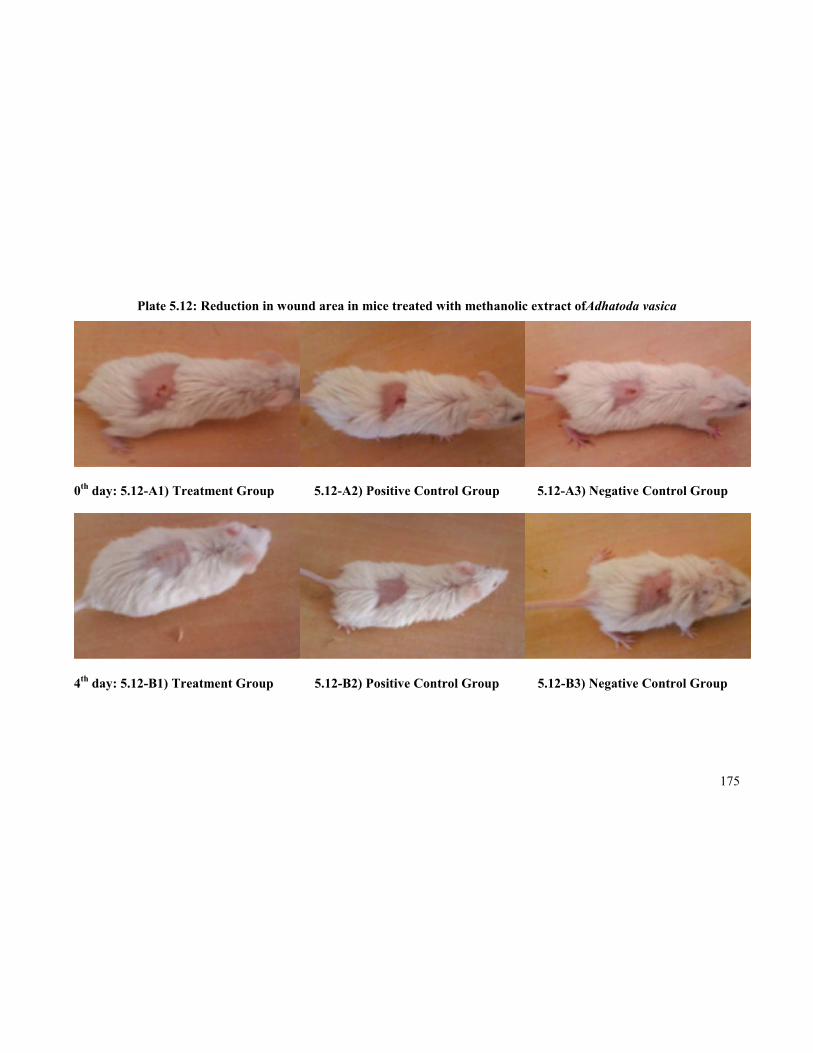
Plate 5.12: Reduction in wound area in mice treated with methanolic extract ofAdhatoda vasica
0th day: 5.12-A1) Treatment Group 5.12-A2) Positive Control Group 5.12-A3) Negative Control Group
4th day: 5.12-B1) Treatment Group 5.12-B2) Positive Control Group 5.12-B3) Negative Control Group
176
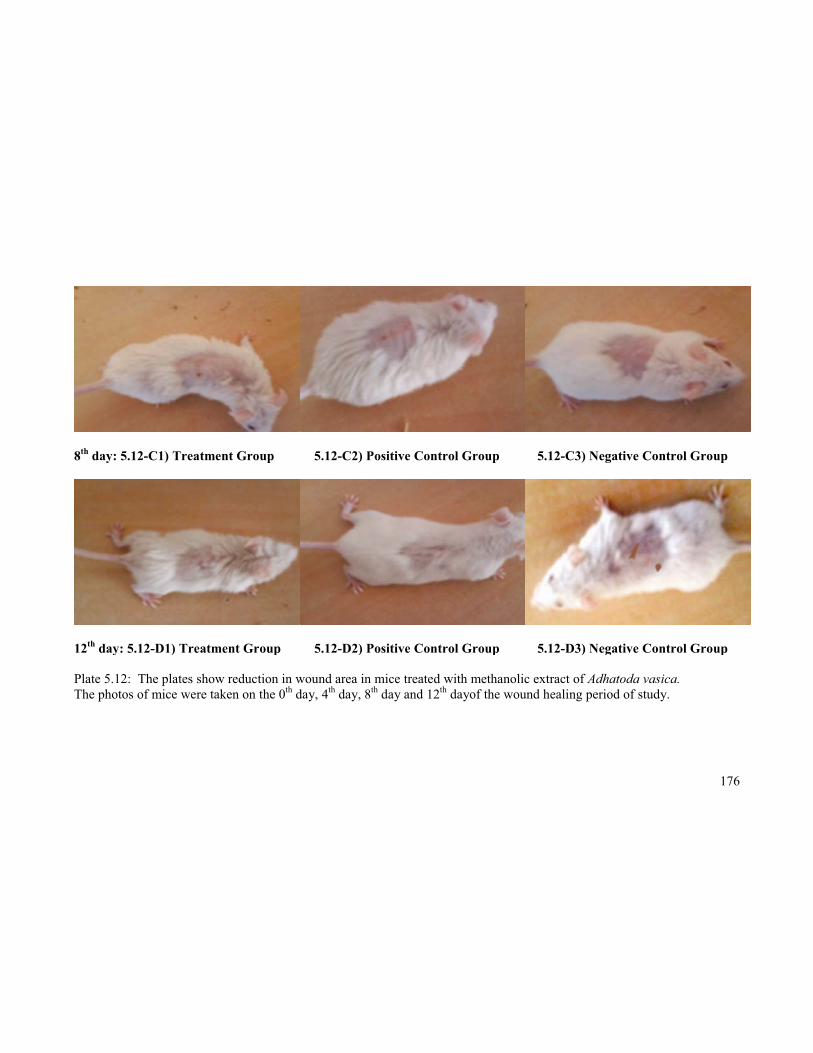
8th day: 5.12-C1) Treatment Group 5.12-C2) Positive Control Group 5.12-C3) Negative Control Group
12th day: 5.12-D1) Treatment Group 5.12-D2) Positive Control Group 5.12-D3) Negative Control Group
Plate 5.12: The plates show reduction in wound area in mice treated with methanolic extract of Adhatoda vasica.The photos of mice were taken on the 0th day, 4th day, 8th day and 12th dayof the wound healing period of study.
177
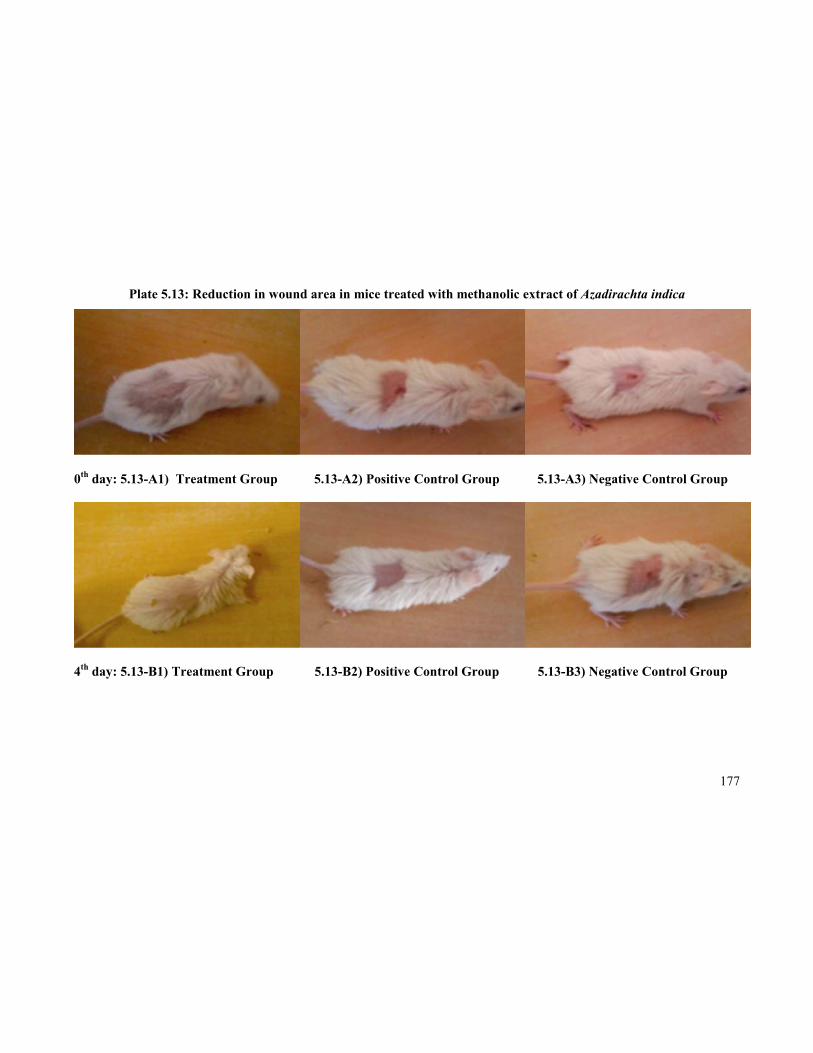
Plate 5.13: Reduction in wound area in mice treated with methanolic extract of Azadirachta indica
0th day: 5.13-A1) Treatment Group 5.13-A2) Positive Control Group 5.13-A3) Negative Control Group
4th day: 5.13-B1) Treatment Group 5.13-B2) Positive Control Group 5.13-B3) Negative Control Group
178
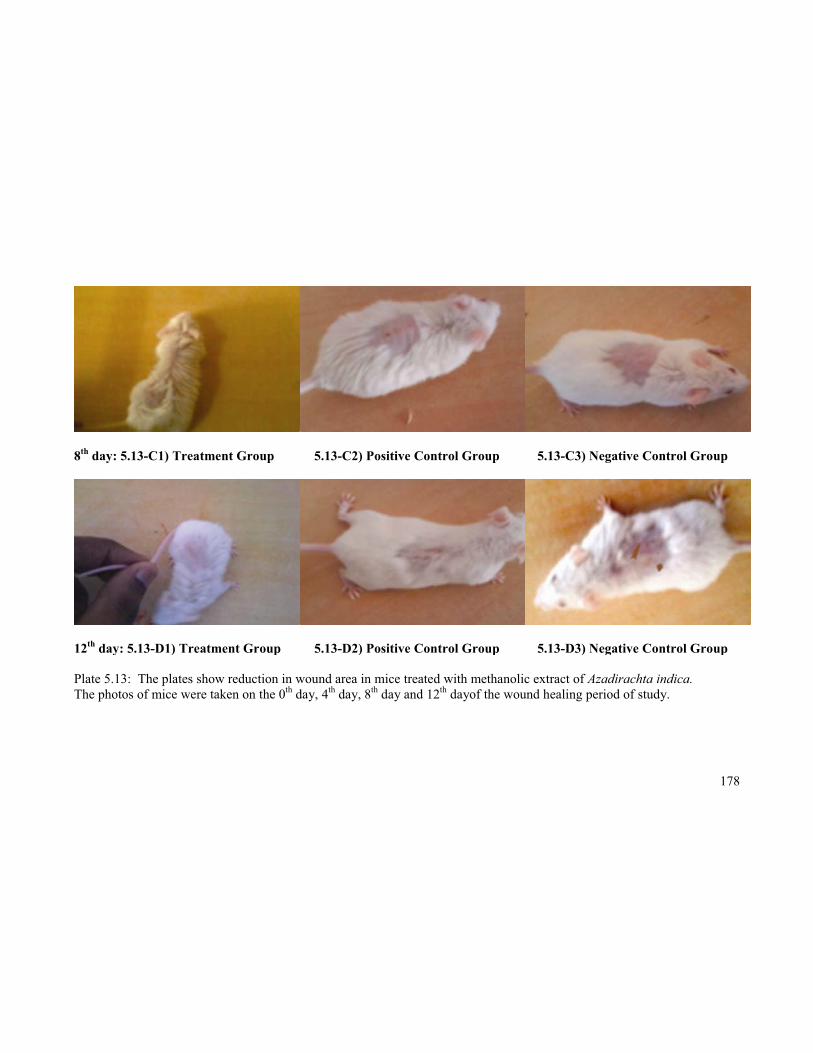
8th day: 5.13-C1) Treatment Group 5.13-C2) Positive Control Group 5.13-C3) Negative Control Group
12th day: 5.13-D1) Treatment Group 5.13-D2) Positive Control Group 5.13-D3) Negative Control Group
Plate 5.13: The plates show reduction in wound area in mice treated with methanolic extract of Azadirachta indica. The photos of mice were taken on the 0th day, 4th day, 8th day and 12th dayof the wound healing period of study.
179
Plate 5.14: Reduction in wound area in mice treated with methanolic extract of Saraca asoca
0th day: 5.14-A1)Treatment Group 5.14-A2) Positive Control Group 5.14-A3) Negative Control Group
4th day: 5.14-B1) Treatment Group 5.14-B2) Positive Control Group 5.14-B3) Negative Control Group
180
8th day: 5.14-C1) Treatment Group 5.14-C2) Positive Control Group 5.14-C3) Negative Control Group
12th day: 5.14-D1) Treatment Group 5.14-D2) Positive Control Group 5.14-D3) Negative Control Group
Plate 5.14: The plates show reduction in wound area in mice treated with methanolic extract of Saraca asoca. The photos of mice were taken on the 0th day, 4th day, 8th day and 12th dayof the wound healing period of study.
181
Plate 5.15: Reduction in wound area in mice treated with methanolic extract of Aegle marmelos
0th day: 5.15-A1) Treatment Group 5.15-A2) Positive Control Group 5.15-A3) Negative Control Group
4th day: 5.15-B1) Treatment Group 5.15-B2) Positive Control Group 5.15-B3) Negative Control Group
182
8th day: 5.15-C1) Treatment Group 5.15-C2) Positive Control Group 5.15-C3) Negative Control Group
12th day: 5.15-D1) Treatment Group 5.15-D2) Positive Control Group 5.15-D3) Negative Control Group
Plate 5.15: The plates show reduction in wound area in mice treated with methanolic extract of Aegle marmelos.The photos of mice were taken on the 0th day, 4th day, 8th day and 12th dayof the wound healing period of study.
183
Compared to the day 1 of wound healing, to the day 12 of wound healing
showed complete wound contraction and reduction in wounded area as seen in
Table 5.12 for all the methanolic extracts of the selected plants. On the 12th day
the positive control mice treated with Povidine iodine showed 100% wound
reduction while the negative control showed 80% wound reduction. But the
methanolic extracts treated animal showed above 99% and was equivalent to the
positive control. The methanolic extract of all the six selected medicinal plants
showed similar wound healing activity in 1% w/w of methanolic extract (Plate
5.10 to Plate 5.15: A1, A2, A3, B1, B2, B3, C1, C2, C3, D1, D2 and D3). This
wound healing activity was possible because of the presence of phenolics,
alkaloids, glycosides, flavonoids, tannins, anthraquinone and saponins present in
the extract which is shown in the phytochemical screening table (Table 5.8). The
presence of wound healing was also revealed from the table that the healing
process was slowly progressing from day 1 to day 12 which is shown as reduction
in wound area in Table 5.12 and in table 5.13 as percentage of wound
contraction. This was also well supported by our histopathological studies from
Plate 5.16 to Plate 5.21: A1, A2, A3, B1, B2, B3, C1, C2 and C3. The preliminary
phytochemical analysis of the crude extracts of the six selected Indian medicinal
plants indicated the presence of major phytochemical compounds,including
phenolics, alkaloids, glycosides, flavonoids, andtannins which may be responsible
forthe observed wound healing activities.
184
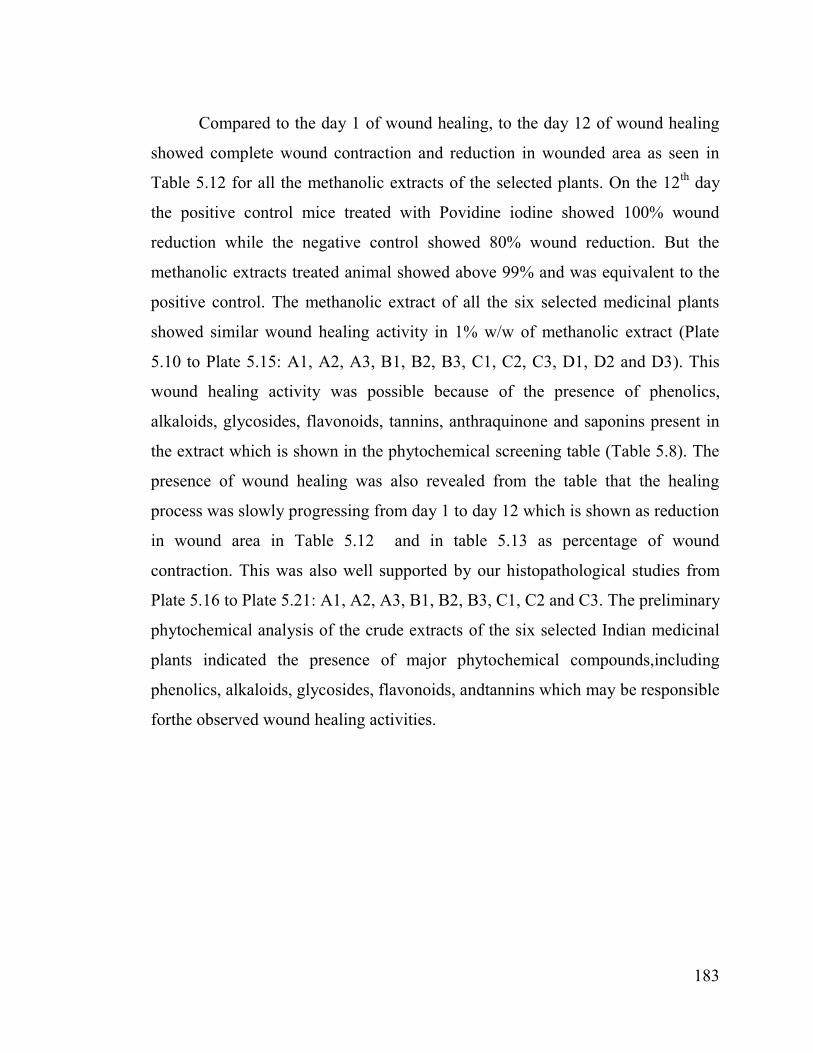
5.7 HISTOPATHOLOGICAL EXAMINATION
5.7.1 Histopathological Examination of Excised Tissues Treated withIndigofera aspalathoides
Plate 5.16:Histopathological examination of excised tissues treated with Indigofera aspalathoides
Plate 5.16-A:Tissue stained with Hematoxylin& Eosin Stain (HE)
5.16-A1) Treatment Group 5.16-A2) Positive Control Group 5.16-A3) Negative Control Group
Plate 5.16-A:Tissue stained with Hematoxylin & Eosin Stain (HE): Treatment Group: Collagen is seen in pink color. Muscle is seen in deep pink color. Basophilic cytoplasm is seen in purple color. Nuclei are seen in blue color. Positive Control Group: Collagen is seen in pink color. Muscle is seen in deep pink color. Basophilic cytoplasm is seen in purple color. Nuclei are seen in blue color. Negative Control Group: No deposition of collagen or muscles are seen which indicatesthat the tissue has not still developed. Proper nucleus has not still developed since no blue color is observed.C- Collagen, F- Fibroblast, PMC- Poly Morpho nuclear Cells, M- Mast Cells, N- Nuclei, RE- Re- Epithelialization, S- Scab,BC- Basophilic Cytoplasm.
185
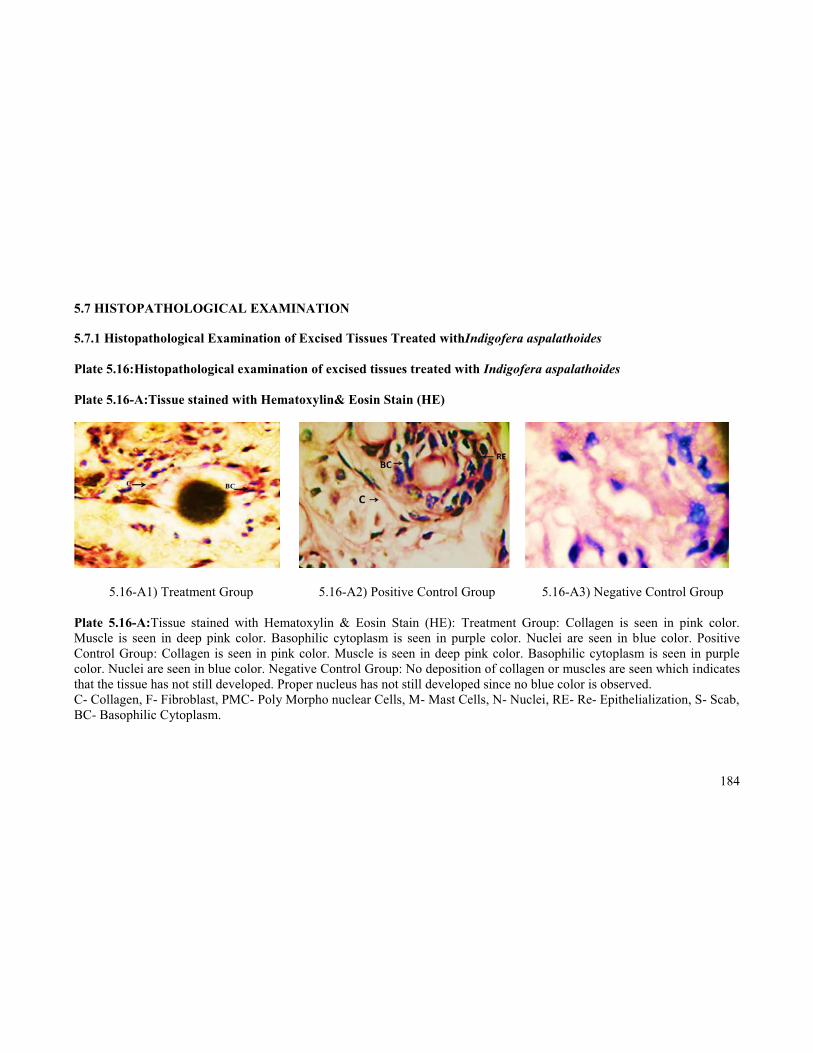
Plate 5.16:Histopathological examination of excised tissues treated with Indigofera aspalathoides
Plate 5.16-B:Tissue stained with Van Gieson’s Stain (VG)
5.16-B1) Treatment Group 5.16-B2) Positive Control Group 5.16-B3) Negative Control Group
Plate 5.16-B: Tissue stained with Van Gieson’s Stain (VG): Treatment Group: Collagen is seen in bright red color. Cytoplasm, muscle, fibrin and RBC are seen in yellow color. Nucleus is seen in blue color. Positive Control Group: Collagen is seen in bright red color. Cytoplasm, muscle, fibrin and RBC are seen in yellow color. Nucleus is seen in blue color. Negative Control Group: No deposition of collagen is seen.C- Collagen, F- Fibroblast, PMC- Poly Morpho nuclear Cells, M- Mast Cells, N- Nuclei, RE- Re- Epithelialization, S- Scab, BC- Basophilic Cytoplasm.
186
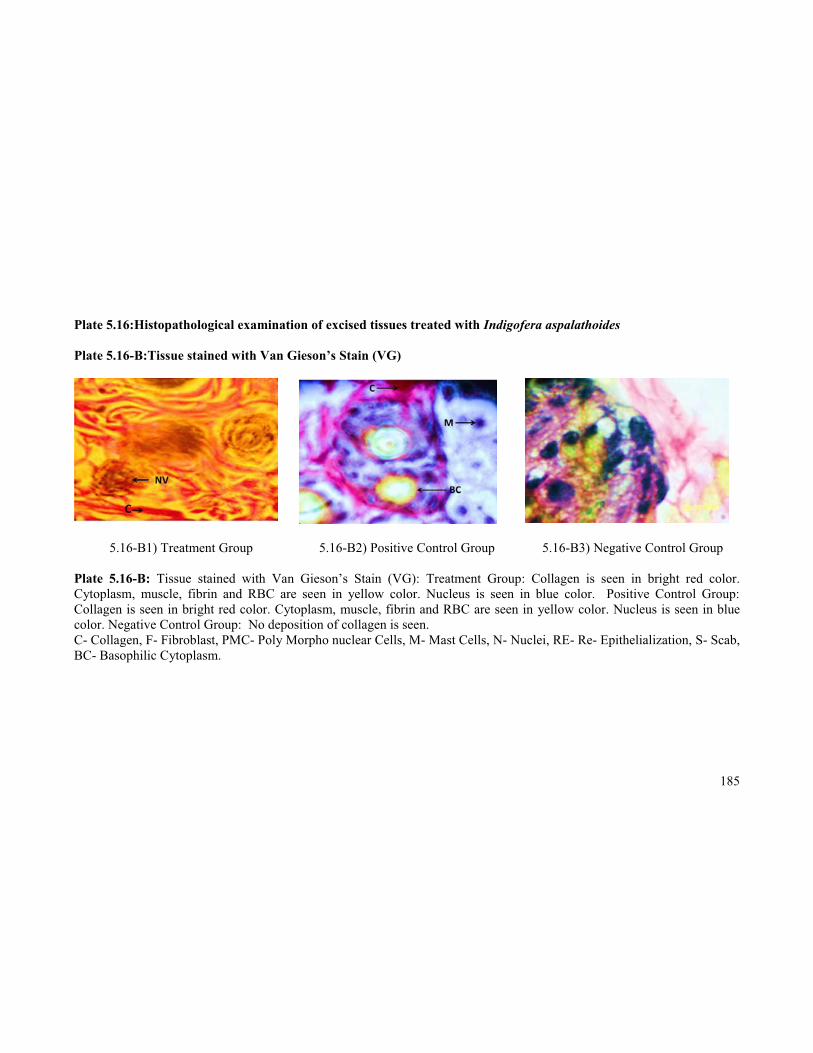
Plate 5.16:Histopathological examination of excised tissues treated with Indigofera aspalathoides
Plate 5.16-C:Tissue stained with Toluidine blue Stain (TB)
5.16-C1) Treatment Group 5.16-C2) Positive Control Group 5.16-C3) Negative Control Group
Plate 5.16-C: Tissue stained with Toluidine blue Stain (TB): Treatment Group: Mast cells are seen in blue color. Positive Control Group: Mast cells are seen in blue color. Negative Control Group: No mast cells are observed which indicates thattissue development has not started.C- Collagen, F- Fibroblast, PMC- Poly Morpho nuclear Cells, M- Mast Cells, N- Nuclei, RE- Re- Epithelialization, S- Scab, BC- Basophilic Cytoplasm.
187
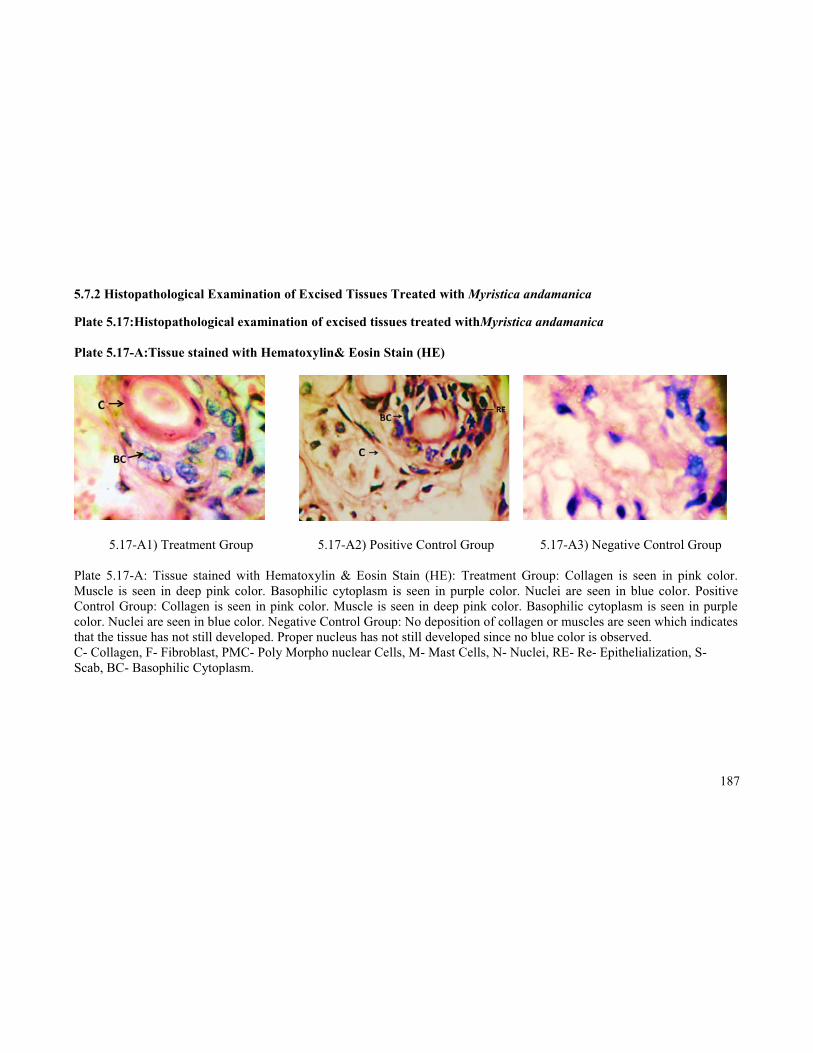
5.7.2 Histopathological Examination of Excised Tissues Treated with Myristica andamanica
Plate 5.17:Histopathological examination of excised tissues treated withMyristica andamanica
Plate 5.17-A:Tissue stained with Hematoxylin& Eosin Stain (HE)
5.17-A1) Treatment Group 5.17-A2) Positive Control Group 5.17-A3) Negative Control Group
Plate 5.17-A: Tissue stained with Hematoxylin & Eosin Stain (HE): Treatment Group: Collagen is seen in pink color. Muscle is seen in deep pink color. Basophilic cytoplasm is seen in purple color. Nuclei are seen in blue color. Positive Control Group: Collagen is seen in pink color. Muscle is seen in deep pink color. Basophilic cytoplasm is seen in purple color. Nuclei are seen in blue color. Negative Control Group: No deposition of collagen or muscles are seen which indicatesthat the tissue has not still developed. Proper nucleus has not still developed since no blue color is observed.C- Collagen, F- Fibroblast, PMC- Poly Morpho nuclear Cells, M- Mast Cells, N- Nuclei, RE- Re- Epithelialization, S-Scab, BC- Basophilic Cytoplasm.
188
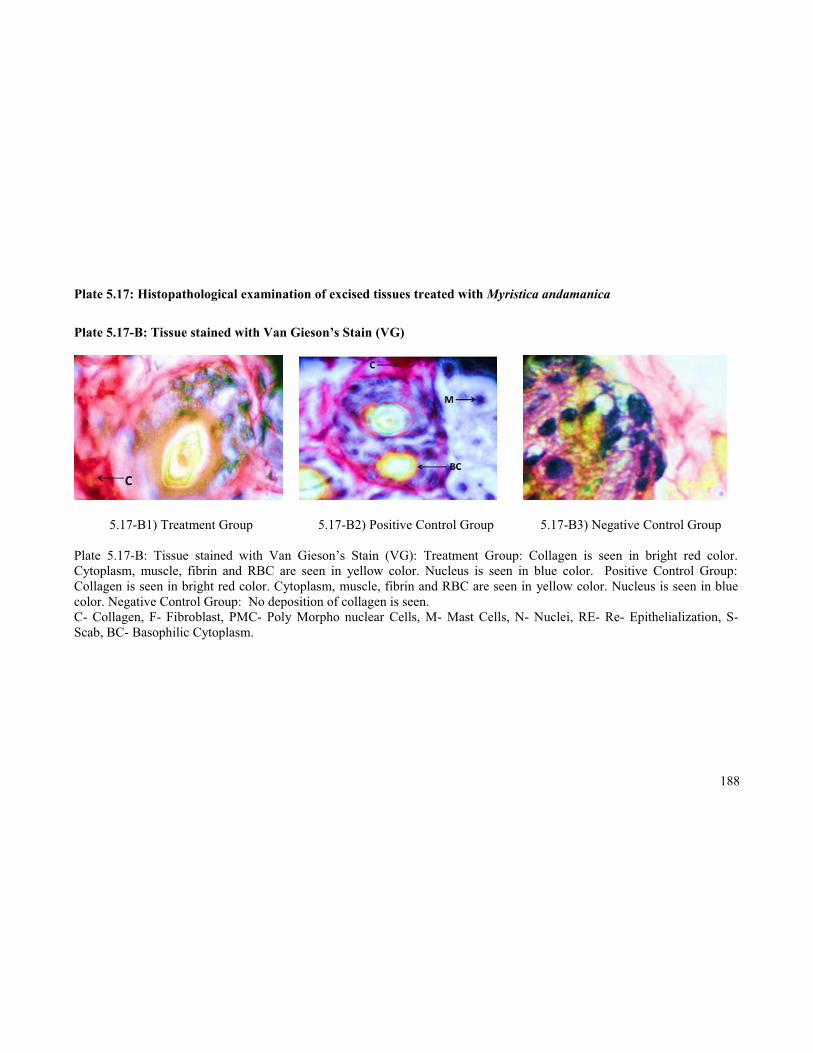
Plate 5.17: Histopathological examination of excised tissues treated with Myristica andamanica
Plate 5.17-B: Tissue stained with Van Gieson’s Stain (VG)
5.17-B1) Treatment Group 5.17-B2) Positive Control Group 5.17-B3) Negative Control Group
Plate 5.17-B: Tissue stained with Van Gieson’s Stain (VG): Treatment Group: Collagen is seen in bright red color. Cytoplasm, muscle, fibrin and RBC are seen in yellow color. Nucleus is seen in blue color. Positive Control Group: Collagen is seen in bright red color. Cytoplasm, muscle, fibrin and RBC are seen in yellow color. Nucleus is seen in blue color. Negative Control Group: No deposition of collagen is seen.C- Collagen, F- Fibroblast, PMC- Poly Morpho nuclear Cells, M- Mast Cells, N- Nuclei, RE- Re- Epithelialization, S-Scab, BC- Basophilic Cytoplasm.
189
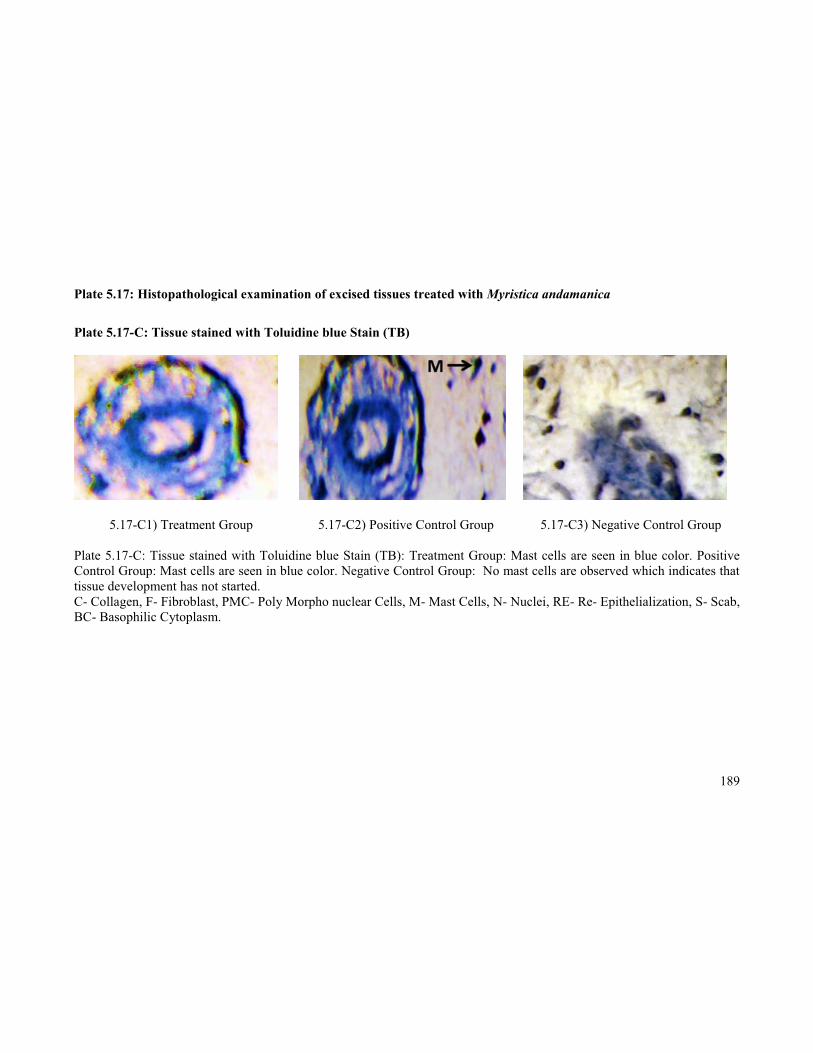
Plate 5.17: Histopathological examination of excised tissues treated with Myristica andamanica
Plate 5.17-C: Tissue stained with Toluidine blue Stain (TB)
5.17-C1) Treatment Group 5.17-C2) Positive Control Group 5.17-C3) Negative Control Group
Plate 5.17-C: Tissue stained with Toluidine blue Stain (TB): Treatment Group: Mast cells are seen in blue color. Positive Control Group: Mast cells are seen in blue color. Negative Control Group: No mast cells are observed which indicates that tissue development has not started.C- Collagen, F- Fibroblast, PMC- Poly Morpho nuclear Cells, M- Mast Cells, N- Nuclei, RE- Re- Epithelialization, S- Scab, BC- Basophilic Cytoplasm.
190
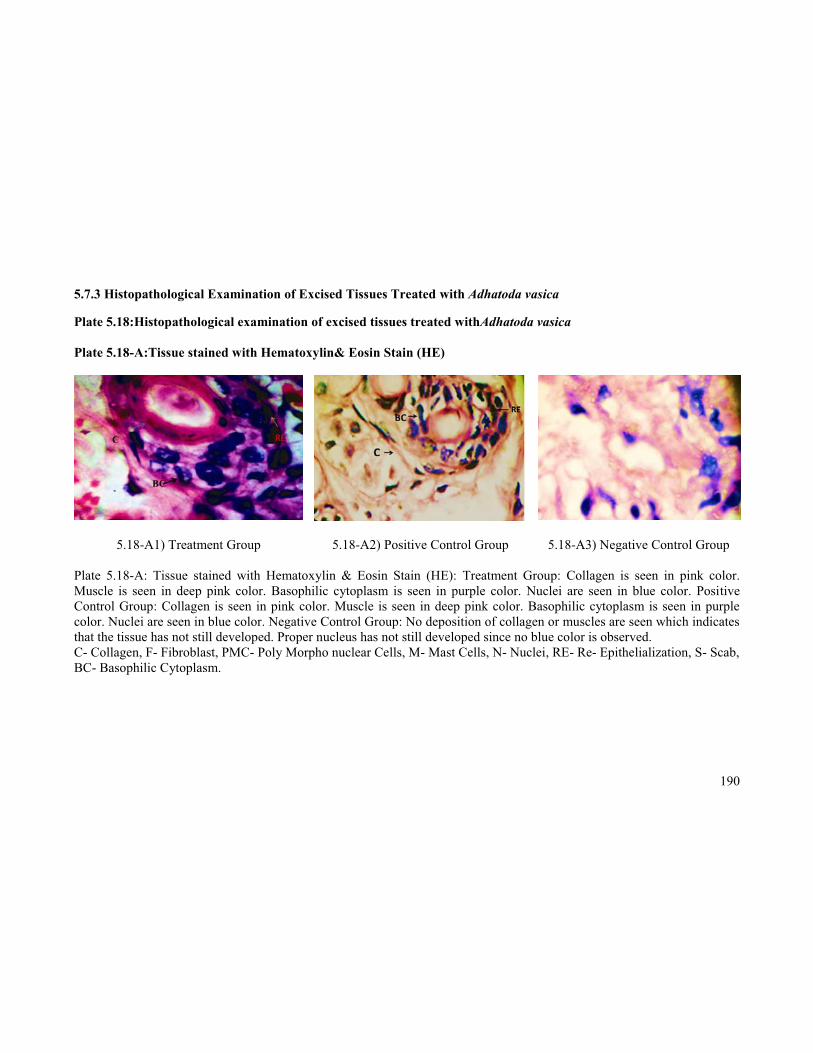
5.7.3 Histopathological Examination of Excised Tissues Treated with Adhatoda vasica
Plate 5.18:Histopathological examination of excised tissues treated withAdhatoda vasica
Plate 5.18-A:Tissue stained with Hematoxylin& Eosin Stain (HE)
5.18-A1) Treatment Group 5.18-A2) Positive Control Group 5.18-A3) Negative Control Group
Plate 5.18-A: Tissue stained with Hematoxylin & Eosin Stain (HE): Treatment Group: Collagen is seen in pink color. Muscle is seen in deep pink color. Basophilic cytoplasm is seen in purple color. Nuclei are seen in blue color. Positive Control Group: Collagen is seen in pink color. Muscle is seen in deep pink color. Basophilic cytoplasm is seen in purple color. Nuclei are seen in blue color. Negative Control Group: No deposition of collagen or muscles are seen which indicates that the tissue has not still developed. Proper nucleus has not still developed since no blue color is observed.C- Collagen, F- Fibroblast, PMC- Poly Morpho nuclear Cells, M- Mast Cells, N- Nuclei, RE- Re- Epithelialization, S- Scab,BC- Basophilic Cytoplasm.
191
Plate 5.18: Histopathological examination of excised tissues treated with Adhatoda vasica
Plate 5.18-B: Tissue stained with Van Gieson’s Stain (VG)
5.18-B1) Treatment Group 5.18-B2) Positive Control Group 5.18-B3) Negative Control Group
Plate 5.18-B: Tissue stained with Van Gieson’s Stain (VG): Treatment Group: Collagen is seen in bright red color. Cytoplasm, muscle, fibrin and RBC are seen in yellow color. Nucleus is seen in blue color. Positive Control Group: Collagen is seen in bright red color. Cytoplasm, muscle, fibrin and RBC are seen in yellow color. Nucleus is seen in blue color. Negative Control Group: No deposition of collagen is seen.C- Collagen, F- Fibroblast, PMC- Poly Morpho nuclear Cells, M- Mast Cells, N- Nuclei, RE- Re- Epithelialization, S- Scab, BC- Basophilic Cytoplasm.
192
Plate 5.18: Histopathological examination of excised tissues treated with Adhatoda vasica
Plate 5.18-C: Tissue stained with Toluidine blue Stain (TB)
5.18-C1) Treatment Group 5.18-C2) Positive Control Group 5.18-C3) Negative Control Group
Plate 5.18-C: Tissue stained with Toluidine blue Stain (TB): Treatment Group: Mast cells are seen in blue color. Positive Control Group: Mast cells are seen in blue color. Negative Control Group: No mast cells are observed which indicates that tissue development has not started.C- Collagen, F- Fibroblast, PMC- Poly Morpho nuclear Cells, M- Mast Cells, N- Nuclei, RE- Re- Epithelialization, S- Scab, BC- Basophilic Cytoplasm.
193
5.7.4 Histopathological Examination of Excised Tissues Treated With Azadirachta indica
Plate 5.19: Histopathological examination of excised tissues treated with Azadirachta indica
Plate 5.19-A: Tissue stained with Hematoxylin& Eosin Stain (HE)
5.19-A1) Treatment Group 5.19-A2) Positive Control Group 5.19-A3) Negative Control Group
Plate 5.19-A: Tissue stained with Hematoxylin & Eosin Stain (HE): Treatment Group: Collagen is seen in pink color. Muscle is seen in deep pink color. Basophilic cytoplasm is seen in purple color. Nuclei are seen in blue color. Positive Control Group: Collagen is seen in pink color. Muscle is seen in deep pink color. Basophilic cytoplasm is seen in purple color. Nuclei are seen in blue color. Negative Control Group: No deposition of collagen or muscles are seen which indicates that the tissue has not still developed. Proper nucleus has not still developed since no blue color is observed.C- Collagen, F- Fibroblast, PMC- Poly Morpho nuclear Cells, M- Mast Cells, N- Nuclei, RE- Re- Epithelialization, S- Scab,BC- Basophilic Cytoplasm.
194
Plate 5.19: Histopathological examination of excised tissues treated with Azadirachta indica
Plate 5.19-B: Tissue stained with Van Gieson’s Stain (VG)
5.19-B1) Treatment Group 5.19-B2) Positive Control Group 5.19-B3) Negative Control Group
Plate 5.19-B: Tissue stained with Van Gieson’s Stain (VG): Treatment Group: Collagen is seen in bright red color. Cytoplasm, muscle, fibrin and RBC are seen in yellow color. Nucleus is seen in blue color. Positive Control Group: Collagen is seen in bright red color. Cytoplasm, muscle, fibrin and RBC are seen in yellow color. Nucleus is seen in blue color. Negative Control Group: No deposition of collagen is seen.C- Collagen, F- Fibroblast, PMC- Poly Morpho nuclear Cells, M- Mast Cells, N- Nuclei, RE- Re- Epithelialization, S- Scab, BC- Basophilic Cytoplasm.
195
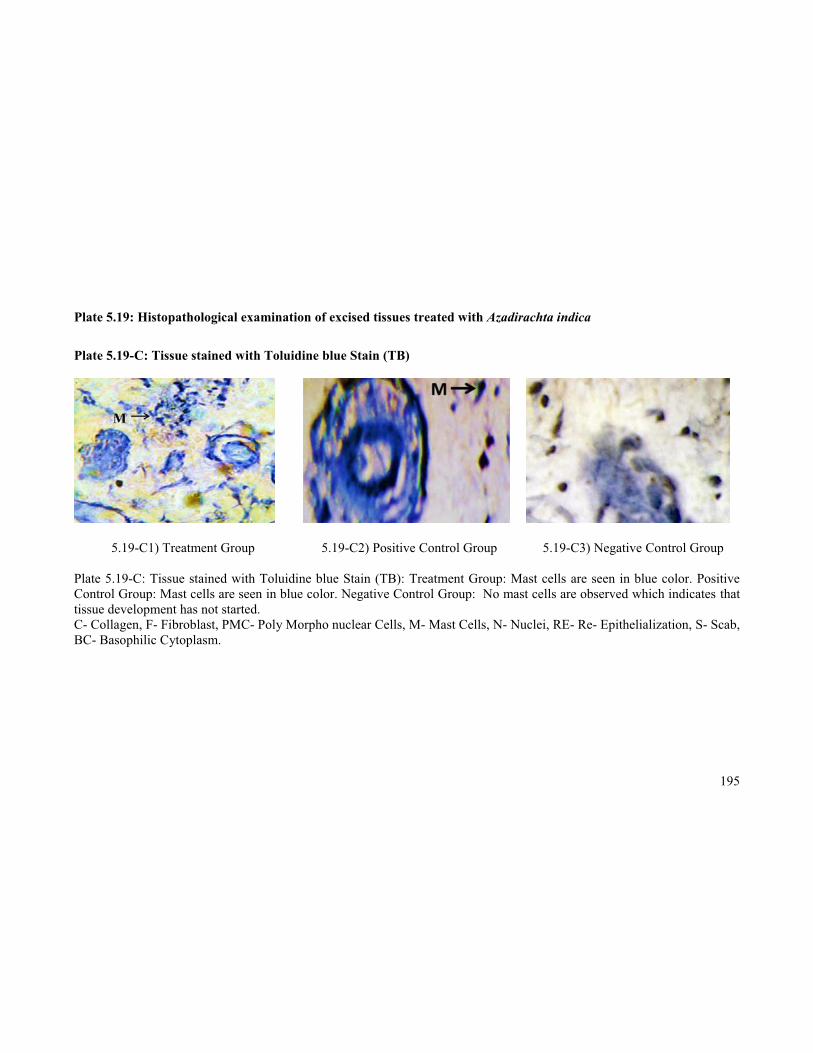
Plate 5.19: Histopathological examination of excised tissues treated with Azadirachta indica
Plate 5.19-C: Tissue stained with Toluidine blue Stain (TB)
5.19-C1) Treatment Group 5.19-C2) Positive Control Group 5.19-C3) Negative Control Group
Plate 5.19-C: Tissue stained with Toluidine blue Stain (TB): Treatment Group: Mast cells are seen in blue color. Positive Control Group: Mast cells are seen in blue color. Negative Control Group: No mast cells are observed which indicates thattissue development has not started.C- Collagen, F- Fibroblast, PMC- Poly Morpho nuclear Cells, M- Mast Cells, N- Nuclei, RE- Re- Epithelialization, S- Scab, BC- Basophilic Cytoplasm.
196
5.7.5 Histopathological Examination of Excised Tissues Treated With Saraca asoca
Plate 5.20:Histopathological examination of excised tissues treated withSaraca asoca
Plate 5.20-A:Tissue stained with Hematoxylin& Eosin Stain (HE)
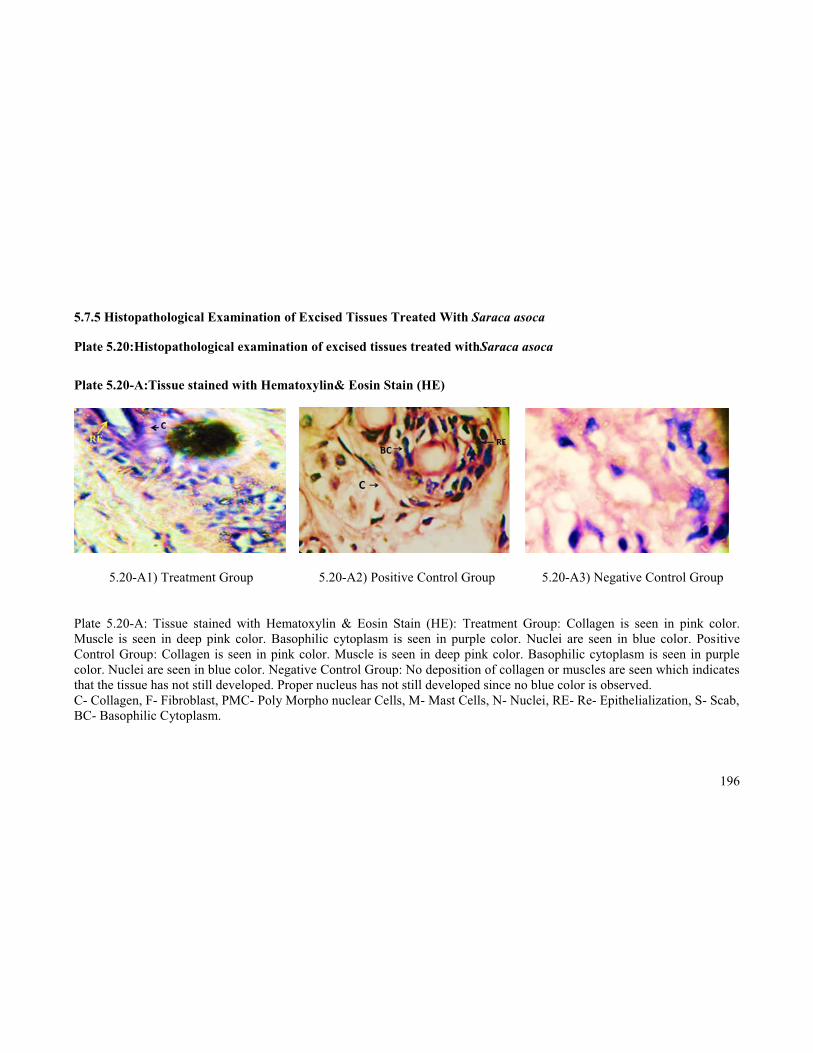
5.20-A1) Treatment Group 5.20-A2) Positive Control Group 5.20-A3) Negative Control Group
Plate 5.20-A: Tissue stained with Hematoxylin & Eosin Stain (HE): Treatment Group: Collagen is seen in pink color. Muscle is seen in deep pink color. Basophilic cytoplasm is seen in purple color. Nuclei are seen in blue color. Positive Control Group: Collagen is seen in pink color. Muscle is seen in deep pink color. Basophilic cytoplasm is seen in purple color. Nuclei are seen in blue color. Negative Control Group: No deposition of collagen or muscles are seen which indicates that the tissue has not still developed. Proper nucleus has not still developed since no blue color is observed.C- Collagen, F- Fibroblast, PMC- Poly Morpho nuclear Cells, M- Mast Cells, N- Nuclei, RE- Re- Epithelialization, S- Scab,BC- Basophilic Cytoplasm.
197
Plate 5.20: Histopathological examination of excised tissues treated with Saraca asoca
Plate 5.20-B: Tissue stained with Van Gieson’s Stain (VG)
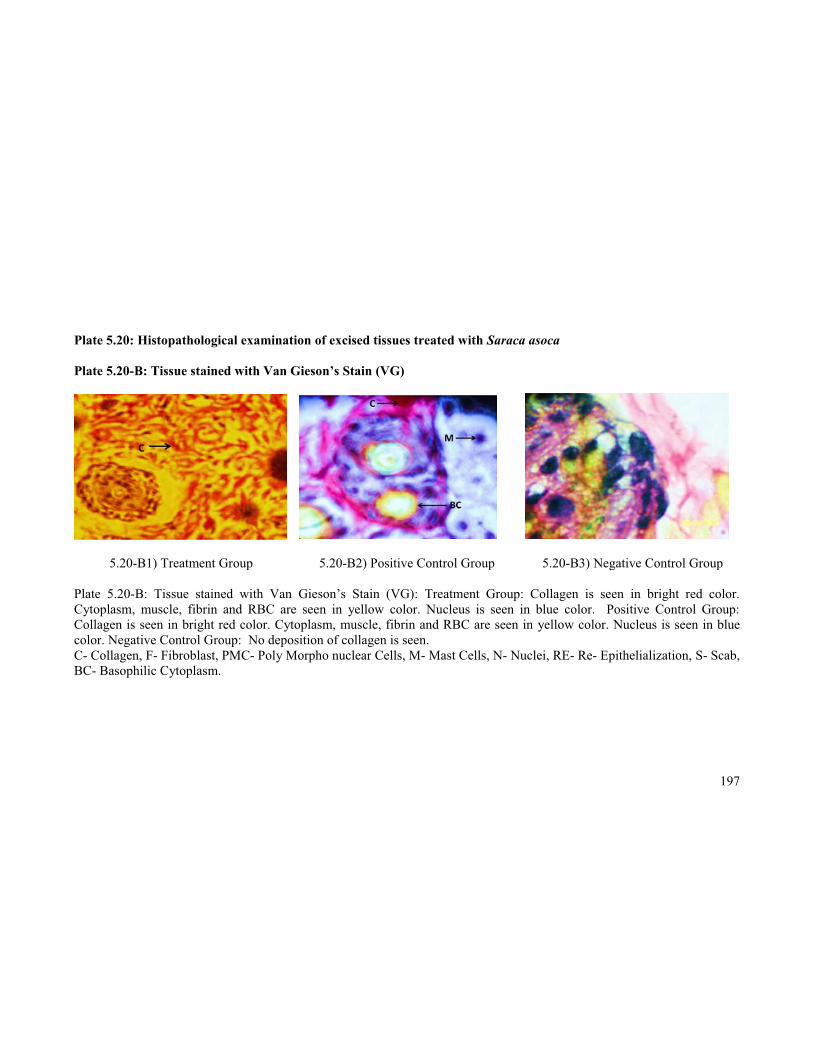
5.20-B1) Treatment Group 5.20-B2) Positive Control Group 5.20-B3) Negative Control Group
Plate 5.20-B: Tissue stained with Van Gieson’s Stain (VG): Treatment Group: Collagen is seen in bright red color. Cytoplasm, muscle, fibrin and RBC are seen in yellow color. Nucleus is seen in blue color. Positive Control Group: Collagen is seen in bright red color. Cytoplasm, muscle, fibrin and RBC are seen in yellow color. Nucleus is seen in blue color. Negative Control Group: No deposition of collagen is seen.C- Collagen, F- Fibroblast, PMC- Poly Morpho nuclear Cells, M- Mast Cells, N- Nuclei, RE- Re- Epithelialization, S- Scab, BC- Basophilic Cytoplasm.
198
Plate 5.20: Histopathological examination of excised tissues treated with Saraca asoca
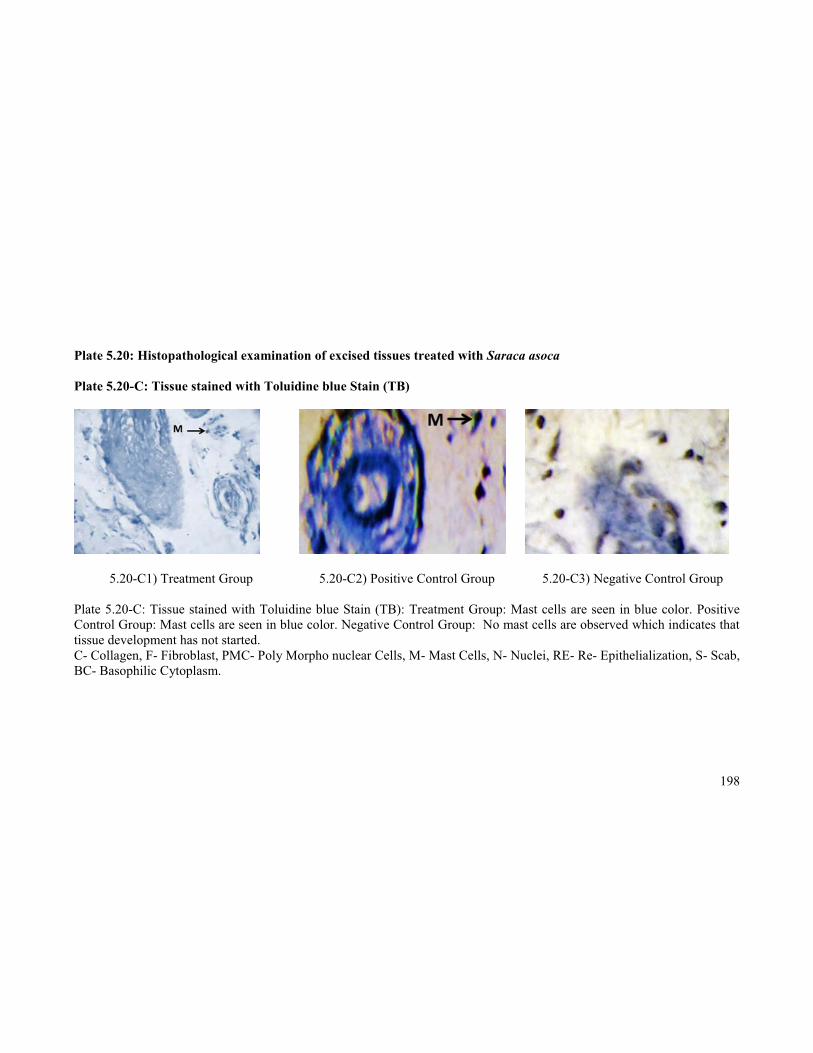
Plate 5.20-C: Tissue stained with Toluidine blue Stain (TB)
5.20-C1) Treatment Group 5.20-C2) Positive Control Group 5.20-C3) Negative Control Group
Plate 5.20-C: Tissue stained with Toluidine blue Stain (TB): Treatment Group: Mast cells are seen in blue color. Positive Control Group: Mast cells are seen in blue color. Negative Control Group: No mast cells are observed which indicates that tissue development has not started. C- Collagen, F- Fibroblast, PMC- Poly Morpho nuclear Cells, M- Mast Cells, N- Nuclei, RE- Re- Epithelialization, S- Scab, BC- Basophilic Cytoplasm.
199
5.7.6 Histopathological Examination of Excised Tissues Treated With Aegle marmelos
Plate 5.21:Histopathological examination of excised tissues treated withAegle marmelos
Plate 5.21-A:Tissue stained with Hematoxylin& Eosin Stain (HE)
5.21-A1) Treatment Group 5.21-A2) Positive Control Group 5.21-A3) Negative Control Group
Plate 5.21-A: Tissue stained with Hematoxylin & Eosin Stain (HE): Treatment Group: Collagen is seen in pink color. Muscle is seen in deep pink color. Basophilic cytoplasm is seen in purple color. Nuclei are seen in blue color. Positive Control Group: Collagen is seen in pink color. Muscle is seen in deep pink color. Basophilic cytoplasm is seen in purple color. Nuclei are seen in blue color. Negative Control Group: No deposition of collagen or muscles are seen which indicates that the tissue has not still developed. Proper nucleus has not still developed since no blue color is observed.C- Collagen, F- Fibroblast, PMC- Poly Morpho nuclear Cells, M- Mast Cells, N- Nuclei, RE- Re- Epithelialization, S- Scab,BC- Basophilic Cytoplasm.
200
Plate 5.21: Histopathological examination of excised tissues treated with Aegle marmelos
Plate 5.21-B: Tissue stained with Van Gieson’s Stain (VG)
5.21-B1) Treatment Group 5.21-B2) Positive Control Group 5.21-B3) Negative Control Group
Plate 5.21-B: Tissue stained with Van Gieson’s Stain (VG): Treatment Group: Collagen is seen in bright red color. Cytoplasm, muscle, fibrin and RBC are seen in yellow color. Nucleus is seen in blue color. Positive Control Group: Collagen is seen in bright red color. Cytoplasm, muscle, fibrin and RBC are seen in yellow color. Nucleus is seen in blue color. Negative Control Group: No deposition of collagen is seen.C- Collagen, F- Fibroblast, PMC- Poly Morpho nuclear Cells, M- Mast Cells, N- Nuclei, RE- Re- Epithelialization, S- Scab, BC- Basophilic Cytoplasm.
201
Plate 5.21: Histopathological examination of excised tissues treated with Aegle marmelos
Plate 5.21-C: Tissue stained with Toluidine blue Stain (TB)
5.21-C1) Treatment Group 5.21-C2) Positive Control Group 5.21-C3) Negative Control Group
Plate 5.21-C: Tissue stained with Toluidine blue Stain (TB): Treatment Group: Mast cells are seen in blue color. Positive Control Group: Mast cells are seen in blue color. Negative Control Group: No mast cells are observed which indicates that tissue development has not started.C- Collagen, F- Fibroblast, PMC- Poly Morpho nuclear Cells, M- Mast Cells, N- Nuclei, RE- Re- Epithelialization, S- Scab, BC- Basophilic Cytoplasm.
202
The tissues were stained for nucleus and collagen with Hematoxylin &
Eosin Stain in the treatment group as shown in plate 5.16-A1, 5.17-A1, 5.18-A1,
5.19-A1, 5.20-A1 and 5.21-A1 and positive control group as shown in plate 5.16-
A2, 5.17-A2, 5.18-A2, 5.19-A2, 5.20-A2, and 5.21-A2 which shows collagen in
pink color. Muscle fibres can be observed in deep pink color. Basophilic
cytoplasm is seen in purple color. The nucleus can be seen in blue color. The
formation of collagen and muscle fibres cannot be observed in the negative
control groupas shown in plate 5.16-A3, 5.17-A3, 5.18-A3, 5.19-A3, 5.20-A3 and
5.21-A3. The nucleus is also not formed properly.
The tissues were stained fornucleus, muscle fibres and collagen with Van
Gieson’s Stain in the treatment group as shown in plate 5.16-B1, 5.17-B1, 5.18-
B1, 5.19-B1, 5.20-B1 and 5.21-B1 and positive control group as shown in plate
5.16-B2, 5.17-B2, 5.18-B2, 5.19-B2, 5.20-B2 and 5.21-B2 which shows collagen
in bright red color. The cytoplasm, muscle fibres and fibrin is observed as yellow
color. The nucleus can be seen in blue color. But the formation of collagen and
nucleus cannot be observed in the negative control groupas shown in plate 5.16-
B3, 5.17-B3, 5.18-B3, 5.19-B3, 5.20-B3 and 5.21-B3.
The tissues were stained for mast cells with Toluidine blue Stain in the
treatment group as shown in plate 5.16-C1, 5.17-C1, 5.18-C1, 5.19-C1, 5.20-C1
and 5.21-C1 and as shown in plate 5.16-C2, 5.17-C2, 5.18-C2, 5.19-C2, 5.20-C2
and 5.21-C2 positive control group which shows mast cells in blue color.
Whereas, the mast cells cannot be observed in negative control groupas shown in
plate 5.16-C3, 5.17-C3, 5.18-C3, 5.19-C3, 5.20-C3 and 5.21-C3.
The result of the present study on wound healing activity indicated that the
methanolic extract of the six selected medicinal plants promotes wound healing in
experimental mice. This was demonstrated by a significant decrease in the
wound area and increase in the percentage of wound contraction. The increased
percentage of wound contraction in the methanolic extract treated mice may be
203
due to enhanced activity of fibroblasts in the regenerated wound tissues.
Myofibroblasts are believed to play a major role in the wound contraction by
exerting tension on the surrounding extracellular matrix and secreting
extracellular matrix proteins such as collagen to stabilize the contraction of
wound. Collagen is a major protein of the extracellular matrix and an important
component that ultimately contributes to the wound strength [281].
Angiogenesis is a critical component of wound healing process. Delayed
or aberrant revascularization at the site of wounds contributes to the etiology of
chronic wounds and prolonged and delayed wound healing process [282]. The
methanolic extract treatment on the wounds promoted angiogenesis in the mice as
is evident in the histopathological studies. Free radicals are generated at the site
of injury which impairs the healing process by causing damage to cellular
membranes, nucleotides, proteins and lipids [283].
The use of antioxidants has been shown to increase the wound healing
activity [115]. Flavonoids are efficient antioxidants that is capable of scavenging
the free radicals and has also been reported to play an important role on the
wound healing process in many animal models [284,285,286].
The present study on wound healing activities clearly indicates that the
methanolic extract of the selected medicinal plants promotes the wound healing
process in experimental mice. The treatment of the wounds with the plant extract
augmented the endogenous antioxidants and prevented the free radical mediated
tissue injury. The methanolic extract of the medicinal plants also played a vital
role in the angiogenesis, formation of the extracellular matrix and remodeling
phase of wound healing process in mice.
Wound healing is a very complex, multifactor sequence of events
involving several cellular and biochemical processes. The aim in these processes
is to regenerate and reconstruct the disrupted anatomical continuity and functional
204
status of the skin. Healing process, a natural body reaction to injury, initiates
immediately after wounding and occurs in four stages.
The first phase is coagulation which controls excessive blood loss from the
damaged vessels. The next stage of the healing process is inflammation and
debridement of wound followed by re-epithelialization which includes
proliferation, migration and differentiation of squamous epithelial cells of the
epidermis. In the final stage of the healing process collagen deposition and
remodeling occurs within the dermis.
The results showed wound healing and repair, accelerated by applying gel
of medicinal plant extract which was highlighted by the full thickness coverage of
the wound area by an organized epidermis.Study on animal models showed
enhanced rate of wound contraction and drastic reduction in healingtime than
control, which might be due to enhanced epitheliasation.
The treated woundafter 4 days itself exhibit marked dryness of wound
margins with tissue regeneration.However, histological evaluation showed that,
increased cellular infiltration from hematoxylin and eosin staining in treated cases
may be due to chemo tactic effect enhanced by the crude extract which mighthave
attracted inflammatory cells towards the wound site.
Increased cellular proliferation may be due to the mitogenic activity of the
plant extract, which might have significantly contributed to healing process. Early
dermal and epidermal regeneration in treated mice also confirmed that the extract
had a positive effect towards cellular proliferation, granular tissue formationand
epitheliasation.
The histopathological study revealed increased collagen deposition in the
treatment group as compared to the positive and the negative control group, as
confirmed by the Hematoxylin & Eosin Stain and also by Van Gieson’s Stain
205
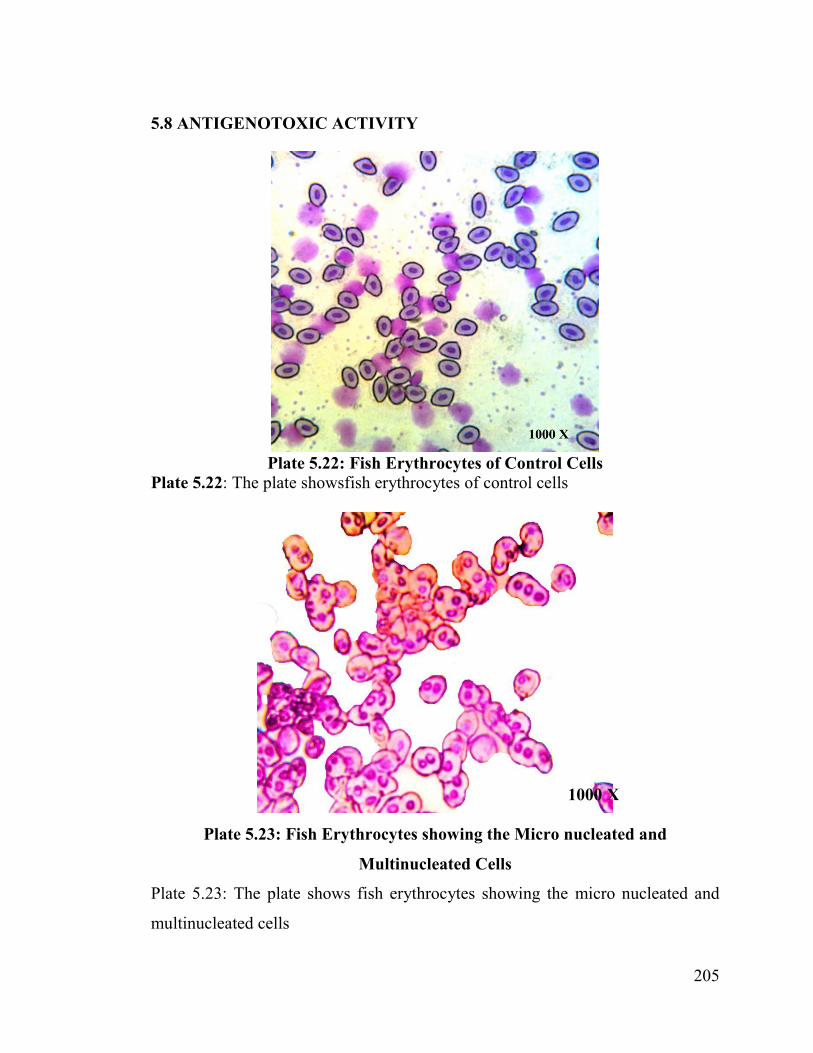
5.8 ANTIGENOTOXIC ACTIVITY
Plate 5.22: Fish Erythrocytes of Control CellsPlate 5.22: The plate showsfish erythrocytes of control cells
Plate 5.23: Fish Erythrocytes showing the Micro nucleated and
Multinucleated Cells
Plate 5.23: The plate shows fish erythrocytes showing the micro nucleated and
multinucleated cells
1000 X
206
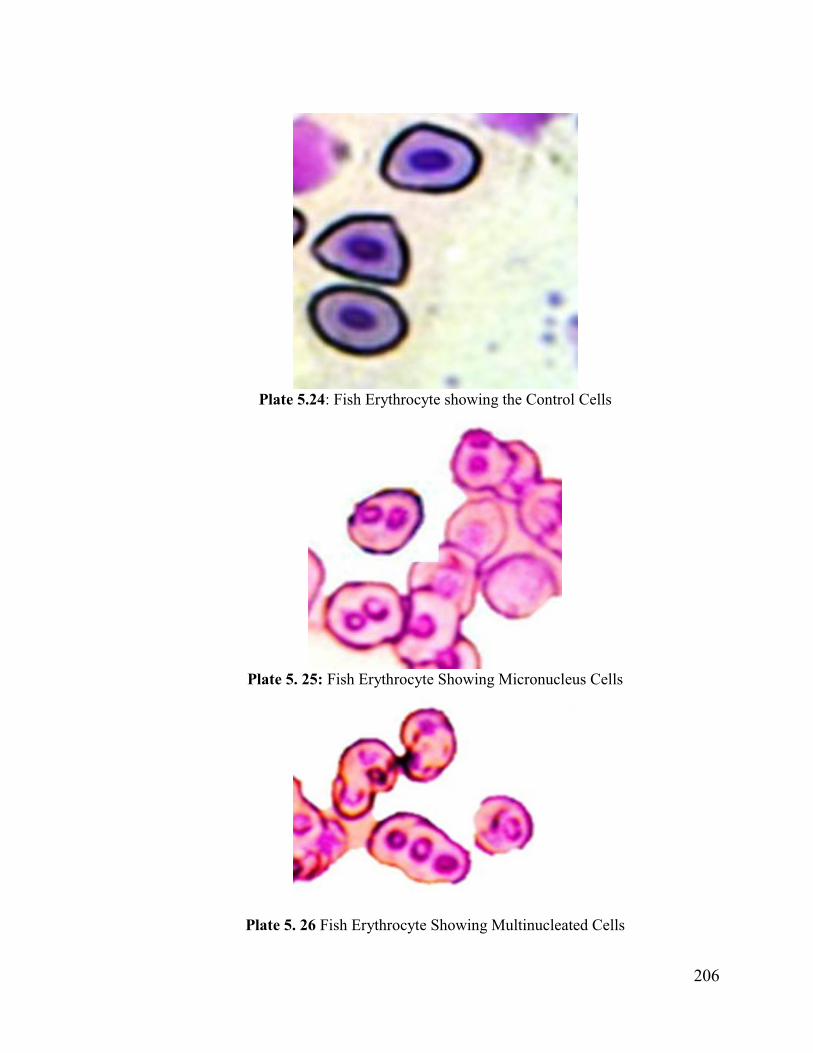
Plate 5.24: Fish Erythrocyte showing the Control Cells
Plate 5. 25: Fish Erythrocyte Showing Micronucleus Cells
Plate 5. 26 Fish Erythrocyte Showing Multinucleated Cells
207
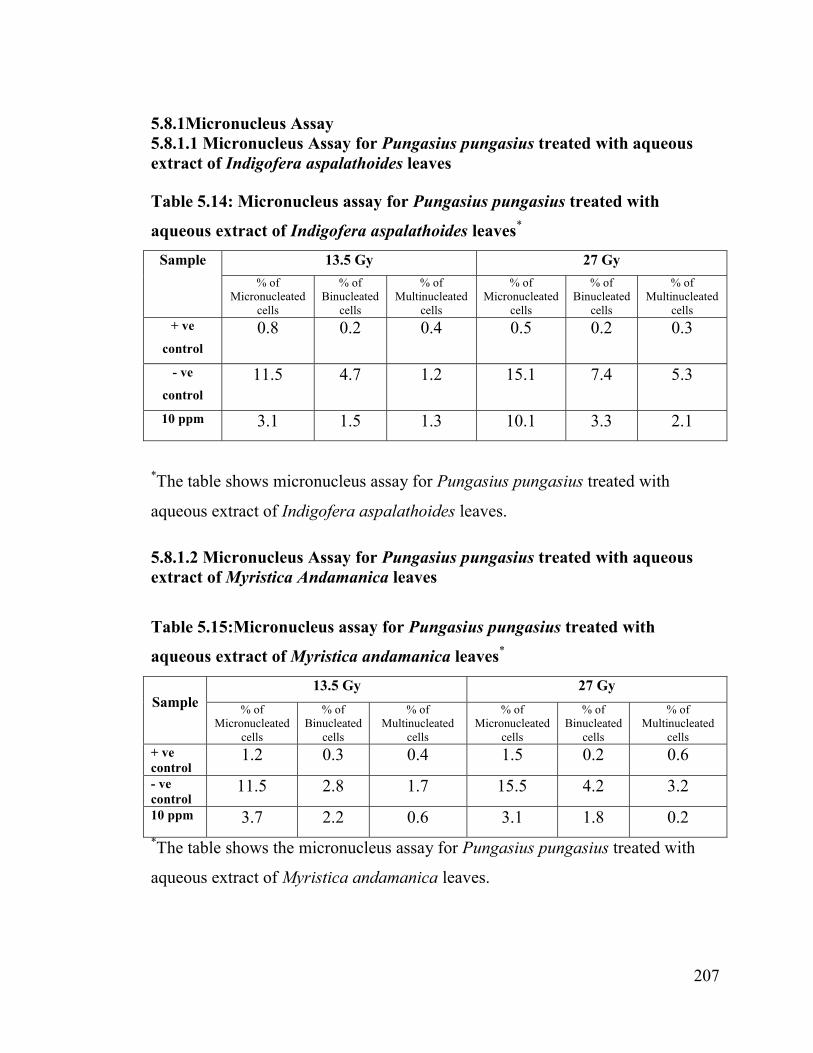
5.8.1Micronucleus Assay 5.8.1.1 Micronucleus Assay for Pungasius pungasius treated with aqueousextract of Indigofera aspalathoides leaves
Table 5.14: Micronucleus assay for Pungasius pungasius treated with
aqueous extract of Indigofera aspalathoides leaves*
Sample 13.5 Gy 27 Gy% of
Micronucleated cells
% of Binucleated
cells
% of Multinucleated
cells
% of Micronucleated
cells
% of Binucleated
cells
% of Multinucleated
cells+ ve
control0.8 0.2 0.4 0.5 0.2 0.3
- ve
control11.5 4.7 1.2 15.1 7.4 5.3
10 ppm 3.1 1.5 1.3 10.1 3.3 2.1
*The table shows micronucleus assay for Pungasius pungasius treated with
aqueous extract of Indigofera aspalathoides leaves.
5.8.1.2 Micronucleus Assay for Pungasius pungasius treated with aqueousextract of Myristica Andamanica leaves
Table 5.15:Micronucleus assay for Pungasius pungasius treated with
aqueous extract of Myristica andamanica leaves*
Sample13.5 Gy 27 Gy
% of Micronucleated
cells
% of Binucleated
cells
% of Multinucleated
cells
% of Micronucleated
cells
% of Binucleated
cells
% of Multinucleated
cells+ ve control
1.2 0.3 0.4 1.5 0.2 0.6- ve control
11.5 2.8 1.7 15.5 4.2 3.210 ppm 3.7 2.2 0.6 3.1 1.8 0.2*The table shows the micronucleus assay for Pungasius pungasius treated with
aqueous extract of Myristica andamanica leaves.

208
5.8.1.3 Micronucleus Assay for Pungasius pungasius treated with aqueousextract of Adhatoda Vasica leaves
Table 5.16: Micronucleus assay for Pungasius pungasius treated with
aqueous extract of Adhatoda vasica leaves*
Sample 13.5 Gy 27 Gy% of
Micronucleated cells
% of Binucleated
cells
% of Multinucleated
cells
% of Micronucleated
cells
% of Binucleated
cells
% of Multinucleated
cells+ ve
control0.5 0.1 0.2 0.1 0.1 0.2
- ve
control14.1 5.5 1.9 8.9 6.2 2.1
10 ppm 2.2 1.7 0.2 0.8 2.4 0.8
*The table shows micronucleus assay for Pungasius pungasius treated with
aqueous extract of Adhatoda vasica leaves.
5.8.1.4 Micronucleus Assay for Pungasius pungasius treated with aqueousextract of Azadirachta indica leaves
Table 5.17: Micronucleus assay for Pungasius pungasius treated with
aqueous extract of Azadirachta indica leaves*
Sample 13.5 Gy 27 Gy% of
Micronucleated cells
% of Binucleated
cells
% of Multinucleated
cells
% of Micronucleated
cells
% of Binucleated
cells
% of Multinucleated
cells+ ve
control1.7 0.5 0.7 1.7 0.7 0.6
- ve
control12.4 5 1.5 16 7.7 5.6
10 ppm 3.9 1.8 1.6 10.9 3.6 2.4*The table shows micronucleus assay for Pungasius pungasius treated with
aqueous extract of Azadirachta indica leaves.
209
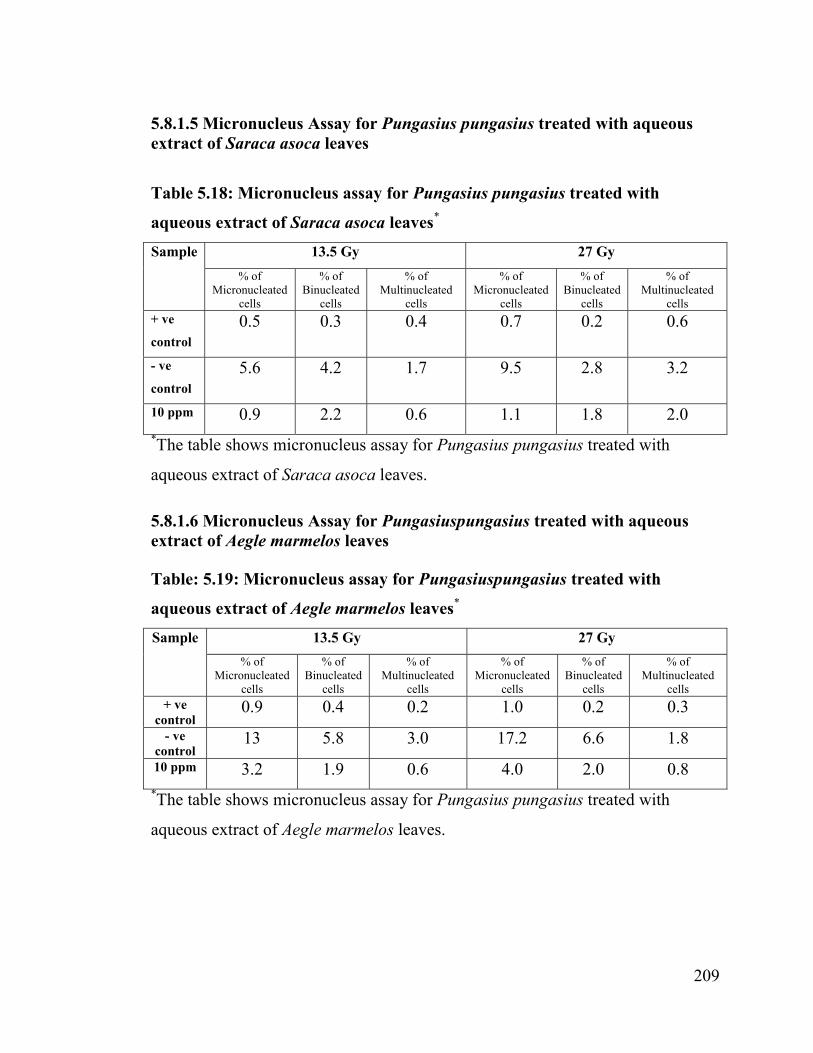
5.8.1.5 Micronucleus Assay for Pungasius pungasius treated with aqueousextract of Saraca asoca leaves
Table 5.18: Micronucleus assay for Pungasius pungasius treated with
aqueous extract of Saraca asoca leaves*
Sample 13.5 Gy 27 Gy% of
Micronucleated cells
% of Binucleated
cells
% of Multinucleated
cells
% of Micronucleated
cells
% of Binucleated
cells
% of Multinucleated
cells+ ve
control0.5 0.3 0.4 0.7 0.2 0.6
- ve
control5.6 4.2 1.7 9.5 2.8 3.2
10 ppm 0.9 2.2 0.6 1.1 1.8 2.0*The table shows micronucleus assay for Pungasius pungasius treated with
aqueous extract of Saraca asoca leaves.
5.8.1.6 Micronucleus Assay for Pungasiuspungasius treated with aqueousextract of Aegle marmelos leaves
Table: 5.19: Micronucleus assay for Pungasiuspungasius treated with
aqueous extract of Aegle marmelos leaves*
Sample 13.5 Gy 27 Gy% of
Micronucleated cells
% of Binucleated
cells
% of Multinucleated
cells
% of Micronucleated
cells
% of Binucleated
cells
% of Multinucleated
cells+ ve
control0.9 0.4 0.2 1.0 0.2 0.3
- ve control
13 5.8 3.0 17.2 6.6 1.810 ppm 3.2 1.9 0.6 4.0 2.0 0.8
*The table shows micronucleus assay for Pungasius pungasius treated with
aqueous extract of Aegle marmelos leaves.
210
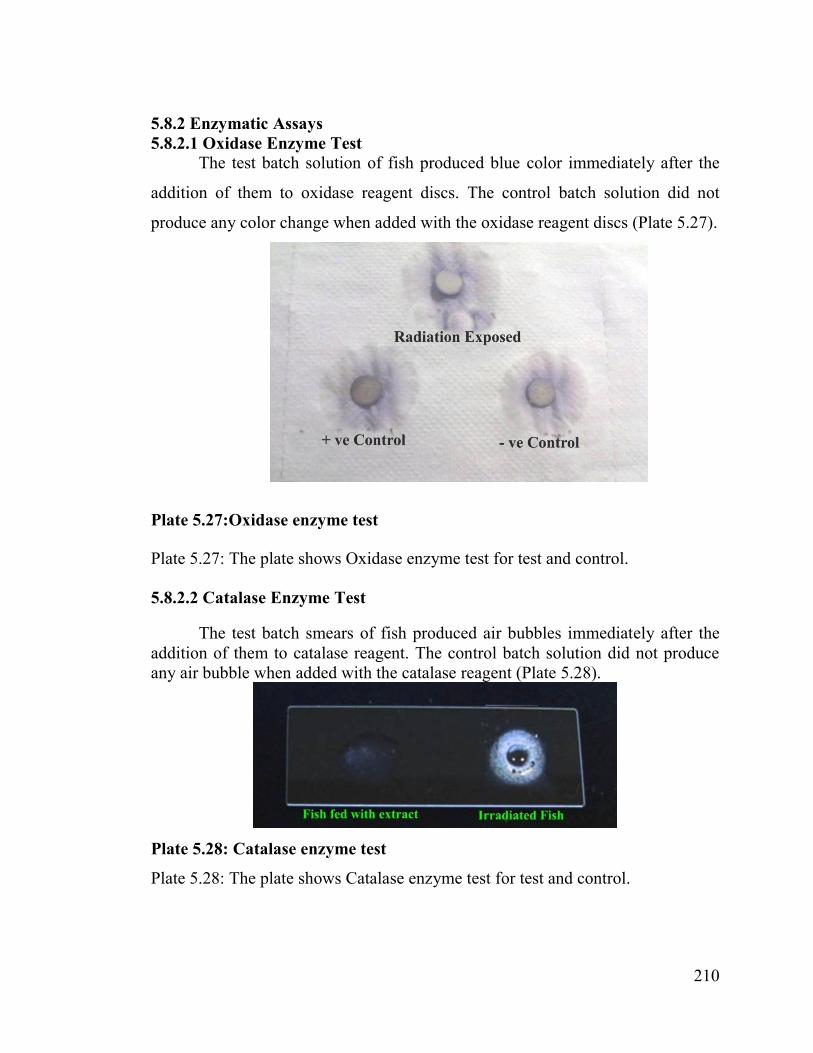
5.8.2 Enzymatic Assays 5.8.2.1 Oxidase Enzyme Test
The test batch solution of fish produced blue color immediately after the
addition of them to oxidase reagent discs. The control batch solution did not
produce any color change when added with the oxidase reagent discs (Plate 5.27).
Plate 5.27:Oxidase enzyme test
Plate 5.27: The plate shows Oxidase enzyme test for test and control.
5.8.2.2 Catalase Enzyme Test
The test batch smears of fish produced air bubbles immediately after the addition of them to catalase reagent. The control batch solution did not produce any air bubble when added with the catalase reagent (Plate 5.28).
Plate 5.28: Catalase enzyme test
Plate 5.28: The plate shows Catalase enzyme test for test and control.
211
5.9 ISOLATION AND PURIFICATION OF BIOACTIVE INGREDIENT FROM INDIGOFERA ASPALATHOIDES
5.9.1 Purification of Active Ingredient From Indigofera aspalathoides
• Column Chromatography Fractionation ratio:
Ethyl acetate: Hexane = 15:35
• TLC solvent ratio:
Ethyl acetate: Hexane = 2:8
• Rf : 9.2
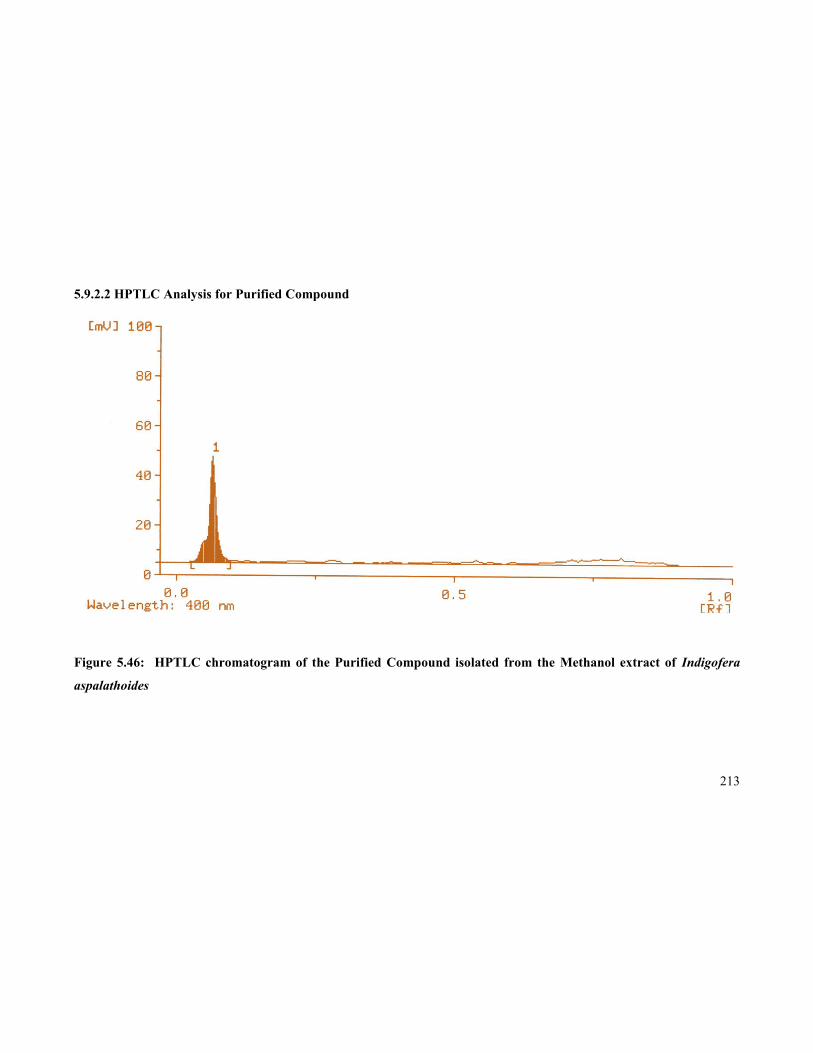
5.9.2 Results for The Purity Of The Active Ingredient Isolated From Indigofera aspalathoides
The purity of the isolated and purified bioactive compound was confirmed
after several HPTLC analysis was done and checked to obtain a single peak
without any contamination.
212
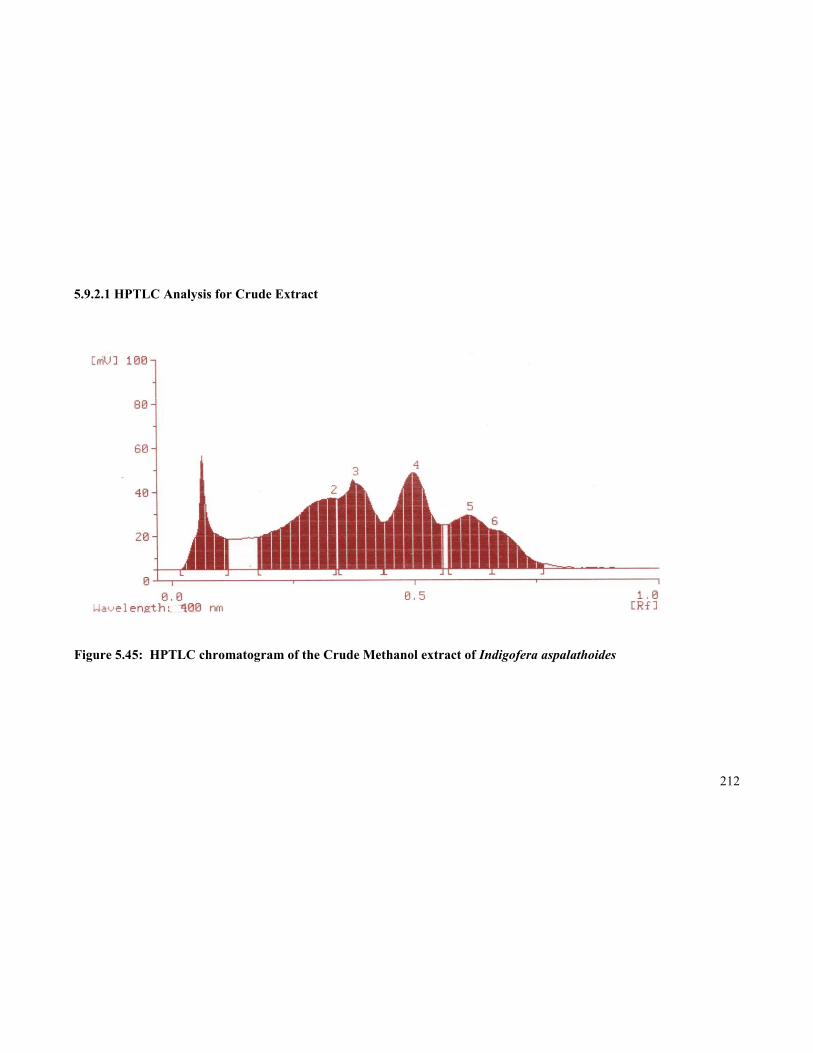
5.9.2.1 HPTLC Analysis for Crude Extract
Figure 5.45: HPTLC chromatogram of the Crude Methanol extract of Indigofera aspalathoides
213
5.9.2.2 HPTLC Analysis for Purified Compound
Figure 5.46: HPTLC chromatogram of the Purified Compound isolated from the Methanol extract of Indigofera
aspalathoides
214
5.9.3 Identification of the Isolated and Purified Bioactive Compound
Identification of the isolated and purified bioactive ingredient from the
first peak was done using UV visible spectroscopy, FTIR spectroscopy, Mass
spectroscopy, 1H Nuclear Magnetic Resonance and 13C Nuclear Magnetic
Resonance.
5.9.4 Structural Elucidation Of The Isolated And Purified Bioactive Compound From Indigofera aspalathoides
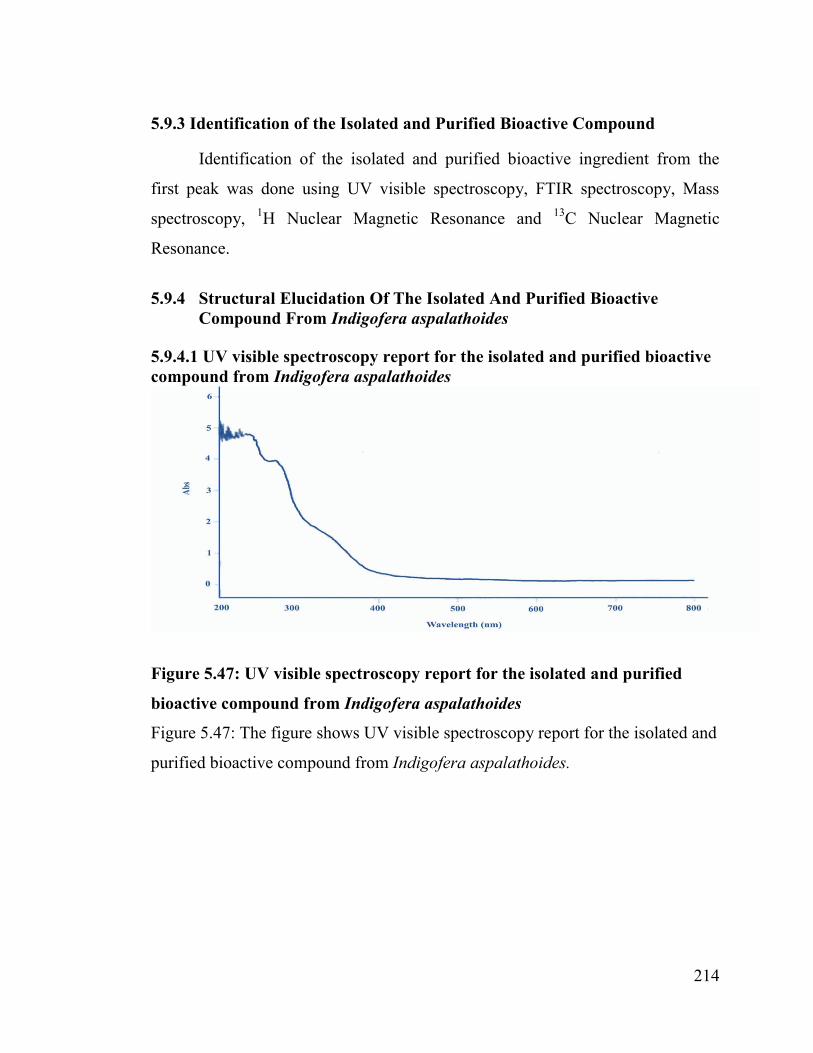
5.9.4.1 UV visible spectroscopy report for the isolated and purified bioactive compound from Indigofera aspalathoides
Figure 5.47: UV visible spectroscopy report for the isolated and purified
bioactive compound from Indigofera aspalathoides
Figure 5.47: The figure shows UV visible spectroscopy report for the isolated and
purified bioactive compound from Indigofera aspalathoides.
215
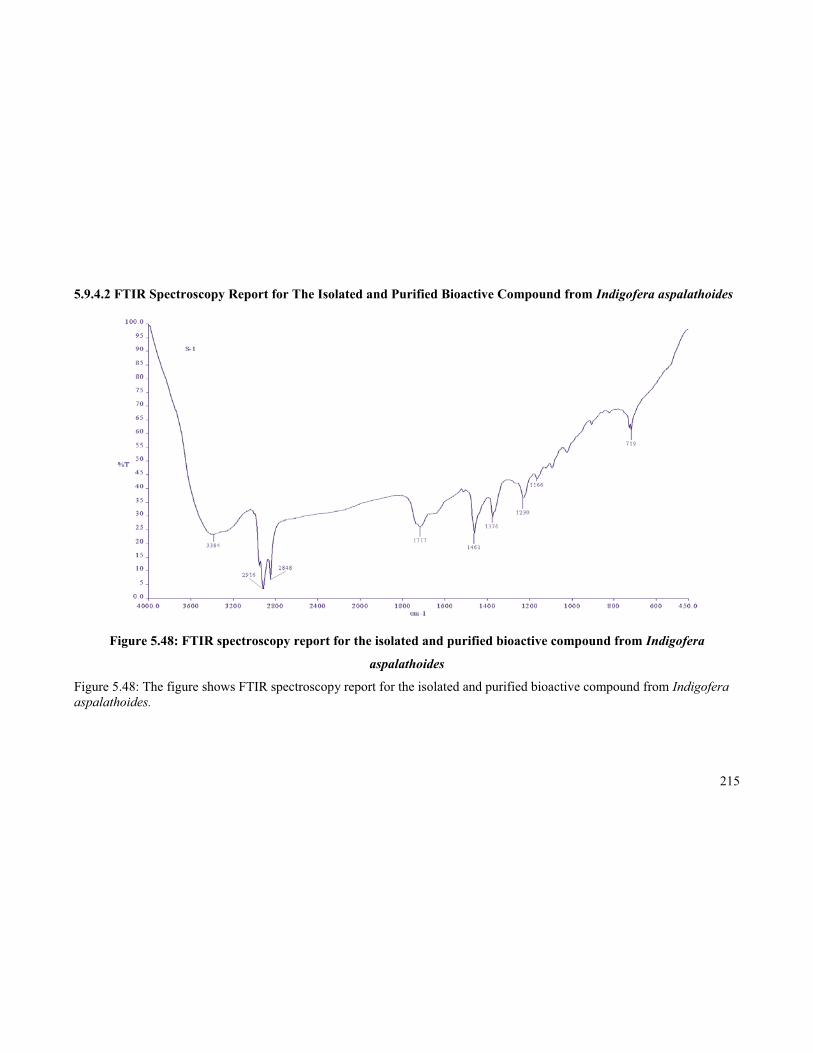
5.9.4.2 FTIR Spectroscopy Report for The Isolated and Purified Bioactive Compound from Indigofera aspalathoides
Figure 5.48: FTIR spectroscopy report for the isolated and purified bioactive compound from Indigofera
aspalathoides
Figure 5.48: The figure shows FTIR spectroscopy report for the isolated and purified bioactive compound from Indigofera aspalathoides.
216
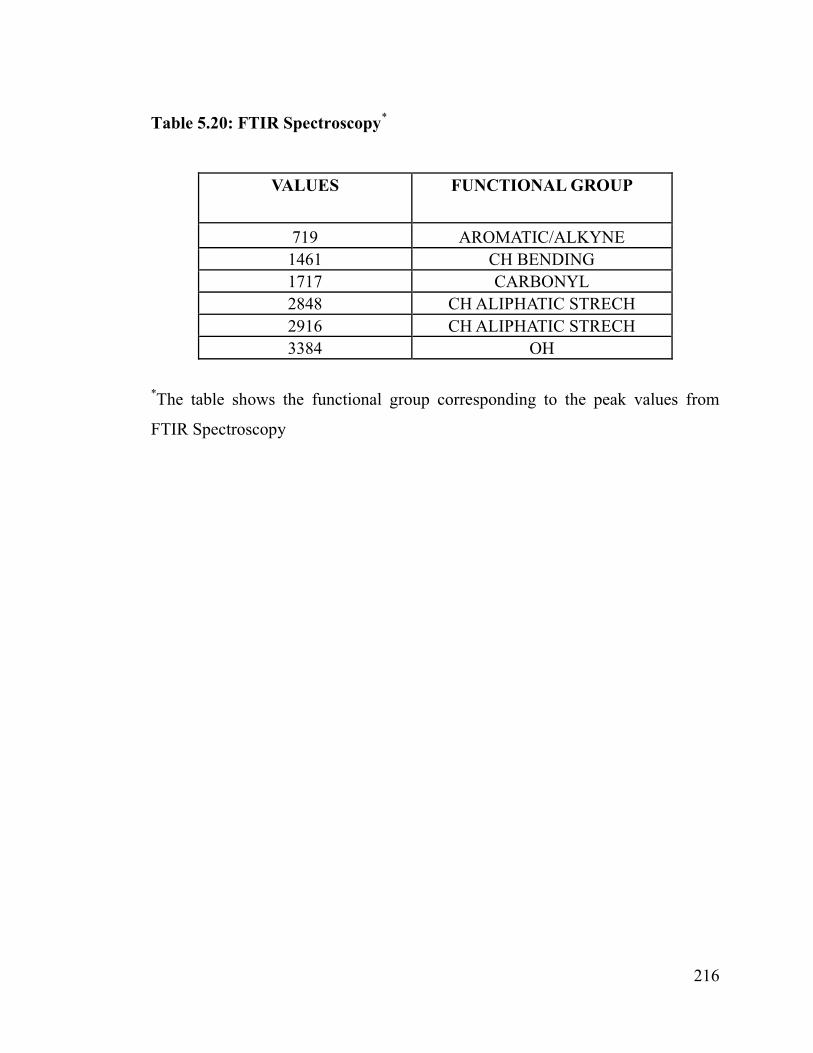
Table 5.20: FTIR Spectroscopy*
VALUES FUNCTIONAL GROUP
719 AROMATIC/ALKYNE1461 CH BENDING1717 CARBONYL2848 CH ALIPHATIC STRECH2916 CH ALIPHATIC STRECH3384 OH
*The table shows the functional group corresponding to the peak values from
FTIR Spectroscopy
217
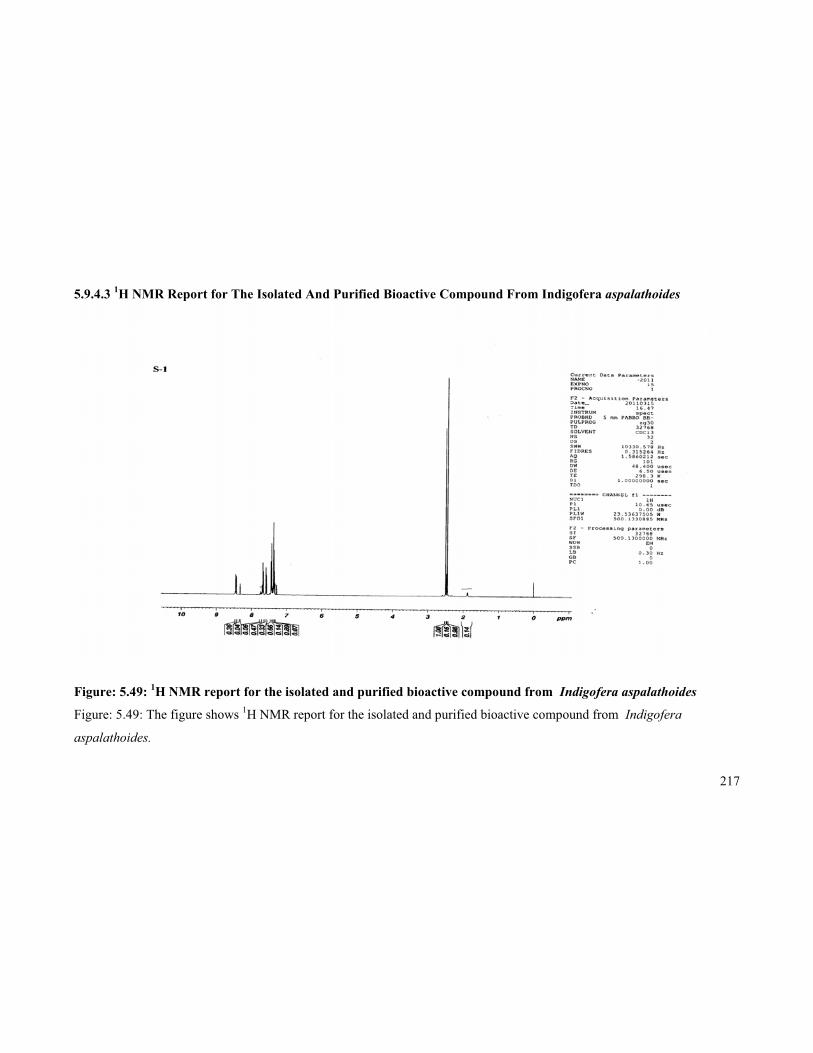
5.9.4.3 1H NMR Report for The Isolated And Purified Bioactive Compound From Indigofera aspalathoides
Figure: 5.49: 1H NMR report for the isolated and purified bioactive compound from Indigofera aspalathoides
Figure: 5.49: The figure shows 1H NMR report for the isolated and purified bioactive compound from Indigofera
aspalathoides.
218
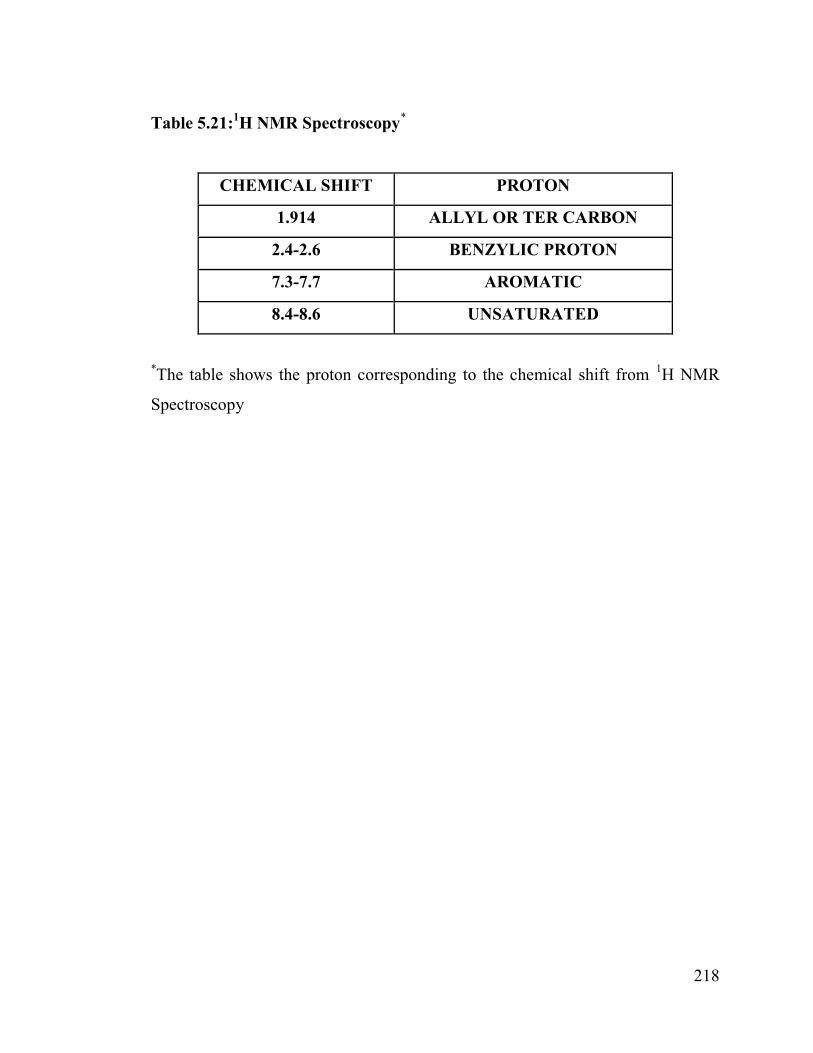
Table 5.21:1H NMR Spectroscopy*
CHEMICAL SHIFT PROTON
1.914 ALLYL OR TER CARBON
2.4-2.6 BENZYLIC PROTON
7.3-7.7 AROMATIC
8.4-8.6 UNSATURATED
*The table shows the proton corresponding to the chemical shift from 1H NMR
Spectroscopy
219
5.9.4.4 13C NMR Report for the Isolated And Purified Bioactive Compound From Indigofera aspalathoides
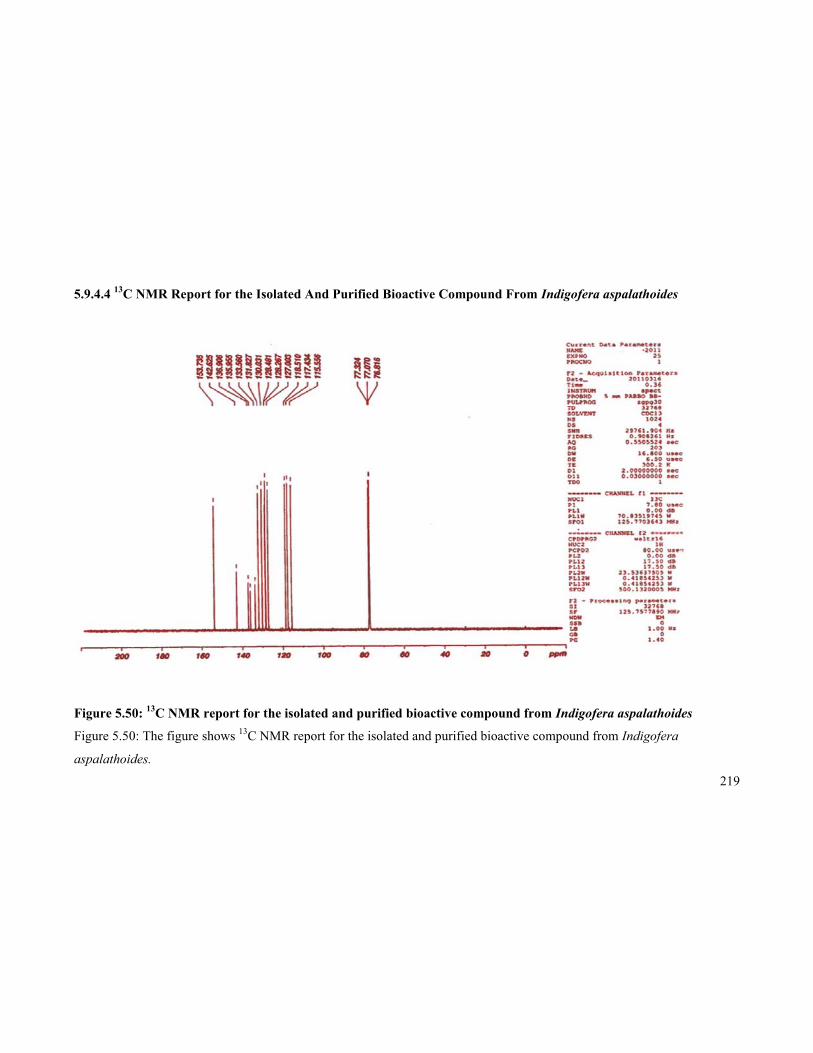
Figure 5.50: 13C NMR report for the isolated and purified bioactive compound from Indigofera aspalathoides
Figure 5.50: The figure shows 13C NMR report for the isolated and purified bioactive compound from Indigofera
aspalathoides.
220
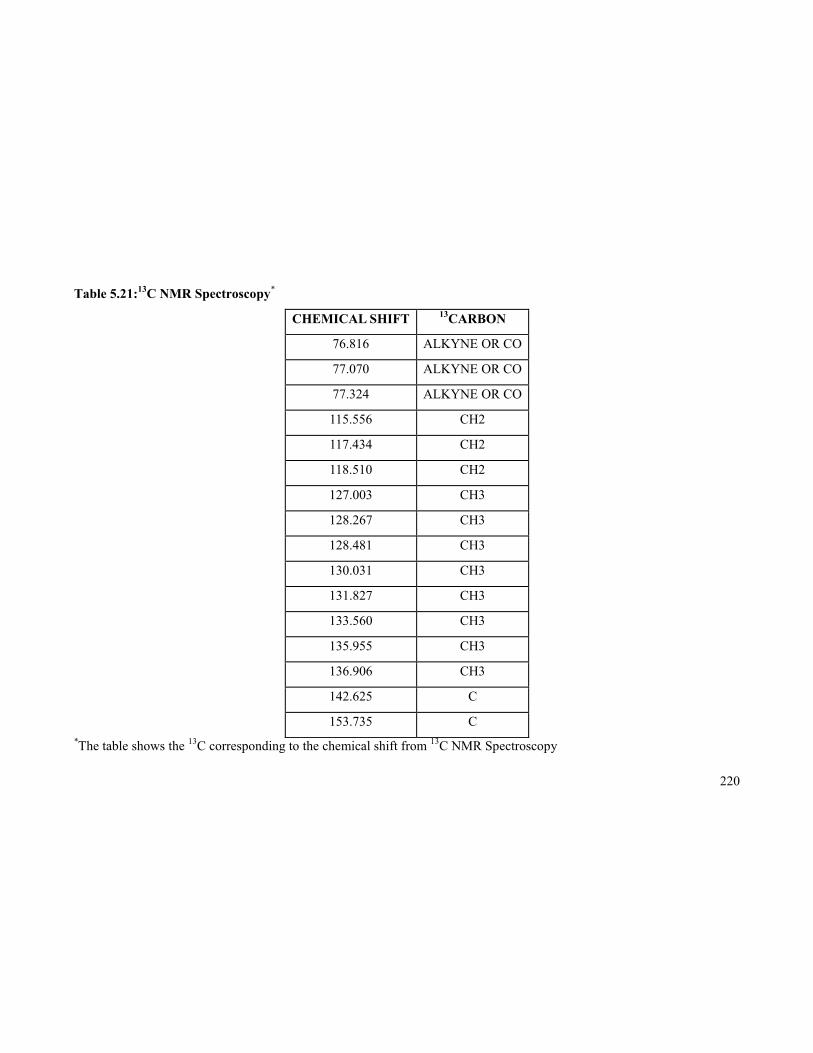
Table 5.21:13C NMR Spectroscopy*
CHEMICAL SHIFT 13CARBON
76.816 ALKYNE OR CO
77.070 ALKYNE OR CO
77.324 ALKYNE OR CO
115.556 CH2
117.434 CH2
118.510 CH2
127.003 CH3
128.267 CH3
128.481 CH3
130.031 CH3
131.827 CH3
133.560 CH3
135.955 CH3
136.906 CH3
142.625 C
153.735 C*The table shows the 13C corresponding to the chemical shift from 13C NMR Spectroscopy
221
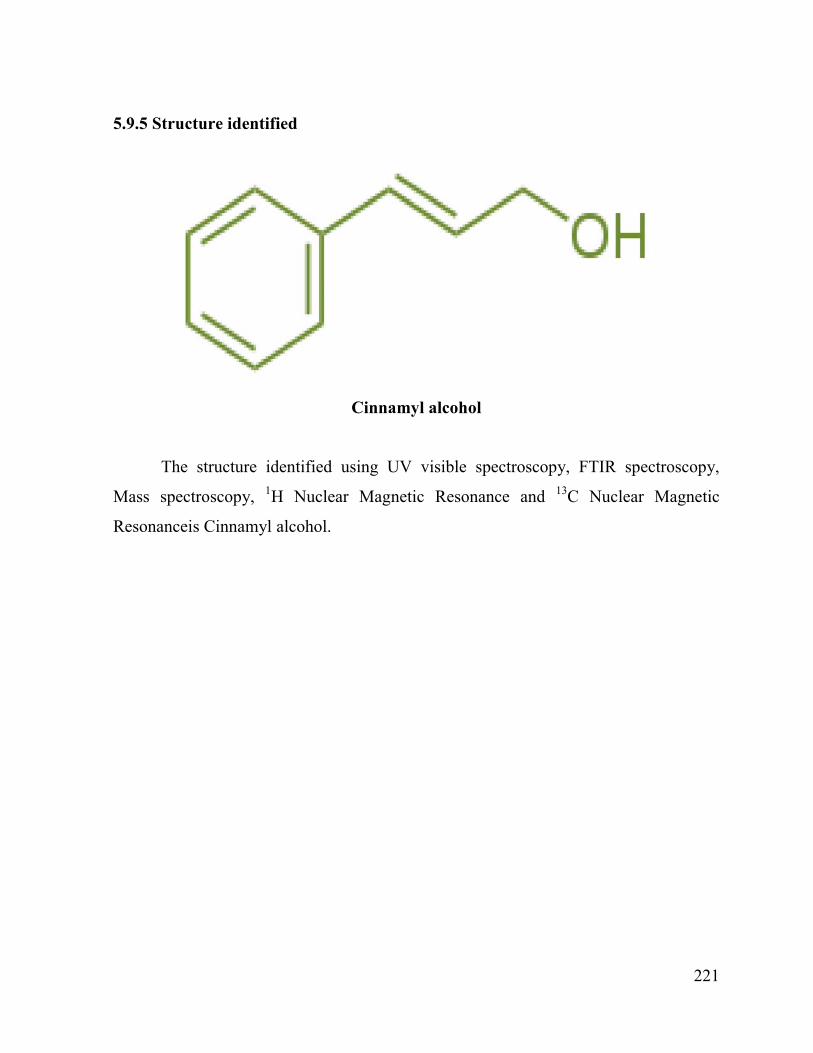
5.9.5 Structure identified
Cinnamyl alcohol
The structure identified using UV visible spectroscopy, FTIR spectroscopy,
Mass spectroscopy, 1H Nuclear Magnetic Resonance and 13C Nuclear Magnetic
Resonanceis Cinnamyl alcohol.