Embed Size (px)
Citation preview
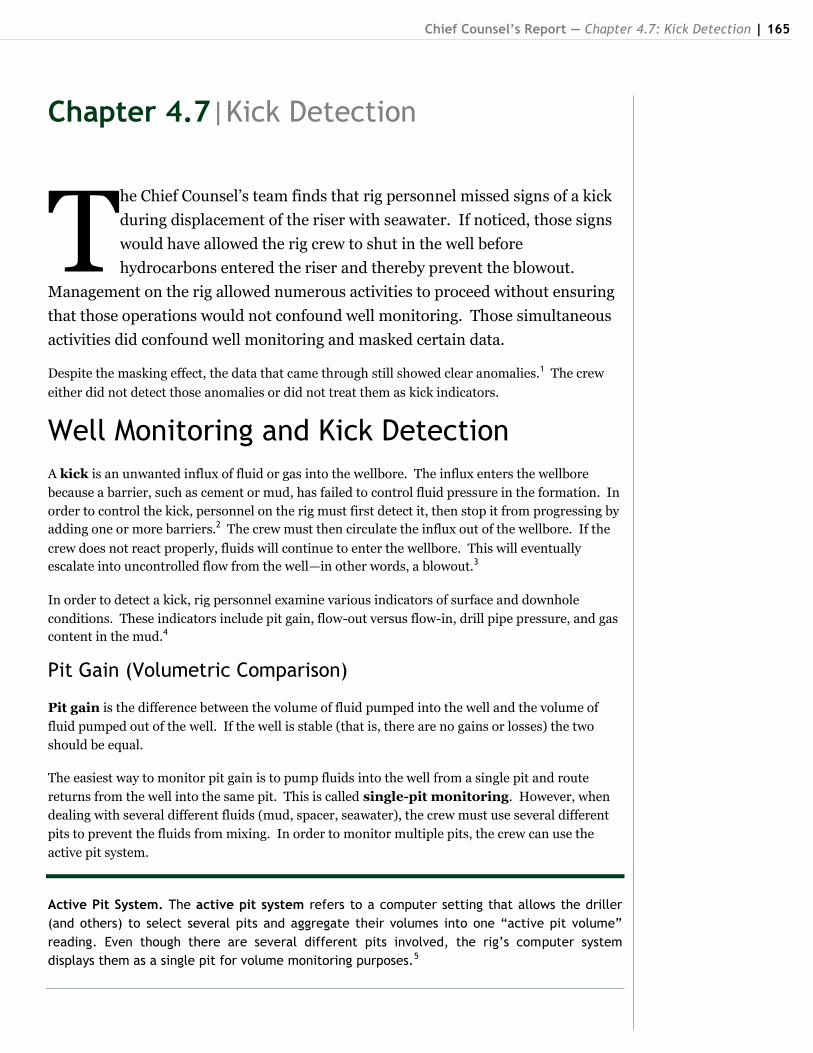
Chief Counsel’s Report — Chapter 4.7: Kick Detection | 165
Chapter 4.7|Kick Detection
he Chief Counsel‘s team finds that rig personnel missed signs of a kick
during displacement of the riser with seawater. If noticed, those signs
would have allowed the rig crew to shut in the well before
hydrocarbons entered the riser and thereby prevent the blowout.
Management on the rig allowed numerous activities to proceed without ensuring
that those operations would not confound well monitoring. Those simultaneous
activities did confound well monitoring and masked certain data.
Despite the masking effect, the data that came through still showed clear anomalies.1 The crew
either did not detect those anomalies or did not treat them as kick indicators.
Well Monitoring and Kick Detection
A kick is an unwanted influx of fluid or gas into the wellbore. The influx enters the wellbore
because a barrier, such as cement or mud, has failed to control fluid pressure in the formation. In
order to control the kick, personnel on the rig must first detect it, then stop it from progressing by
adding one or more barriers.2 The crew must then circulate the influx out of the wellbore. If the
crew does not react properly, fluids will continue to enter the wellbore. This will eventually
escalate into uncontrolled flow from the well—in other words, a blowout.3
In order to detect a kick, rig personnel examine various indicators of surface and downhole
conditions. These indicators include pit gain, flow-out versus flow-in, drill pipe pressure, and gas
content in the mud.4
Pit Gain (Volumetric Comparison)
Pit gain is the difference between the volume of fluid pumped into the well and the volume of
fluid pumped out of the well. If the well is stable (that is, there are no gains or losses) the two
should be equal.
The easiest way to monitor pit gain is to pump fluids into the well from a single pit and route
returns from the well into the same pit. This is called single-pit monitoring. However, when
dealing with several different fluids (mud, spacer, seawater), the crew must use several different
pits to prevent the fluids from mixing. In order to monitor multiple pits, the crew can use the
active pit system.
Active Pit System. The active pit system refers to a computer setting that allows the driller
(and others) to select several pits and aggregate their volumes into one “active pit volume”
reading. Even though there are several different pits involved, the rig’s computer system
displays them as a single pit for volume monitoring purposes.5
T
166 | National Commission on the BP Deepwater Horizon Oil Spill and Offshore Drilling
Sperry-Sun data/TrialGraphix
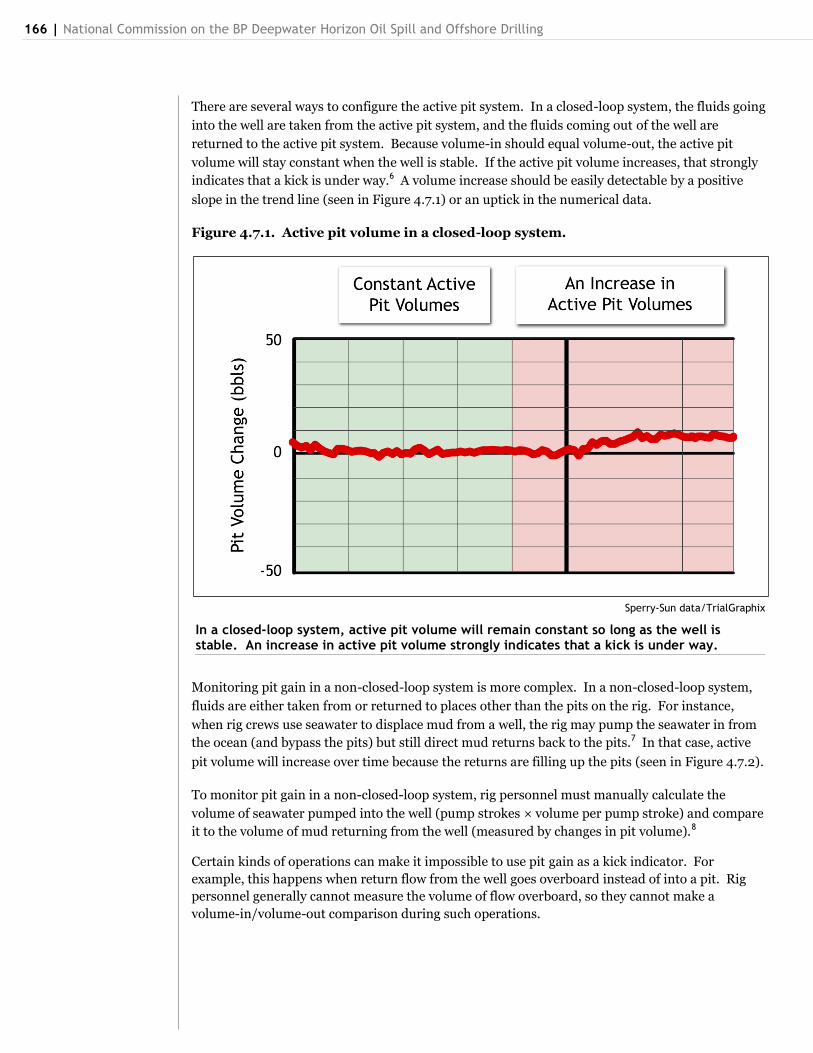
In a closed-loop system, active pit volume will remain constant so long as the well is stable. An increase in active pit volume strongly indicates that a kick is under way.
There are several ways to configure the active pit system. In a closed-loop system, the fluids going
into the well are taken from the active pit system, and the fluids coming out of the well are
returned to the active pit system. Because volume-in should equal volume-out, the active pit
volume will stay constant when the well is stable. If the active pit volume increases, that strongly
indicates that a kick is under way.6 A volume increase should be easily detectable by a positive
slope in the trend line (seen in Figure 4.7.1) or an uptick in the numerical data.
Figure 4.7.1. Active pit volume in a closed-loop system.
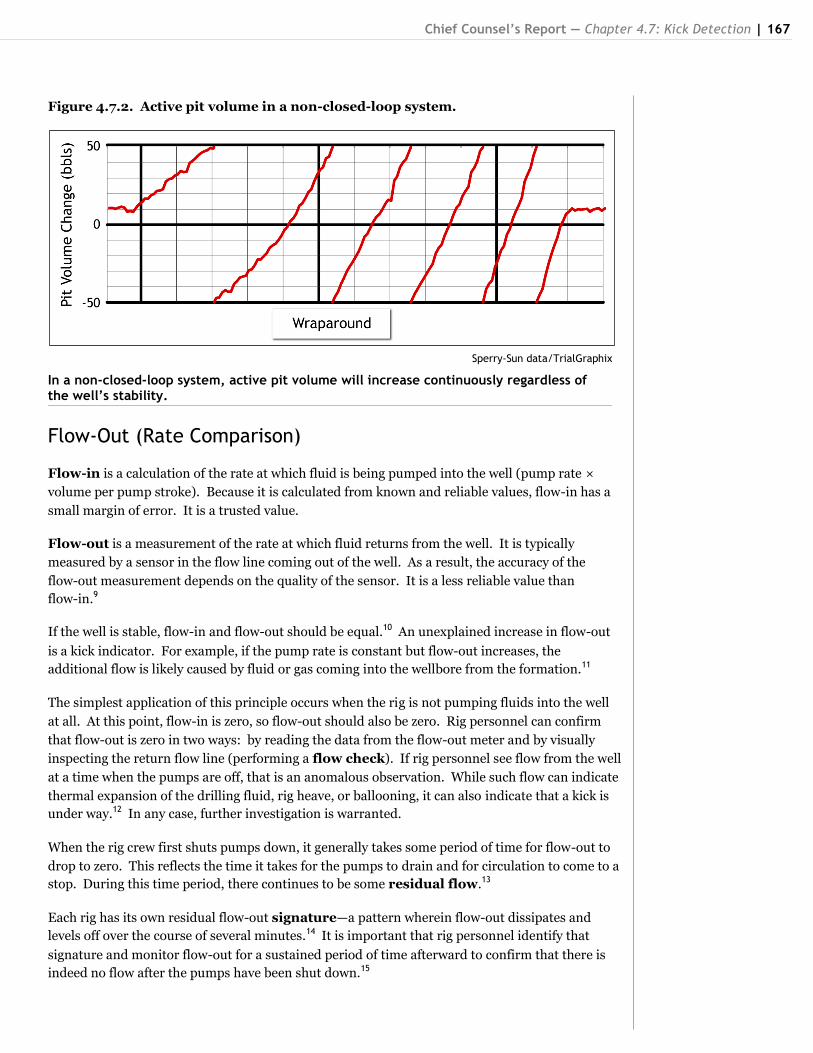
Monitoring pit gain in a non-closed-loop system is more complex. In a non-closed-loop system,
fluids are either taken from or returned to places other than the pits on the rig. For instance,
when rig crews use seawater to displace mud from a well, the rig may pump the seawater in from
the ocean (and bypass the pits) but still direct mud returns back to the pits.7 In that case, active
pit volume will increase over time because the returns are filling up the pits (seen in Figure 4.7.2).
To monitor pit gain in a non-closed-loop system, rig personnel must manually calculate the
volume of seawater pumped into the well (pump strokes × volume per pump stroke) and compare
it to the volume of mud returning from the well (measured by changes in pit volume).8
Certain kinds of operations can make it impossible to use pit gain as a kick indicator. For
example, this happens when return flow from the well goes overboard instead of into a pit. Rig
personnel generally cannot measure the volume of flow overboard, so they cannot make a
volume-in/volume-out comparison during such operations.
Chief Counsel’s Report — Chapter 4.7: Kick Detection | 167
Figure 4.7.2. Active pit volume in a non-closed-loop system.
Flow-Out (Rate Comparison)
Flow-in is a calculation of the rate at which fluid is being pumped into the well (pump rate ×
volume per pump stroke). Because it is calculated from known and reliable values, flow-in has a
small margin of error. It is a trusted value.
Flow-out is a measurement of the rate at which fluid returns from the well. It is typically
measured by a sensor in the flow line coming out of the well. As a result, the accuracy of the
flow-out measurement depends on the quality of the sensor. It is a less reliable value than
flow-in.9
If the well is stable, flow-in and flow-out should be equal.10 An unexplained increase in flow-out
is a kick indicator. For example, if the pump rate is constant but flow-out increases, the
additional flow is likely caused by fluid or gas coming into the wellbore from the formation.11
The simplest application of this principle occurs when the rig is not pumping fluids into the well
at all. At this point, flow-in is zero, so flow-out should also be zero. Rig personnel can confirm
that flow-out is zero in two ways: by reading the data from the flow-out meter and by visually
inspecting the return flow line (performing a flow check). If rig personnel see flow from the well
at a time when the pumps are off, that is an anomalous observation. While such flow can indicate
thermal expansion of the drilling fluid, rig heave, or ballooning, it can also indicate that a kick is
under way.12 In any case, further investigation is warranted.
When the rig crew first shuts pumps down, it generally takes some period of time for flow-out to
drop to zero. This reflects the time it takes for the pumps to drain and for circulation to come to a
stop. During this time period, there continues to be some residual flow.13
Each rig has its own residual flow-out signature—a pattern wherein flow-out dissipates and
levels off over the course of several minutes.14 It is important that rig personnel identify that
signature and monitor flow-out for a sustained period of time afterward to confirm that there is
indeed no flow after the pumps have been shut down.15
Sperry-Sun data/TrialGraphix
In a non-closed-loop system, active pit volume will increase continuously regardless of the well’s stability.
168 | National Commission on the BP Deepwater Horizon Oil Spill and Offshore Drilling
Flow checks constitute an important safeguard and ―double-check‖ ensuring that the well is
secure. It is therefore a common practice to assign one member of the rig crew to always visually
confirm that flow has stopped whenever the pumps have been shut down, and announce it to the
rest of the rig‘s personnel.
Drill Pipe Pressure
Drill pipe pressure is a measurement of the pressure exerted by fluids inside the drill pipe.16
When the rig pumps are off, drill pipe pressure should remain constant.17 When the density of
fluids in the well outside the drill pipe is higher than the density of fluids inside the drill pipe, drill
pipe pressure will be positive. This is because the heavier fluid outside the drill pipe exerts a
u-tube pressure on the fluids inside the drill pipe.
When the rig crew turns pumps on, drill pipe pressure will fluctuate depending on the relative
densities of fluids inside and outside of the drill pipe and the circulating friction generated by
moving those fluids.18 When the pumps are pushing lighter fluid down the drill pipe to displace
heavier fluid outside it, drill pipe pressure should steadily decrease as the lighter fluid displaces
the heavier one.
Drill pipe pressure can be a difficult kick indicator to interpret because so many different factors
can affect that pressure. For instance, drill pipe pressure might change because of a washout in
the drill pipe or wear-out of the pump discharge valves.19 But such causes should still prompt the
driller to stop and check that the rig and well are all right.20
In a situation where there are changing fluid densities, changing pump rates, and changing
wellbore geometry, close monitoring of drill pipe pressure can be facilitated by advance planning
and charts describing what pressures to expect.21 Unexplained fluctuations in drill pipe pressure
can indicate a kick.
Some kicks exhibit an increase in drill pipe pressure,22 although an increase can also indicate a
clog in the pipe or that the crew is pumping the wrong fluids into the well.23 More commonly, it is
a decrease in drill pipe pressure that indicates a kick; lighter oil and gas flow into the annulus
around the drill pipe and thereby lower the drill pipe pressure.24 But a decrease in drill pipe
pressure can also indicate a hole in the drill pipe.25 In any case, unexplained fluctuations in drill
pipe pressure are a cause for concern and warrant further investigation.26
Gas Content
Gas content refers to the amount of gas dissolved or contained in a fluid. Fluid returns from a
well can contain gas for several reasons. Some amount of gas is often present in a well during
normal operations, depending on the mud type and the location of the well. And ―trip gas‖
appears when tripping out of the hole and conducting a bottoms up circulation after a trip.
An increase in the gas content of fluid returns over time can indicate an increase in pore
pressure,27 penetration of a hydrocarbon-bearing zone, or a change in wellbore dynamics allowing
more effective cuttings removal.28 But unexplained increases in gas content are always a cause for
concern. They can indicate either that a kick is occurring or that wellbore conditions are
becoming conducive for a kick.29
Chief Counsel’s Report — Chapter 4.7: Kick Detection | 169
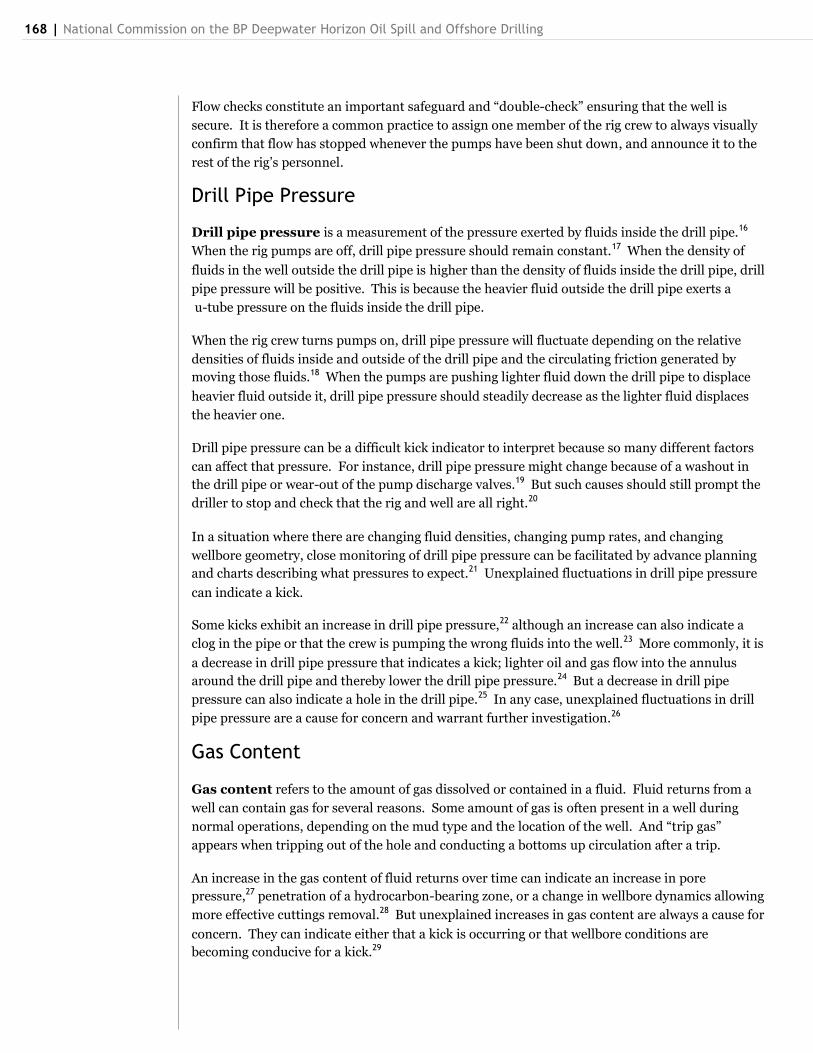
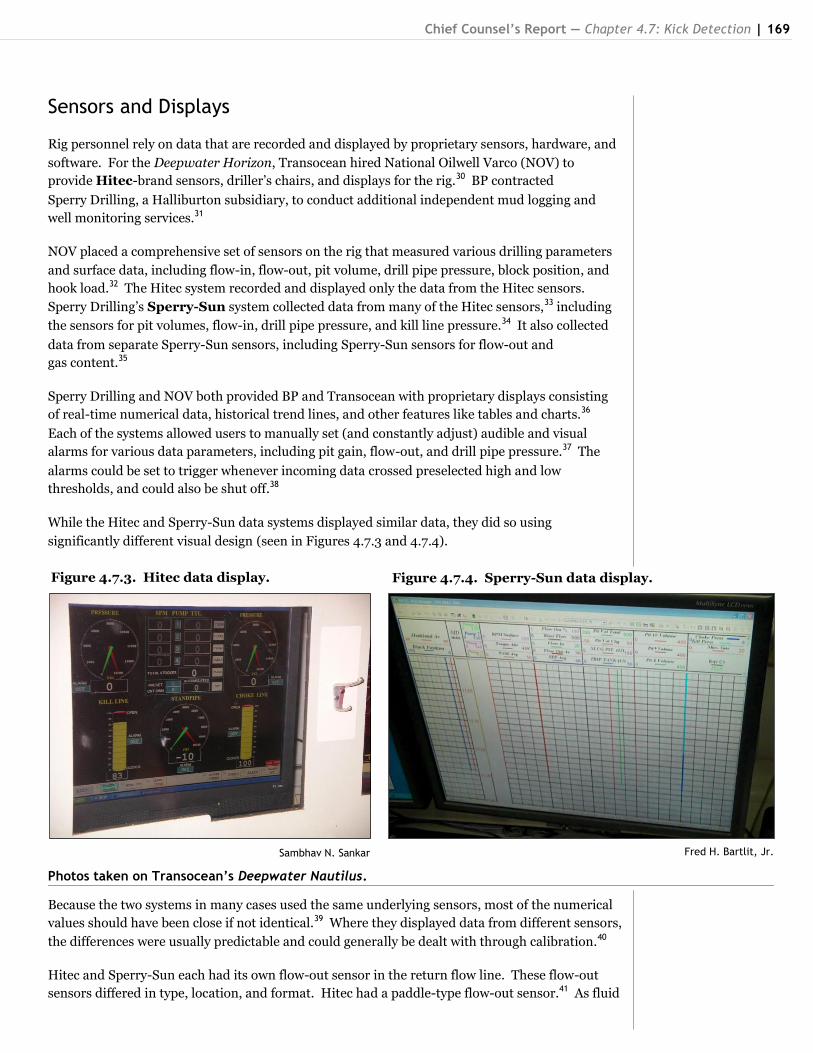
Figure 4.7.4. Sperry-Sun data display. Figure 4.7.3. Hitec data display.
Fred H. Bartlit, Jr.
Photos taken on Transocean’s Deepwater Nautilus.
Sensors and Displays
Rig personnel rely on data that are recorded and displayed by proprietary sensors, hardware, and
software. For the Deepwater Horizon, Transocean hired National Oilwell Varco (NOV) to
provide Hitec-brand sensors, driller‘s chairs, and displays for the rig.30 BP contracted
Sperry Drilling, a Halliburton subsidiary, to conduct additional independent mud logging and
well monitoring services.31
NOV placed a comprehensive set of sensors on the rig that measured various drilling parameters
and surface data, including flow-in, flow-out, pit volume, drill pipe pressure, block position, and
hook load.32 The Hitec system recorded and displayed only the data from the Hitec sensors.
Sperry Drilling‘s Sperry-Sun system collected data from many of the Hitec sensors,33 including
the sensors for pit volumes, flow-in, drill pipe pressure, and kill line pressure.34 It also collected
data from separate Sperry-Sun sensors, including Sperry-Sun sensors for flow-out and
gas content.35
Sperry Drilling and NOV both provided BP and Transocean with proprietary displays consisting
of real-time numerical data, historical trend lines, and other features like tables and charts.36
Each of the systems allowed users to manually set (and constantly adjust) audible and visual
alarms for various data parameters, including pit gain, flow-out, and drill pipe pressure.37 The
alarms could be set to trigger whenever incoming data crossed preselected high and low
thresholds, and could also be shut off.38
While the Hitec and Sperry-Sun data systems displayed similar data, they did so using
significantly different visual design (seen in Figures 4.7.3 and 4.7.4).
Because the two systems in many cases used the same underlying sensors, most of the numerical
values should have been close if not identical.39 Where they displayed data from different sensors,
the differences were usually predictable and could generally be dealt with through calibration.40
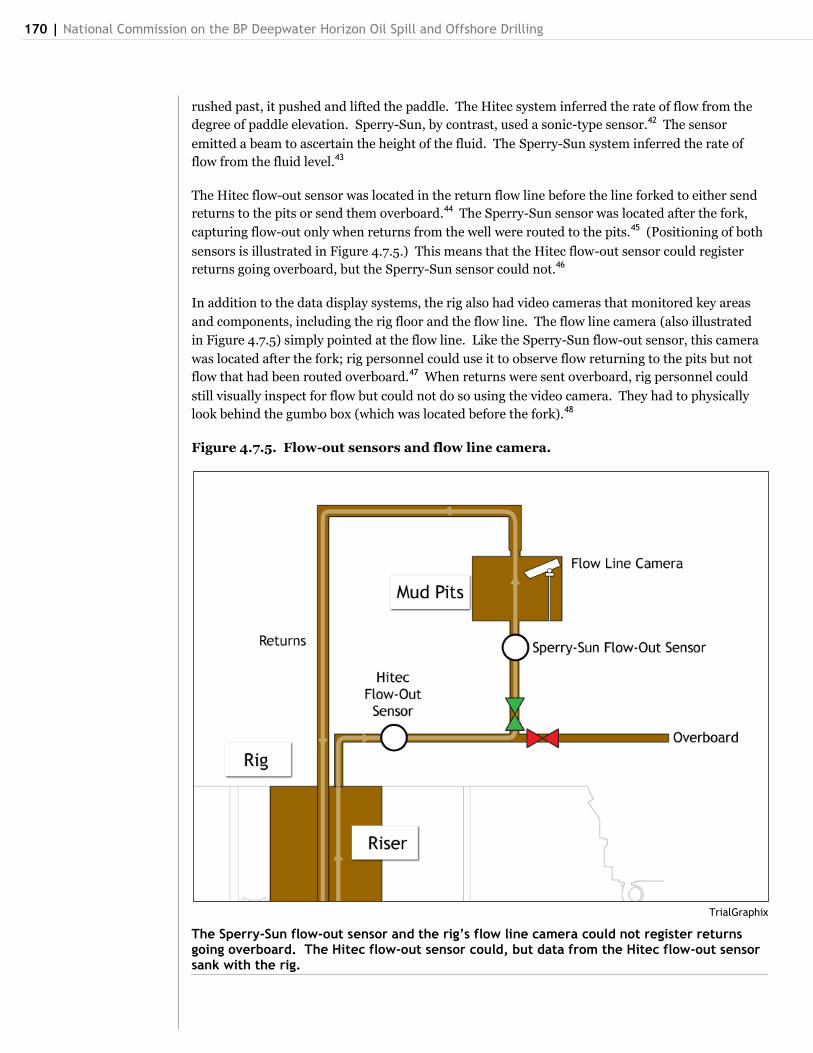
Hitec and Sperry-Sun each had its own flow-out sensor in the return flow line. These flow-out
sensors differed in type, location, and format. Hitec had a paddle-type flow-out sensor.41 As fluid
Sambhav N. Sankar
170 | National Commission on the BP Deepwater Horizon Oil Spill and Offshore Drilling
rushed past, it pushed and lifted the paddle. The Hitec system inferred the rate of flow from the
degree of paddle elevation. Sperry-Sun, by contrast, used a sonic-type sensor.42 The sensor
emitted a beam to ascertain the height of the fluid. The Sperry-Sun system inferred the rate of
flow from the fluid level.43
The Hitec flow-out sensor was located in the return flow line before the line forked to either send
returns to the pits or send them overboard.44 The Sperry-Sun sensor was located after the fork,
capturing flow-out only when returns from the well were routed to the pits.45 (Positioning of both
sensors is illustrated in Figure 4.7.5.) This means that the Hitec flow-out sensor could register
returns going overboard, but the Sperry-Sun sensor could not.46
In addition to the data display systems, the rig also had video cameras that monitored key areas
and components, including the rig floor and the flow line. The flow line camera (also illustrated
in Figure 4.7.5) simply pointed at the flow line. Like the Sperry-Sun flow-out sensor, this camera
was located after the fork; rig personnel could use it to observe flow returning to the pits but not
flow that had been routed overboard.47 When returns were sent overboard, rig personnel could
still visually inspect for flow but could not do so using the video camera. They had to physically
look behind the gumbo box (which was located before the fork).48
Figure 4.7.5. Flow-out sensors and flow line camera.
TrialGraphix
The Sperry-Sun flow-out sensor and the rig’s flow line camera could not register returns going overboard. The Hitec flow-out sensor could, but data from the Hitec flow-out sensor sank with the rig.
Chief Counsel’s Report — Chapter 4.7: Kick Detection | 171
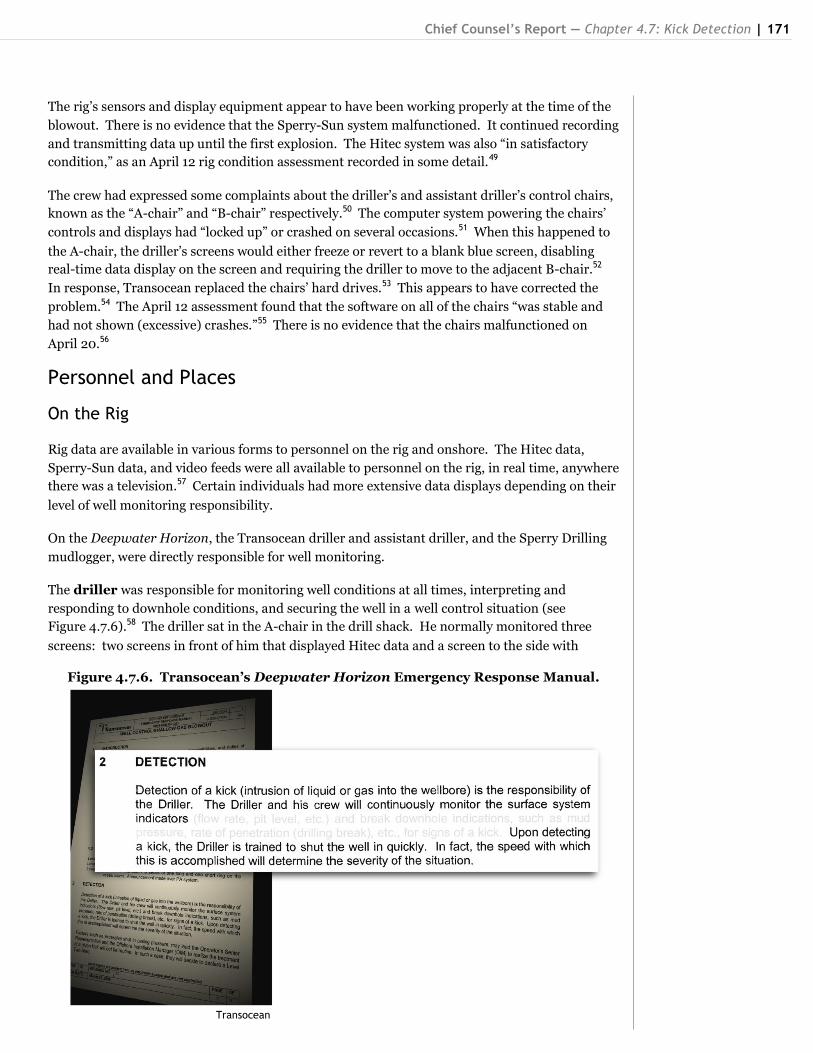
Figure 4.7.6. Transocean’s Deepwater Horizon Emergency Response Manual.
The rig‘s sensors and display equipment appear to have been working properly at the time of the
blowout. There is no evidence that the Sperry-Sun system malfunctioned. It continued recording
and transmitting data up until the first explosion. The Hitec system was also ―in satisfactory
condition,‖ as an April 12 rig condition assessment recorded in some detail.49
The crew had expressed some complaints about the driller‘s and assistant driller‘s control chairs,
known as the ―A-chair‖ and ―B-chair‖ respectively.50 The computer system powering the chairs‘
controls and displays had ―locked up‖ or crashed on several occasions.51 When this happened to
the A-chair, the driller‘s screens would either freeze or revert to a blank blue screen, disabling
real-time data display on the screen and requiring the driller to move to the adjacent B-chair.52
In response, Transocean replaced the chairs‘ hard drives.53 This appears to have corrected the
problem.54 The April 12 assessment found that the software on all of the chairs ―was stable and
had not shown (excessive) crashes.‖55 There is no evidence that the chairs malfunctioned on
April 20.56
Personnel and Places
On the Rig
Rig data are available in various forms to personnel on the rig and onshore. The Hitec data,
Sperry-Sun data, and video feeds were all available to personnel on the rig, in real time, anywhere
there was a television.57 Certain individuals had more extensive data displays depending on their
level of well monitoring responsibility.
On the Deepwater Horizon, the Transocean driller and assistant driller, and the Sperry Drilling
mudlogger, were directly responsible for well monitoring.
The driller was responsible for monitoring well conditions at all times, interpreting and
responding to downhole conditions, and securing the well in a well control situation (see
Figure 4.7.6).58 The driller sat in the A-chair in the drill shack. He normally monitored three
screens: two screens in front of him that displayed Hitec data and a screen to the side with
Transocean
172 | National Commission on the BP Deepwater Horizon Oil Spill and Offshore Drilling
Sperry-Sun data.59 He also had a screen with live video feeds and a window straight ahead
with a direct view of the rig floor.60 The driller was supposed to actively look at his data screens
during well operations.61 He contemporaneously recorded rig activities for each day‘s daily
drilling report.62
The driller was the central point of contact for all well control concerns: Anyone with ―an
understanding of something that may have indicated a well control event, would have called back
to the driller, most likely, and informed him.‖ 63 He was the one who had the most information
about current operations on the rig and the ability to react to them.64
The assistant driller was also responsible for monitoring the well and taking well control actions.
He served as a crucial backup and assist to the driller. The assistant driller was expected to have
―a comprehensive understanding of well control‖ and ―be able to recognize the signs of a well kick
or blowout before it develops into an emergency condition.‖65 He assisted the driller in
monitoring the drilling instrumentation and recognizing and controlling well conditions.66 As
part of that assistance, he monitored the pit volumes and from time to time would go to the pits
and check in with the derrickhand to make sure all was well.67
There were two assistant drillers on duty at any one time. One sat in the B-chair, adjacent to the
driller in the drill shack.68 He had access to the same screens as the driller. If there was activity
on the deck—like pipe handling—another assistant driller would sit in the ―C-chair‖ in the
auxiliary driller‘s shack.69 Although the assistant drillers had many responsibilities, at least one
should have been monitoring the well at any given time.70
The Sperry Drilling mudlogger also monitored the well, serving as a second set of eyes for the
Transocean crew.71 BP specifically contracted the mudloggers for this purpose.72 It was the
mudloggers‘ duty to continuously monitor operations and provide well and drilling data upon
request. They watched the data but did not have any control over rig operations and could not
respond directly themselves. If the mudloggers identified problems, they would notify the driller
(or drill crew).73
The mudlogger sat in the mudlogger‘s shack, one flight of stairs away from the drill shack.74 He
had 12 monitoring screens arranged in two rows of six. These screens displayed both Hitec and
Sperry-Sun data.75 Among the screens, the mudlogger had a display to the left showing all of the
rig‘s pit volume levels. Below that, the mudlogger had a graphical log and a digital readout of the
Hitec numbers.76 He also had a screen with live video feed from the rig‘s cameras—he could
switch between channels showing the flow line, the rig floor, and other areas.77 In addition to
monitoring the well, the mudlogger performed formation analysis when the rig was drilling and
provided data printouts and reports.78
Several individuals supervised well monitoring work by the driller, assistant driller,
and mudlogger.
The BP well site leader had responsibility for overseeing all operations on the well. That
responsibility involved delegating duties like minute-by-minute monitoring of data.79 Some well
site leaders did monitor the well during critical operations.80 To facilitate such monitoring, the
well site leaders‘ office had screens that constantly displayed the Hitec data, Sperry-Sun data, and
live video feeds.81 The Sperry Drilling mudloggers reported to the BP well site leader.
Chief Counsel’s Report — Chapter 4.7: Kick Detection | 173
The Transocean toolpusher supervised the driller and ensured that all drilling operations were
carried out safely, efficiently, and in accordance with the well program.82 That included
confirming that all well control requirements were in place, performing all well control
calculations, and assisting in killing the well in emergency situations.83 The toolpusher was
generally on the rig floor at all times, had access to the driller‘s and assistant driller‘s monitors,
and had a small office inside the drill shack.84
The toolpusher reported to the senior toolpusher. The senior toolpusher had a similar job
description as the toolpusher but was one level higher in the hierarchy.85 Although he had no
continuous role in operations and was not generally on the rig floor, the senior toolpusher was
supposed to be consulted when there were anomalies or emergencies. In a well control event, the
senior toolpusher organized response actions and acted as a liaison to the well site leader.86 The
senior toolpusher reported to the offshore installation manager.
The offshore installation manager (OIM) was the senior-most Transocean drilling manager
on the rig and oversaw the entire Transocean crew. He assisted with abnormal or emergency
situations.87 Both the senior toolpusher and OIM had separate offices away from the rig floor,
near their living quarters, that included data displays.88
Onshore
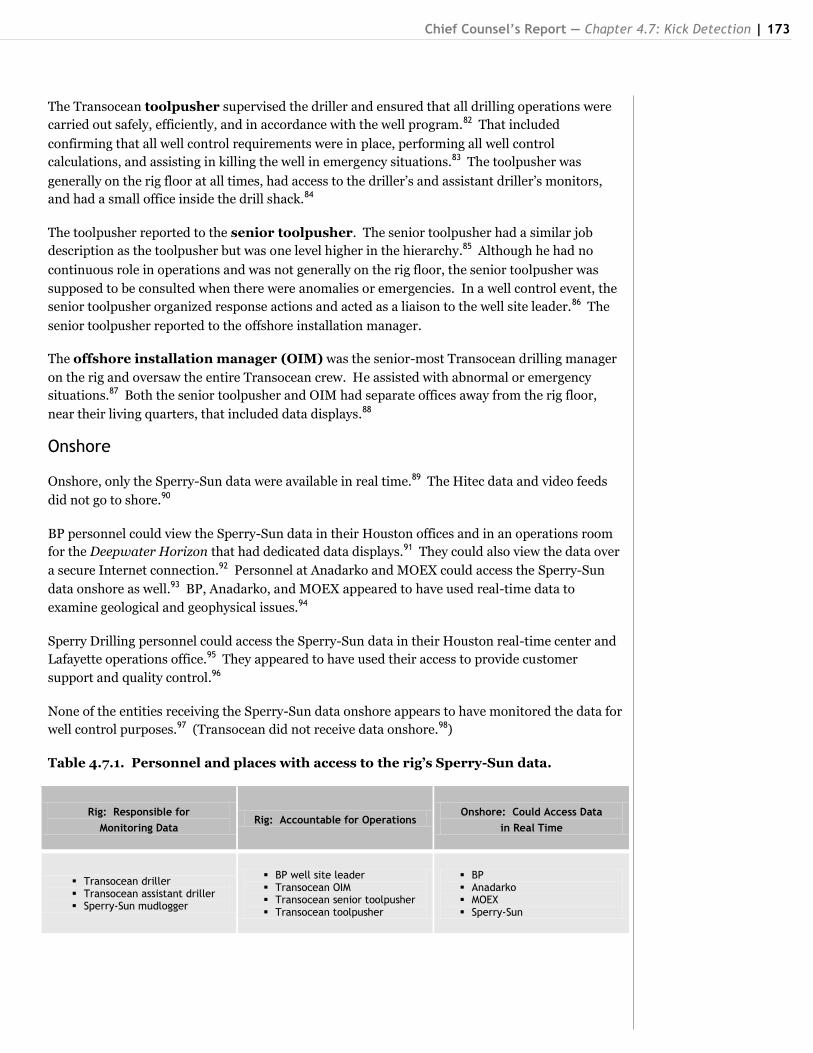
Onshore, only the Sperry-Sun data were available in real time.89 The Hitec data and video feeds
did not go to shore.90
BP personnel could view the Sperry-Sun data in their Houston offices and in an operations room
for the Deepwater Horizon that had dedicated data displays.91 They could also view the data over
a secure Internet connection.92 Personnel at Anadarko and MOEX could access the Sperry-Sun
data onshore as well.93 BP, Anadarko, and MOEX appeared to have used real-time data to
examine geological and geophysical issues.94
Sperry Drilling personnel could access the Sperry-Sun data in their Houston real-time center and
Lafayette operations office.95 They appeared to have used their access to provide customer
support and quality control.96
None of the entities receiving the Sperry-Sun data onshore appears to have monitored the data for
well control purposes.97 (Transocean did not receive data onshore.98)
Table 4.7.1. Personnel and places with access to the rig’s Sperry-Sun data.
Rig: Responsible for
Monitoring Data Rig: Accountable for Operations
Onshore: Could Access Data
in Real Time
Transocean driller Transocean assistant driller Sperry-Sun mudlogger
BP well site leader Transocean OIM Transocean senior toolpusher Transocean toolpusher
BP Anadarko MOEX Sperry-Sun
174 | National Commission on the BP Deepwater Horizon Oil Spill and Offshore Drilling
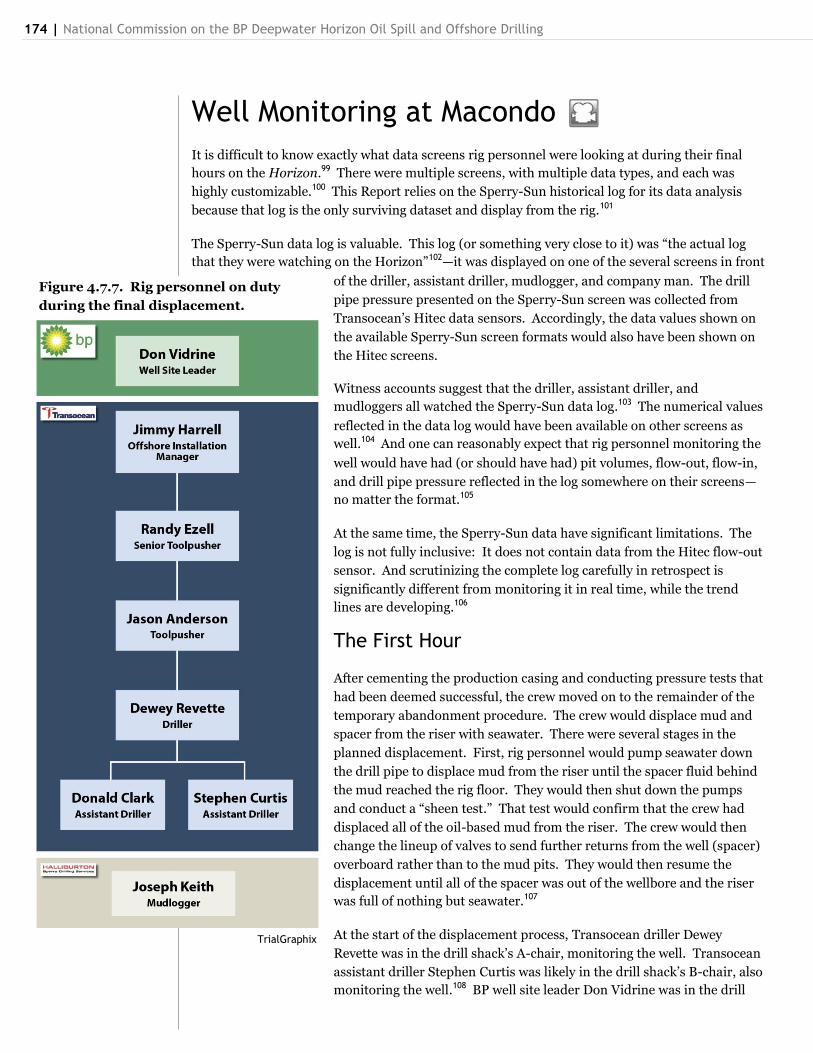
Figure 4.7.7. Rig personnel on duty
during the final displacement.
TrialGraphix
Well Monitoring at Macondo
It is difficult to know exactly what data screens rig personnel were looking at during their final
hours on the Horizon.99 There were multiple screens, with multiple data types, and each was
highly customizable.100 This Report relies on the Sperry-Sun historical log for its data analysis
because that log is the only surviving dataset and display from the rig.101
The Sperry-Sun data log is valuable. This log (or something very close to it) was ―the actual log
that they were watching on the Horizon‖102—it was displayed on one of the several screens in front
of the driller, assistant driller, mudlogger, and company man. The drill
pipe pressure presented on the Sperry-Sun screen was collected from
Transocean‘s Hitec data sensors. Accordingly, the data values shown on
the available Sperry-Sun screen formats would also have been shown on
the Hitec screens.
Witness accounts suggest that the driller, assistant driller, and
mudloggers all watched the Sperry-Sun data log.103 The numerical values
reflected in the data log would have been available on other screens as
well.104 And one can reasonably expect that rig personnel monitoring the
well would have had (or should have had) pit volumes, flow-out, flow-in,
and drill pipe pressure reflected in the log somewhere on their screens—
no matter the format.105
At the same time, the Sperry-Sun data have significant limitations. The
log is not fully inclusive: It does not contain data from the Hitec flow-out
sensor. And scrutinizing the complete log carefully in retrospect is
significantly different from monitoring it in real time, while the trend
lines are developing.106
The First Hour
After cementing the production casing and conducting pressure tests that
had been deemed successful, the crew moved on to the remainder of the
temporary abandonment procedure. The crew would displace mud and
spacer from the riser with seawater. There were several stages in the
planned displacement. First, rig personnel would pump seawater down
the drill pipe to displace mud from the riser until the spacer fluid behind
the mud reached the rig floor. They would then shut down the pumps
and conduct a ―sheen test.‖ That test would confirm that the crew had
displaced all of the oil-based mud from the riser. The crew would then
change the lineup of valves to send further returns from the well (spacer)
overboard rather than to the mud pits. They would then resume the
displacement until all of the spacer was out of the wellbore and the riser
was full of nothing but seawater.107
At the start of the displacement process, Transocean driller Dewey
Revette was in the drill shack‘s A-chair, monitoring the well. Transocean
assistant driller Stephen Curtis was likely in the drill shack‘s B-chair, also
monitoring the well.108 BP well site leader Don Vidrine was in the drill
Chief Counsel’s Report — Chapter 4.7: Kick Detection | 175
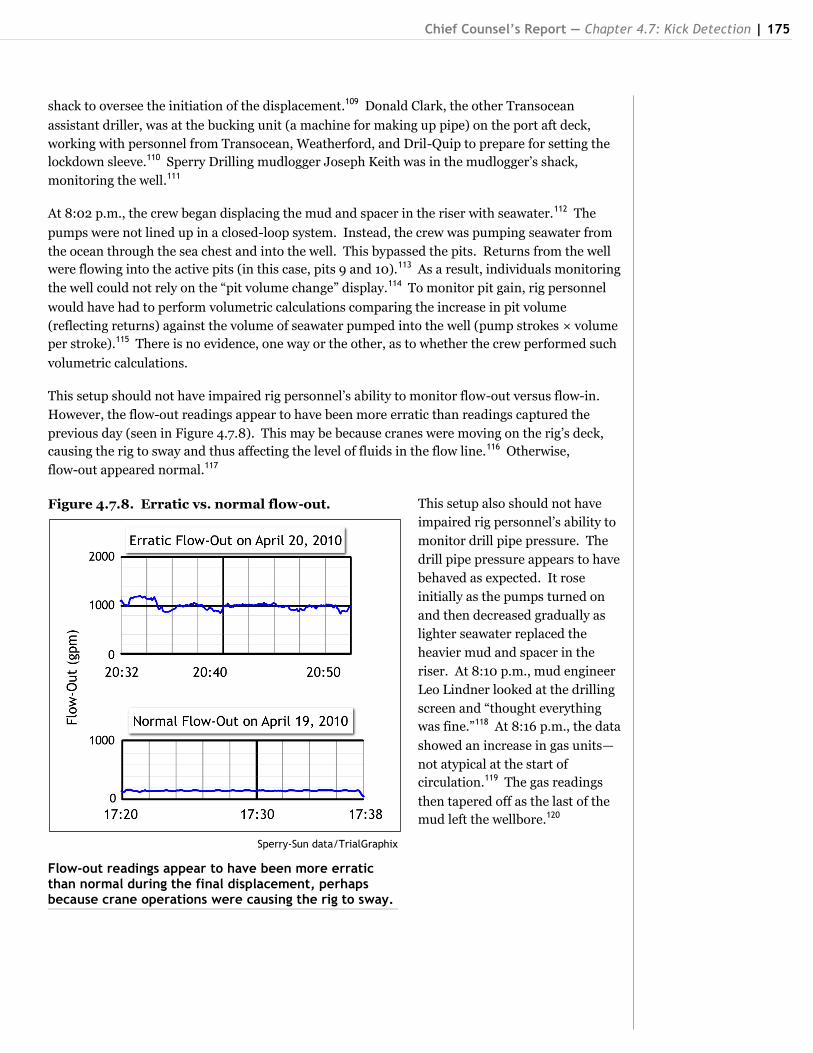
Figure 4.7.8. Erratic vs. normal flow-out.
Sperry-Sun data/TrialGraphix
Flow-out readings appear to have been more erratic than normal during the final displacement, perhaps because crane operations were causing the rig to sway.
shack to oversee the initiation of the displacement.109 Donald Clark, the other Transocean
assistant driller, was at the bucking unit (a machine for making up pipe) on the port aft deck,
working with personnel from Transocean, Weatherford, and Dril-Quip to prepare for setting the
lockdown sleeve.110 Sperry Drilling mudlogger Joseph Keith was in the mudlogger‘s shack,
monitoring the well.111
At 8:02 p.m., the crew began displacing the mud and spacer in the riser with seawater.112 The
pumps were not lined up in a closed-loop system. Instead, the crew was pumping seawater from
the ocean through the sea chest and into the well. This bypassed the pits. Returns from the well
were flowing into the active pits (in this case, pits 9 and 10).113 As a result, individuals monitoring
the well could not rely on the ―pit volume change‖ display.114 To monitor pit gain, rig personnel
would have had to perform volumetric calculations comparing the increase in pit volume
(reflecting returns) against the volume of seawater pumped into the well (pump strokes × volume
per stroke).115 There is no evidence, one way or the other, as to whether the crew performed such
volumetric calculations.
This setup should not have impaired rig personnel‘s ability to monitor flow-out versus flow-in.
However, the flow-out readings appear to have been more erratic than readings captured the
previous day (seen in Figure 4.7.8). This may be because cranes were moving on the rig‘s deck,
causing the rig to sway and thus affecting the level of fluids in the flow line.116 Otherwise,
flow-out appeared normal.117
This setup also should not have
impaired rig personnel‘s ability to
monitor drill pipe pressure. The
drill pipe pressure appears to have
behaved as expected. It rose
initially as the pumps turned on
and then decreased gradually as
lighter seawater replaced the
heavier mud and spacer in the
riser. At 8:10 p.m., mud engineer
Leo Lindner looked at the drilling
screen and ―thought everything
was fine.‖118 At 8:16 p.m., the data
showed an increase in gas units—
not atypical at the start of
circulation.119 The gas readings
then tapered off as the last of the
mud left the wellbore.120
176 | National Commission on the BP Deepwater Horizon Oil Spill and Offshore Drilling
From 8:28 to 8:34 p.m., the crew emptied the trip tank (pit 17), with the fluid going into the flow
line and pits with the rest of the returns. This complicated the monitoring of both the pits and
flow-out. To accurately monitor either parameter,
the crew had to perform calculations to subtract the
effect of emptying the trip tank from the pit volume
and flow-out readings that appeared on-screen. It is
unknown whether the crew did so.
At 8:34 p.m., the crew did three things
simultaneously. They (1) directed returns away from
the active pits (pits 9 and 10) and into a reserve pit
(pit 7); (2) emptied the sand traps into the active pits
(pits 9 and 10); and (3) began filling the trip tank
(pit 17).121 Each of these actions further complicated
pit monitoring for well control purposes. The active
pit system was eliminated as a well monitoring tool.
In order to know the volume coming out of the well,
the crew had to perform calculations taking into
account that returns were going to two different
places—the reserve pit (pit 7) and the trip tank (pit
17). In addition, routing returns to the trip tank
bypassed the flow-out meter, so the flow-out reading
appeared artificially low and had to be added to the
rate of entry of fluids into the trip tank to ascertain actual flow-out.122 Again, it is unknown
whether the crew was performing any such calculations. In addition, communication between the
rig crew and mudlogger may have broken down at this time: The drill crew did not inform Keith
about the switch in pits.123 Keith did notice a slow gain in the active pits and called M-I SWACO
mud engineer Leo Lindner to inquire; Lindner said they were moving the mud out of the sand
traps and into the active pits.124
At 8:49 p.m., the crew again rerouted returns, this time from one reserve pit (pit 7) to another
(pit 6). At about this time, the displacement process had underbalanced the well. The combined
hydrostatic pressure at the bottom of the well (generated by the mud and spacer still in the riser,
the seawater in the riser and the well, and the mud remaining in the well beneath 8,367 feet below
sea level) dropped below the reservoir pressure.
Transocean‘s post-explosion analysis estimates that the well became underbalanced at
8:50 p.m.125 BP‘s post-explosion modeling estimates that the time was 8:52 p.m.126 Given the
failed bottomhole cement job, hydrocarbons would have begun flowing into the well at this time.
At 8:52 p.m., Vidrine called BP‘s shoreside senior drilling engineer Mark Hafle to ask about the
procedure for testing the upcoming surface cement plug. Hafle asked Vidrine if everything was
OK. Hafle had the Sperry-Sun real-time data up on-screen in front of him. It does not appear
that the two discussed the rig crew‘s handling of the displacement or rig activities complicating
well control monitoring.127
In retrospect, it does not appear there were (or would have been) any signs of a kick prior to about
9 p.m. Nevertheless, between 8 and 9 p.m., rig personnel did not adequately account for whether
Trip Tank. A trip tank is a small
tank. Its primary purpose is to hold
fluid that the drill crew may need to
rapidly send into the well, for
example, to compensate for the
volume removed when pulling out the
drill pipe (known as tripping the
pipe). The drill crew also uses the
trip tank to monitor the well. The
trip tank is situated between the well
and the mud pits. When emptied,
fluid from the trip tank goes into the
return flow line, past the flow-out
meters, and into the same pits as the
returns from the well. The Horizon
had two trip tanks.
Chief Counsel’s Report — Chapter 4.7: Kick Detection | 177
and to what extent certain simultaneous operations, such as emptying the trip tanks, may have
confounded their ability to monitor the well.
Indications of an Anomaly as Early as 9:01 p.m.
Just before 9 p.m., Keith left the mudlogger‘s shack to take a short break.128 He notified the drill
crew (by calling Curtis) and then stepped out.129 He went downstairs, used the restroom, got a
cup of coffee, and smoked half a cigarette.130 He was apparently gone for about 10 minutes before
returning to his post.131
At 8:59 p.m., the crew simultaneously decreased the pump rate on all three pumps and began
emptying the trip tanks.132 The decrease in the pump rate should have caused a decrease in the
flow-out, but because emptying the trip tanks sent additional fluid flowing past the flow-out
meter, the flow-out reading actually increased. That increase potentially masked any sign of a
kick from the flow-out reading.133
At 9:01 p.m., drill pipe pressure changed direction. Instead of continuing to steadily decline, it
began to increase. This change in direction was a significant anomaly. If lighter seawater were
replacing the heavier mud and spacer in the riser as should have been the case, drill pipe pressure
should have continued to drop, as it had done for at least the previous 40 minutes.134 In
retrospect, this change in drill pipe pressure likely indicated that hydrocarbons were pushing
heavier mud up from the bottom of the well against and around the drill pipe.
By 9:08 p.m., with the pump rates constant, drill pipe pressure had increased by approximately
100 pounds per square inch (psi). The magnitude of the increase would have appeared subtle on
the Sperry-Sun screen showing only trend lines, but it likely would not have been subtle on the
numerical displays.135
The change in direction was by now clear and clearly anomalous. An individual who saw the drill
pipe pressure increase should have been seriously concerned and should have investigated
further.136 But Keith, who would have returned from his break by that time, reviewed the logs for
the period he was absent and did not notice any indication of a problem: ―I went back over it and
looked, and to my recollection, I didn‘t see nothing wrong.‖137
At 9:08 p.m., after the top of the spacer column reached the rig, the crew shut down the pumps
and switched the lineup to route returns overboard.138 Keith looked at the video feed from the
flow line camera and visually confirmed that there was no flow.139 He likely communicated this to
the rig floor.140 According to Vidrine, who was on the rig floor, everything looked fine.141
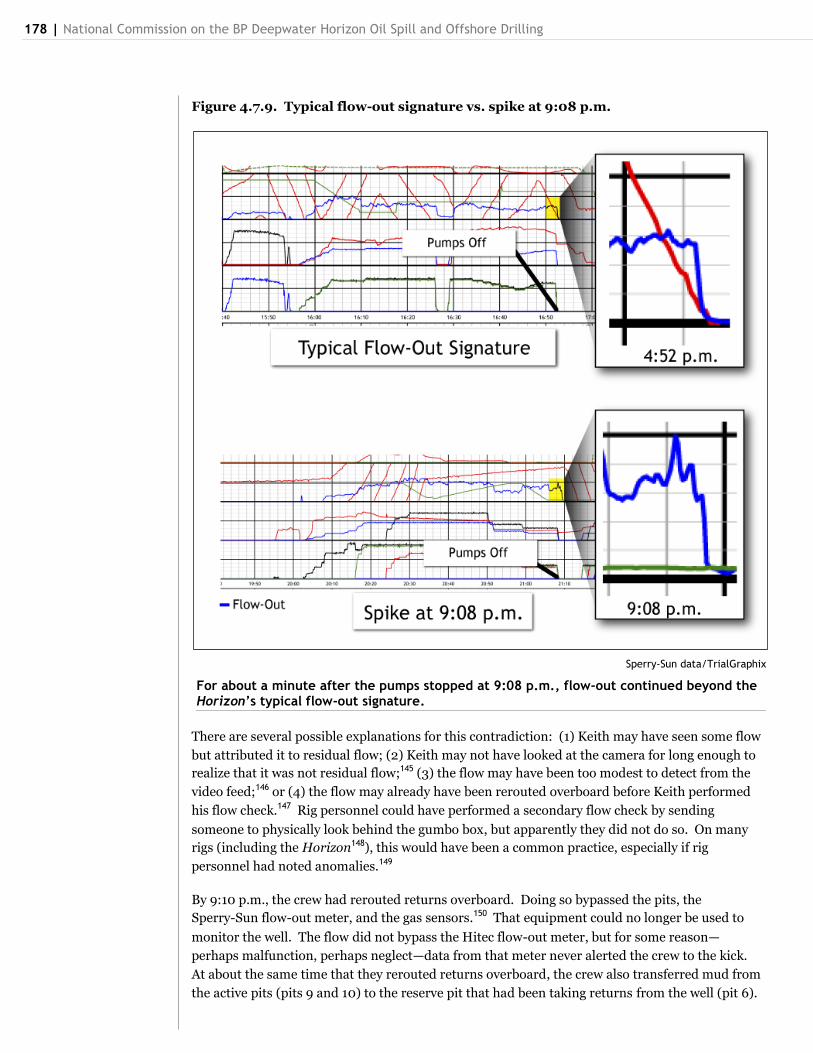
Everything was not fine. For about a minute after the pumps stopped, flow-out continued beyond
the Horizon‘s typical flow-out signature.142 This was a kick indicator (Figure 4.7.9 depicts a
typical flow-out signature at 4:52 p.m. and the 9:08 p.m. spike). A driller, assistant driller, or
mudlogger watching the screen could have seen it.143 Instead, they thought they had visual
confirmation of no flow, based at least on Keith‘s observations.144
178 | National Commission on the BP Deepwater Horizon Oil Spill and Offshore Drilling
Sperry-Sun data/TrialGraphix
For about a minute after the pumps stopped at 9:08 p.m., flow-out continued beyond the Horizon’s typical flow-out signature.
Figure 4.7.9. Typical flow-out signature vs. spike at 9:08 p.m.
There are several possible explanations for this contradiction: (1) Keith may have seen some flow
but attributed it to residual flow; (2) Keith may not have looked at the camera for long enough to
realize that it was not residual flow;145 (3) the flow may have been too modest to detect from the
video feed;146 or (4) the flow may already have been rerouted overboard before Keith performed
his flow check.147 Rig personnel could have performed a secondary flow check by sending
someone to physically look behind the gumbo box, but apparently they did not do so. On many
rigs (including the Horizon148), this would have been a common practice, especially if rig
personnel had noted anomalies.149
By 9:10 p.m., the crew had rerouted returns overboard. Doing so bypassed the pits, the
Sperry-Sun flow-out meter, and the gas sensors.150 That equipment could no longer be used to
monitor the well. The flow did not bypass the Hitec flow-out meter, but for some reason—
perhaps malfunction, perhaps neglect—data from that meter never alerted the crew to the kick.
At about the same time that they rerouted returns overboard, the crew also transferred mud from
the active pits (pits 9 and 10) to the reserve pit that had been taking returns from the well (pit 6).
Chief Counsel’s Report — Chapter 4.7: Kick Detection | 179
Sperry-Sun data/TrialGraphix
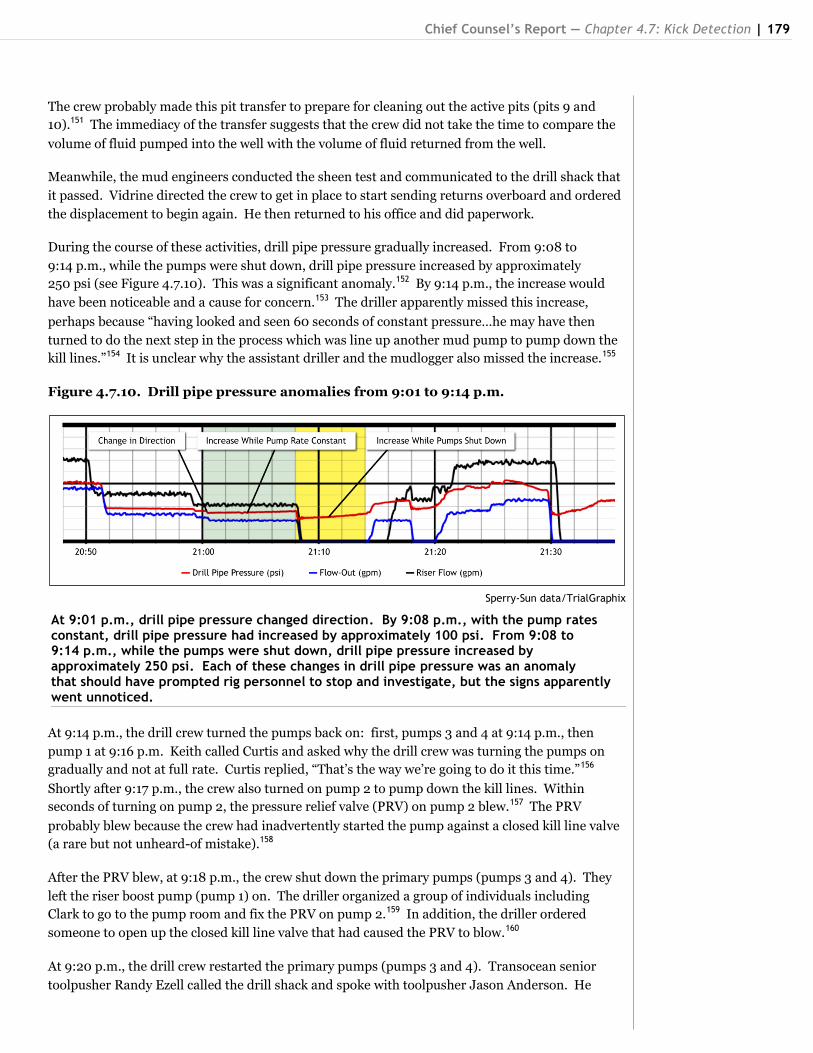
At 9:01 p.m., drill pipe pressure changed direction. By 9:08 p.m., with the pump rates constant, drill pipe pressure had increased by approximately 100 psi. From 9:08 to 9:14 p.m., while the pumps were shut down, drill pipe pressure increased by approximately 250 psi. Each of these changes in drill pipe pressure was an anomaly that should have prompted rig personnel to stop and investigate, but the signs apparently went unnoticed.
The crew probably made this pit transfer to prepare for cleaning out the active pits (pits 9 and
10).151 The immediacy of the transfer suggests that the crew did not take the time to compare the
volume of fluid pumped into the well with the volume of fluid returned from the well.
Meanwhile, the mud engineers conducted the sheen test and communicated to the drill shack that
it passed. Vidrine directed the crew to get in place to start sending returns overboard and ordered
the displacement to begin again. He then returned to his office and did paperwork.
During the course of these activities, drill pipe pressure gradually increased. From 9:08 to
9:14 p.m., while the pumps were shut down, drill pipe pressure increased by approximately
250 psi (see Figure 4.7.10). This was a significant anomaly.152 By 9:14 p.m., the increase would
have been noticeable and a cause for concern.153 The driller apparently missed this increase,
perhaps because ―having looked and seen 60 seconds of constant pressure…he may have then
turned to do the next step in the process which was line up another mud pump to pump down the
kill lines.‖154 It is unclear why the assistant driller and the mudlogger also missed the increase.155
Figure 4.7.10. Drill pipe pressure anomalies from 9:01 to 9:14 p.m.
At 9:14 p.m., the drill crew turned the pumps back on: first, pumps 3 and 4 at 9:14 p.m., then
pump 1 at 9:16 p.m. Keith called Curtis and asked why the drill crew was turning the pumps on
gradually and not at full rate. Curtis replied, ―That‘s the way we‘re going to do it this time.‖156
Shortly after 9:17 p.m., the crew also turned on pump 2 to pump down the kill lines. Within
seconds of turning on pump 2, the pressure relief valve (PRV) on pump 2 blew.157 The PRV
probably blew because the crew had inadvertently started the pump against a closed kill line valve
(a rare but not unheard-of mistake).158
After the PRV blew, at 9:18 p.m., the crew shut down the primary pumps (pumps 3 and 4). They
left the riser boost pump (pump 1) on. The driller organized a group of individuals including
Clark to go to the pump room and fix the PRV on pump 2.159 In addition, the driller ordered
someone to open up the closed kill line valve that had caused the PRV to blow.160
At 9:20 p.m., the drill crew restarted the primary pumps (pumps 3 and 4). Transocean senior
toolpusher Randy Ezell called the drill shack and spoke with toolpusher Jason Anderson. He
180 | National Commission on the BP Deepwater Horizon Oil Spill and Offshore Drilling
Sperry-Sun data/TrialGraphix
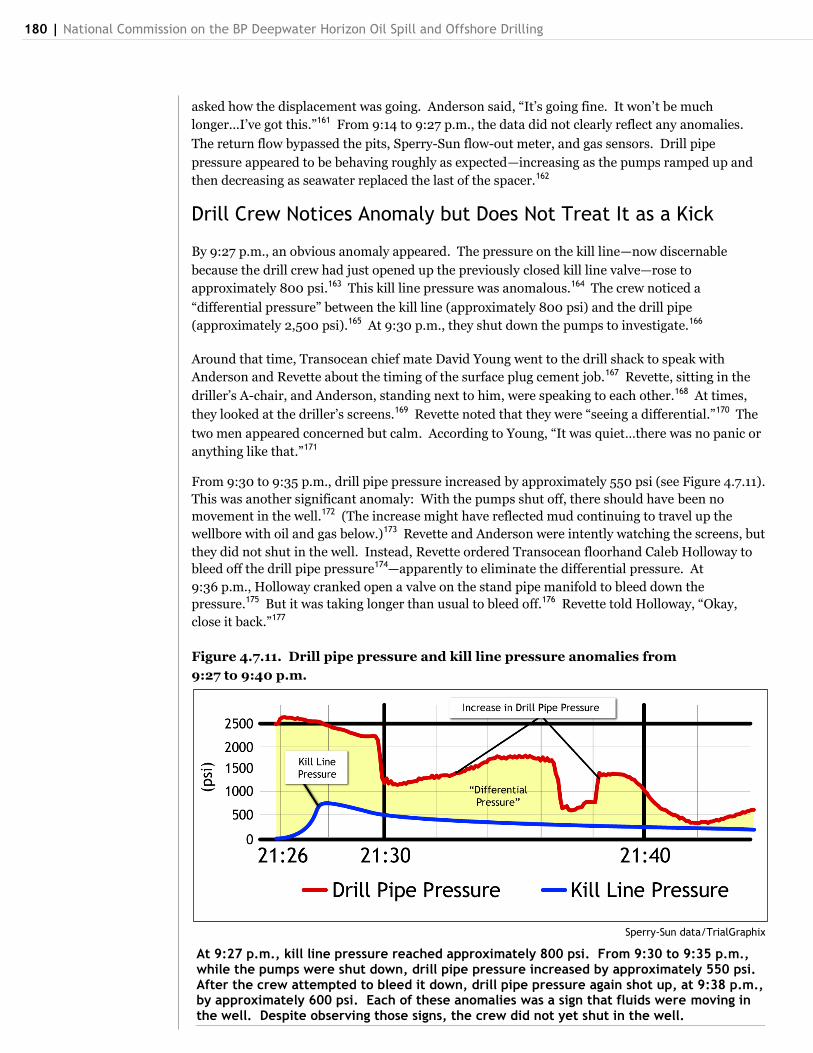
At 9:27 p.m., kill line pressure reached approximately 800 psi. From 9:30 to 9:35 p.m., while the pumps were shut down, drill pipe pressure increased by approximately 550 psi. After the crew attempted to bleed it down, drill pipe pressure again shot up, at 9:38 p.m., by approximately 600 psi. Each of these anomalies was a sign that fluids were moving in the well. Despite observing those signs, the crew did not yet shut in the well.
asked how the displacement was going. Anderson said, ―It‘s going fine. It won‘t be much
longer...I‘ve got this.‖161 From 9:14 to 9:27 p.m., the data did not clearly reflect any anomalies.
The return flow bypassed the pits, Sperry-Sun flow-out meter, and gas sensors. Drill pipe
pressure appeared to be behaving roughly as expected—increasing as the pumps ramped up and
then decreasing as seawater replaced the last of the spacer.162
Drill Crew Notices Anomaly but Does Not Treat It as a Kick
By 9:27 p.m., an obvious anomaly appeared. The pressure on the kill line—now discernable
because the drill crew had just opened up the previously closed kill line valve—rose to
approximately 800 psi.163 This kill line pressure was anomalous.164 The crew noticed a
―differential pressure‖ between the kill line (approximately 800 psi) and the drill pipe
(approximately 2,500 psi).165 At 9:30 p.m., they shut down the pumps to investigate.166
Around that time, Transocean chief mate David Young went to the drill shack to speak with
Anderson and Revette about the timing of the surface plug cement job.167 Revette, sitting in the
driller‘s A-chair, and Anderson, standing next to him, were speaking to each other.168 At times,
they looked at the driller‘s screens.169 Revette noted that they were ―seeing a differential.‖170 The
two men appeared concerned but calm. According to Young, ―It was quiet…there was no panic or
anything like that.‖171
From 9:30 to 9:35 p.m., drill pipe pressure increased by approximately 550 psi (see Figure 4.7.11).
This was another significant anomaly: With the pumps shut off, there should have been no
movement in the well.172 (The increase might have reflected mud continuing to travel up the
wellbore with oil and gas below.)173 Revette and Anderson were intently watching the screens, but
they did not shut in the well. Instead, Revette ordered Transocean floorhand Caleb Holloway to
bleed off the drill pipe pressure174—apparently to eliminate the differential pressure. At
9:36 p.m., Holloway cranked open a valve on the stand pipe manifold to bleed down the
pressure.175 But it was taking longer than usual to bleed off.176 Revette told Holloway, ―Okay,
close it back.‖177
Figure 4.7.11. Drill pipe pressure and kill line pressure anomalies from
9:27 to 9:40 p.m.
Chief Counsel’s Report — Chapter 4.7: Kick Detection | 181
Once he did, at 9:38 p.m., the drill pipe pressure shot back up. It increased by approximately
600 psi. Again, the increase was a serious anomaly.
By this point, rig personnel had observed several serious anomalies. Each was ―a sign that fluids
are moving‖ in the well.178 Those anomalies should have ―caused alarm.‖179 But there appears to
have been no hint of alarm.
The crew actively investigated the anomalies and performed diagnostic interventions. But it
appears that the crew did not perform the most basic kick detection intervention—a flow check.
If they had done so, they would have directly seen flow coming out of the well and should have
shut in the well.180 The fact that the crew apparently did not perform a flow check suggests that
Revette and Anderson either did not consider or had already ruled out the possibility of a kick.
Anderson thought ―it would be a little bit longer‖ before they figured out the differential pressure
and told Young that they probably wouldn‘t need him for the cement job meeting for another
couple of hours.181 According to Young, Anderson ―wasn‘t sure if they were going to need to
circulate.‖182 Anderson then left to go to the pump room.183 Young also left at about the same
time.184 He ran into Holloway, who was coming down from the stand pipe manifold; they spoke
for a couple of minutes and joked.185 There was no sign of concern or hurry.186
Not long afterward, Holloway was leaving the rig floor and ran into Curtis. Curtis was on his way
to the drill shack. He was in no rush. Curtis and Holloway spoke for a few minutes.187
Throughout this period of investigation, the drill crew did not communicate with the mudlogger
about the anomaly.188 Nor did they contact the senior toolpusher, OIM, or well site leader to ask
for their help or to notify them that something was amiss.
Mud Overflow and Recognition of the Anomaly as a Kick
Sometime between 9:40 and 9:43 p.m., mud overflowed onto the rig floor, shot up to the top of
the derrick, and poured down onto the main deck.189 By about that time, drill pipe pressure had
decreased by approximately 1,000 psi. At 9:41 p.m., the trip tank (pit 18) abruptly gained about
12 barrels in volume. The crew likely routed flow back to the trip tank intentionally to help
diagnose whether the riser was static.190 The gain showed that there was still flow from the well
up the riser.
At about the same time, Anderson returned to the drill shack. At 9:41 p.m., he activated the
blowout preventer‘s (BOP‘s) annular preventer.191 Drill pipe pressure began to increase (as it
should when a well is shut in). By now, gas would already have been in the riser, expanding
rapidly on its way to the surface. This may have made it more difficult to successfully activate the
blowout preventer. In any case, even if the crew had successfully shut in the well, they should
have expected flow from the well to continue at least until all of the gas in the riser had escaped.
Interviews and testimony after the blowout recount what happened next. Anderson called
Vidrine to say the crew was getting mud back and had diverted flow to the mud gas separator and
closed the annular.192 Curtis called Ezell and said: ―We have a situation. The well is blown out.
We have mud going to the crown.... [Anderson] is shutting it in now.‖193 Someone, perhaps
Revette, called Andrea Fleytas on the bridge, said ―We have a well control situation,‖ and hung
up.194 Vidrine started for the rig floor.195 Ezell did the same.196 Fleytas turned to Yancy Keplinger
and yelled, ―We‘re in a well control situation.‖197 Keplinger radioed the Damon Bankston,
182 | National Commission on the BP Deepwater Horizon Oil Spill and Offshore Drilling
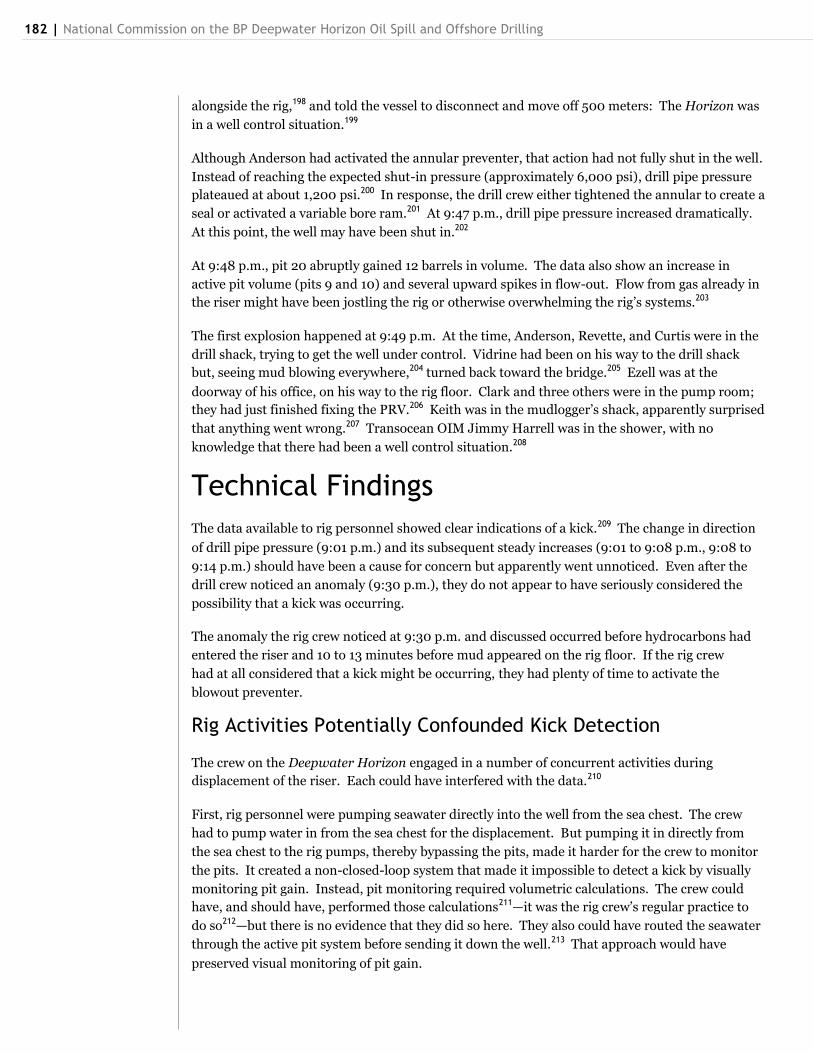
alongside the rig,198 and told the vessel to disconnect and move off 500 meters: The Horizon was
in a well control situation.199
Although Anderson had activated the annular preventer, that action had not fully shut in the well.
Instead of reaching the expected shut-in pressure (approximately 6,000 psi), drill pipe pressure
plateaued at about 1,200 psi.200 In response, the drill crew either tightened the annular to create a
seal or activated a variable bore ram.201 At 9:47 p.m., drill pipe pressure increased dramatically.
At this point, the well may have been shut in.202
At 9:48 p.m., pit 20 abruptly gained 12 barrels in volume. The data also show an increase in
active pit volume (pits 9 and 10) and several upward spikes in flow-out. Flow from gas already in
the riser might have been jostling the rig or otherwise overwhelming the rig‘s systems.203
The first explosion happened at 9:49 p.m. At the time, Anderson, Revette, and Curtis were in the
drill shack, trying to get the well under control. Vidrine had been on his way to the drill shack
but, seeing mud blowing everywhere,204 turned back toward the bridge.205 Ezell was at the
doorway of his office, on his way to the rig floor. Clark and three others were in the pump room;
they had just finished fixing the PRV.206 Keith was in the mudlogger‘s shack, apparently surprised
that anything went wrong.207 Transocean OIM Jimmy Harrell was in the shower, with no
knowledge that there had been a well control situation.208
Technical Findings
The data available to rig personnel showed clear indications of a kick.209 The change in direction
of drill pipe pressure (9:01 p.m.) and its subsequent steady increases (9:01 to 9:08 p.m., 9:08 to
9:14 p.m.) should have been a cause for concern but apparently went unnoticed. Even after the
drill crew noticed an anomaly (9:30 p.m.), they do not appear to have seriously considered the
possibility that a kick was occurring.
The anomaly the rig crew noticed at 9:30 p.m. and discussed occurred before hydrocarbons had
entered the riser and 10 to 13 minutes before mud appeared on the rig floor. If the rig crew
had at all considered that a kick might be occurring, they had plenty of time to activate the
blowout preventer.
Rig Activities Potentially Confounded Kick Detection
The crew on the Deepwater Horizon engaged in a number of concurrent activities during
displacement of the riser. Each could have interfered with the data.210
First, rig personnel were pumping seawater directly into the well from the sea chest. The crew
had to pump water in from the sea chest for the displacement. But pumping it in directly from
the sea chest to the rig pumps, thereby bypassing the pits, made it harder for the crew to monitor
the pits. It created a non-closed-loop system that made it impossible to detect a kick by visually
monitoring pit gain. Instead, pit monitoring required volumetric calculations. The crew could
have, and should have, performed those calculations211—it was the rig crew‘s regular practice to
do so212—but there is no evidence that they did so here. They also could have routed the seawater
through the active pit system before sending it down the well.213 That approach would have
preserved visual monitoring of pit gain.
Chief Counsel’s Report — Chapter 4.7: Kick Detection | 183
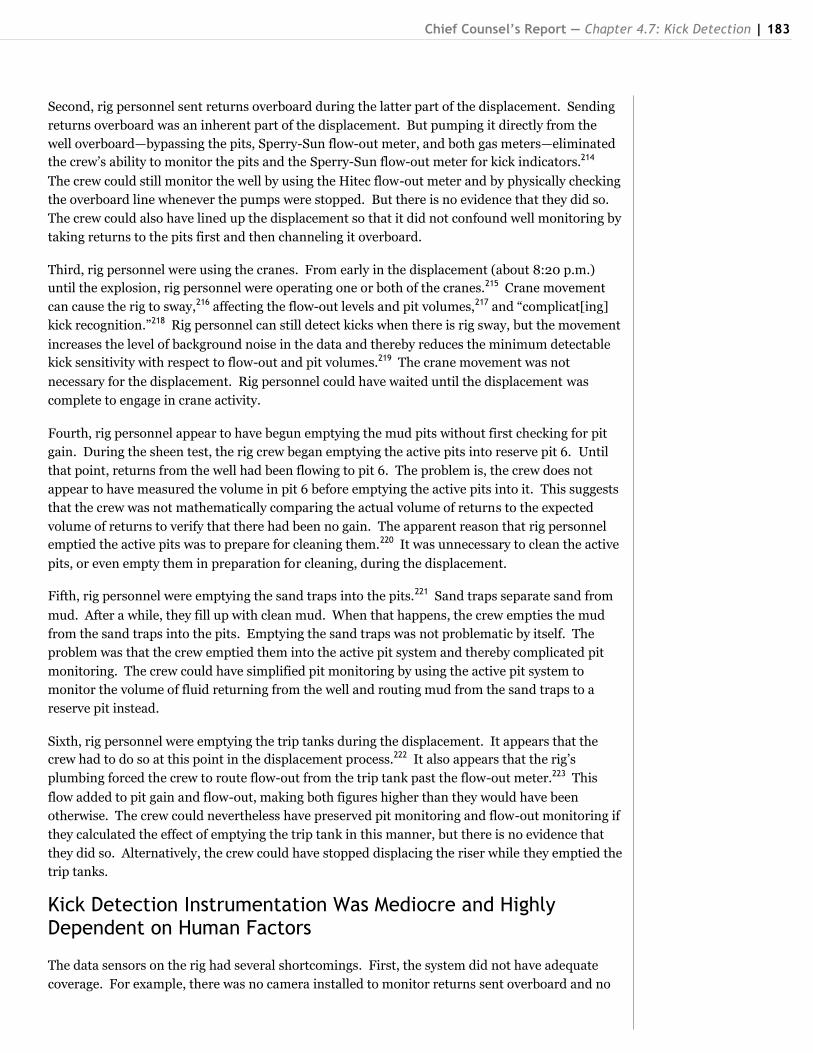
Second, rig personnel sent returns overboard during the latter part of the displacement. Sending
returns overboard was an inherent part of the displacement. But pumping it directly from the
well overboard—bypassing the pits, Sperry-Sun flow-out meter, and both gas meters—eliminated
the crew‘s ability to monitor the pits and the Sperry-Sun flow-out meter for kick indicators.214
The crew could still monitor the well by using the Hitec flow-out meter and by physically checking
the overboard line whenever the pumps were stopped. But there is no evidence that they did so.
The crew could also have lined up the displacement so that it did not confound well monitoring by
taking returns to the pits first and then channeling it overboard.
Third, rig personnel were using the cranes. From early in the displacement (about 8:20 p.m.)
until the explosion, rig personnel were operating one or both of the cranes.215 Crane movement
can cause the rig to sway,216 affecting the flow-out levels and pit volumes,217 and ―complicat[ing]
kick recognition.‖218 Rig personnel can still detect kicks when there is rig sway, but the movement
increases the level of background noise in the data and thereby reduces the minimum detectable
kick sensitivity with respect to flow-out and pit volumes.219 The crane movement was not
necessary for the displacement. Rig personnel could have waited until the displacement was
complete to engage in crane activity.
Fourth, rig personnel appear to have begun emptying the mud pits without first checking for pit
gain. During the sheen test, the rig crew began emptying the active pits into reserve pit 6. Until
that point, returns from the well had been flowing to pit 6. The problem is, the crew does not
appear to have measured the volume in pit 6 before emptying the active pits into it. This suggests
that the crew was not mathematically comparing the actual volume of returns to the expected
volume of returns to verify that there had been no gain. The apparent reason that rig personnel
emptied the active pits was to prepare for cleaning them.220 It was unnecessary to clean the active
pits, or even empty them in preparation for cleaning, during the displacement.
Fifth, rig personnel were emptying the sand traps into the pits.221 Sand traps separate sand from
mud. After a while, they fill up with clean mud. When that happens, the crew empties the mud
from the sand traps into the pits. Emptying the sand traps was not problematic by itself. The
problem was that the crew emptied them into the active pit system and thereby complicated pit
monitoring. The crew could have simplified pit monitoring by using the active pit system to
monitor the volume of fluid returning from the well and routing mud from the sand traps to a
reserve pit instead.
Sixth, rig personnel were emptying the trip tanks during the displacement. It appears that the
crew had to do so at this point in the displacement process.222 It also appears that the rig‘s
plumbing forced the crew to route flow-out from the trip tank past the flow-out meter.223 This
flow added to pit gain and flow-out, making both figures higher than they would have been
otherwise. The crew could nevertheless have preserved pit monitoring and flow-out monitoring if
they calculated the effect of emptying the trip tank in this manner, but there is no evidence that
they did so. Alternatively, the crew could have stopped displacing the riser while they emptied the
trip tanks.
Kick Detection Instrumentation Was Mediocre and Highly Dependent on Human Factors
The data sensors on the rig had several shortcomings. First, the system did not have adequate
coverage. For example, there was no camera installed to monitor returns sent overboard and no
184 | National Commission on the BP Deepwater Horizon Oil Spill and Offshore Drilling
sensor to indicate whether the valve sending returns overboard was open or closed. Therefore,
while video monitoring of flow was possible when returns went to the pits, it was not possible
when returns went overboard.
Second, some of the sensors were not particularly accurate. For example, electronic sensors for
pit volumes can be unreliable, so much so that the crew would sometimes revert to using a string
with a nut to measure pit volume change.224
Third, the sensors often lacked precision and responded to movement unrelated to the state of the
well. For example, a fluctuation in flow-out might result from crane activity on the rig.225 These
shortcomings can result in rig personnel not receiving quality data and, furthermore, discounting
the value of the data they do receive.
The data display systems also had notable limitations. There were no automated alarms built into
the displays. Rather, the system depended on the right person being in the right place at the right
time looking at the right information and drawing the right conclusions.226 Although the systems
did contain audible and visual alarms, the driller was required to set them manually.227 He could
also shut them off. Manually setting and resetting alarm thresholds is a tedious task and not
always done. For example, there is typically no alarm set for flow-in and flow-out because the
pumps stop and start so often that the alarms would trigger too frequently.228
There was also no automation of simple well monitoring calculations. For example, if the
displacement is set up as a non-closed-loop system, and rig personnel want to keep track of
volumes, they must perform the calculation by hand (return volume – (pump strokes × volume
per pump stroke)). If the rig is emptying its trip tank while taking returns, and rig personnel want
to disaggregate the two activities, they must perform the subtraction by hand. Each of those
calculations could easily be automated and displayed for enhanced real-time monitoring.
There was also no advance planning or real-time modeling of expected pressures, volumes, and
flow rates for the displacement. Although well flow modeling has been employed in
post-explosion analysis,229 there was no comparable modeling technology in place for
real-time analysis.230
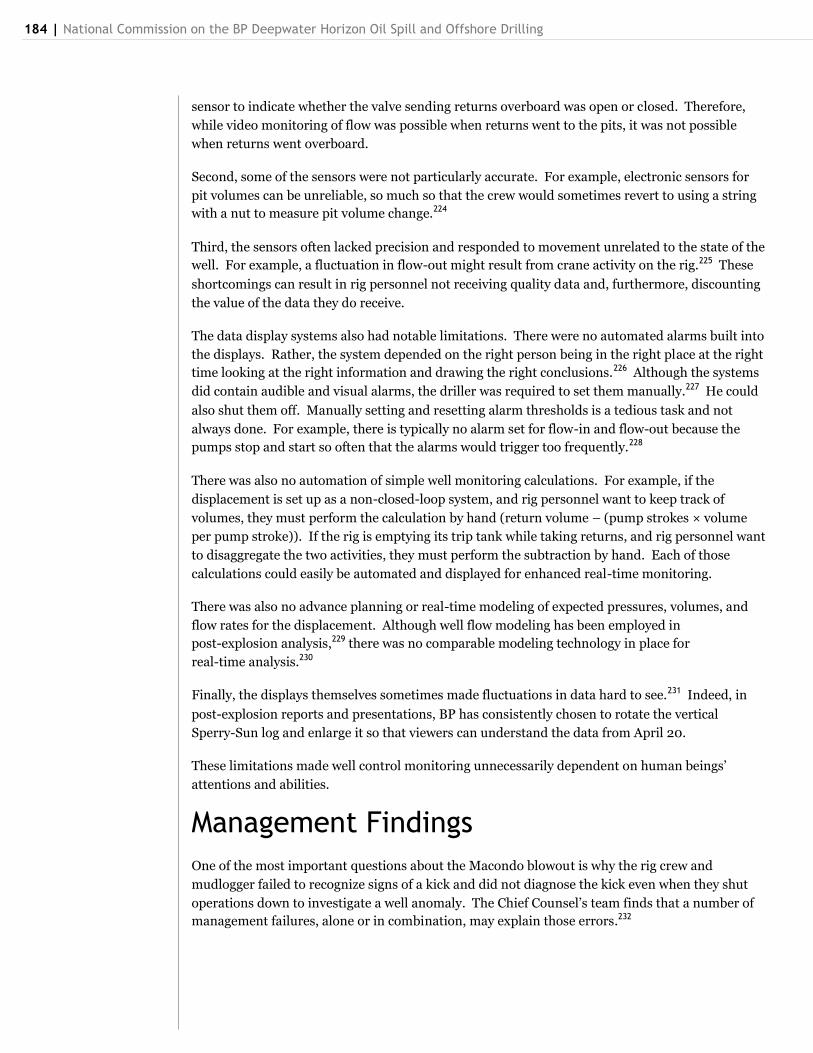
Finally, the displays themselves sometimes made fluctuations in data hard to see.231 Indeed, in
post-explosion reports and presentations, BP has consistently chosen to rotate the vertical
Sperry-Sun log and enlarge it so that viewers can understand the data from April 20.
These limitations made well control monitoring unnecessarily dependent on human beings‘
attentions and abilities.
Management Findings
One of the most important questions about the Macondo blowout is why the rig crew and
mudlogger failed to recognize signs of a kick and did not diagnose the kick even when they shut
operations down to investigate a well anomaly. The Chief Counsel‘s team finds that a number of
management failures, alone or in combination, may explain those errors.232
Chief Counsel’s Report — Chapter 4.7: Kick Detection | 185
BP, Transocean, and Sperry Drilling Rig Personnel Exhibited a Lack of Vigilance During the Final Displacement
The evidence suggests that BP, Transocean, and Sperry-Sun personnel on the rig were not
sufficiently alert to the possibility that a loss of well control might occur during the final
displacement. There are several reasons why this might have been the case. First, kicks are not
commonly associated with the temporary abandonment phase of well operations. In a 2001 study
of 48 deepwater kicks in the Gulf of Mexico, the vast ―majority of kicks occurred during
drilling operations.‖233 By contrast, only one kick ―occurred in association with a well
abandon[ment] operation.‖234
Second, confidence in barriers, particularly tested barriers, can make rig personnel overconfident
in the well‘s overall security. A satisfactory negative pressure test generally confirms that the well
is secure and that hydrocarbons will not flow into the well during riser displacement operations.
Once rig personnel deemed the Macondo negative pressure test a success, they may have believed
that a kick was no longer a realistic hazard.235 Investigations of a 2009 North Sea blowout and a
2009 Timor Sea blowout found that rig personnel were ―blinkered‖ by a successful negative
pressure test or drew an ―unwarranted level of comfort‖ from the presence of a barrier.236 Both
attitudes ―reflected and influenced a lax approach to well control.‖237
Third, end-of-well activities tend to be marked by a hasty mindset and loss of focus.238 This can
result simply from a desire to finish and move on, particularly when a well has been difficult to
drill (like Macondo).239 Rig personnel have noted in post-blowout interviews that ―[a]t the end of
the well sometimes they think about speeding up.‖240 This may be because ―everybody goes to the
mindset that we‘re through, this job is done...everything‘s going to be okay.‖241
Together, these factors appear to have contributed to reduced well monitoring vigilance,
diminished sensitivity to anomalous data, delayed reactions, a failure to undertake routine well
monitoring measures (like flow checks and volumetric calculations), and a willingness to perform
rig operations in a manner that complicated well monitoring.
Such a lack of vigilance was particularly surprising at this well. Given the risk of a poor
bottomhole cement job and the fact that the final displacement would severely underbalance the
well, rig management—and the well site leader in particular—should have treated the
displacement as a critical operation and personally monitored the data.242
Transocean Personnel Lacked Sufficient Training to Recognize That Certain Data Anomalies Indicated a Kick243
Several times during the evening of April 20, data anomalies indicated that hydrocarbons were
flowing into the well.244 Despite noticing the anomalies—and taking time to discuss them—the rig
crew did not recognize that a kick was under way.
Earlier in the evening, during the negative pressure test, hydrocarbons flowed into the well.
Pressure anomalies signaled the kick. But rig personnel did not heed those signals.
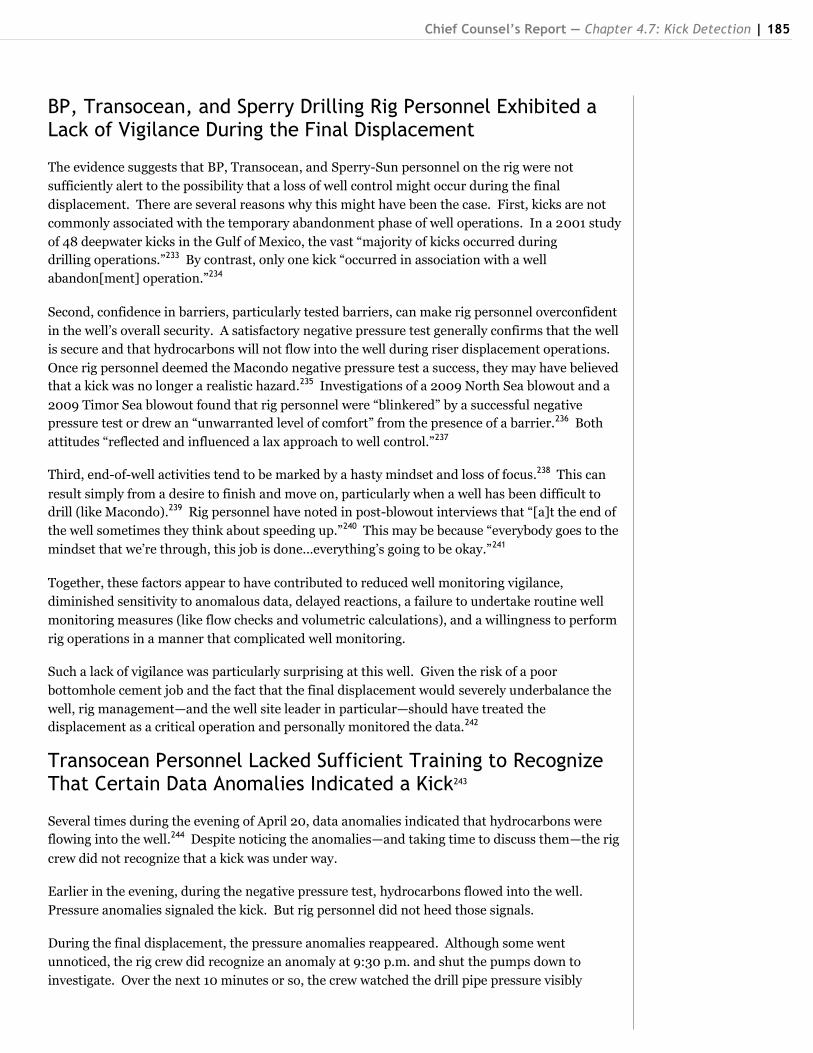
During the final displacement, the pressure anomalies reappeared. Although some went
unnoticed, the rig crew did recognize an anomaly at 9:30 p.m. and shut the pumps down to
investigate. Over the next 10 minutes or so, the crew watched the drill pipe pressure visibly
186 | National Commission on the BP Deepwater Horizon Oil Spill and Offshore Drilling
increase—steadily at first (9:30 to 9:35 p.m.) and then, after they attempted to bleed it off, rapidly
(9:38 p.m.)—even though the pumps were off. They also saw an anomalous kill line pressure.
Each indicator was ―a sign that fluids are moving‖ in the well—in other words, a sign of a kick.245
To a skilled observer, those anomalies ―would have caused alarm.‖246 But there appears to have
been no hint of alarm. Instead, the rig crew spent at least 10 minutes ―discussing‖ the ―anomaly,‖
―scratching their heads to figure what was happening.‖247 Even in retrospect, Transocean‘s
internal investigator asserts that it was ―a very strange trend,‖ ―a confusing signal,‖ explained only
after ―months of work.‖248
Transocean leaves open the possibility that its rig crew ―did not have the experience‖ or training
to interpret pressure anomalies during the negative pressure test.249 If true, then the crew likely
did not have sufficient training or ability to interpret the recurrence of those anomalies during the
final displacement.
Transocean further states that its crew relied on the operator (BP) to make a final assessment of
anomalies during the negative pressure test.250 But when those anomalies reappeared during the
displacement, the rig crew did not notify BP rig personnel and ask for their help in interpreting
the data.251
BP and Transocean Allowed Rig Operations to Proceed in a Way That Inhibited Well Monitoring
BP and Transocean management on the rig allowed simultaneous operations without adequately
ensuring that those operations would not complicate or confound well monitoring.252
Simultaneous activities can interfere with well monitoring in several ways. First, they can
influence data that are used to monitor for kicks (for example, by altering fluid levels) and thereby
obscure signals of a kick.253 Second, they can make it more difficult to interpret data because rig
personnel may attribute data anomalies to rig activities instead of a kick. Third, even when
simultaneous operations are necessary, such as when changing the lineup of pipes and valves or
fixing a mud pump, they can distract rig personnel who would otherwise be monitoring the
well.254 Rig personnel can reduce these difficulties by identifying relevant rig activities,
calculating or otherwise predicting their probable effect, and communicating any expected effects
to well monitoring personnel. Rig management should ensure that someone is watching the
screens at all times, despite ongoing activities.
BP, Transocean, and Sperry Drilling Rig Personnel Did Not Properly Communicate Information
Insufficient communication, both prior to and during the final displacement, affected risk
awareness and well monitoring on the Deepwater Horizon.
BP did not adequately inform Transocean about the risks at the Macondo well, particularly the
risks of a poor bottomhole cement job.255 Transocean argues that if BP had done so, its crew
might have demonstrated ―heightened awareness.‖256 But it is unlikely that this particular
communication failure compromised kick detection; the crew would probably have dismissed
warnings about cement risks anyhow after the successful negative pressure test.
Chief Counsel’s Report — Chapter 4.7: Kick Detection | 187
BP and Transocean did not do enough to ensure that rig personnel were aware of the objectives,
procedures, and hazards of the riser displacement operation.257 The individuals conducting the
pre-job meetings should have emphasized that BP‘s temporary abandonment procedures would
leave only a single barrier in the well besides the BOP and would produce an unusually
underbalanced well.258 They should have warned against complacency stemming from the
negative pressure test and emphasized that tested barriers can fail.
The pre-job meetings should also have informed well monitoring personnel that certain kick
indicators such as pit gain and flow-out would be compromised or unavailable during the planned
operations. Well monitoring personnel should have been told that, as a result, they would need to
perform volumetric calculations to keep track of pit gain, pay special attention to other
parameters (such as drill pipe pressure), and conduct visual flow checks whenever the pumps
were stopped.259 In addition, to facilitate well monitoring, those personnel should have been
given a pump schedule for the different phases of the displacement, along with guidance
regarding how much deviation from that schedule should be considered anomalous.260
Transocean and Sperry Drilling personnel did not communicate effectively about the
displacement operation.261 And the BP well site leader did not play a sufficiently active role in
ensuring such communication.262 Communication broke down between the drill crew and the
mudloggers on several occasions. For example, when rig personnel announced early on April 20
that they would be pumping mud to a supply boat, Cathleenia Willis (the mudlogger on shift) told
Clark she was concerned that this would limit her ability to monitor pit gain.263 Clark said he
would address the matter but never got back to Willis.264 Keith reported after the explosion that
he was concerned that simultaneous activities would complicate monitoring but never expressed
those concerns to others.265 The drill crew repeatedly failed to inform Keith of various activities
that influenced well monitoring data.266
Even after the Transocean crew shut down the pumps to investigate an anomaly, they did not
inform the Sperry Drilling mudlogger, senior Transocean personnel, or the BP well site leader of
the anomaly or ask for their help in resolving it.267
The Chief Counsel‘s team cannot conclude that any one of these problems contributed to the
failure to detect the kick. But together they suggest a communication breakdown that made kick
detection more difficult. Knowledge of ongoing rig activity ―is essential to accurate interpretation
of the data.‖268 Absent that knowledge, it is difficult to ascertain whether anomalous data are
benign or problematic.269
While BP and Transocean Management Were Taking Steps to Improve Well Monitoring, These Steps Had Not (Yet) Improved Kick Detection on the Deepwater Horizon
BP
BP recognized that well control was critically important to its operations. In a 2009 Major
Hazard Risk Assessment, the company identified ―Loss of Well Control‖ as first among the two
―major accident risks‖ in drilling and completions operations.270
BP specifically gave the Deepwater Horizon a mid-range risk rating for loss of well control271 and
acknowledged the potentially severe consequences of a well control failure: ―Catastrophic
188 | National Commission on the BP Deepwater Horizon Oil Spill and Offshore Drilling
health/safety incident‖ with the ―potential for 10 or more fatalities,‖ ―extensive‖ and ―widespread‖
damage to sensitive environments, ―$1 billion - $5 billion‖ in financial impact, ―severe
enforcement action,‖ government intervention, and ―[p]ublic and investor outrage.‖272
To address this risk, BP checked to ensure that all drilling and completions workers had well
control training and certification, developed tools to further assess the risk (―BowTie diagrams,‖
―Risk Mitigation Plans,‖ ―Asset-specific‖ risk assessments, a ―Barrier Assessment Tool‖), and
emphasized that risk management in this area would be ―under continual review.‖273 The
company also planned to evaluate the effectiveness of barriers with each rig‘s team and train
personnel in the new well control response guide.274
BP understood the risks presented by less severe well control events too. An April 14, 2010
presentation to the drilling and completions Extended Leadership Team noted that half of all
nonproductive time in the company‘s offshore drilling sector was the result of ―downhole
problems (wellbore instability, losses, gains, tight hole) and stuck pipe.‖275 The presentation
continued: ―Post analysis of the...incidents clearly indicates that in most cases[,]...events could
have been prevented or decisions influenced if the drilling data that is already generally available
had been appropriately presented and analysed.‖ That is, ―early warning indicators were usually
present albeit invisible in the mountain of data.‖276 Therefore, as Macondo senior manager David
Sims stated, downhole problems were ―low hanging fruit‖ for decreasing nonproductive time.277
Reviews conducted in late 2007 and early 2008 similarly showed that ―the quality of monitoring,
detection and reaction to downhole hazards during drilling operations‖ was ―variable.‖278 In
response, BP planned to develop a program to facilitate Efficient Reservoir Access, the ―ERA
Advisor.‖ This ambitious program would monitor data in real time onshore, generate expert and
automated advice in response to that data, and use new software and sensors to track and
diagnose the data.279 The program‘s goal was to ―ensure the right information is in the right
place at the right time.‖280 It would focus, however, on monitoring data during the drilling of the
well (not end-of-well activities).281 BP‘s Extended Leadership Team developed and endorsed the
ERA in 2009; initial pilot testing of the first stage of the system was to begin in the fourth quarter
of 2010.282
Even before planning its ERA program, BP contracted Sperry-Sun to relay rig data to its Houston
offices. But despite recognizing the risks associated with poor well monitoring and the usefulness
of onshore assistance, BP did not monitor this data for well control purposes. Even though each
of its working rigs had an operations room with dedicated Sperry-Sun data displays,283 BP
typically used these rooms only for meetings and the data were ―not ever monitored.‖284 Thus,
before BP implemented its ERA Advisor system, it failed to take the interim step of ensuring that
someone onshore was monitoring the data systems it already had in place.
This is surprising in light of the fact that BP was particularly concerned about well monitoring at
Macondo. Less than two months before the blowout, on March 8, 2010, the Macondo well took a
kick.285 The kick occurred while the rig was drilling.286 The ―well kicked for 30 minutes before the
trends were obvious enough.‖287 The Transocean drill crew and Sperry Drilling mudlogger—
indeed, the very same Revette, Curtis, Clark, and Keith—observed a gain in flow-out, a slow gain
in the pits, a decrease in equivalent circulating density (ECD), and an increase in gas content.288
The drill crew stopped the pumps, performed a flow check, and shut in the well.289 The situation
soon went ―from bad to worse.‖290 There were ―[m]ajor problems on the well‖:291 The pipe was
stuck. BP ultimately had to sever the pipe and sidetrack the well.292

Chief Counsel’s Report — Chapter 4.7: Kick Detection | 189
After the event, BP involved its in-house Totally Integrated Geological and Engineering Resource
team (the ―TIGER team‖), to conduct an engineering analysis, and (on March 18) distributed a
―lessons learned‖ document to its Gulf of Mexico drilling and completions personnel.293 BP
recommended that its personnel ―evaluate the entire suite of drilling parameters that may be
indicative of a shift in pore-pressure‖ (including gas, flow-out, and flow checks), ―ensure that we
are monitoring all relevant [pore pressure] trend data,‖ ―have [pore pressure] conversations as
soon as ANY indicator shows a change,‖ ―no matter how subtle,‖ and ―be prepared to have some
false alarms and not be afraid of it.‖294 The ―lessons learned‖ document also specified that
―[b]etter lines of communication, both amongst the rig subsurface and drilling personnel, and
with Houston office needs to be reestablished. Preceding each well control event, subtle
indicators of pore pressure increase were either not recognized, or not discussed amongst the
greater group.‖295
In addition, BP wells team leader John Guide initiated several conversations to address the rig‘s
response to the kick, which he thought was ―slow and needed improvement.‖296 Guide specifically
instructed the BP well site leaders to ―up their game.‖297 He spoke with Transocean and Sperry
Drilling personnel about ―tighten[ing] up wellbore monitoring.‖
The goal of Guide‘s conversations and of the TIGER team‘s involvement was to maintain
heightened attentiveness ―for the remainder of the Macondo well,‖298 up to the point
when the Horizon unlatched its BOP and left.299 Evidently, the team fell short of that goal. As
Guide conceded after the incident, the Macondo team‘s heightened attentiveness to well
monitoring lasted all the way up until, apparently, the negative pressure test.300 This is likely
because BP‘s focus, once again, was on monitoring data during the drilling of the well (not
end-of-well activities).301
Transocean
Transocean also recognized the importance of well control. In a 2004 Major Accident Hazard
Risk Assessment, the company gave Deepwater Horizon a 5B risk rating for reservoir blowout,302
meaning that there was a ―Low‖ likelihood of a blowout occurring, but if one did occur, the event
would have ―Extremely Severe‖ consequences:303 ―Multiple personnel injuries and/or fatalities,‖
―Major environmental impact,‖ and ―Major structural damage and possible loss of vessel.‖304 As
prevention and mitigation measures, Transocean listed (among other things) well control
procedures, training of drill crew, and instrumentation indicating well status.305
As discussed in greater detail in Chapter 5, despite those concerns, Transocean did not inform the
Deepwater Horizon‘s crew of lessons learned from an earlier well control event on another rig.
On December 23, 2009, Transocean barely averted a blowout during completion activities on a rig
in the North Sea. Rig personnel were in the process of displacing the wellbore from mud to
seawater.306 They had just completed a successful negative pressure test, and they had lined up
the displacement in a way that inhibited pit monitoring. 307 During the displacement, a critical
tested barrier failed, and hydrocarbons came up the wellbore, onto the drill floor, and into
the sea.308
The incident differed from Macondo in some respects: It occurred during the completion phase
of the well, not drilling or temporary abandonment, and the failed barrier was a mechanical valve,
not cement.309 But the incident was identical to Macondo in crucial respects:
the rig crew underbalanced the well while displacing mud to seawater;
190 | National Commission on the BP Deepwater Horizon Oil Spill and Offshore Drilling
a successful negative pressure test ―blinkered‖ the crew and produced an improper
―change in mindset‖;
the crew conducted displacement operations in ways that inhibited pit monitoring; and
the crew discounted kick indicators by attributing them to other occurrences on the rig.310
Transocean nevertheless failed to effectively share and enforce the lessons learned from that
event with all relevant personnel. The company held two conference calls and distributed an
advisory for its North Sea personnel only. It also posted a shorter advisory about the event on its
electronic documents platform—accessible fleetwide—but it did not alert crews of the advisory‘s
existence. Indeed, there is no evidence that anyone on or affiliated with the Deepwater Horizon
knew of the North Sea incident or read any of its lessons prior to the Macondo blowout.
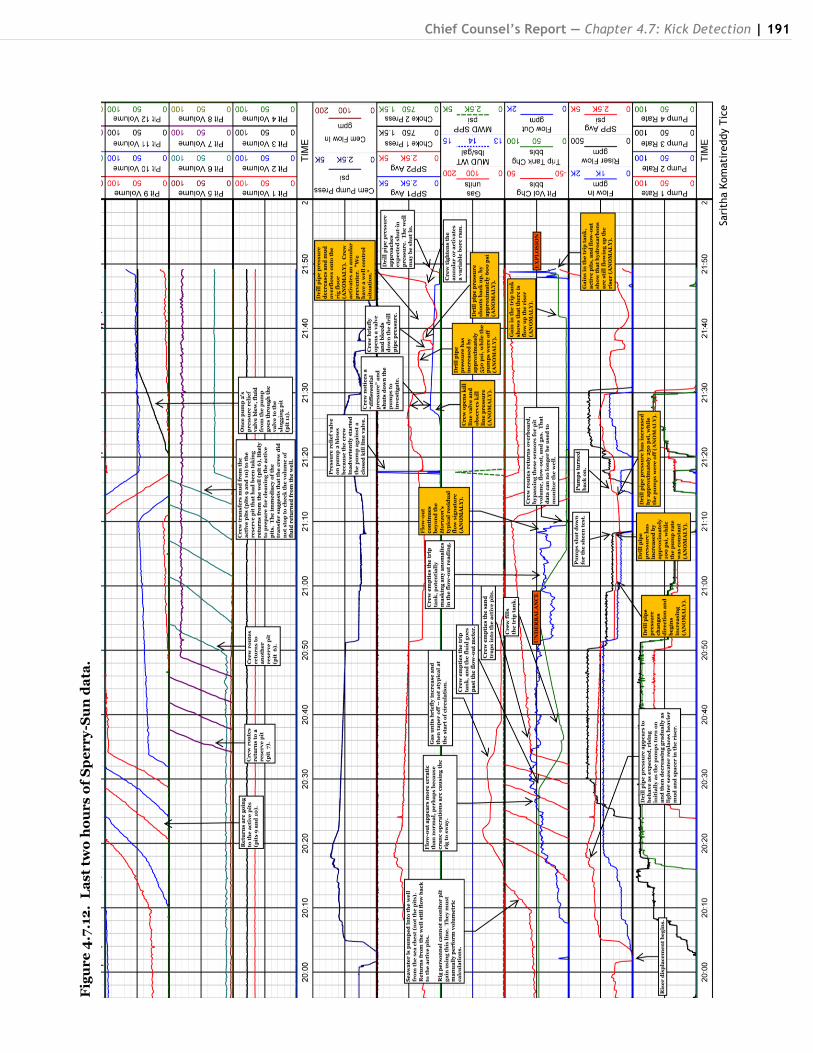
Chief Counsel’s Report — Chapter 4.7: Kick Detection | 191
Sari
tha K
om
ati
reddy T
ice
Fig
ur
e 4
.7.1
2.
La
st
two
ho
ur
s o
f S
pe
rr
y-S
un
da
ta.