Embed Size (px)
Citation preview
July 13, 2017, Governing Board Draft
June 6, 2017, Version
CHAPTER 40E-63 EVERGLADES PROGRAM
PART I EVERGLADES REGULATORY PROGRAM: EVERGLADES AGRICULTURAL AREA (EAA) BASIN
40E-63.091 Publications Incorporated by Reference. (1) “Appendix A1 – Description: Regulated Portion of Everglades Agricultural Area S-5A, S-6, S-7 and S-
8 Basins Palm Beach, Broward and Hendry Counties”, dated [to be determined] January 2001, [HYPERLINK].
(2) “Appendix A2 – No Change. (3) “Appendix A3 – EAA Basin Compliance”, dated [to be determined] January 2001, [HYPERLINK],
and setting forth the procedures the District will follow to determine whether the entire EAA Basin has met the applicable total Phosphorus reduction goals based upon mathematical data analysis.
(4) “Appendix A3.1 – FORTRAN Program for Calculating EAA Basin Flows and Phosphorus Loads”, dated [to be determined] January 2001, [HYPERLINK].
(5) “Appendix A3.2 – Flow Computation Methods Used to Calculate EAA Basin Flows”, dated [to be determined] January 2001, [HYPERLINK], providing applicable mathematical formulas for calculating flow rates through water management structures.
(6) “Appendix A4 – EAA Basin Farm Scale Allocation”, dated [to be determined] January 2001, [HYPERLINK], setting forth the procedure the District will follow to regulate total Phosphorus loads from individual farms when the EAA Basin has been determined to be not in compliance with applicable requirements.
(7) “Appendix A5 – No Change. (8) “Appendix A6 – No Change. (9) South Florida Water Management District Form 0779, dated January 2001, entitled “Application for a
Works of the District Permit”. (10) “South Florida Water Management District Guidance for Preparing an application for “A Works of
the District” Permit in the Everglades Pursuant to Chapter 40E-63, F.A.C.” – No Change. (11) The documents listed in subsections (1) through (10) are hereby incorporated by reference herein, are
published by the District and are available at no cost by contacting the South Florida Water Management District Clerk, on the District’s website (sfwmd.gov) or from the District at 3301 Gun Club Road, West Palm Beach, FL 33406, (800) 432-2045, ext. 6805 or (561) 682-6805 686-8800, upon request.
Rulemaking Authority 373.044, 373.113 FS. Law Implemented 373.016, 373.451, 373.453, 373.4592 FS. History–New 7-3-01, Amended .
40E-63.104 EAA Basin Boundaries. (1) The Everglades Protection Area is generally described as: Water Conservation Areas 1, 2A, 2B, 3A
and 3B, the Arthur R. Marshall Loxahatchee National Wildlife Refuge, and the Everglades National Park. It is depicted on maps and legally described in “Appendix A1,” which is incorporated by reference in Rule 40E-63.091, F.A.C. of Chapter 40E-63, F.A.C., which is published by reference and incorporated into this chapter.
(2) The EAA is generally described as: (a) the area including, but not limited to, the drainage basins of S-2, S-3, S-5A, S-6, S-7, S-8 and S-150.
The EAA is depicted on maps and legally described in “Appendix A1,” which is incorporated by reference in Rule 40E-63.091, F.A.C.; and of Chapter 40E-63, F.A.C.
(b) The Everglades Construction Project diversion basins, consisting of the areas within the boundaries of the South Florida Conservancy District, South Shore Drainage District, East Shore Water Control District,
July 13, 2017, Governing Board Draft
June 6, 2017, Version
East Beach Water Control District, and Closter Farms (also known as 715 Farms or the lessee of agricultural lease number 3420). These basins previously released stormwater to Lake Okeechobee, but stormwater was redirected as new releases to Works of the District within the Everglades under Rule 40E‐63.108, F.A.C., when the diversion projects were completed. The Everglades Construction Project Diversion Basins are depicted on maps and legally described in “Appendix A1,” which is incorporated by reference in Rule 40E-63.091, F.A.C.
(3) The areas described in subparagraphs (2) (a) and (b) are regulated under Part I of this Chapter and are included in calculating phosphorus load reductions as set forth in “Appendix A3” and “Appendix A4,” which are incorporated by reference in Rule 40E-63.091, F.A.C.
Rulemaking Authority 373.044, 373.113 FS. Law Implemented 373.016, 373.085, 373.086, 373.451, 373.453, 373.4592 FS. History–New 1-22-92, Amended 7-3-01, .
40E-63.106 Works of the District within the Everglades. The following Works of The District within the Everglades Agricultural Area Basin include are or have been used for calculating compliance with the phosphorus load reduction objectives of the Everglades program: S-2, S-3, S-5A, S-6, S-7, S-8, S-150, G-88, G-136, G-200, G-344A, G-344B, G-344C, G-344D, G-349B, G-350B, G-357, G-404, G-410, G-402-A, G-402-B, G-402-C, G-402-D, G-605, G-606, Miami Canal, North New River Canal, Hillsboro Canal, C-51 (at both current and ultimate discharge locations into the Everglades Protection Area), and their open channel connections. The Works of the District and other structures which are or have been used for calculating compliance with the phosphorus load reduction objectives of the Everglades program are set forth in “Appendix A3,” which is incorporated by reference in Rule 40E-63.091, F.A.C.
Rulemaking Authority 373.044, 373.113 FS. Law Implemented 373.016, 373.085, 373.086, 373.451, 373.453, 373.4592 FS. History–New 1-22-92, Amended 7-3-01, .
July 13, 2017, Governing Board Draft
June 6, 2017, Version
APPENDIX A1 DESCRIPTION
REGULATED PORTION OF EVERGLADES AGRICULTURAL AREA
S-5A, S-6, S-7 AND S-8 BASINS PALM BEACH, BROWARD AND HENDRY COUNTIES
[Amendments to this appendix are under development]
EVERGLADES PROGRAM: EAA CHAPTER 40E-63, Appendix A3 July-01
July 13, 2017, Governing Board DRAFT
June 6, 2017, Version A3-1
APPENDIX A3
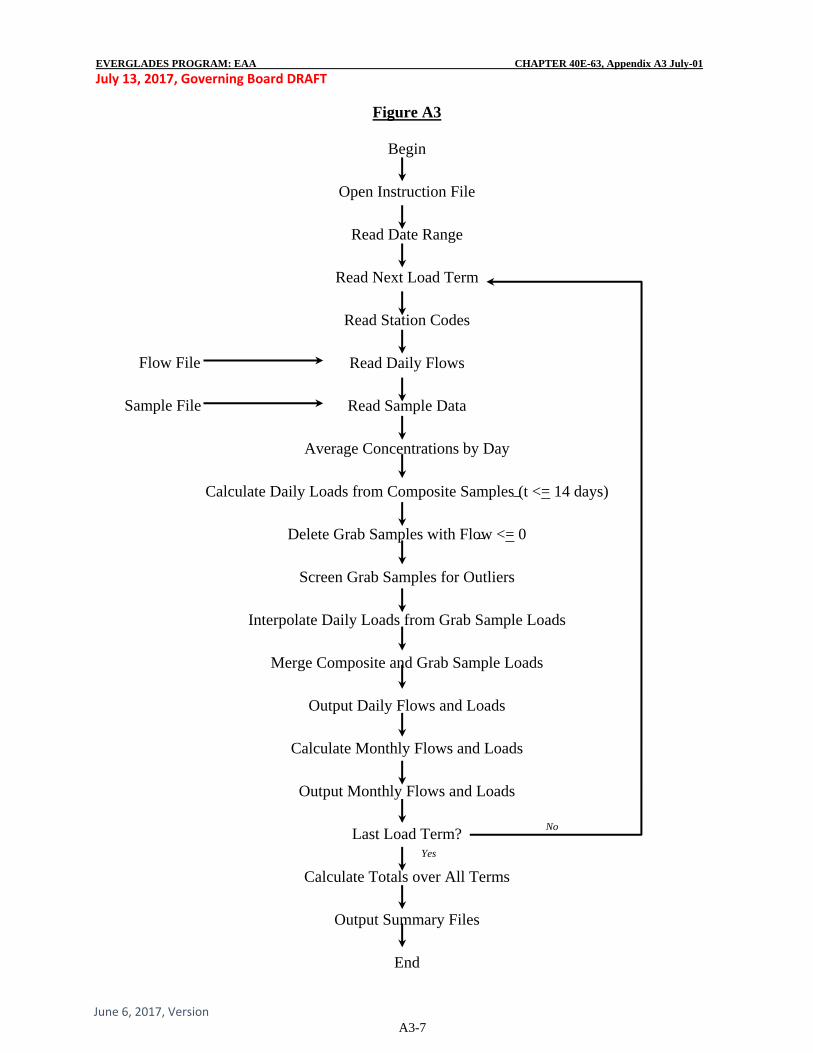
EAA BASIN COMPLIANCE INTRODUCTION This Appendix sets forth the procedures the District shall will follow in the future to determine whether the entire EAA Basin has met the goal of reducing total phosphorus (TP) discharged by 25 percent, under any set of hydrologic conditions that could arise, after implementation installation of farm-level BMPs as described in Part I of Chapter 40E-63, F.A.C., The first determination was for the period, May 1, 1995 through April 30, 1996, and annually thereafter. The annual determination requires calculation of future TP load leaving the structures from the EAA (location shown in Figure A4 and listed in Table A1). The load calculation must will also include phosphorus carried into Lake Okeechobee through backpumping when this occurs. It also requires the and adjustment for pass-through flows released from Lake Okeechobee and other sources to Stormwater Treatment Areas, the Holey Land, Water Conservation Areas and the Lower East Coast. Load is the amount of phosphorus carried past a monitoring point by the movement of water. Data on water quality concentration and water quantity (flow) are required to calculate the phosphorus load discharged from a monitoring point. Data on water quality and quantity at the EAA structures are available from several sources – the District, the U. S. Army Corps of Engineers, and the U.S. Geological Service. Several methods of collecting the data are also used. Accordingly, the best method of data collection and source of data to use in a load calculation must be identified. The water quality and quantity collection sources and methods currently available are described below. The Mmethods are improved continuously as new equipment becomes available and technology changes improves. However, existing methods of data collection are continued concurrently with the new methods for a substantial period of time. Annually, wWhen the District reports the results of the determination of whether the EAA Basin has reduced total phosphorus load by 25% for the period of May 1 through - April 30, annually beginning in 1996, the sources and methods of data collection used in the calculation must will be described and available for inspection. Any changes in methods from the prior year must will be specified. Substantially affected persons will have an opportunity to request an administrative hearing. The District shall incorporate permanent changes in methods into this Appendix periodically through Chapter 120, Florida Statutes, rulemaking proceedings. The load calculations involve detailed procedures, which have been automated by a computer program in FORTRAN language. A flow chart of the program is shown in Figure A3. The methods and equations used in the program are outlined in Appendix A3.1: FORTRAN Program for Calculating EAA Basin Flows and Phosphorus Loads (EAA Basin Compliance model), which is published by reference and incorporated into this Chapter. These methods and equations They are also available electronically on diskette. DATA COLLECTION SOURCES AND METHODS Water Quantity – Flows The South Florida Water Management District and the U.S. Geological Survey (USGS) compute flow at all the major water control structures in the Everglades Agricultural Area. Water control
EVERGLADES PROGRAM: EAA CHAPTER 40E-63, Appendix A3 July-01
July 13, 2017, Governing Board DRAFT
June 6, 2017, Version A3-2
structures include pumps, gated spillways, and gated culverts. Pump stations S-2, S-3, and S-6 allow water to flow in the opposite direction of pumping by siphoning. All pump stations except S-6 have an adjacent gated spillway. The SFWMD uses various methods to compute flow at control structures. Flow at pump stations is calculated using discharge rating equations provided by the pump manufacturer and calibrated by discharge measurements. Flow at gated spillways is calculated using formulae derived by the Corps of Engineers from the Bernoulli equation. Discharge through culverts is calculated using standard equations for weir flow, orifice flow, pipe flow, and open channel flow. Flow computation methods are outlined in Appendix A3.2, which is published by reference and incorporated into this Chapter. The SFWMD obtains field measurements of stage and control operations through various means. Real-time stage and control operations data are collected via the telemetry system. Analog data is obtained from chart recorders. Digital data are provided by punch tapes and solid state data loggers. Pump station operators log readings of stage and control operations hourly during pumping operations. In addition, staff gauge readings, gate opening measurements, and flashboard elevation measurements are conducted by field personnel who routinely visit unmanned structures. The SFWMD's hydrologic database stores multiple flow data sets at each structure. Each flow data set is created using a unique combination of sources of stage and control operations data. The USGS publishes one set of flow data for each structure. If convenient, the USGS presents combined flow data from different locations. The SFWMD uses the USGS's data as well as its own data to perform water budget analyses and estimation techniques to obtain a "preferred" flow data set at each structure. Table A1 shows all the flow data sets available in the SFWMD's hydrologic database (DBHYDRO). Water Quality A water sample collected in the field is called a "raw water sample", in differentiation with a "water sample" used in the chemistry laboratory. Current raw water sample collecting methods at different structures are listed in Table A2. All raw water samples collected in the EAA in the future for compliance must will be collected by automatic sampler. Automatic samplers must will be programmed to take flow proportional composite samples. Where on-site real-time flow computation is impossible, time proportional composite samples will be taken. Grab samples must will also be continued until the relationships between results from automatic and manual methods has been sufficiently established. After that time, grab samples must will be taken when autosamplers are not functioning, or when necessary for other purposes. Only a portion of a well-mixed raw water sample is used as a water sample in actual quantitative analysis of a given water quality parameter. The chemical analysis is performed by a certified laboratory using accepted standard methods. In case of change of laboratories or analytical methods, concurrent analyses shall be done until correlation between them can be established. Water quality parameters are identified by structure and collection site, project code, sample date, and serial number of the sample. The data are stored in data base WQDMAIN DBHYDRO. Rainfall
EVERGLADES PROGRAM: EAA CHAPTER 40E-63, Appendix A3 July-01
July 13, 2017, Governing Board DRAFT
June 6, 2017, Version A3-3
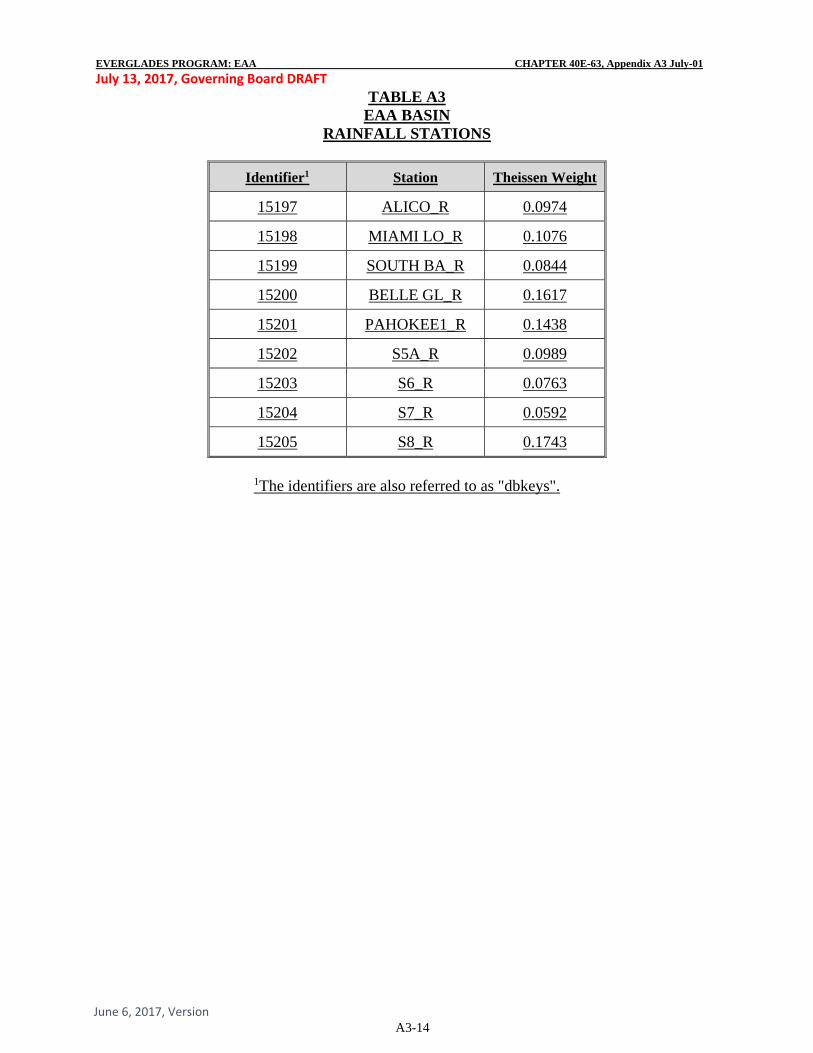
EAA rainfall is calculated from measurements at representative rainfall gauges. Rainfall gauges provide an estimate of rainfall at a “point” location. Since rainfall is expected to vary in intensity and duration over an area, rainfall data from representative gauges are area-weighted using the Thiessen Polygon Method. Nine rainfall gauges have historically been used to estimate EAA rainfall. Daily rainfall data for each rainfall gauge are stored in the DBHYDRO database. The rainfall gauge station names, DBHYDRO identifiers and area-weights corresponding to each rainfall gauge station are listed in Table A3. EAA rainfall for the May 1 through April 30 period is calculated as the area-weighted sum of the daily rainfall measurements at each rainfall gauge. Data Upgrades There are three ways in which the quality and reliability of District flow data are being improved: (1) establishment of single time series of flow for each station from multiple sources of stage and control operations data, (2) verification and calibration of flow equations through intensified discharge measurements at all major EAA structures, and (3) calibration of AVM systems for future use as an additional source of flow data. Efforts are currently under way to establish a single time series of flow data calculated at each flow station. A prioritized list of sources of stage and control operations data must will be established for each flow station. Flow must will be computed from the highest ranking sources. When the highest ranking source of data is missing, the next highest source must will be used, and so on. This method will ensures the calculation of the best flow values from all sources and will minimizes missing data. Stream gauging is being intensified to provide discharge measurements at all major EAA structures. Statistical analyses are conducted under way to verify or calibrate the discharge rating equations. The upgrading of stream gauging equipment, including a portable acoustic low velocity meter, as well as improved measuring techniques will ensures valuable field measurements. Statistical analysis and calibration of rating equations will continue to increase the accuracy of the calculated flow values. AVM systems are in place at most major EAA structures. Calibration of these systems is being performed by the USGS. When these systems are satisfactorily calibrated, the data are will be used to verify the District's flow computations. If these systems prove to be highly reliable and accurate, they may provide the highest ranking source of flow data for the prioritization of single time series. If any upgrades in water quality sampling are undertaken in the future, concurrent samples must will be taken by the existing methods to maintain data continuity, at least until the upgraded methods have been tested and documented as reliable. DETERMINATION OF COMPLIANCE WITH 25% REDUCTION OF TOTAL PHOSPHORUS LOAD The future TP load must will be evaluated for compliance with the 25% TP load reduction requirement yearly as of April 30, a date which corresponds generally with the change from the dry to the wet rainfall periods. Hydrology, that is, discharge and rainfall, are dominant factors when computing TP loads. Because rainfall and stream flow are subject to large temporal and spatial variation in south Florida, the evaluation for compliance adjusts the TP load for
EVERGLADES PROGRAM: EAA CHAPTER 40E-63, Appendix A3 July-01
July 13, 2017, Governing Board DRAFT
June 6, 2017, Version A3-4
hydrologic variability. Otherwise, the hydrologic variability could be large enough to obscure the effectiveness of BMPs to reduce TP loadings. The adjustment for hydrologic variability includes two components: 1. A model to estimate future TP loads. The model estimates a future TP load of the EAA Basin by substituting future hydrologic conditions for the conditions that occurred during a base- period (water years 1978 - 1988). The estimation is based on hydrologic data collected from any future time period of May 1 - April 30. The estimation incorporates a calculation for the required 25% TP load reduction. 2. Accommodation for possible statistical error. This in the model is accomplished by specifying a required level of statistical confidence in the prediction of the long-term average TP load. The 90th percentile confidence level is was selected as reasonable. Evaluation of the EAA Basin for compliance with the 25% TP load reduction requirement must will be based upon the following: 1. If the actual measured TP loading from the EAA Basin (Actual TP Loading) in a future May 1 - April 30 period is less than the model TP load estimate (Target TP Loading), then the EAA Basin will be determined to be "In Compliance," that is, to have met the 25% TP load reduction requirement. After completion of the STAs or other regional projects, the actual percentage of the base period TP load which must be met to be determined "In Compliance" must will be reduced to reflect land converted to STAs or regional projects no longer using the Works of the District within the EAA taken out of agricultural production. However, the average unit area reduction required will be the same, both pre- and post-regional project STA completion. 2. If the Actual TP Loading actual measured TP loading from the EAA Basin exceeds the model TP load estimate (Target) in 3 or more consecutive May 1 - April 30 periods, then the EAA Basin will be determined to be "Not In Compliance" – that is, it will not have met the 25% load reduction requirement. If the Target is exceeded in a May 1 - April 30 period, and the District determines that the adjusted rainfall for the period exceeds 63.76 inches, the Target will be suspended for the EAA Basin will not be determined to be "Not In Compliance" for that period only. Any periods in which the Target is suspended must will be excluded from the determination of whether the Target has been exceeded in 3 or more consecutive May 1 - April 30 periods, that is, the EAA Basin will be determined to be "Not In Compliance" when the Target is exceeded for 3 May 1 - April 30 periods, without an intervening May 1 - April 30 period in which the EAA Basin has been determined to be "In Compliance," even though the three periods may be interrupted by periods of suspension. 3. If the Actual TP Loading actual measured TP loading from the EAA Basin exceeds the “upper 90% confidence limit of the Target” (Limit), in any May 1-April 30 period, the EAA Basin will be determined to be "Not in Compliance," that is, it will not have met the 25% load reduction requirement. If the Limit is exceeded in a May 1 - April 30 period, and the District determines that the adjusted rainfall for the period exceeds 63.76 inches, the Limit must will be suspended and the EAA Basin will not be determined to be "Not In Compliance" for that period only.
EVERGLADES PROGRAM: EAA CHAPTER 40E-63, Appendix A3 July-01
July 13, 2017, Governing Board DRAFT
June 6, 2017, Version A3-5
4. A determination of suspension under paragraphs 2 and 3 above determined, and a Notice of Rights to petition for a hearing under Section 120.57, Florida Statutes, and Section 373.114, Florida Statutes, shall be published in the Florida Administrative Weekly. 5. The Target and Limit must will be calculated according to the following equations and explanation: To reflect the required 25% reduction, POR TP loads are multiplied by 0.75 before performing the following regression: 1n(L) = -7.998 + 2.868 X + 3.020 C - 0.3355 S [Explained Variance = 90.8%, Standard Error of Estimate = .183] Predictors (X, C, S) are calculated from the first three moments (m1,m2,m3) of the 12 monthly rainfall totals (ri, i=1,12, inches) for the current year: m1 = Sum [ ri ] / 12 m2 = Sum [ ri - m1 ]2 / 12 m3 = Sum [ ri - m1 ]3 / 12 X = 1n (12 m1) C = [ (12/11) m2].5/m1 S = (12/11) m3 / m2 1.5
where, L = 12-month load attributed to EAA Runoff, reduced by 25% (metric tons) X = natural logarithm of 12-month total rainfall (inches) C = coefficient of variation calculated from 12 monthly rainfall totals S = skewness coefficient calculated from 12 monthly rainfall totals The first predictor (X) indicates that load increases approximately with the cube of total annual rainfall. The second and third predictors (C & S) indicate that the load resulting from a given annual rainfall is higher when the distribution of monthly rainfall has higher variance or lower skewness. For a given annual rainfall, the lowest load occurs when rainfall is evenly distributed across months and the highest load occurs when all of the rain falls in one month. Real cases fall in between. Compliance must will be tracked by comparing the measured EAA Load with: Target = exp [ -7.998 + 2.868 X + 3.020 C - 0.3355 S ] Limit = Target exp (1.476 SE F)
EVERGLADES PROGRAM: EAA CHAPTER 40E-63, Appendix A3 July-01
July 13, 2017, Governing Board DRAFT
June 6, 2017, Version A3-6
SE = .1833 [1 + 1/9 + 5.125 (X-Xm)2 + 17.613 (C-Cm)2 + 0.5309 (S-Sm)2 + 8.439 (X-Xm) (C-Cm) - 1.284 (X-Xm) (S-Sm) - 3.058 (C-
Cm) (S-Sm) ].5 where, m = subscript denoting average value of predictor in base period (Xm = 3.866, Cm =
0.7205, Sm = 0.7339) Target = predicted load for future rainfall conditions (metric tons/yr) Limit = upper 90% confidence limit for Target (metric tons/yr) SE = standard error of predicted 1n(L) for May-April interval F = factor to reflect variations in model standard error as a function of month (last in
12-month interval), calculated from base period:
Month: Jan Feb Mar Apr May Jun Jul Aug Sep Oct Nov Dec
F: 1.975 1.609 1.346 1.000 1.440 1.238 1.321 2.045 2.669 2.474 2.420 2.216
EVERGLADES PROGRAM: EAA CHAPTER 40E-63, Appendix A3 July-01
July 13, 2017, Governing Board DRAFT
June 6, 2017, Version A3-7
Figure A3
Begin
Open Instruction File
Read Date Range
Read Next Load Term
Read Station Codes
Read Daily Flows
Read Sample Data
Average Concentrations by Day
Calculate Daily Loads from Composite Samples (t <= 14 days)
Delete Grab Samples with Flow <= 0
Screen Grab Samples for Outliers
Interpolate Daily Loads from Grab Sample Loads
Merge Composite and Grab Sample Loads
Output Daily Flows and Loads
Calculate Monthly Flows and Loads
Output Monthly Flows and Loads
Last Load Term?
Calculate Totals over All Terms
Output Summary Files
End
Flow File
Sample File
Yes
No
EVERGLADES PROGRAM: EAA CHAPTER 40E-63, Appendix A3 July-01
July 13, 2017, Governing Board DRAFT
June 6, 2017, Version A3-8
TABLE A1 EAA BASIN DRAINAGE STRUCTURES
DATABASE KEYS TO FLOW DATA TIME SERIES Structure Preferred1 Effective Date2 Inactive Date3
(if applicable)
S-352 Complex 15068 Base Period
S-2 Complex 15021 Base Period
S-3 Complex 15018 Base Period
S-5A Complex 15031 Base Period
S-6 15034 Base Period
S-7 15037 Base Period 01/08/2005
S-150 15041 Base Period 01/08/2005
S-8 15040 Base Period 01/08/2005
G-88 15196 Base Period 06/30/2000
G-136 15195 Base Period
G-200 15736 10/28/1991 01/08/2005
G-250 16222 01/25/1994 07/10/1999
EVERGLADES PROGRAM: EAA CHAPTER 40E-63, Appendix A3 July-01
July 13, 2017, Governing Board DRAFT
June 6, 2017, Version A3-9
Structure Preferred1 Effective Date2 Inactive Date3 (if applicable)
G-600 GG955 03/06/1997 04/30/2005
G-605 H3143 11/24/1997 06/30/2000
G-606 HD889 11/24/1997 06/30/2000
G-328 J0718 04/01/2000
G-344A J0719 10/01/1999 07/22/2005
G-344B J0720 10/01/1999 07/22/2005
G-344C J0721 10/01/1999 07/22/2005
G-344D J0722 10/01/1999 07/22/2005
G-349B JA353 10/01/1999 07/22/2005
G-350B JA352 10/01/1999 07/22/2005
G-410 LX270 07/17/2001 07/22/2005
G-402A LX264 07/17/2001 01/08/2005
G-402B LX265 07/17/2001 01/08/2005
G-402C LX266 07/17/2001 01/08/2005
G-402D LX267 07/17/2001 03/30/2004
G-404 LX269 05/06/2000 01/08/2005
EBPS LX274 07/01/2001 04/30/2018
ESPS LX273 12/20/2001 04/30/2018
G-357 LX263 03/01/2001 01/08/2005
G-204 SG578 05/01/2003 01/08/2005
G-205 SG579 05/01/2003 01/08/2005
G-206 SG580 05/01/2003 01/08/2005
G-507 SJ382 12/01/2003 07/22/2005
G-370 TA438 10/01/2003
G-372 TA437 10/01/2003
G-376A TA445 02/27/2004 01/08/2005
G-376D TA446 02/27/2004 01/08/2005
G-379A TA449 09/17/2004 01/08/2005
G-379D TA450 09/17/2004 01/08/2005
G-381A TA447 06/09/2004 01/08/2005
G-381C TA448 06/09/2004 01/08/2005
SSDD TA459 06/01/2004 04/30/2018
SFCD TR998 08/01/2005 04/30/2018
G-371 TS261 02/01/2006
EVERGLADES PROGRAM: EAA CHAPTER 40E-63, Appendix A3 July-01
July 13, 2017, Governing Board DRAFT
June 6, 2017, Version A3-10
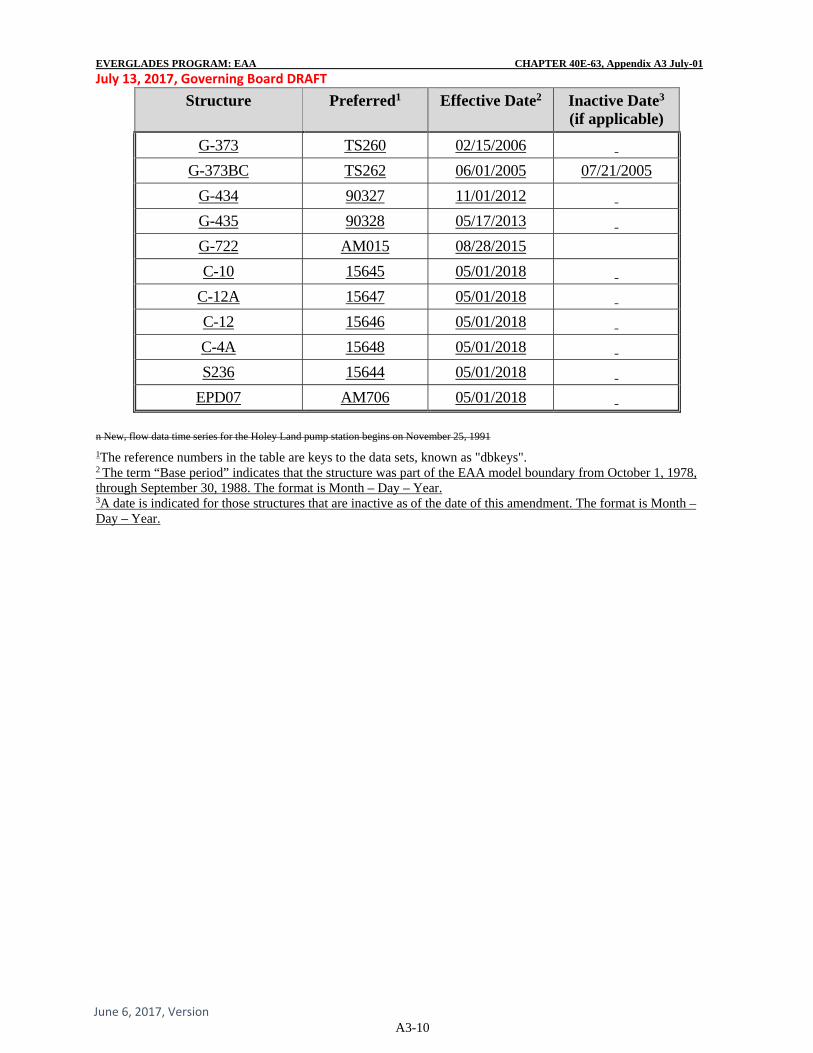
Structure Preferred1 Effective Date2 Inactive Date3 (if applicable)
G-373 TS260 02/15/2006
G-373BC TS262 06/01/2005 07/21/2005
G-434 90327 11/01/2012
G-435 90328 05/17/2013
G-722 AM015 08/28/2015
C-10 15645 05/01/2018
C-12A 15647 05/01/2018
C-12 15646 05/01/2018
C-4A 15648 05/01/2018
S236 15644 05/01/2018
EPD07 AM706 05/01/2018
n New, flow data time series for the Holey Land pump station begins on November 25, 1991
1The reference numbers in the table are keys to the data sets, known as "dbkeys". 2 The term “Base period” indicates that the structure was part of the EAA model boundary from October 1, 1978, through September 30, 1988. The format is Month – Day – Year. 3A date is indicated for those structures that are inactive as of the date of this amendment. The format is Month – Day – Year.
EVERGLADES PROGRAM: EAA CHAPTER 40E-63, Appendix A3 July-01
July 13, 2017, Governing Board DRAFT
June 6, 2017, Version A3-11
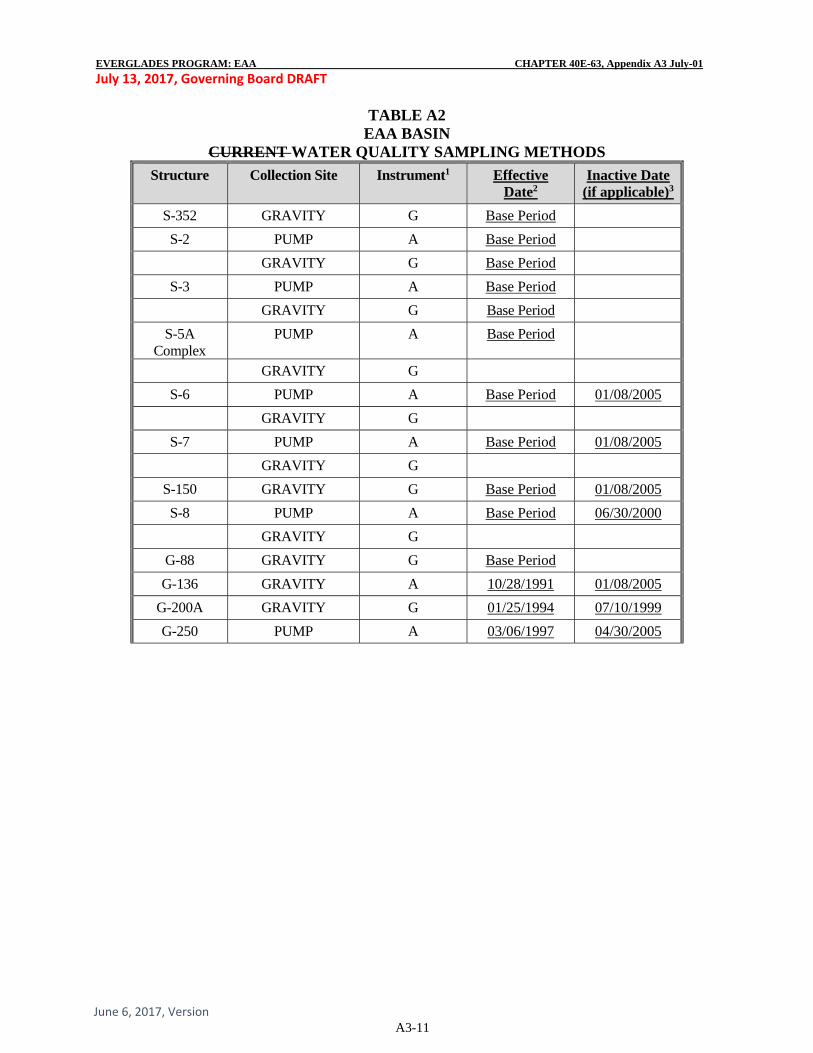
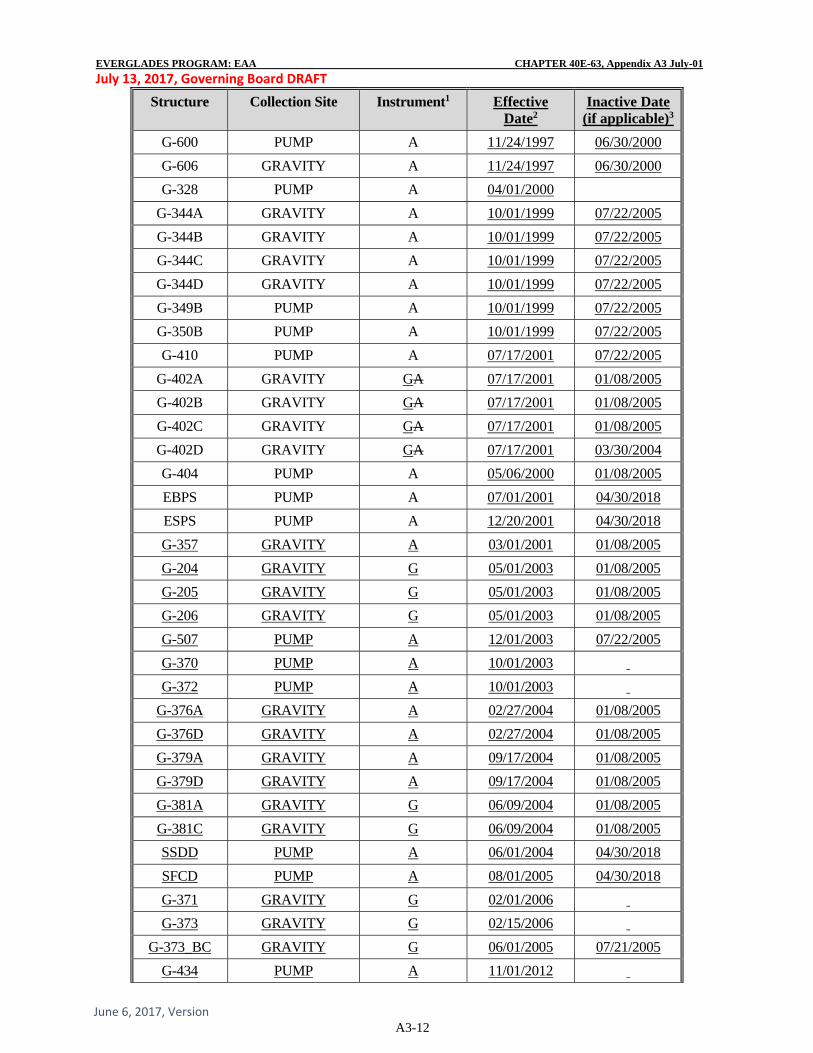
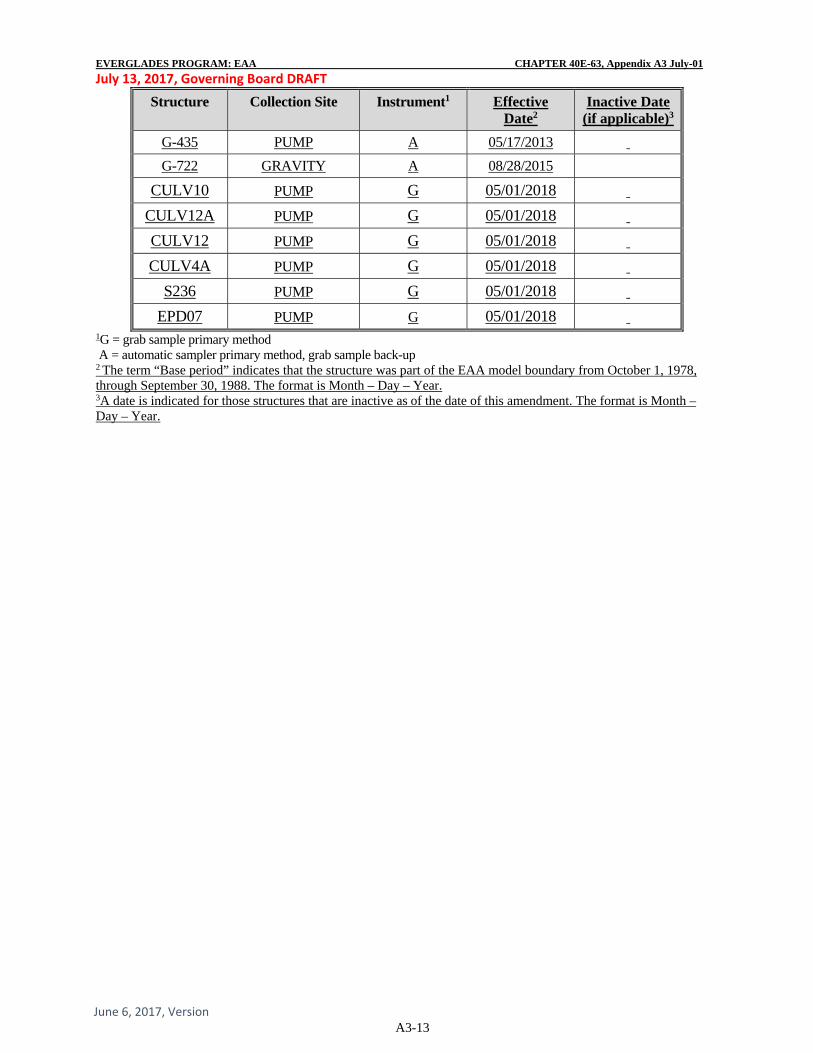
TABLE A2
EAA BASIN CURRENT WATER QUALITY SAMPLING METHODS
Structure Collection Site Instrument1 Effective Date2
Inactive Date (if applicable)3
S-352 GRAVITY G Base Period
S-2 PUMP A Base Period
GRAVITY G Base Period
S-3 PUMP A Base Period
GRAVITY G Base Period
S-5A Complex
PUMP A Base Period
GRAVITY G
S-6 PUMP A Base Period 01/08/2005
GRAVITY G
S-7 PUMP A Base Period 01/08/2005
GRAVITY G
S-150 GRAVITY G Base Period 01/08/2005
S-8 PUMP A Base Period 06/30/2000
GRAVITY G
G-88 GRAVITY G Base Period
G-136 GRAVITY A 10/28/1991 01/08/2005
G-200A GRAVITY G 01/25/1994 07/10/1999
G-250 PUMP A 03/06/1997 04/30/2005
EVERGLADES PROGRAM: EAA CHAPTER 40E-63, Appendix A3 July-01
July 13, 2017, Governing Board DRAFT
June 6, 2017, Version A3-12
Structure Collection Site Instrument1 Effective Date2
Inactive Date (if applicable)3
G-600 PUMP A 11/24/1997 06/30/2000
G-606 GRAVITY A 11/24/1997 06/30/2000
G-328 PUMP A 04/01/2000
G-344A GRAVITY A 10/01/1999 07/22/2005
G-344B GRAVITY A 10/01/1999 07/22/2005
G-344C GRAVITY A 10/01/1999 07/22/2005
G-344D GRAVITY A 10/01/1999 07/22/2005
G-349B PUMP A 10/01/1999 07/22/2005
G-350B PUMP A 10/01/1999 07/22/2005
G-410 PUMP A 07/17/2001 07/22/2005
G-402A GRAVITY GA 07/17/2001 01/08/2005
G-402B GRAVITY GA 07/17/2001 01/08/2005
G-402C GRAVITY GA 07/17/2001 01/08/2005
G-402D GRAVITY GA 07/17/2001 03/30/2004
G-404 PUMP A 05/06/2000 01/08/2005
EBPS PUMP A 07/01/2001 04/30/2018
ESPS PUMP A 12/20/2001 04/30/2018
G-357 GRAVITY A 03/01/2001 01/08/2005
G-204 GRAVITY G 05/01/2003 01/08/2005
G-205 GRAVITY G 05/01/2003 01/08/2005
G-206 GRAVITY G 05/01/2003 01/08/2005
G-507 PUMP A 12/01/2003 07/22/2005
G-370 PUMP A 10/01/2003
G-372 PUMP A 10/01/2003
G-376A GRAVITY A 02/27/2004 01/08/2005
G-376D GRAVITY A 02/27/2004 01/08/2005
G-379A GRAVITY A 09/17/2004 01/08/2005
G-379D GRAVITY A 09/17/2004 01/08/2005
G-381A GRAVITY G 06/09/2004 01/08/2005
G-381C GRAVITY G 06/09/2004 01/08/2005
SSDD PUMP A 06/01/2004 04/30/2018
SFCD PUMP A 08/01/2005 04/30/2018
G-371 GRAVITY G 02/01/2006
G-373 GRAVITY G 02/15/2006
G-373_BC GRAVITY G 06/01/2005 07/21/2005
G-434 PUMP A 11/01/2012
EVERGLADES PROGRAM: EAA CHAPTER 40E-63, Appendix A3 July-01
July 13, 2017, Governing Board DRAFT
June 6, 2017, Version A3-13
Structure Collection Site Instrument1 Effective Date2
Inactive Date (if applicable)3
G-435 PUMP A 05/17/2013
G-722 GRAVITY A 08/28/2015
CULV10 PUMP G 05/01/2018
CULV12A PUMP G 05/01/2018
CULV12 PUMP G 05/01/2018
CULV4A PUMP G 05/01/2018
S236 PUMP G 05/01/2018
EPD07 PUMP G 05/01/2018 1G = grab sample primary method A = automatic sampler primary method, grab sample back-up 2 The term “Base period” indicates that the structure was part of the EAA model boundary from October 1, 1978, through September 30, 1988. The format is Month – Day – Year. 3A date is indicated for those structures that are inactive as of the date of this amendment. The format is Month – Day – Year.
EVERGLADES PROGRAM: EAA CHAPTER 40E-63, Appendix A3 July-01
July 13, 2017, Governing Board DRAFT
June 6, 2017, Version A3-14
TABLE A3 EAA BASIN
RAINFALL STATIONS
Identifier1 Station Theissen Weight
15197 ALICO_R 0.0974
15198 MIAMI LO_R 0.1076
15199 SOUTH BA_R 0.0844
15200 BELLE GL_R 0.1617
15201 PAHOKEE1_R 0.1438
15202 S5A_R 0.0989
15203 S6_R 0.0763
15204 S7_R 0.0592
15205 S8_R 0.1743
1The identifiers are also referred to as "dbkeys".
EVERGLADES PROGRAM: EAA CHAPTER 40E-63, Appendix A3.1 July-01
July 13, 2017, Governing Board DRAFT
June 6, 2017, Version A3.1-1
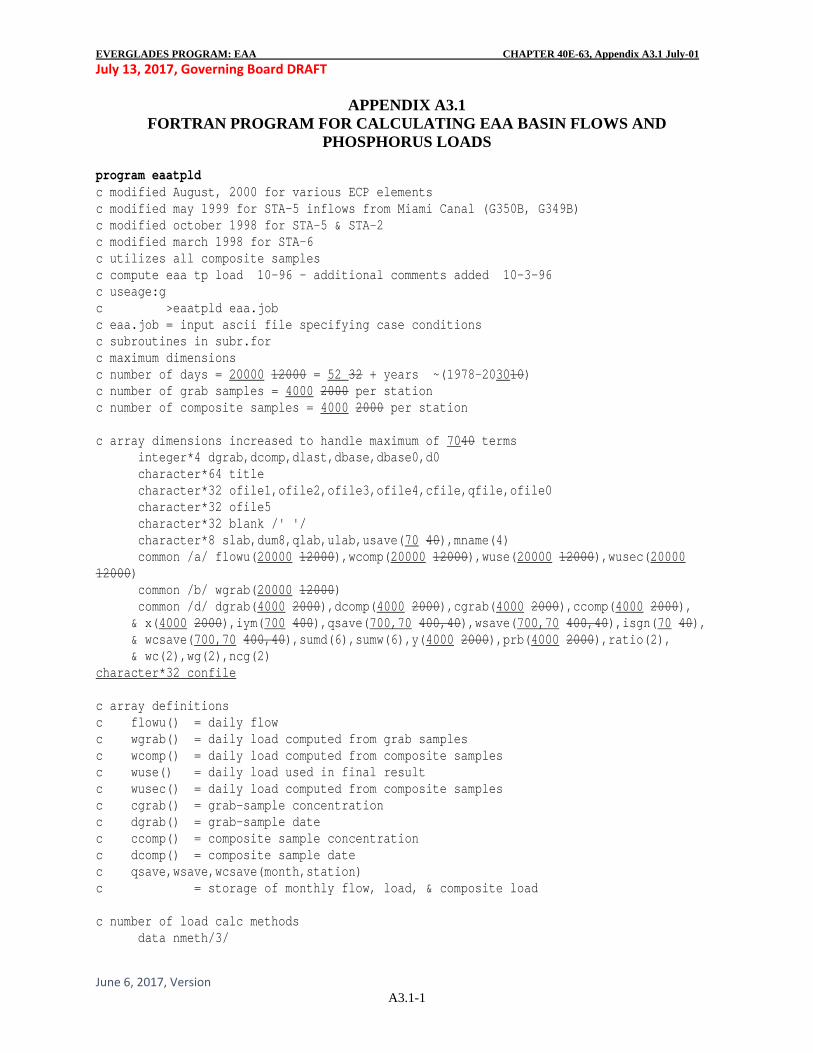
APPENDIX A3.1 FORTRAN PROGRAM FOR CALCULATING EAA BASIN FLOWS AND
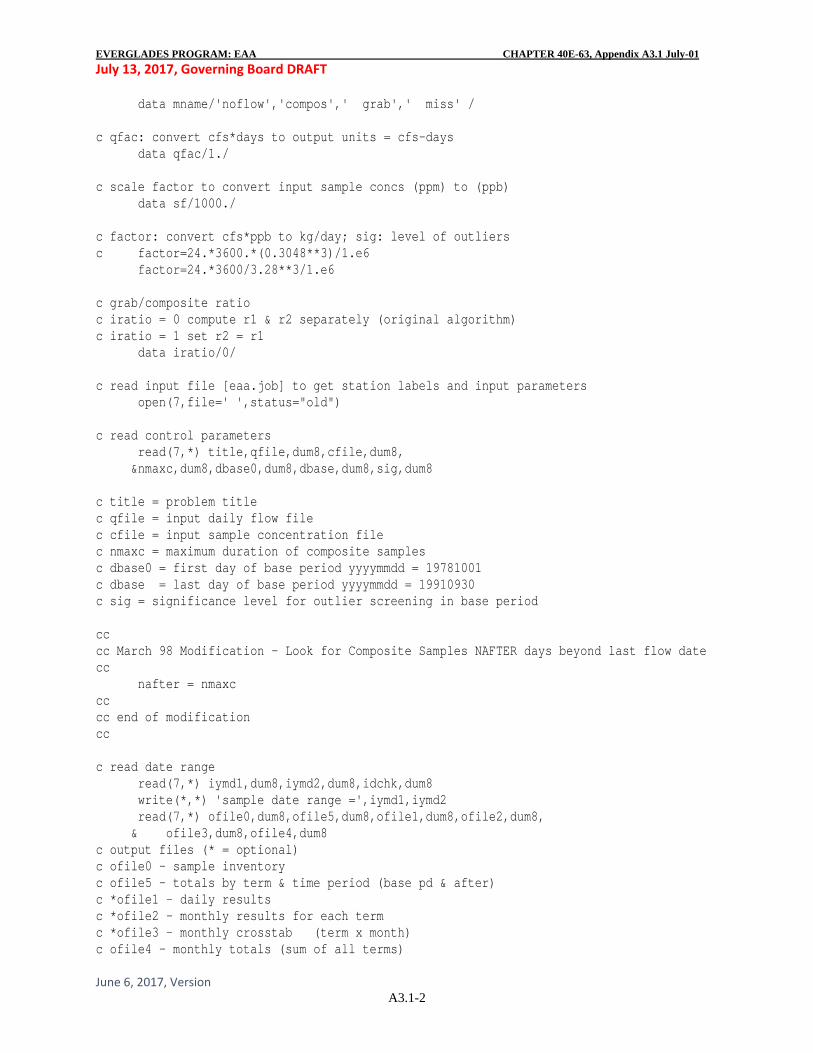
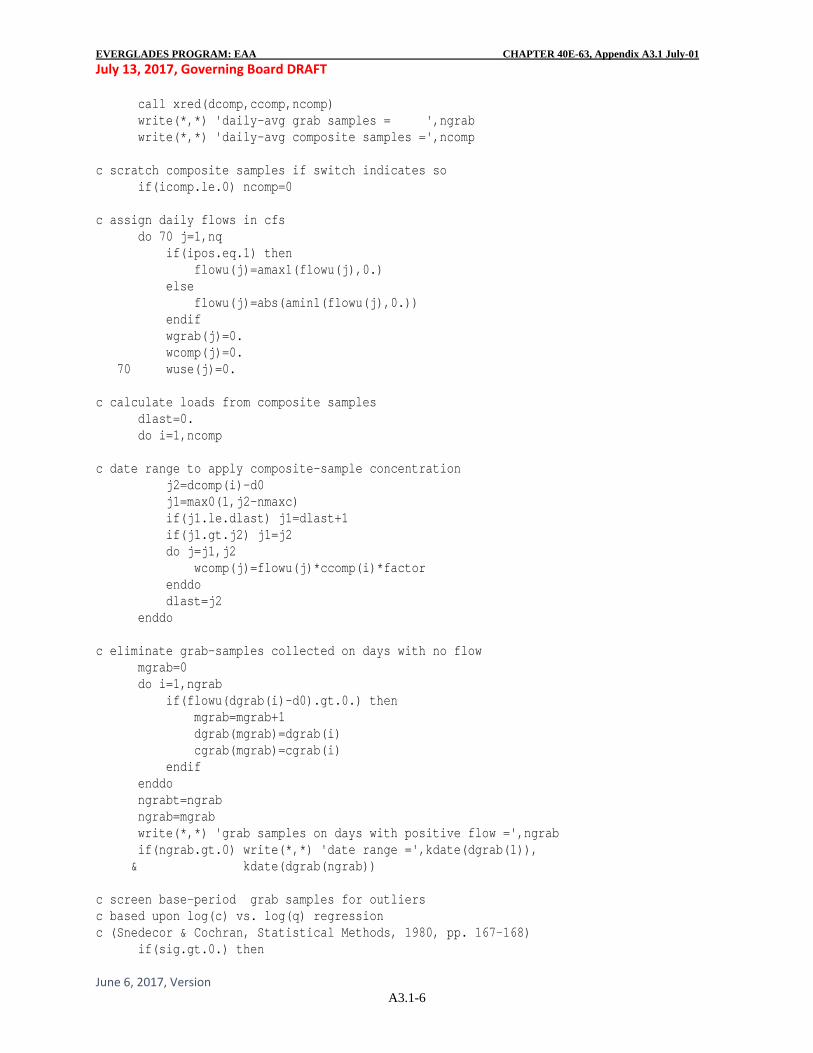
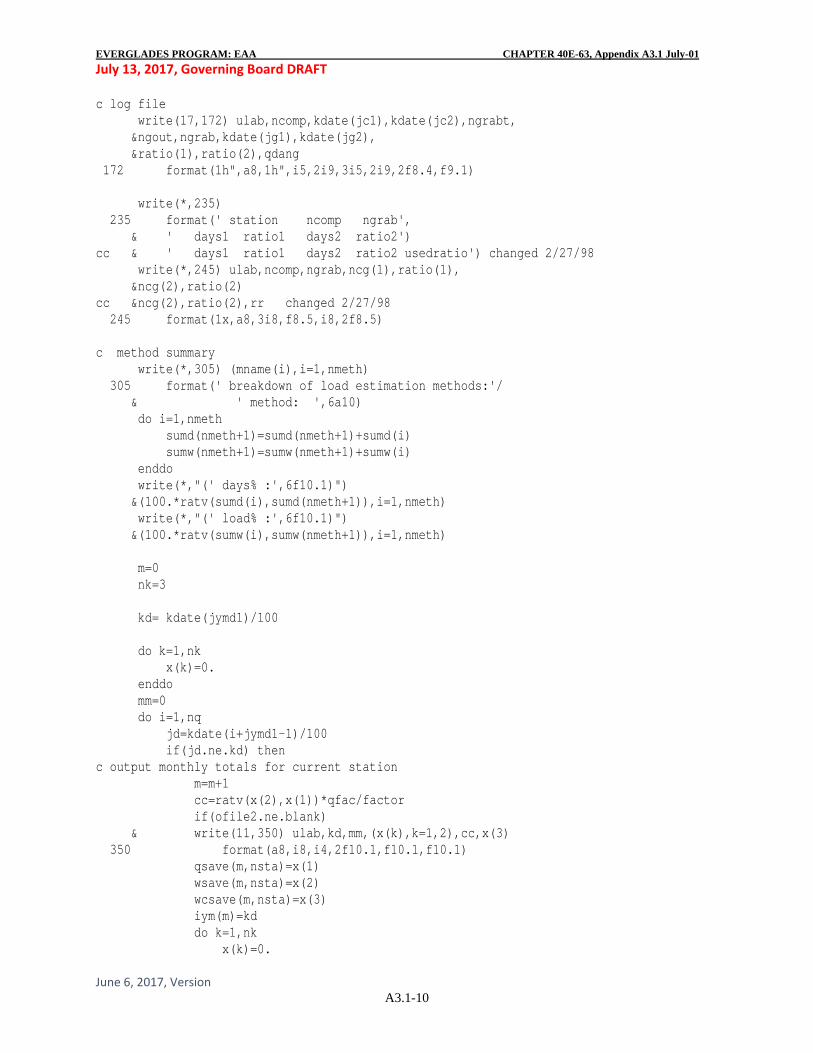
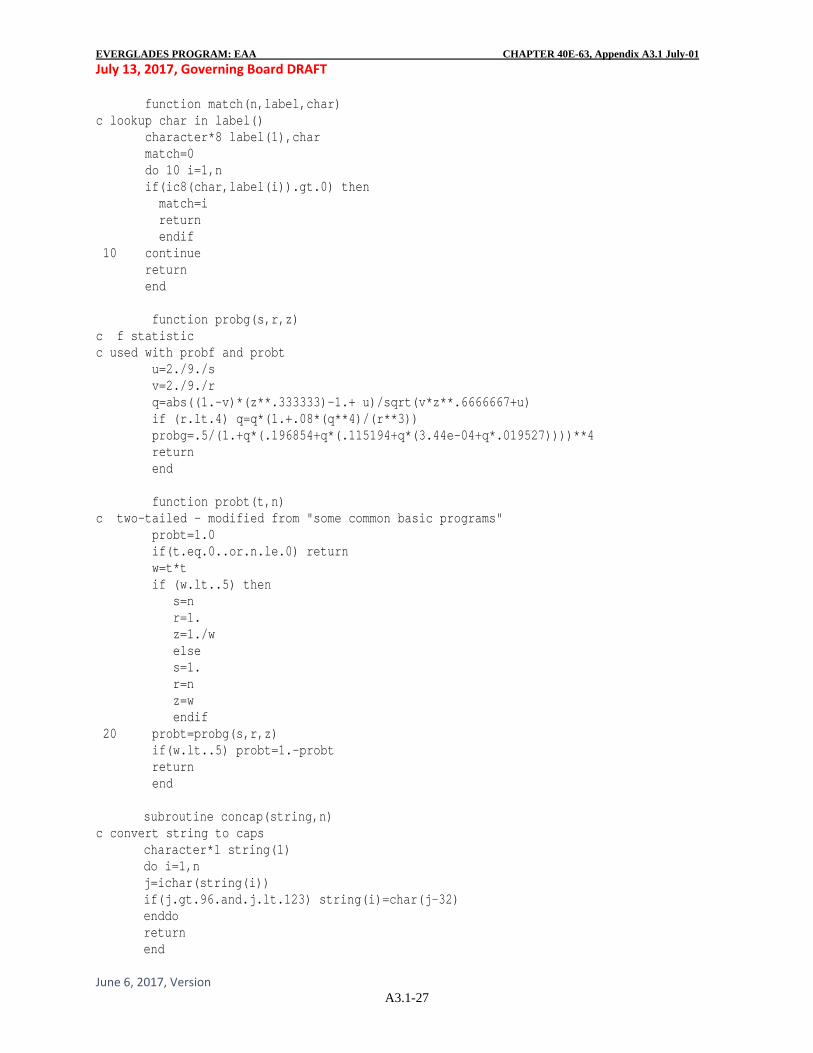
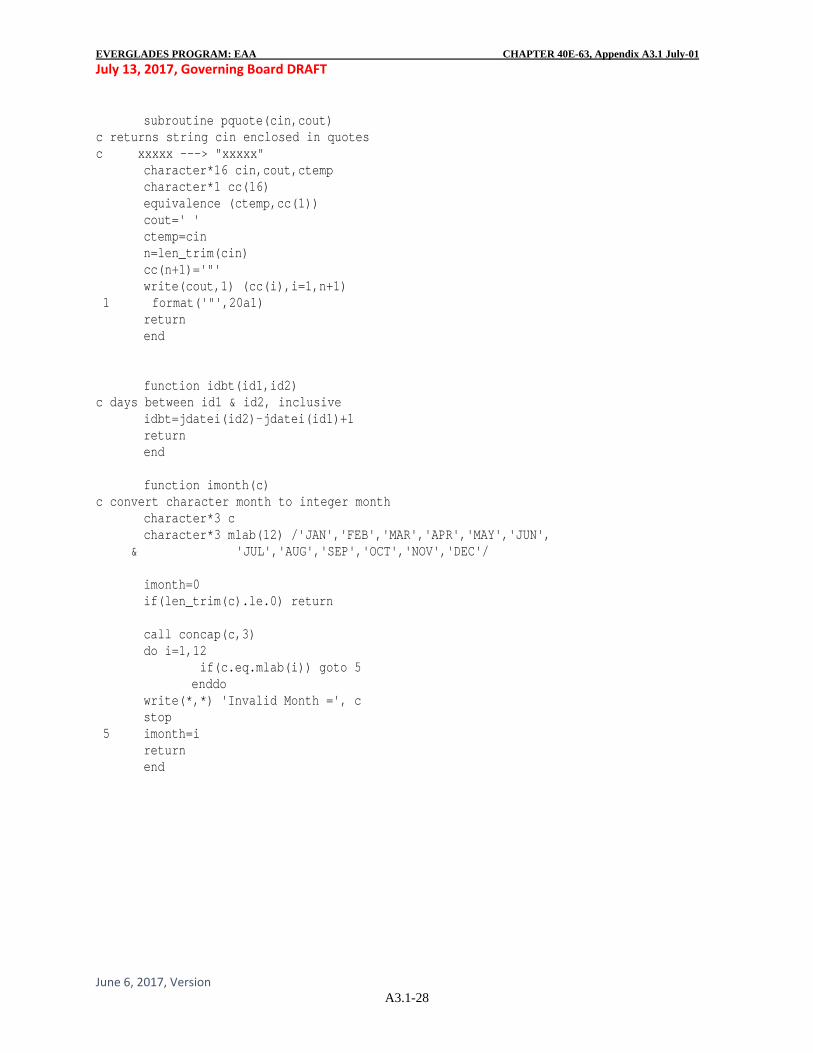
PHOSPHORUS LOADS program eaatpld c modified August, 2000 for various ECP elements c modified may 1999 for STA-5 inflows from Miami Canal (G350B, G349B) c modified october 1998 for STA-5 & STA-2 c modified march 1998 for STA-6 c utilizes all composite samples c compute eaa tp load 10-96 - additional comments added 10-3-96 c useage:g c >eaatpld eaa.job c eaa.job = input ascii file specifying case conditions c subroutines in subr.for c maximum dimensions c number of days = 20000 12000 = 52 32 + years ~(1978-203010) c number of grab samples = 4000 2000 per station c number of composite samples = 4000 2000 per station c array dimensions increased to handle maximum of 7040 terms integer*4 dgrab,dcomp,dlast,dbase,dbase0,d0 character*64 title character*32 ofile1,ofile2,ofile3,ofile4,cfile,qfile,ofile0 character*32 ofile5 character*32 blank /' '/ character*8 slab,dum8,qlab,ulab,usave(70 40),mname(4) common /a/ flowu(20000 12000),wcomp(20000 12000),wuse(20000 12000),wusec(20000 12000) common /b/ wgrab(20000 12000) common /d/ dgrab(4000 2000),dcomp(4000 2000),cgrab(4000 2000),ccomp(4000 2000), & x(4000 2000),iym(700 400),qsave(700,70 400,40),wsave(700,70 400,40),isgn(70 40), & wcsave(700,70 400,40),sumd(6),sumw(6),y(4000 2000),prb(4000 2000),ratio(2), & wc(2),wg(2),ncg(2) character*32 confile c array definitions c flowu() = daily flow c wgrab() = daily load computed from grab samples c wcomp() = daily load computed from composite samples c wuse() = daily load used in final result c wusec() = daily load computed from composite samples c cgrab() = grab-sample concentration c dgrab() = grab-sample date c ccomp() = composite sample concentration c dcomp() = composite sample date c qsave,wsave,wcsave(month,station) c = storage of monthly flow, load, & composite load c number of load calc methods data nmeth/3/
EVERGLADES PROGRAM: EAA CHAPTER 40E-63, Appendix A3.1 July-01
July 13, 2017, Governing Board DRAFT
June 6, 2017, Version A3.1-2
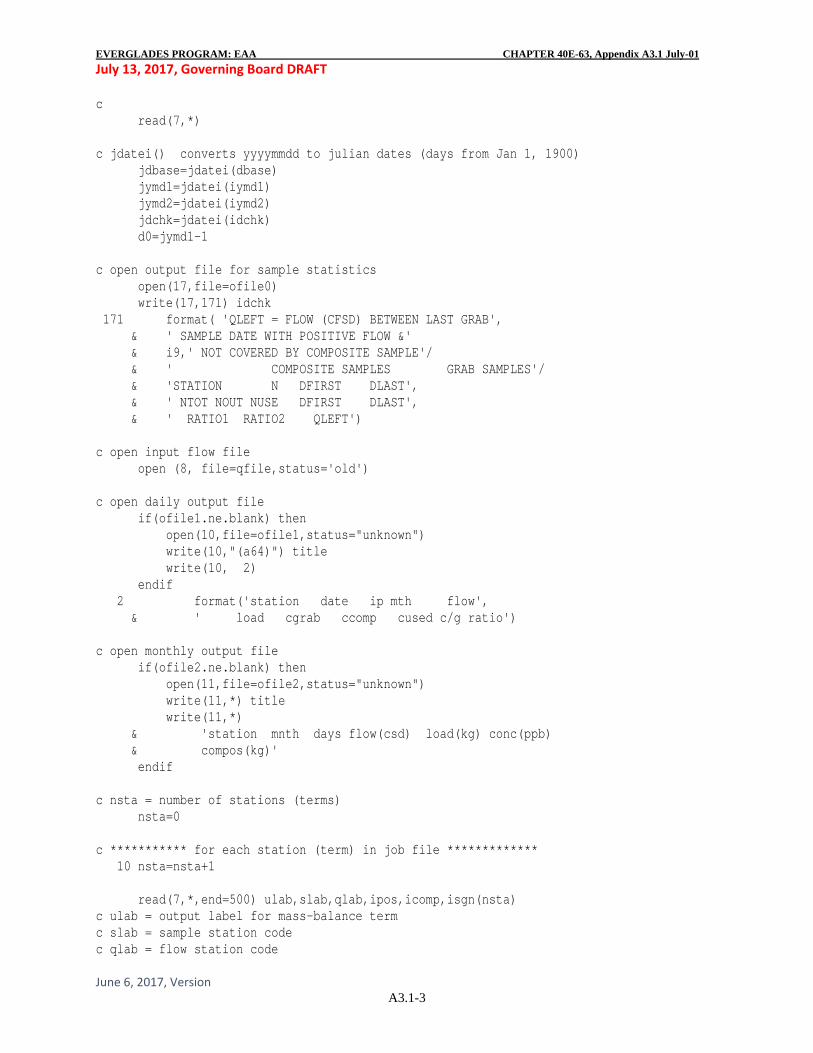
data mname/'noflow','compos',' grab',' miss' / c qfac: convert cfs*days to output units = cfs-days data qfac/1./ c scale factor to convert input sample concs (ppm) to (ppb) data sf/1000./ c factor: convert cfs*ppb to kg/day; sig: level of outliers c factor=24.*3600.*(0.3048**3)/1.e6 factor=24.*3600/3.28**3/1.e6 c grab/composite ratio c iratio = 0 compute r1 & r2 separately (original algorithm) c iratio = 1 set r2 = r1 data iratio/0/ c read input file [eaa.job] to get station labels and input parameters open(7,file=' ',status="old") c read control parameters read(7,*) title,qfile,dum8,cfile,dum8, &nmaxc,dum8,dbase0,dum8,dbase,dum8,sig,dum8 c title = problem title c qfile = input daily flow file c cfile = input sample concentration file c nmaxc = maximum duration of composite samples c dbase0 = first day of base period yyyymmdd = 19781001 c dbase = last day of base period yyyymmdd = 19910930 c sig = significance level for outlier screening in base period cc cc March 98 Modification - Look for Composite Samples NAFTER days beyond last flow date cc nafter = nmaxc cc cc end of modification cc c read date range read(7,*) iymd1,dum8,iymd2,dum8,idchk,dum8 write(*,*) 'sample date range =',iymd1,iymd2 read(7,*) ofile0,dum8,ofile5,dum8,ofile1,dum8,ofile2,dum8, & ofile3,dum8,ofile4,dum8 c output files (* = optional) c ofile0 - sample inventory c ofile5 - totals by term & time period (base pd & after) c *ofile1 - daily results c *ofile2 - monthly results for each term c *ofile3 - monthly crosstab (term x month) c ofile4 - monthly totals (sum of all terms)
EVERGLADES PROGRAM: EAA CHAPTER 40E-63, Appendix A3.1 July-01
July 13, 2017, Governing Board DRAFT
June 6, 2017, Version A3.1-3
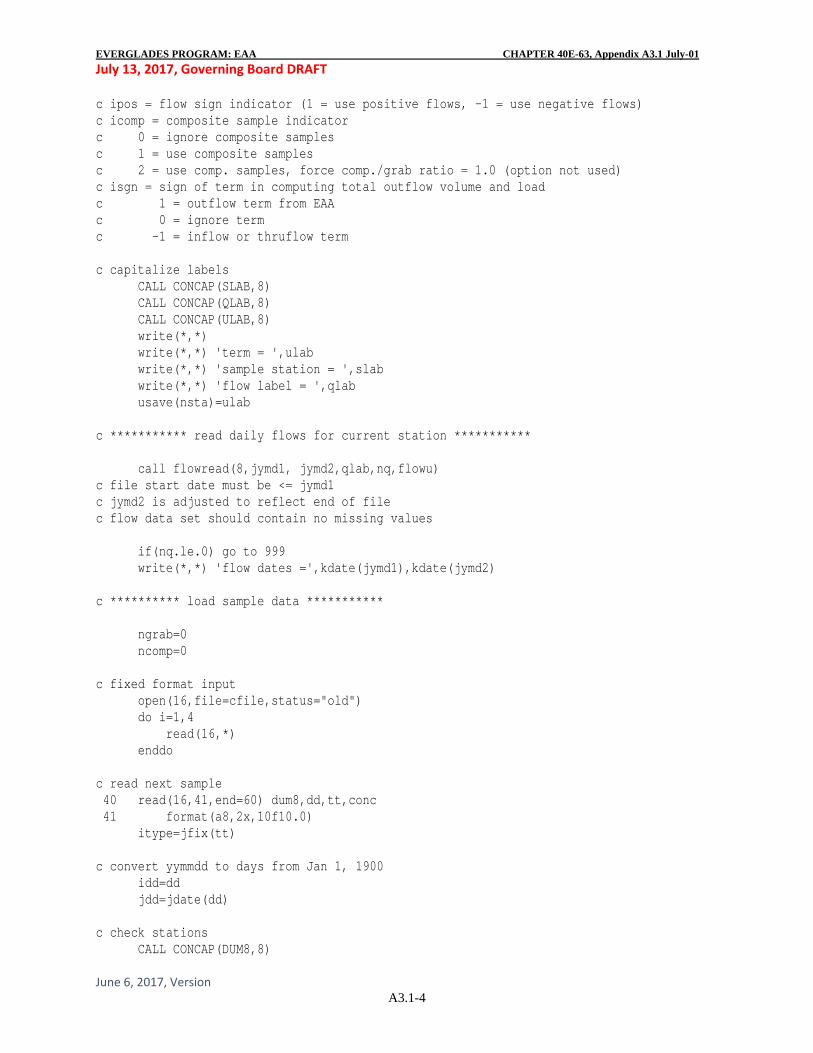
c read(7,*) c jdatei() converts yyyymmdd to julian dates (days from Jan 1, 1900) jdbase=jdatei(dbase) jymd1=jdatei(iymd1) jymd2=jdatei(iymd2) jdchk=jdatei(idchk) d0=jymd1-1 c open output file for sample statistics open(17,file=ofile0) write(17,171) idchk 171 format( 'QLEFT = FLOW (CFSD) BETWEEN LAST GRAB', & ' SAMPLE DATE WITH POSITIVE FLOW &' & i9,' NOT COVERED BY COMPOSITE SAMPLE'/ & ' COMPOSITE SAMPLES GRAB SAMPLES'/ & 'STATION N DFIRST DLAST', & ' NTOT NOUT NUSE DFIRST DLAST', & ' RATIO1 RATIO2 QLEFT') c open input flow file open (8, file=qfile,status='old') c open daily output file if(ofile1.ne.blank) then open(10,file=ofile1,status="unknown") write(10,"(a64)") title write(10, 2) endif 2 format('station date ip mth flow', & ' load cgrab ccomp cused c/g ratio') c open monthly output file if(ofile2.ne.blank) then open(11,file=ofile2,status="unknown") write(11,*) title write(11,*) & 'station mnth days flow(csd) load(kg) conc(ppb) & compos(kg)' endif c nsta = number of stations (terms) nsta=0 c *********** for each station (term) in job file ************* 10 nsta=nsta+1 read(7,*,end=500) ulab,slab,qlab,ipos,icomp,isgn(nsta) c ulab = output label for mass-balance term c slab = sample station code c qlab = flow station code
EVERGLADES PROGRAM: EAA CHAPTER 40E-63, Appendix A3.1 July-01
July 13, 2017, Governing Board DRAFT
June 6, 2017, Version A3.1-4
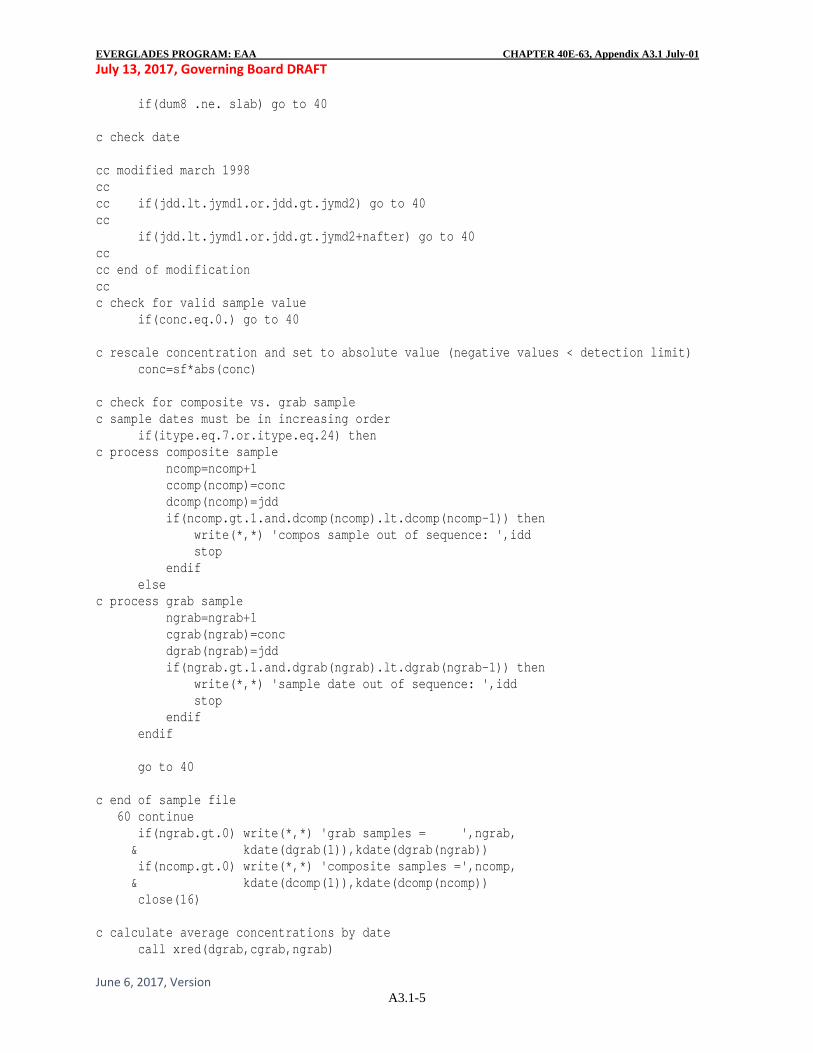
c ipos = flow sign indicator (1 = use positive flows, -1 = use negative flows) c icomp = composite sample indicator c 0 = ignore composite samples c 1 = use composite samples c 2 = use comp. samples, force comp./grab ratio = 1.0 (option not used) c isgn = sign of term in computing total outflow volume and load c 1 = outflow term from EAA c 0 = ignore term c -1 = inflow or thruflow term c capitalize labels CALL CONCAP(SLAB,8) CALL CONCAP(QLAB,8) CALL CONCAP(ULAB,8) write(*,*) write(*,*) 'term = ',ulab write(*,*) 'sample station = ',slab write(*,*) 'flow label = ',qlab usave(nsta)=ulab c *********** read daily flows for current station *********** call flowread(8,jymd1, jymd2,qlab,nq,flowu) c file start date must be <= jymd1 c jymd2 is adjusted to reflect end of file c flow data set should contain no missing values if(nq.le.0) go to 999 write(*,*) 'flow dates =',kdate(jymd1),kdate(jymd2) c ********** load sample data *********** ngrab=0 ncomp=0 c fixed format input open(16,file=cfile,status="old") do i=1,4 read(16,*) enddo c read next sample 40 read(16,41,end=60) dum8,dd,tt,conc 41 format(a8,2x,10f10.0) itype=jfix(tt) c convert yymmdd to days from Jan 1, 1900 idd=dd jdd=jdate(dd) c check stations CALL CONCAP(DUM8,8)
EVERGLADES PROGRAM: EAA CHAPTER 40E-63, Appendix A3.1 July-01
July 13, 2017, Governing Board DRAFT
June 6, 2017, Version A3.1-5
if(dum8 .ne. slab) go to 40 c check date cc modified march 1998 cc cc if(jdd.lt.jymd1.or.jdd.gt.jymd2) go to 40 cc if(jdd.lt.jymd1.or.jdd.gt.jymd2+nafter) go to 40 cc cc end of modification cc c check for valid sample value if(conc.eq.0.) go to 40 c rescale concentration and set to absolute value (negative values < detection limit) conc=sf*abs(conc) c check for composite vs. grab sample c sample dates must be in increasing order if(itype.eq.7.or.itype.eq.24) then c process composite sample ncomp=ncomp+1 ccomp(ncomp)=conc dcomp(ncomp)=jdd if(ncomp.gt.1.and.dcomp(ncomp).lt.dcomp(ncomp-1)) then write(*,*) 'compos sample out of sequence: ',idd stop endif else c process grab sample ngrab=ngrab+1 cgrab(ngrab)=conc dgrab(ngrab)=jdd if(ngrab.gt.1.and.dgrab(ngrab).lt.dgrab(ngrab-1)) then write(*,*) 'sample date out of sequence: ',idd stop endif endif go to 40 c end of sample file 60 continue if(ngrab.gt.0) write(*,*) 'grab samples = ',ngrab, & kdate(dgrab(1)),kdate(dgrab(ngrab)) if(ncomp.gt.0) write(*,*) 'composite samples =',ncomp, & kdate(dcomp(1)),kdate(dcomp(ncomp)) close(16) c calculate average concentrations by date call xred(dgrab,cgrab,ngrab)
EVERGLADES PROGRAM: EAA CHAPTER 40E-63, Appendix A3.1 July-01
July 13, 2017, Governing Board DRAFT
June 6, 2017, Version A3.1-6
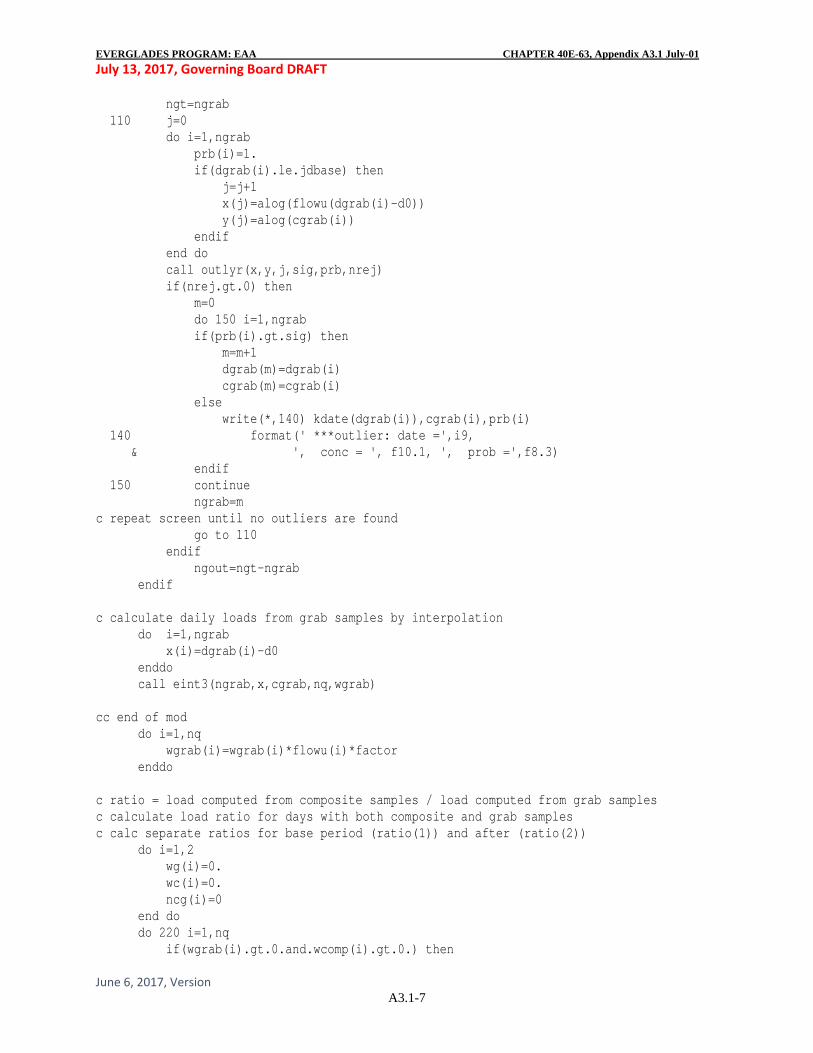
call xred(dcomp,ccomp,ncomp) write(*,*) 'daily-avg grab samples = ',ngrab write(*,*) 'daily-avg composite samples =',ncomp c scratch composite samples if switch indicates so if(icomp.le.0) ncomp=0 c assign daily flows in cfs do 70 j=1,nq if(ipos.eq.1) then flowu(j)=amax1(flowu(j),0.) else flowu(j)=abs(amin1(flowu(j),0.)) endif wgrab(j)=0. wcomp(j)=0. 70 wuse(j)=0. c calculate loads from composite samples dlast=0. do i=1,ncomp c date range to apply composite-sample concentration j2=dcomp(i)-d0 j1=max0(1,j2-nmaxc) if(j1.le.dlast) j1=dlast+1 if(j1.gt.j2) j1=j2 do j=j1,j2 wcomp(j)=flowu(j)*ccomp(i)*factor enddo dlast=j2 enddo c eliminate grab-samples collected on days with no flow mgrab=0 do i=1,ngrab if(flowu(dgrab(i)-d0).gt.0.) then mgrab=mgrab+1 dgrab(mgrab)=dgrab(i) cgrab(mgrab)=cgrab(i) endif enddo ngrabt=ngrab ngrab=mgrab write(*,*) 'grab samples on days with positive flow =',ngrab if(ngrab.gt.0) write(*,*) 'date range =',kdate(dgrab(1)), & kdate(dgrab(ngrab)) c screen base-period grab samples for outliers c based upon log(c) vs. log(q) regression c (Snedecor & Cochran, Statistical Methods, 1980, pp. 167-168) if(sig.gt.0.) then
EVERGLADES PROGRAM: EAA CHAPTER 40E-63, Appendix A3.1 July-01
July 13, 2017, Governing Board DRAFT
June 6, 2017, Version A3.1-7
ngt=ngrab 110 j=0 do i=1,ngrab prb(i)=1. if(dgrab(i).le.jdbase) then j=j+1 x(j)=alog(flowu(dgrab(i)-d0)) y(j)=alog(cgrab(i)) endif end do call outlyr(x,y,j,sig,prb,nrej) if(nrej.gt.0) then m=0 do 150 i=1,ngrab if(prb(i).gt.sig) then m=m+1 dgrab(m)=dgrab(i) cgrab(m)=cgrab(i) else write(*,140) kdate(dgrab(i)),cgrab(i),prb(i) 140 format(' ***outlier: date =',i9, & ', conc = ', f10.1, ', prob =',f8.3) endif 150 continue ngrab=m c repeat screen until no outliers are found go to 110 endif ngout=ngt-ngrab endif c calculate daily loads from grab samples by interpolation do i=1,ngrab x(i)=dgrab(i)-d0 enddo call eint3(ngrab,x,cgrab,nq,wgrab) cc end of mod do i=1,nq wgrab(i)=wgrab(i)*flowu(i)*factor enddo c ratio = load computed from composite samples / load computed from grab samples c calculate load ratio for days with both composite and grab samples c calc separate ratios for base period (ratio(1)) and after (ratio(2)) do i=1,2 wg(i)=0. wc(i)=0. ncg(i)=0 end do do 220 i=1,nq if(wgrab(i).gt.0.and.wcomp(i).gt.0.) then
EVERGLADES PROGRAM: EAA CHAPTER 40E-63, Appendix A3.1 July-01
July 13, 2017, Governing Board DRAFT
June 6, 2017, Version A3.1-8
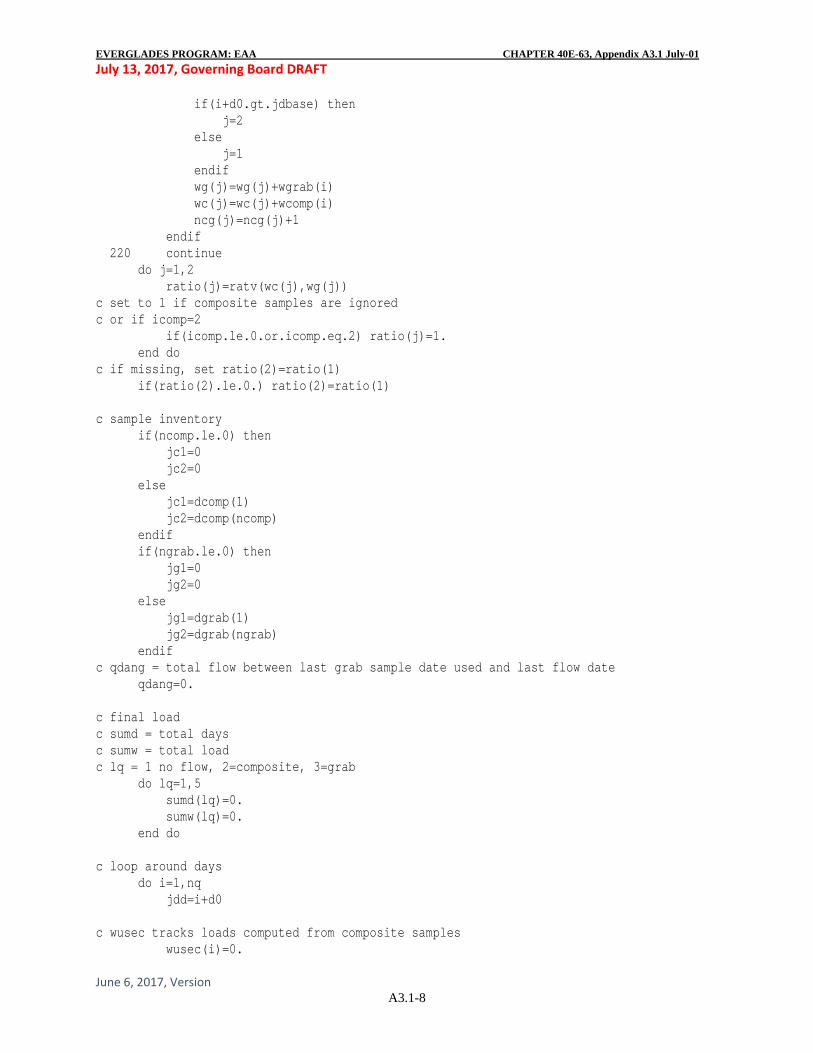
if(i+d0.gt.jdbase) then j=2 else j=1 endif wg(j)=wg(j)+wgrab(i) wc(j)=wc(j)+wcomp(i) ncg(j)=ncg(j)+1 endif 220 continue do j=1,2 ratio(j)=ratv(wc(j),wg(j)) c set to 1 if composite samples are ignored c or if icomp=2 if(icomp.le.0.or.icomp.eq.2) ratio(j)=1. end do c if missing, set ratio(2)=ratio(1) if(ratio(2).le.0.) ratio(2)=ratio(1) c sample inventory if(ncomp.le.0) then jc1=0 jc2=0 else jc1=dcomp(1) jc2=dcomp(ncomp) endif if(ngrab.le.0) then jg1=0 jg2=0 else jg1=dgrab(1) jg2=dgrab(ngrab) endif c qdang = total flow between last grab sample date used and last flow date qdang=0. c final load c sumd = total days c sumw = total load c lq = 1 no flow, 2=composite, 3=grab do lq=1,5 sumd(lq)=0. sumw(lq)=0. end do c loop around days do i=1,nq jdd=i+d0 c wusec tracks loads computed from composite samples wusec(i)=0.
EVERGLADES PROGRAM: EAA CHAPTER 40E-63, Appendix A3.1 July-01
July 13, 2017, Governing Board DRAFT
June 6, 2017, Version A3.1-9
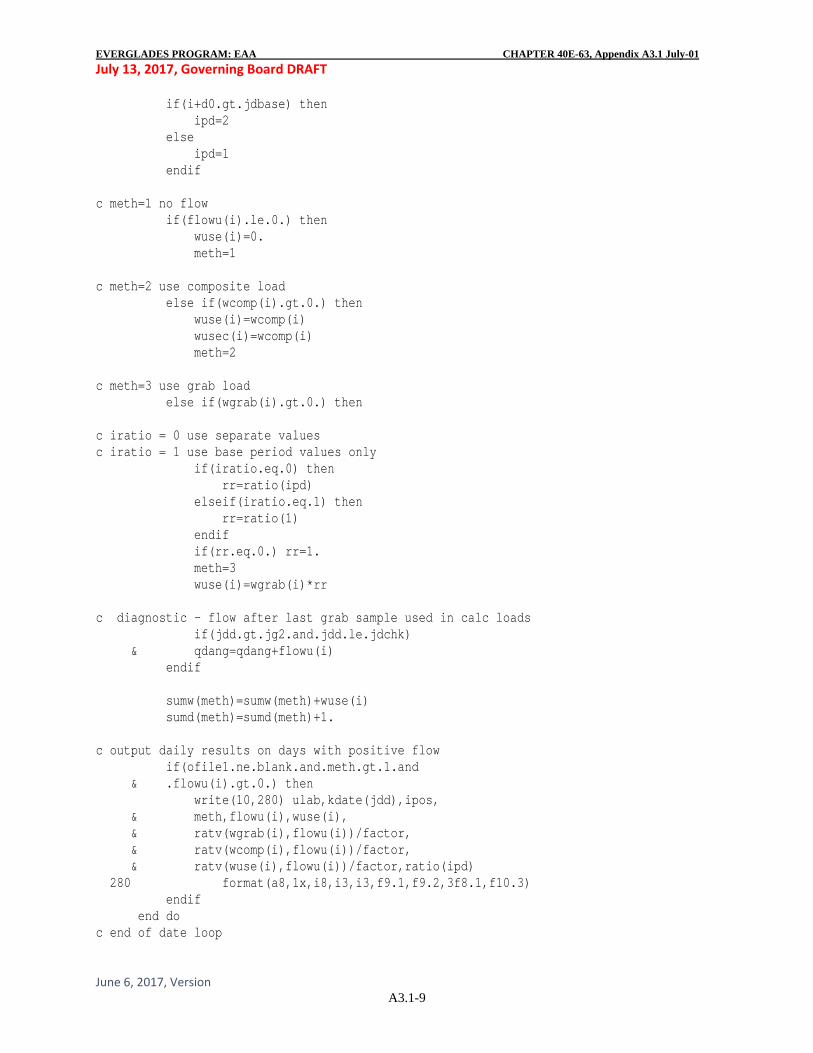
if(i+d0.gt.jdbase) then ipd=2 else ipd=1 endif c meth=1 no flow if(flowu(i).le.0.) then wuse(i)=0. meth=1 c meth=2 use composite load else if(wcomp(i).gt.0.) then wuse(i)=wcomp(i) wusec(i)=wcomp(i) meth=2 c meth=3 use grab load else if(wgrab(i).gt.0.) then c iratio = 0 use separate values c iratio = 1 use base period values only if(iratio.eq.0) then rr=ratio(ipd) elseif(iratio.eq.1) then rr=ratio(1) endif if(rr.eq.0.) rr=1. meth=3 wuse(i)=wgrab(i)*rr c diagnostic - flow after last grab sample used in calc loads if(jdd.gt.jg2.and.jdd.le.jdchk) & qdang=qdang+flowu(i) endif sumw(meth)=sumw(meth)+wuse(i) sumd(meth)=sumd(meth)+1. c output daily results on days with positive flow if(ofile1.ne.blank.and.meth.gt.1.and & .flowu(i).gt.0.) then write(10,280) ulab,kdate(jdd),ipos, & meth,flowu(i),wuse(i), & ratv(wgrab(i),flowu(i))/factor, & ratv(wcomp(i),flowu(i))/factor, & ratv(wuse(i),flowu(i))/factor,ratio(ipd) 280 format(a8,1x,i8,i3,i3,f9.1,f9.2,3f8.1,f10.3) endif end do c end of date loop
EVERGLADES PROGRAM: EAA CHAPTER 40E-63, Appendix A3.1 July-01
July 13, 2017, Governing Board DRAFT
June 6, 2017, Version A3.1-10
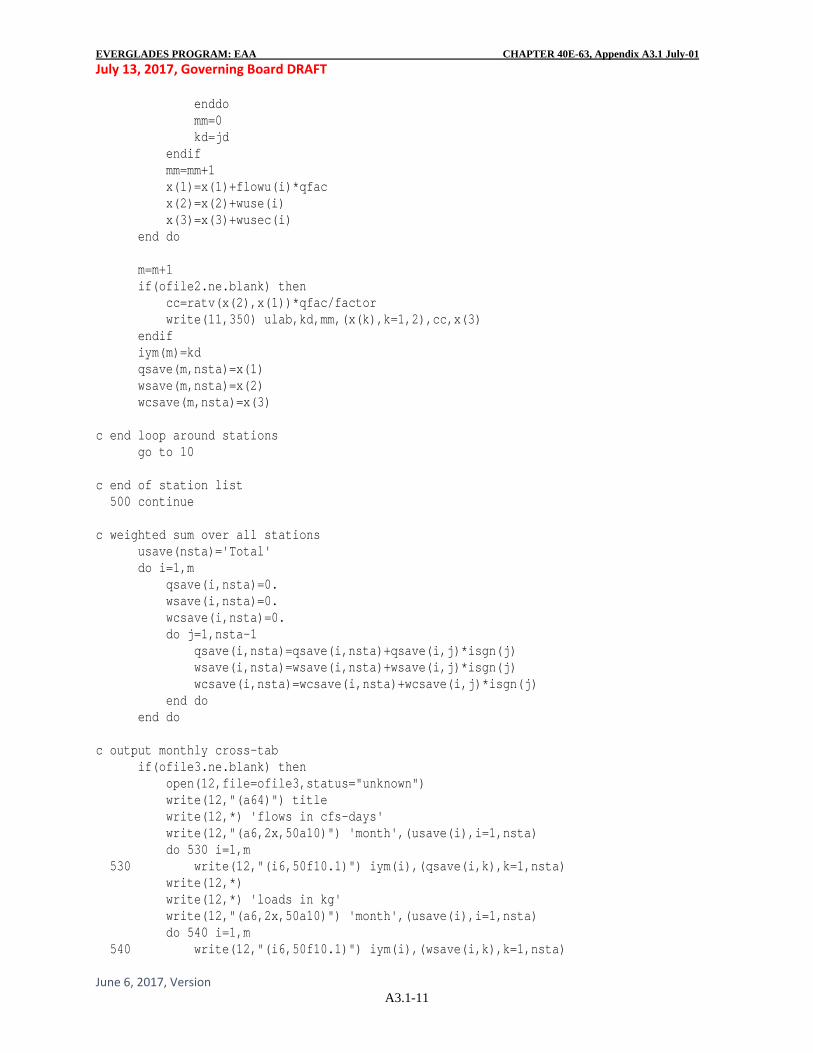
c log file write(17,172) ulab,ncomp,kdate(jc1),kdate(jc2),ngrabt, &ngout,ngrab,kdate(jg1),kdate(jg2), &ratio(1),ratio(2),qdang 172 format(1h",a8,1h",i5,2i9,3i5,2i9,2f8.4,f9.1) write(*,235) 235 format(' station ncomp ngrab', & ' days1 ratio1 days2 ratio2') cc & ' days1 ratio1 days2 ratio2 usedratio') changed 2/27/98 write(*,245) ulab,ncomp,ngrab,ncg(1),ratio(1), &ncg(2),ratio(2) cc &ncg(2),ratio(2),rr changed 2/27/98 245 format(1x,a8,3i8,f8.5,i8,2f8.5) c method summary write(*,305) (mname(i),i=1,nmeth) 305 format(' breakdown of load estimation methods:'/ & ' method: ',6a10) do i=1,nmeth sumd(nmeth+1)=sumd(nmeth+1)+sumd(i) sumw(nmeth+1)=sumw(nmeth+1)+sumw(i) enddo write(*,"(' days% :',6f10.1)") &(100.*ratv(sumd(i),sumd(nmeth+1)),i=1,nmeth) write(*,"(' load% :',6f10.1)") &(100.*ratv(sumw(i),sumw(nmeth+1)),i=1,nmeth) m=0 nk=3 kd= kdate(jymd1)/100 do k=1,nk x(k)=0. enddo mm=0 do i=1,nq jd=kdate(i+jymd1-1)/100 if(jd.ne.kd) then c output monthly totals for current station m=m+1 cc=ratv(x(2),x(1))*qfac/factor if(ofile2.ne.blank) & write(11,350) ulab,kd,mm,(x(k),k=1,2),cc,x(3) 350 format(a8,i8,i4,2f10.1,f10.1,f10.1) qsave(m,nsta)=x(1) wsave(m,nsta)=x(2) wcsave(m,nsta)=x(3) iym(m)=kd do k=1,nk x(k)=0.
EVERGLADES PROGRAM: EAA CHAPTER 40E-63, Appendix A3.1 July-01
July 13, 2017, Governing Board DRAFT
June 6, 2017, Version A3.1-11
enddo mm=0 kd=jd endif mm=mm+1 x(1)=x(1)+flowu(i)*qfac x(2)=x(2)+wuse(i) x(3)=x(3)+wusec(i) end do m=m+1 if(ofile2.ne.blank) then cc=ratv(x(2),x(1))*qfac/factor write(11,350) ulab,kd,mm,(x(k),k=1,2),cc,x(3) endif iym(m)=kd qsave(m,nsta)=x(1) wsave(m,nsta)=x(2) wcsave(m,nsta)=x(3) c end loop around stations go to 10 c end of station list 500 continue c weighted sum over all stations usave(nsta)='Total' do i=1,m qsave(i,nsta)=0. wsave(i,nsta)=0. wcsave(i,nsta)=0. do j=1,nsta-1 qsave(i,nsta)=qsave(i,nsta)+qsave(i,j)*isgn(j) wsave(i,nsta)=wsave(i,nsta)+wsave(i,j)*isgn(j) wcsave(i,nsta)=wcsave(i,nsta)+wcsave(i,j)*isgn(j) end do end do c output monthly cross-tab if(ofile3.ne.blank) then open(12,file=ofile3,status="unknown") write(12,"(a64)") title write(12,*) 'flows in cfs-days' write(12,"(a6,2x,50a10)") 'month',(usave(i),i=1,nsta) do 530 i=1,m 530 write(12,"(i6,50f10.1)") iym(i),(qsave(i,k),k=1,nsta) write(12,*) write(12,*) 'loads in kg' write(12,"(a6,2x,50a10)") 'month',(usave(i),i=1,nsta) do 540 i=1,m 540 write(12,"(i6,50f10.1)") iym(i),(wsave(i,k),k=1,nsta)
EVERGLADES PROGRAM: EAA CHAPTER 40E-63, Appendix A3.1 July-01
July 13, 2017, Governing Board DRAFT
June 6, 2017, Version A3.1-12
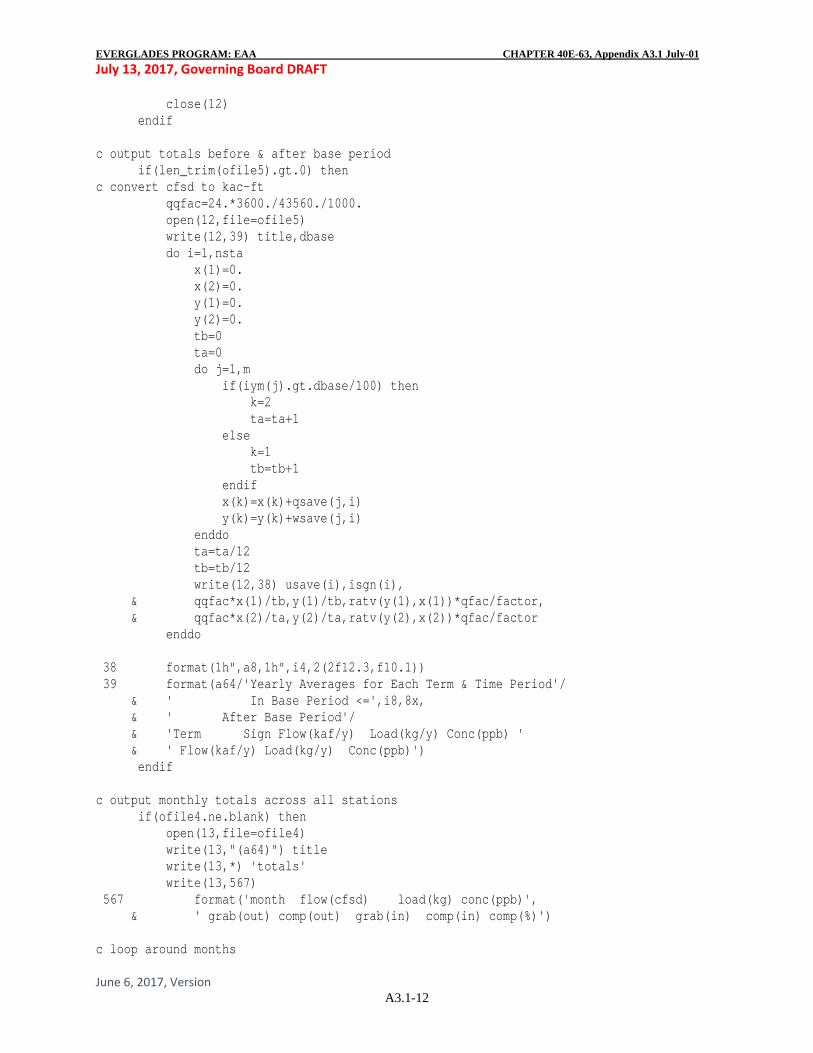
close(12) endif c output totals before & after base period if(len_trim(ofile5).gt.0) then c convert cfsd to kac-ft qqfac=24.*3600./43560./1000. open(12,file=ofile5) write(12,39) title,dbase do i=1,nsta x(1)=0. x(2)=0. y(1)=0. y(2)=0. tb=0 ta=0 do j=1,m if(iym(j).gt.dbase/100) then k=2 ta=ta+1 else k=1 tb=tb+1 endif x(k)=x(k)+qsave(j,i) y(k)=y(k)+wsave(j,i) enddo ta=ta/12 tb=tb/12 write(12,38) usave(i),isgn(i), & qqfac*x(1)/tb,y(1)/tb,ratv(y(1),x(1))*qfac/factor, & qqfac*x(2)/ta,y(2)/ta,ratv(y(2),x(2))*qfac/factor enddo 38 format(1h",a8,1h",i4,2(2f12.3,f10.1)) 39 format(a64/'Yearly Averages for Each Term & Time Period'/ & ' In Base Period <=',i8,8x, & ' After Base Period'/ & 'Term Sign Flow(kaf/y) Load(kg/y) Conc(ppb) ' & ' Flow(kaf/y) Load(kg/y) Conc(ppb)') endif c output monthly totals across all stations if(ofile4.ne.blank) then open(13,file=ofile4) write(13,"(a64)") title write(13,*) 'totals' write(13,567) 567 format('month flow(cfsd) load(kg) conc(ppb)', & ' grab(out) comp(out) grab(in) comp(in) comp(%)') c loop around months
EVERGLADES PROGRAM: EAA CHAPTER 40E-63, Appendix A3.1 July-01
July 13, 2017, Governing Board DRAFT
June 6, 2017, Version A3.1-13
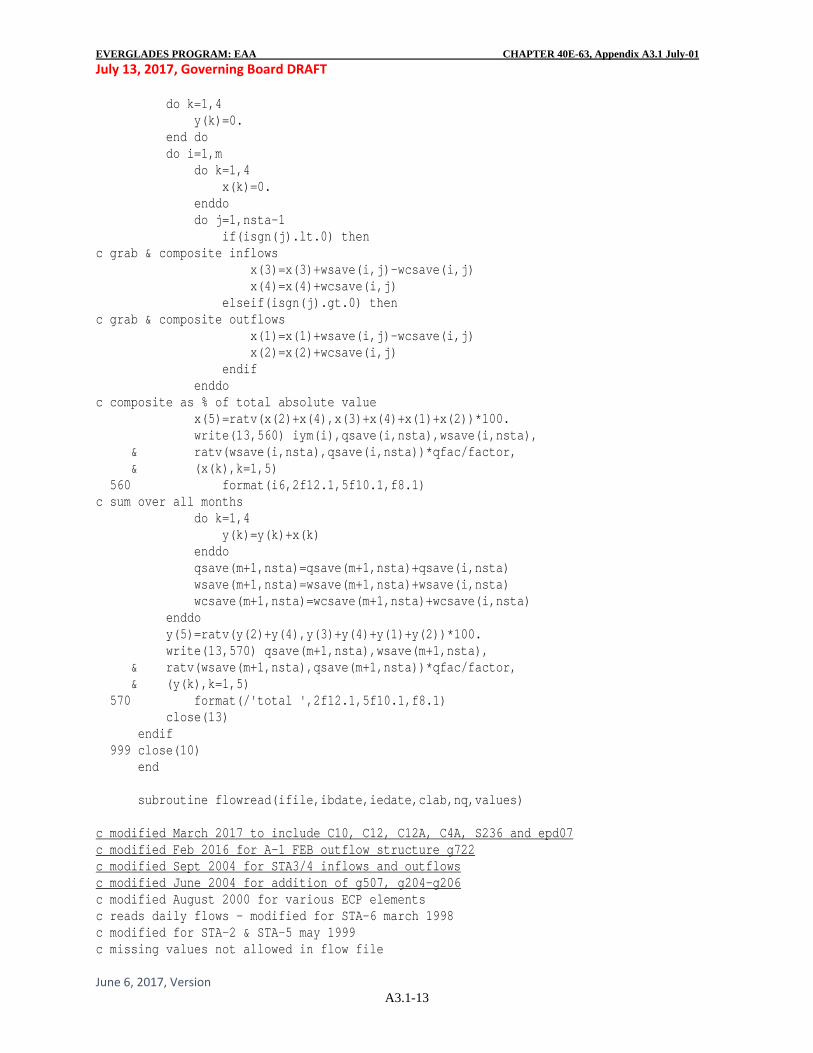
do k=1,4 y(k)=0. end do do i=1,m do k=1,4 x(k)=0. enddo do j=1,nsta-1 if(isgn(j).lt.0) then c grab & composite inflows x(3)=x(3)+wsave(i,j)-wcsave(i,j) x(4)=x(4)+wcsave(i,j) elseif(isgn(j).gt.0) then c grab & composite outflows x(1)=x(1)+wsave(i,j)-wcsave(i,j) x(2)=x(2)+wcsave(i,j) endif enddo c composite as % of total absolute value x(5)=ratv(x(2)+x(4),x(3)+x(4)+x(1)+x(2))*100. write(13,560) iym(i),qsave(i,nsta),wsave(i,nsta), & ratv(wsave(i,nsta),qsave(i,nsta))*qfac/factor, & (x(k),k=1,5) 560 format(i6,2f12.1,5f10.1,f8.1) c sum over all months do k=1,4 y(k)=y(k)+x(k) enddo qsave(m+1,nsta)=qsave(m+1,nsta)+qsave(i,nsta) wsave(m+1,nsta)=wsave(m+1,nsta)+wsave(i,nsta) wcsave(m+1,nsta)=wcsave(m+1,nsta)+wcsave(i,nsta) enddo y(5)=ratv(y(2)+y(4),y(3)+y(4)+y(1)+y(2))*100. write(13,570) qsave(m+1,nsta),wsave(m+1,nsta), & ratv(wsave(m+1,nsta),qsave(m+1,nsta))*qfac/factor, & (y(k),k=1,5) 570 format(/'total ',2f12.1,5f10.1,f8.1) close(13) endif 999 close(10) end subroutine flowread(ifile,ibdate,iedate,clab,nq,values) c modified March 2017 to include C10, C12, C12A, C4A, S236 and epd07 c modified Feb 2016 for A-1 FEB outflow structure g722 c modified Sept 2004 for STA3/4 inflows and outflows c modified June 2004 for addition of g507, g204-g206 c modified August 2000 for various ECP elements c reads daily flows - modified for STA-6 march 1998 c modified for STA-2 & STA-5 may 1999 c missing values not allowed in flow file

EVERGLADES PROGRAM: EAA CHAPTER 40E-63, Appendix A3.1 July-01
July 13, 2017, Governing Board DRAFT
June 6, 2017, Version A3.1-14
character*8 clab character*8 labs(70 37) real values(1) c these labels correspond to flow station labels in control file data labs /"s5a+s5aw", "hgs5", "wpbthru", "s6", & "s2/s6", "hilthru", "s7", "s150", & "s2/s7", "thrulake", "thrus7", "thrus150", & "s8", "s3", "g88", "g136", & "holey", "miathru", "g250", "g600", & "g605", "g606", "g344a", "g344b", & "g344c", "g344d", "g328", "g349b", & "g350b", "ebps", "esps", "g410", & "g402a", "g402b", "g402c", "g402d", & "g404" "g357", "g204", "g205", & "g206", "g507", "g370", "g372", & "g376abc", "g376def", "g379abc", "g379de", & "g381ab", "g381cdef", "ssdd", "sfcd", & "g371", "g373" , "g373bc", "g434", & "g435", "g722thru"/, “c10”, “c12a”, & “c12”, “c4a”, “s236”, “epd07”/ c number of daily flows in input file data nqin /70 37/ rewind ifile do i=1,4 read(ifile,*) enddo nq = 0 do I=1,nqin call CONCAP(LABS(I),8) enddo 90 read(ifile,222,end=100) dd,qhgs5,qs5as5aw,qs2, &qs6, qs7, qs150, qs3, qs8, qg88, qg136, qholey, &qg250,qg600,qg605,qg606,qg344a,qg344b, &qg344c,qg344d,qg328,qg349b,qg350b, &qebps,qesps, qg410,qg402a, &qg402b, qg402c, qg402d,qg404, qg357,qg204,qg205, &qg206, qg507, qg370, qg372, qg376a, qg376d, qg379a, &qg379d, qg381a, qg381c, qssdd, qsfcd, qg371, &qg373, qg373bc, qg434, qg435, qg722, &qc10, qc12a,qc12,qc4a,qs236,qepd07 c Modify East Beach, South Florida and South Shore flows to account for the portion of c these basins that was previously in the EAA. qebps = 0.813 * qebps qssdd = 0.966 * qssdd qsfcd = 0.799 * qsfcd
EVERGLADES PROGRAM: EAA CHAPTER 40E-63, Appendix A3.1 July-01
July 13, 2017, Governing Board DRAFT
June 6, 2017, Version A3.1-15
222 format(100f10.0) c convert yymmdd to julian jfdate=jdate(dd) if(jfdate.lt.ibdate) then goto 90 elseif(jfdate.gt.iedate) then return elseif(nq.eq.0.and.jfdate.ne.ibdate) then write(*,*) 'flow file starting date too late: ',jfix(dd) stop elseif(nq.gt.0.and.jfdate-jflast.ne.1) then write(*,*) 'flow file dates out of sequence: ',jfix(dd) stop endif nq=nq+1 jflast=jfdate c split s2 outflow between s6 (hillsboro qs2h) and S7 (nnriver qs2n) basins qs2n =(qs2 / (1.534769)) qs2h = qs2 - qs2n c Adds STA3/4 outflows to total North New River inflows c by adding g722 as an inflow to EAA qin = amax1(0., qs2n) - amin1(0.,qs7) - amin1(0., qs150) & + amax1(0.,qg376a) + amax1(0.,qg376d) + amax1(0.,qg379a) & + amax1(0.,qg379d) + amax1(0.,qg722) c total flow thru in north new river canal c Combines G370 flow through to S7 (9/28/04) c Add G371 to flow through term for WY06 ft = amin1(qin, amax1(0., qs7)+amax1(0., qs150))+ amax1(0., qg370)- & amax1(0.,qg376a) - amax1(0.,qg376d)-amax1(0.,qg379a)- & amax1(0.,qg379d)+ amax1(0., qg371) + amax1(0.,qg434) & + amax1(0.,qg435)) do i = 1, nqin if(clab .eq. labs(i)) then ind = i go to 200 endif end do write(*,*) 'flow station label not found:', clab stop go to 29 200 goto (1,2,3,4,5,6,7,8,9,10,11,12,13,14,15,16,17,18,19, &20,21,22,23,24,25,26,27,28,30,31,32,33,34,35,36,37,38,39,40,41,42,43,44,
&45,46,47,48,49,50,51,52,53,54,55,56,57,58,59,60,61,62,63,64,65), ind c s5a+s5aw outflow
EVERGLADES PROGRAM: EAA CHAPTER 40E-63, Appendix A3.1 July-01
July 13, 2017, Governing Board DRAFT
June 6, 2017, Version A3.1-16
1 x = qs5as5aw go to 29 c hgs5 outflow 2 x = qhgs5 go to 29 c s5athru west palm beach canal flowthru 3 if(qhgs5 .le. 0 ) then x = 0. else x = amin1(qhgs5, amax1(qs5as5aw+qg250-qebps, 0.)) end if go to 29 c s6 outflow 4 x = qs6 go to 29 c s2/s6 s2 outflow to lake from hillsboro basin 5 x = qs2h go to 29 c s6thru hillsboro canal flowthru 6 if(qs2h .le. 0) then x = 0. else x = amin1(qs2h, amax1(qs6-qesps, 0.)) end if go to 29 c s7 outflow 7 x = qs7 go to 29 c s150 outflow 8 x = qs150 go to 29 c s2/s7 outflow to lake from s7 basin 9 x = qs2n go to 29 c thrulake - nnriver flowthru from lake 10 if(qin .eq. 0) then x = 0. else x = amax1(0., qs2n) * ft / qin end if go to 29 c thrus7 - nnriver flowthru from s7
EVERGLADES PROGRAM: EAA CHAPTER 40E-63, Appendix A3.1 July-01
July 13, 2017, Governing Board DRAFT
June 6, 2017, Version A3.1-17
11 if(qin .eq. 0) then x = 0. else x = -amin1(0., qs7) * ft / qin end if go to 29 c thrus150 - nnriver flowthru from s150 12 if(qin .eq. 0) then x = 0. else x = -amin1(0., qs150) * ft / qin end if go to 29 c s8 outflow 13 x = qs8 go to 29 c s3 outflow 14 x = qs3 go to 29 c g88 inflow 15 x = qg88 go to 29 c g136 inflow 16 x = qg136 go to 29 c holeyland 17 x = qholey go to 29 c s8 miami canal flowthru 18 if(qs3 .le. 0) then x = 0. else x = amin1(qs3, amax1(0., & qs8-qg88-qg136+qholey-qg606-qg605+qg349b+qg350b-qg344a- & qg344b-qqg344c-g344d-qg402a-qg402b-qg402c-qg402d+qg410+ & qg404 + qg357-qg204-qg205-qg206+qg507+qg372- qg381a - qg381c- & qssdd - qsfcd + qg373 + qg373bc) endif goto 29 c enr inflow - eaa outflow 19 x=qg250 goto 29 c sta6 inflow
EVERGLADES PROGRAM: EAA CHAPTER 40E-63, Appendix A3.1 July-01
July 13, 2017, Governing Board DRAFT
June 6, 2017, Version A3.1-18
20 x=qg600 goto 29 c sta6 bypass 21 x=qg605 goto 29 c sta6 outflow 22 x=qg606 goto 29 c sta5 outflows 23 x=qg344a goto 29 24 x=qg344b goto 29 25 x=qg344c goto 29 26 x=qg344d goto 29 c sta2 supplementary inflow 27 x=qg328 goto 29 c sta5 inflows from miami canal 28 x=qg349b goto 29 30 x=qg350b goto 29 c East Beach outflow - EAA inflow 31 x=qebps goto 29 c East Shore outflow - EAA inflow 32 x=qesps goto 29 c Rotenberger inflow - EAA outflow 33 x=qg410 goto 29 c Rotenberger outflows - EAA inflow 34 x=qg402a goto 29 35 x=qg402b goto 29 36 x=qg402c goto 29 37 x=qg402d
EVERGLADES PROGRAM: EAA CHAPTER 40E-63, Appendix A3.1 July-01
July 13, 2017, Governing Board DRAFT
June 6, 2017, Version A3.1-19
goto 29 c G404 outflow 38 x=qg404 goto 29 c G357 outflow 39 x=qg357 goto 29 c G204 inflow 40 x=qg204 goto 29 c G205 inflow 41 x=qg205 goto 29 c G206 inflow 42 x=qg206 goto 29 c G507 outflow 43 x=qg507 goto 29 c G370 outflow 44 x=qg370 goto 29 c G372 outflow 45 x=qg372 goto 29 c G376abc inflow 46 x=qg376a goto 29 c G376def inflow 47 x=qg376d goto 29 c G379abc inflow 48 x=qg379a goto 29 c G379de inflow 49 x=qg379d goto 29 c G381ab inflow 50 x=qg381a goto 29 c G381cdef inflow 51 x=qg381c goto 29 c SSDD inflow 52 x=qssdd goto 29 c SFCD inflow 53 x=qsfcd goto 29 c G371 outflow
EVERGLADES PROGRAM: EAA CHAPTER 40E-63, Appendix A3.1 July-01
July 13, 2017, Governing Board DRAFT
June 6, 2017, Version A3.1-20
54 x=qg371 goto 29 c G373 outflow 55 x=qg373 goto 29 c G373BC outflow 56 x=qg373bc goto 29 c G434 outflow 57 x=qg434 goto 29 c G435 outflow 58 x=qg435 goto 29 c G722 A-1 FEB flow through 59 if(qin .eq. 0) then x = 0. else x = amax1(0., qg722) * ft / qin end if go to 29 c East Beach outflow to Lake Okeechobee – New EAA outflow 60 x=qc10 goto 29 c Closter outflow to Lake Okeechobee – New EAA outflow 61 x=qc12a goto 29 c East Shore outflow to Lake Okeechobee – New EAA outflow 62 x=qc12 goto 29 c South Shore outflow to Lake Okeechobee – New EAA outflow 63 x=qc4a goto 29 c South Florida Conservancy outflow to Lake Okeechobee – New EAA outflow 64 x=qs236 goto 29 c South Florida Conservancy outflow to Industrial Canal – New EAA outflow 65 x=qepd07 goto 29 29 values(nq) = x go to 90 100 iedate=jfdate return end c subroutines in subr.for c subroutines for eaa software
EVERGLADES PROGRAM: EAA CHAPTER 40E-63, Appendix A3.1 July-01
July 13, 2017, Governing Board DRAFT
June 6, 2017, Version A3.1-21
c c date functions c c date sequence number = number of days from Jan 1, 1900 (= Lotus 123 date) c All reals=real*4, All integers = Integer*4 c function inputs returns c idate(iy,im,id) iy,im,id date sequence number c jdate(d) yymmdd date sequence number c kkdate(d) yymmdd yyyymmdd c jdatei(k) yyyymmdd date sequence number c kdate(j) date sequence yyyymmdd c ddate(j) date sequence yymmdd c sub yymmdd(d,iy,im,id) yymmdd iy,im,id c sub iymmdd(k,iy,im,id) yyyymmdd iy,im,id c idbt(k1,k2) 2 x yyyymmdd days between 2 dates, inclusive c imonth(char3) character month month number c mday(iy,im) iy,im number of days in month function idate(iy,im,id) integer mdy(12) DATA MDY/0,31,59,90,120,151,181,212,243,273,304,334/ c returns days from Jan 1, 1900 for input iy,im,id c year in yy format c years jy=iy+1900 c if iy<50 assume turn of century if(iy.lt.50) jy=jy+100 idate=0 c check for valid date if(im.le.0.or.im.gt.12) return if(id.lt.1.or.id.gt.mday(iy,im)) return idate=mdy(im)+(jy-1900)*365.+id+(jy-1897)/4 c add 1 day if leap year and after february if(mod(jy,4).eq.0.and.im.gt.2) idate=idate+1 return end function jdate(d) c returns date sequence number for input d in yymmdd format call yymmdd(d,iy,im,id) jdate=idate(iy,im,id) return end function jdatei(id)
EVERGLADES PROGRAM: EAA CHAPTER 40E-63, Appendix A3.1 July-01
July 13, 2017, Governing Board DRAFT
June 6, 2017, Version A3.1-22
c returns date sequence number for input id in yyyymmdd format j=id-19000000 jdatei=jdate(float(j)) return end function kkdate(d) c returns yyyymmdd for input in yymmdd kkdate=d+19000000 if(d.le.500000.) kkdate=kkdate+1000000 return end function kdate(id) c returns integer date yyyymmdd for julian date id kdate=ddate(id) if(kdate.eq.0) then return elseif(kdate.lt.500101) then kdate=kdate+20000000 else kdate=kdate+19000000 endif return end function ddate(id) c returns date in yymmdd format for input id = c number of days from Jan 1, 1900 ddate=0. if(id.le.0) return c first find year, roughly jy=id/367 13 if(idate(jy+1,1,1).le.id) then jy=jy+1 goto 13 endif c find month do 10 jm=2,12 if(idate(jy,jm,1).gt.id) goto 12 10 continue 12 jm=jm-1 c find day
EVERGLADES PROGRAM: EAA CHAPTER 40E-63, Appendix A3.1 July-01
July 13, 2017, Governing Board DRAFT
June 6, 2017, Version A3.1-23
jd=id-idate(jy,jm,1)+1 ccc adjust year if(jy.gt.99) jy=jy-100 c compute ddate ddate=10000.*jy+jm*100.+jd return end subroutine yymmdd(date,iy,im,id) c convert real date yymmdd to integer year yy, month, day iy=0 im=0 id=0 iy=jfix(date/10000.) im=jfix((date-iy*10000.)/100.) id=jfix(date-iy*10000.-im*100.) return end subroutine iymmdd(idate,iy,im,id) c convert integer date to integer year, month, day iy=0 im=0 id=0 iy=jfix(idate/10000) im=jfix((idate-iy*10000)/100) id=jfix(idate-iy*10000-im*100) return end function mday(iy,im) c number of days in current month dimension mdy(12) data mdy/31,28,31,30,31,30,31,31,30,31,30,31/ mday=0 if(im.gt.12.or.im.lt.1) return mday=mdy(im) if(im.eq.2.and.mod(iy,4).eq.0.) mday=mday+1 return end subroutine outlyr(x,y,n,sig,prb,nrej) c screen for outliers - linear regression y(n) vs. x(n)
EVERGLADES PROGRAM: EAA CHAPTER 40E-63, Appendix A3.1 July-01
July 13, 2017, Governing Board DRAFT
June 6, 2017, Version A3.1-24
c sig = rejection significance level c returns prb(n) = significance level for rejection c nrej = number of screened data points c snedecor and cochran, p. 157-158 dimension x(1),y(1),prb(1) if(n.le.3) return sy=0. sy2=0. sx=0. sx2=0. sxy=0. nrej=0 nn=n c first compute regression do 100 i=1,n prb(i)=1. sy=sy+y(i) sx=sx+x(i) sy2=sy2+y(i)*y(i) sx2=sx2+x(i)*x(i) sxy=sxy+x(i)*y(i) 100 continue txy=sxy-sx*sy/n tx2=sx2-sx*sx/n ty2=sy2-sy*sy/n tx=sx/n ty=sy/n b=txy/tx2 a=ty-b*tx c find maximum residual 10 rmax=0. j=0 do 200 i=1,n if(prb(i).eq.1.) then resid=abs(y(i)-b*x(i)-a) if(resid.gt.rmax) then j=i rmax=resid endif endif 200 continue if(j.le.0) return c compute regression with point j excluded nn=nn-1 if(nn.le.3) return sxy=sxy-x(j)*y(j) sx2=sx2-x(j)*x(j) sy2=sy2-y(j)*y(j) sy=sy-y(j) sx=sx-x(j) txy=sxy-sx*sy/nn tx2=sx2-sx*sx/nn
EVERGLADES PROGRAM: EAA CHAPTER 40E-63, Appendix A3.1 July-01
July 13, 2017, Governing Board DRAFT
June 6, 2017, Version A3.1-25
ty2=sy2-sy*sy/nn tx=sx/nn ty=sy/nn b=txy/tx2 a=ty-b*tx se2=(ty2-b*b*tx2)/(nn-2) if(se2.le.0.) return se=sqrt(se2) c test residual resid=y(j)-b*x(j)-a sr=se*sqrt( 1.+1./nn + (x(j)-tx)**2/tx2 ) t=resid/sr prb(j)=probt(t,nn-2)*(nn+1) if(prb(j).gt.sig) return nrej=nrej+1 go to 10 end subroutine eint3(n,e,x,ni,xi) c interpolation c inputs e(i),x(i),i=1,n c output ei(i),xi(j),j=1,ni c ei(j)==j dimension x(1),e(1),xi(1) c i=1 do 100 j=1,ni if(j.gt.e(i)) go to 110 xi(j)=x(i) go to 100 110 if(j.lt.e(n)) go to 120 xi(j)=x(n) go to 100 120 if(j.le.e(i+1)) go to 125 i=i+1 go to 120 125 f=(j-e(i))/(e(i+1)-e(i)) xi(j)=(1.-f)*x(i)+f*x(i+1) 100 continue return end subroutine xred(ix,y,n) c replaces x() and y() with running means c for common values of ix() c length n c destroys input vectors dimension y(1) integer ix(1),ixlast if(n.le.1) return ixlast=ix(1)
EVERGLADES PROGRAM: EAA CHAPTER 40E-63, Appendix A3.1 July-01
July 13, 2017, Governing Board DRAFT
June 6, 2017, Version A3.1-26
m=1 k=0 sum=y(1) do 10 j=2,n if(ix(j).ne.ixlast) then k=k+1 ix(k)=ixlast y(k)=sum/m ixlast=ix(j) m=0 sum=0. endif m=m+1 sum=sum+y(j) 10 continue k=k+1 ix(k)=ixlast y(k)=sum/m n=k return end function ratv(x1,x2) c divide x1 by x2 or set to 0. if(x2.ne.0.) then ratv=x1/x2 else ratv=0. endif return end function ic8(c1,c2) c compares strings c1 and c2 c returns 1 if they are identical c case not significant character*8 c1,c2,c3,c4 c c3=c1 call concap(c3,8) c4=c2 call concap(c4,8) if(c3.eq.c4) then ic8=1 else ic8=0 endif return end
EVERGLADES PROGRAM: EAA CHAPTER 40E-63, Appendix A3.1 July-01
July 13, 2017, Governing Board DRAFT
June 6, 2017, Version A3.1-27
function match(n,label,char) c lookup char in label() character*8 label(1),char match=0 do 10 i=1,n if(ic8(char,label(i)).gt.0) then match=i return endif 10 continue return end function probg(s,r,z) c f statistic c used with probf and probt u=2./9./s v=2./9./r q=abs((1.-v)*(z**.333333)-1.+ u)/sqrt(v*z**.6666667+u) if (r.lt.4) q=q*(1.+.08*(q**4)/(r**3)) probg=.5/(1.+q*(.196854+q*(.115194+q*(3.44e-04+q*.019527))))**4 return end function probt(t,n) c two-tailed - modified from "some common basic programs" probt=1.0 if(t.eq.0..or.n.le.0) return w=t*t if (w.lt..5) then s=n r=1. z=1./w else s=1. r=n z=w endif 20 probt=probg(s,r,z) if(w.lt..5) probt=1.-probt return end subroutine concap(string,n) c convert string to caps character*1 string(1) do i=1,n j=ichar(string(i)) if(j.gt.96.and.j.lt.123) string(i)=char(j-32) enddo return end
EVERGLADES PROGRAM: EAA CHAPTER 40E-63, Appendix A3.1 July-01
July 13, 2017, Governing Board DRAFT
June 6, 2017, Version A3.1-28
subroutine pquote(cin,cout) c returns string cin enclosed in quotes c xxxxx ---> "xxxxx" character*16 cin,cout,ctemp character*1 cc(16) equivalence (ctemp,cc(1)) cout=' ' ctemp=cin n=len_trim(cin) cc(n+1)='"' write(cout,1) (cc(i),i=1,n+1) 1 format('"',20a1) return end function idbt(id1,id2) c days between id1 & id2, inclusive idbt=jdatei(id2)-jdatei(id1)+1 return end function imonth(c) c convert character month to integer month character*3 c character*3 mlab(12) /'JAN','FEB','MAR','APR','MAY','JUN', & 'JUL','AUG','SEP','OCT','NOV','DEC'/ imonth=0 if(len_trim(c).le.0) return call concap(c,3) do i=1,12 if(c.eq.mlab(i)) goto 5 enddo write(*,*) 'Invalid Month =', c stop 5 imonth=i return end
EVERGLADES PROGRAM: EAA CHAPTER 40E-63, Appendix A3.2 July-01 July 13, 2017, Governing Board DRAFT
June 6, 2017, Version A3.2-1
APPENDIX A3.2 FLOW COMPUTATION METHODS USED TO CALCULATE EAA BASIN FLOWS
Table of Contents
GATED SPILLWAYS Parameters Uncontrolled Free Flow
Uncontrolled Submerged Flow Controlled Free Flow Controlled Submerged Flow Over-the-top Flow
PUMPS Parameters Pump Flow Constant-speed Pump Variable-speed Pump Variable-speed Pump with Very Variable Head Siphon Flow CULVERTS Parameters
EVERGLADES PROGRAM: EAA CHAPTER 40E-63, Appendix A3.2 July-01 July 13, 2017, Governing Board DRAFT
June 6, 2017, Version A3.2-2
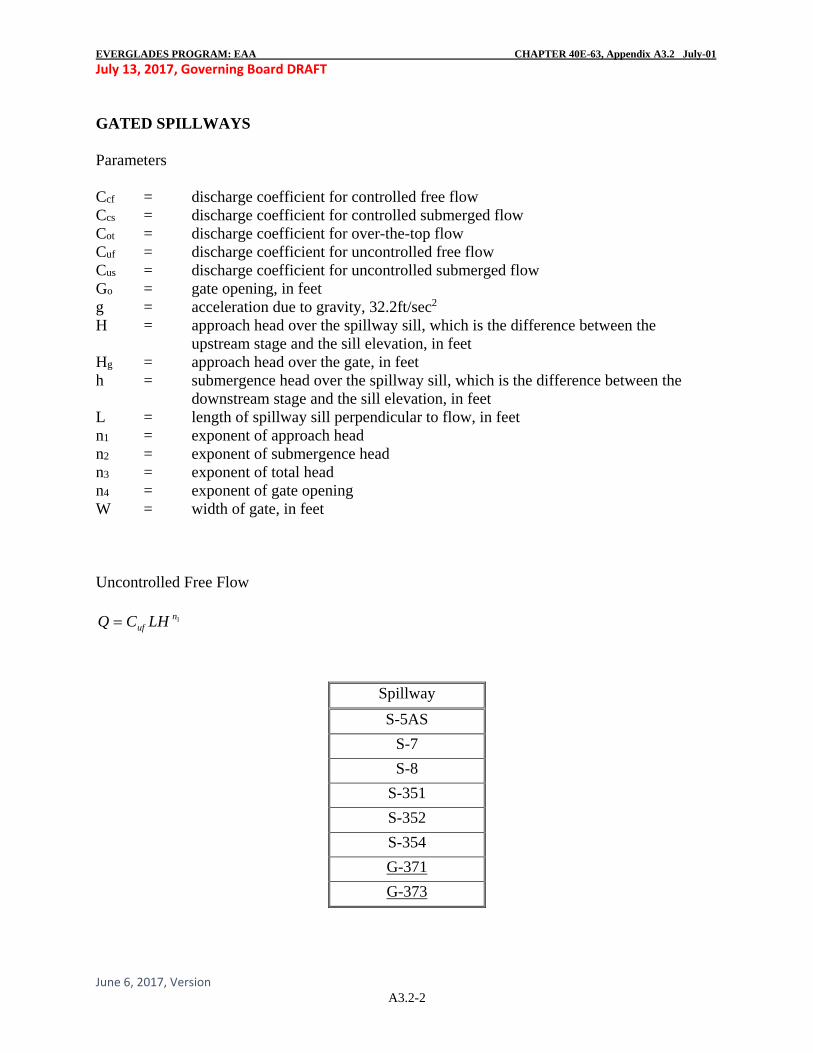
GATED SPILLWAYS Parameters Ccf = discharge coefficient for controlled free flow Ccs = discharge coefficient for controlled submerged flow Cot = discharge coefficient for over-the-top flow Cuf = discharge coefficient for uncontrolled free flow Cus = discharge coefficient for uncontrolled submerged flow Go = gate opening, in feet g = acceleration due to gravity, 32.2ft/sec2
H = approach head over the spillway sill, which is the difference between the upstream stage and the sill elevation, in feet
Hg = approach head over the gate, in feet h = submergence head over the spillway sill, which is the difference between the
downstream stage and the sill elevation, in feet L = length of spillway sill perpendicular to flow, in feet n1 = exponent of approach head n2 = exponent of submergence head n3 = exponent of total head n4 = exponent of gate opening W = width of gate, in feet Uncontrolled Free Flow
Spillway
S-5AS
S-7
S-8
S-351
S-352
S-354
G-371
G-373
1nuf LHCQ
EVERGLADES PROGRAM: EAA CHAPTER 40E-63, Appendix A3.2 July-01 July 13, 2017, Governing Board DRAFT
June 6, 2017, Version A3.2-3
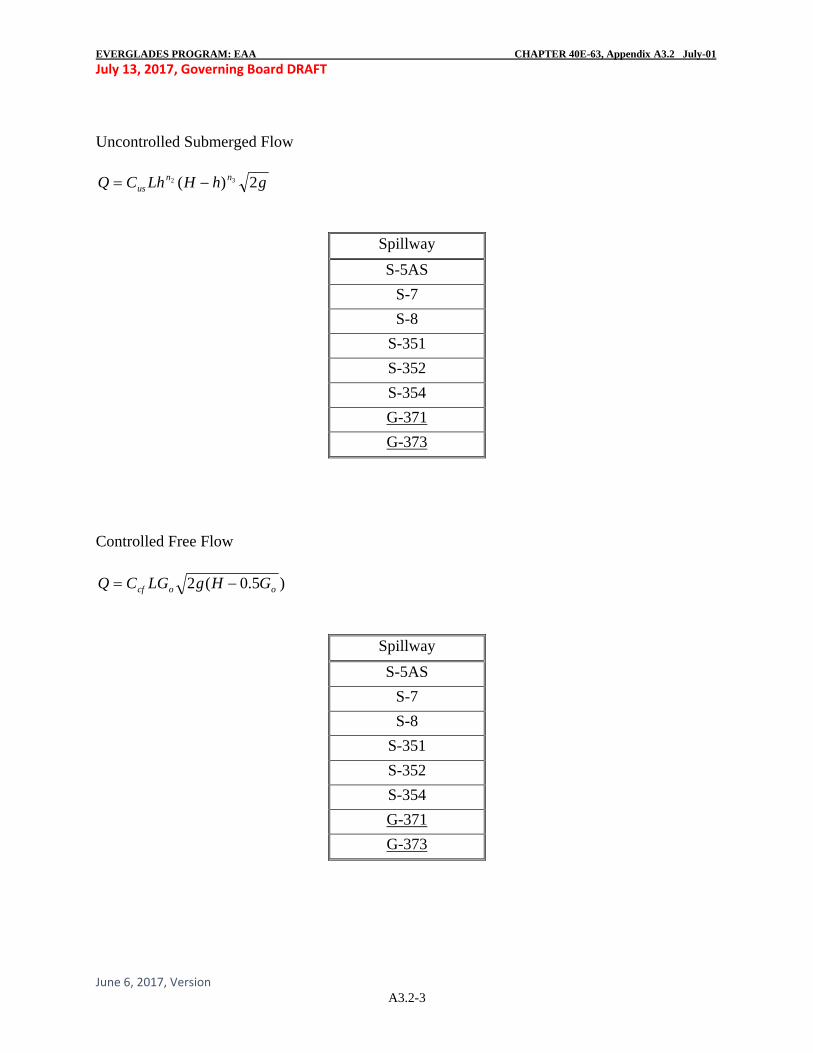
Uncontrolled Submerged Flow
Spillway
S-5AS
S-7
S-8
S-351
S-352
S-354
G-371
G-373
Controlled Free Flow
Spillway
S-5AS
S-7
S-8
S-351
S-352
S-354
G-371
G-373
ghHLhCQ nnus 2)( 32
)5.0(2 oocf GHgLGCQ
EVERGLADES PROGRAM: EAA CHAPTER 40E-63, Appendix A3.2 July-01 July 13, 2017, Governing Board DRAFT
June 6, 2017, Version A3.2-4
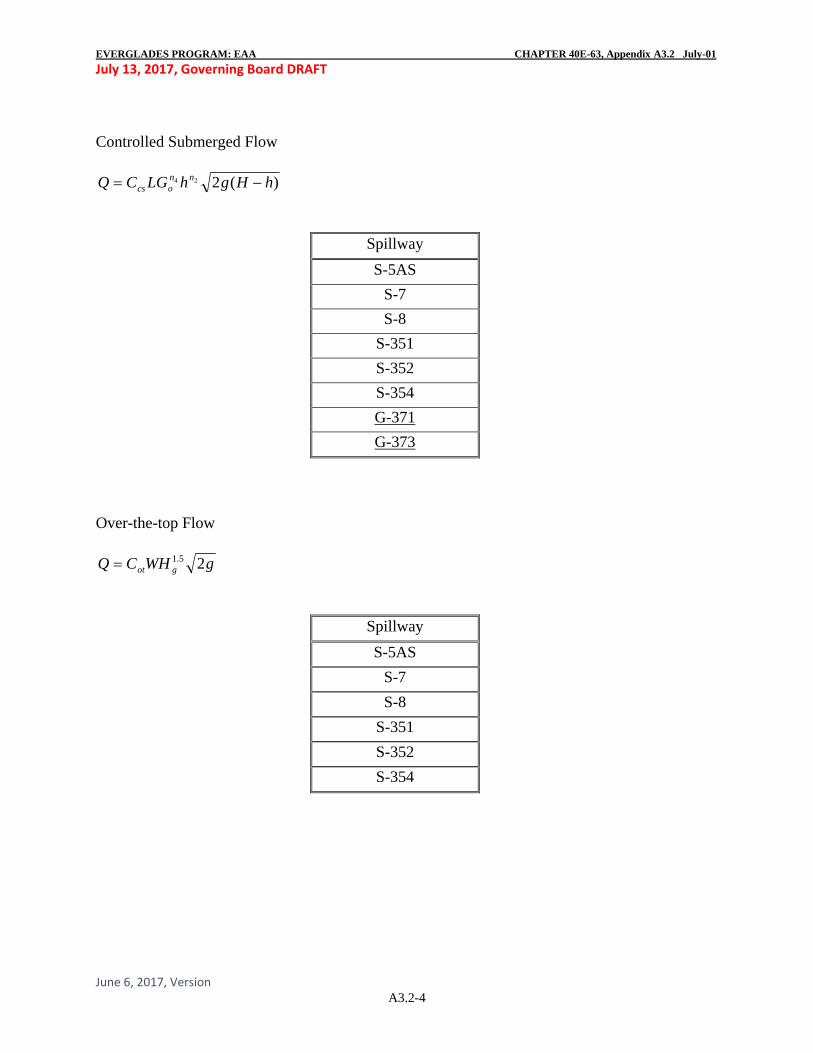
Controlled Submerged Flow
Spillway
S-5AS
S-7
S-8
S-351
S-352
S-354
G-371
G-373
Over-the-top Flow
Spillway
S-5AS
S-7
S-8
S-351
S-352
S-354
)(224 hHghLGCQ nnocs
gWHCQ got 25.1
EVERGLADES PROGRAM: EAA CHAPTER 40E-63, Appendix A3.2 July-01 July 13, 2017, Governing Board DRAFT
June 6, 2017, Version A3.2-5
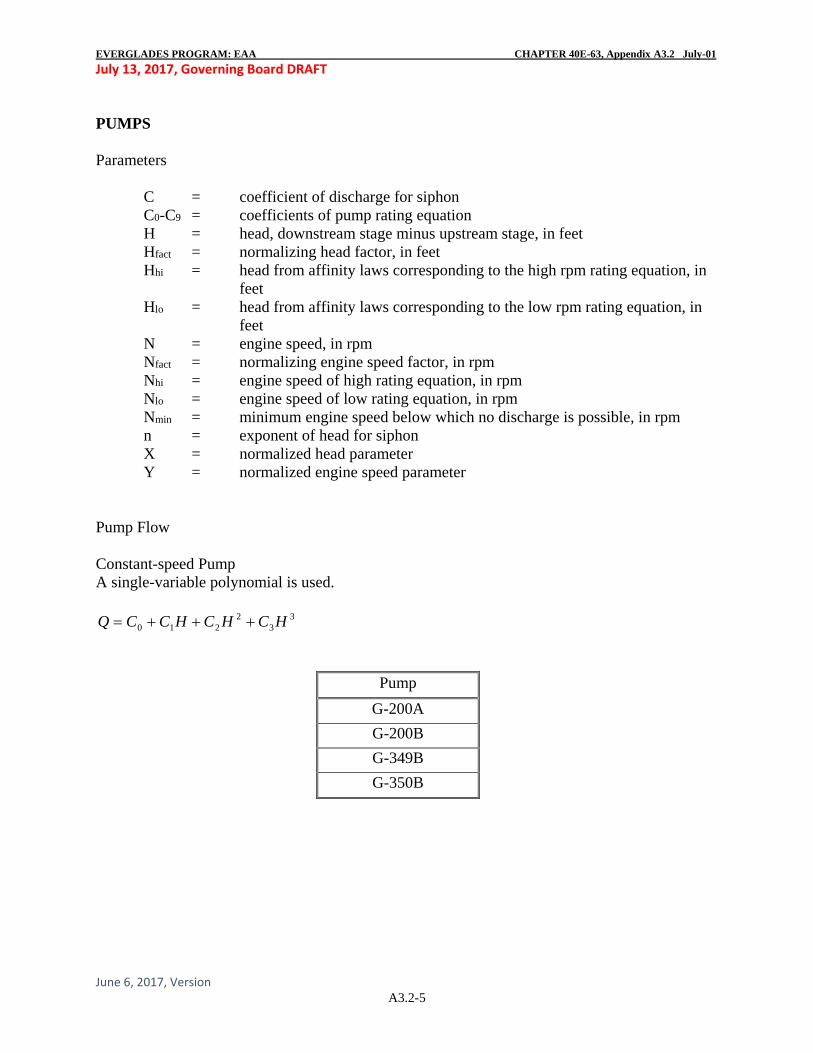
PUMPS Parameters C = coefficient of discharge for siphon C0-C9 = coefficients of pump rating equation H = head, downstream stage minus upstream stage, in feet Hfact = normalizing head factor, in feet Hhi = head from affinity laws corresponding to the high rpm rating equation, in
feet Hlo = head from affinity laws corresponding to the low rpm rating equation, in
feet N = engine speed, in rpm Nfact = normalizing engine speed factor, in rpm Nhi = engine speed of high rating equation, in rpm Nlo = engine speed of low rating equation, in rpm Nmin = minimum engine speed below which no discharge is possible, in rpm n = exponent of head for siphon X = normalized head parameter Y = normalized engine speed parameter Pump Flow Constant-speed Pump A single-variable polynomial is used.
Pump
G-200A
G-200B
G-349B
G-350B
33
2210 HCHCHCCQ
EVERGLADES PROGRAM: EAA CHAPTER 40E-63, Appendix A3.2 July-01 July 13, 2017, Governing Board DRAFT
June 6, 2017, Version A3.2-6
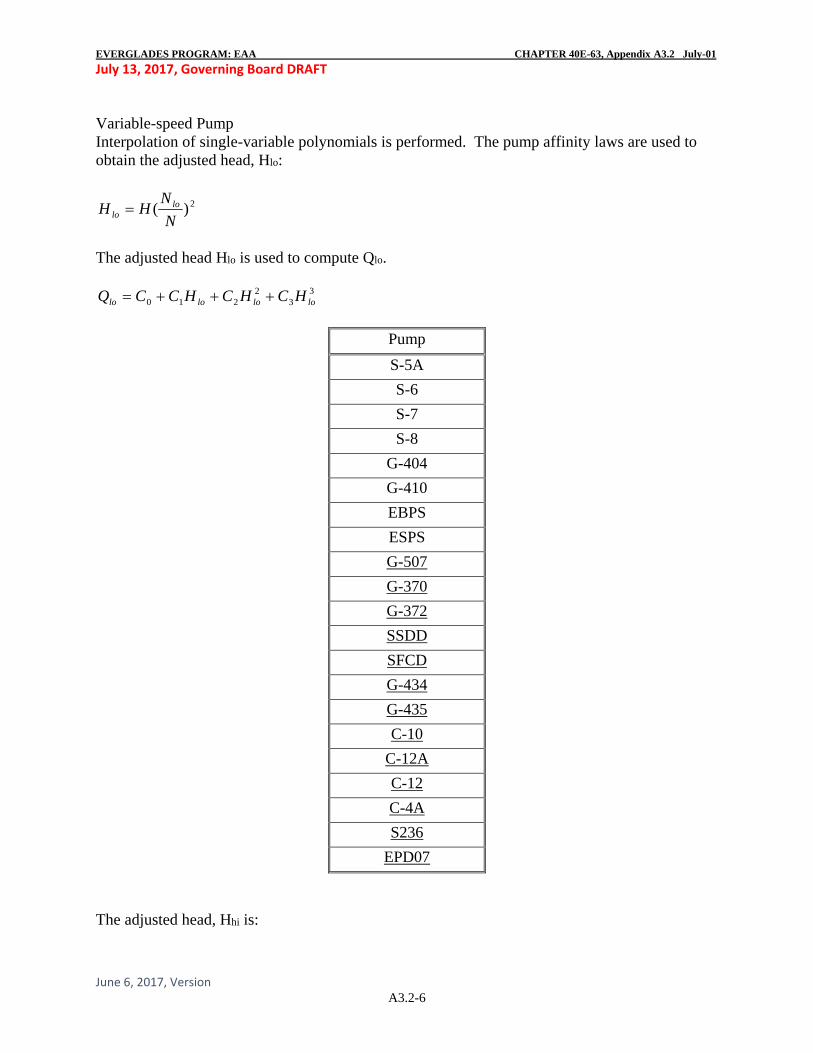
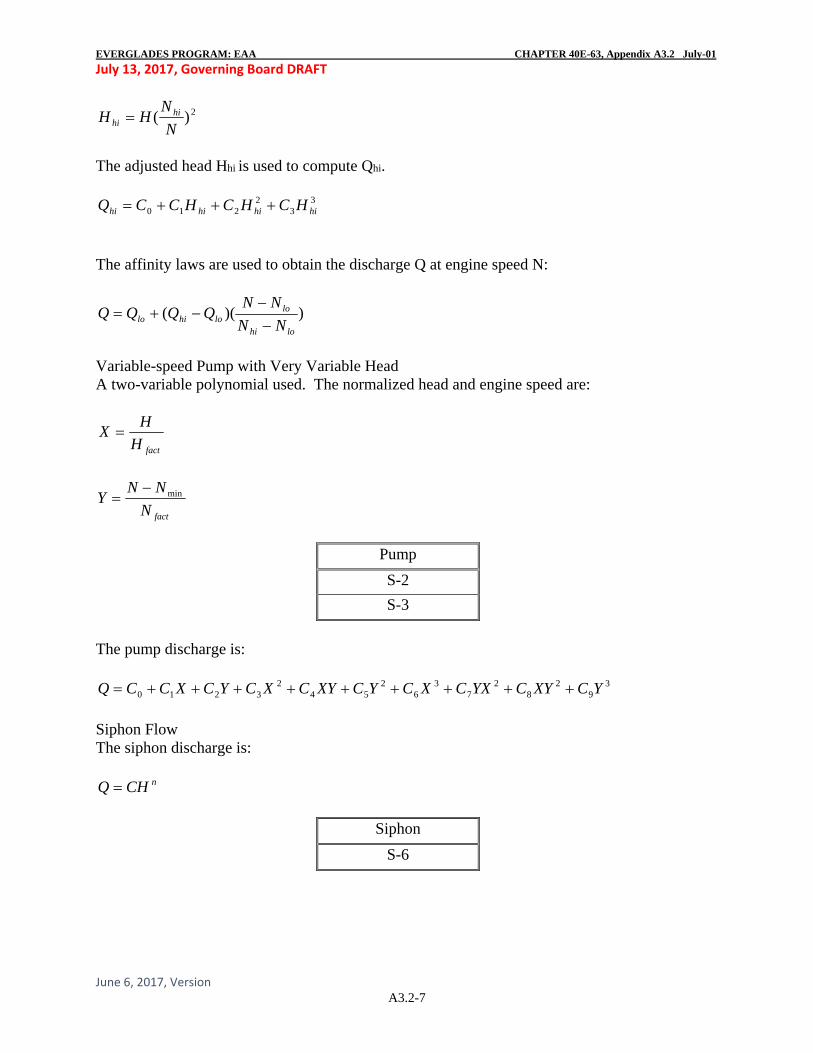
Variable-speed Pump Interpolation of single-variable polynomials is performed. The pump affinity laws are used to obtain the adjusted head, Hlo:
The adjusted head Hlo is used to compute Qlo.
Pump
S-5A
S-6
S-7
S-8
G-404
G-410
EBPS
ESPS
G-507
G-370
G-372
SSDD
SFCD
G-434
G-435
C-10
C-12A
C-12
C-4A
S236
EPD07
The adjusted head, Hhi is:
2)(N
NHH lo
lo
33
2210 lolololo HCHCHCCQ
EVERGLADES PROGRAM: EAA CHAPTER 40E-63, Appendix A3.2 July-01 July 13, 2017, Governing Board DRAFT
June 6, 2017, Version A3.2-7
The adjusted head Hhi is used to compute Qhi.
The affinity laws are used to obtain the discharge Q at engine speed N:
Variable-speed Pump with Very Variable Head A two-variable polynomial used. The normalized head and engine speed are:
Pump
S-2
S-3
The pump discharge is:
Siphon Flow The siphon discharge is:
Siphon
S-6
2)(N
NHH hi
hi
33
2210 hihihihi HCHCHCCQ
))((lohi
lolohilo NN
NNQQQQ
factH
HX
factN
NNY min
39
28
27
36
254
23210 YCXYCYXCXCYCXYCXCYCXCCQ
nCHQ
EVERGLADES PROGRAM: EAA CHAPTER 40E-63, Appendix A3.2 July-01 July 13, 2017, Governing Board DRAFT
June 6, 2017, Version A3.2-8
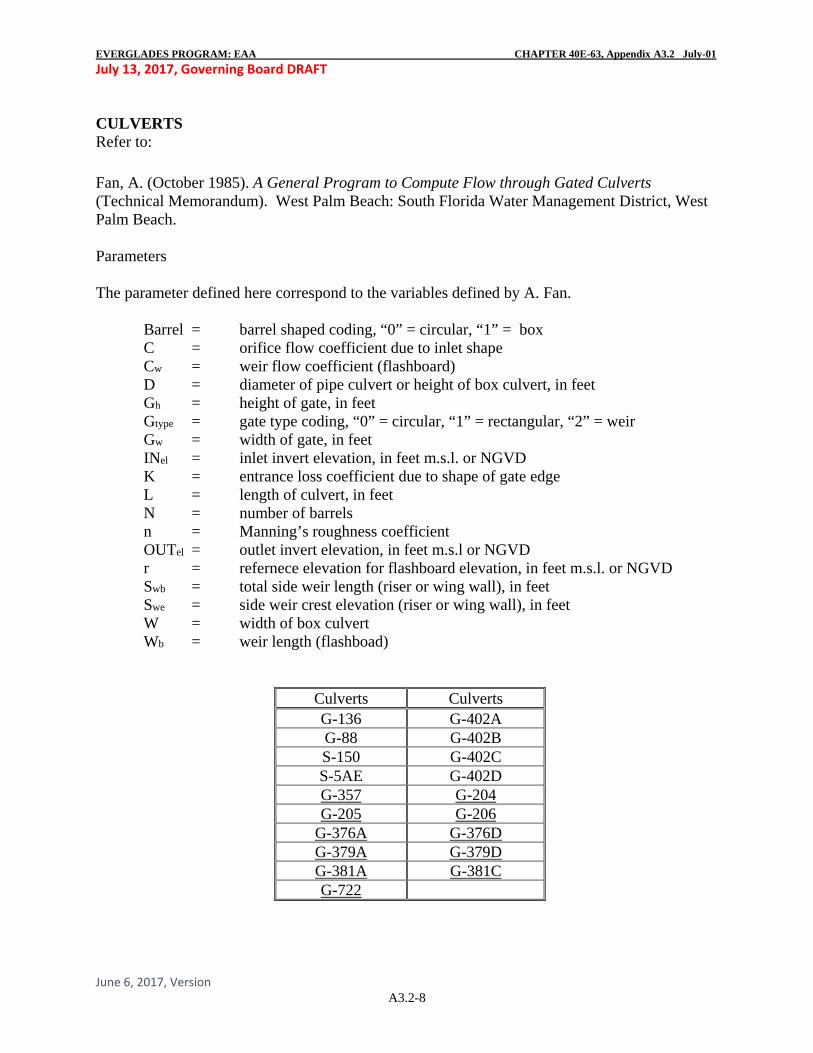
CULVERTS Refer to:
Fan, A. (October 1985). A General Program to Compute Flow through Gated Culverts (Technical Memorandum). West Palm Beach: South Florida Water Management District, West Palm Beach. Parameters The parameter defined here correspond to the variables defined by A. Fan. Barrel = barrel shaped coding, “0” = circular, “1” = box C = orifice flow coefficient due to inlet shape Cw = weir flow coefficient (flashboard) D = diameter of pipe culvert or height of box culvert, in feet Gh = height of gate, in feet Gtype = gate type coding, “0” = circular, “1” = rectangular, “2” = weir Gw = width of gate, in feet INel = inlet invert elevation, in feet m.s.l. or NGVD K = entrance loss coefficient due to shape of gate edge L = length of culvert, in feet N = number of barrels n = Manning’s roughness coefficient OUTel = outlet invert elevation, in feet m.s.l or NGVD r = refernece elevation for flashboard elevation, in feet m.s.l. or NGVD Swb = total side weir length (riser or wing wall), in feet Swe = side weir crest elevation (riser or wing wall), in feet W = width of box culvert Wb = weir length (flashboad)
Culverts Culverts G-136 G-402A G-88 G-402B S-150 G-402C S-5AE G-402D G-357 G-204 G-205 G-206
G-376A G-376D G-379A G-379D G-381A G-381C G-722
EVERGLADES PROGRAM: EAA CHAPTER 40E-63, Appendix A4 July-01
July 13, 2017, Governing Board DRAFT
June 6, 2017, Version
A4-1
APPENDIX A4 EAA FARM SCALE ALLOCATION
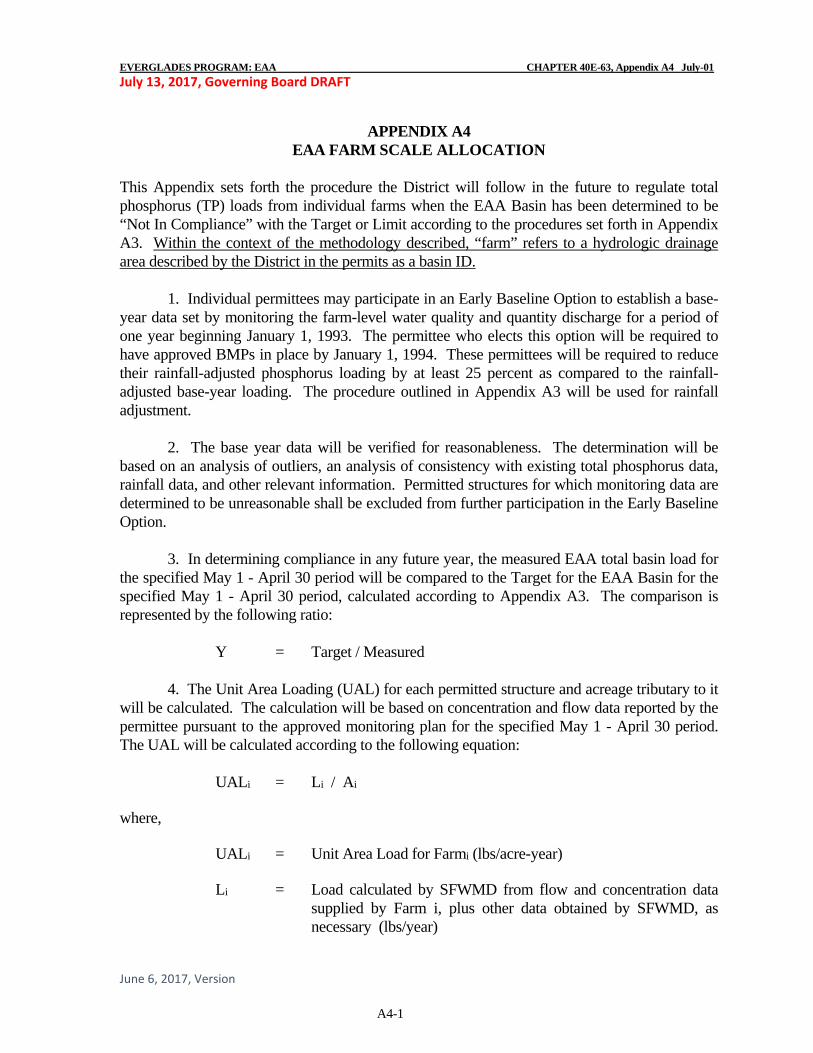
This Appendix sets forth the procedure the District will follow in the future to regulate total phosphorus (TP) loads from individual farms when the EAA Basin has been determined to be “Not In Compliance” with the Target or Limit according to the procedures set forth in Appendix A3. Within the context of the methodology described, “farm” refers to a hydrologic drainage area described by the District in the permits as a basin ID. 1. Individual permittees may participate in an Early Baseline Option to establish a base-year data set by monitoring the farm-level water quality and quantity discharge for a period of one year beginning January 1, 1993. The permittee who elects this option will be required to have approved BMPs in place by January 1, 1994. These permittees will be required to reduce their rainfall-adjusted phosphorus loading by at least 25 percent as compared to the rainfall-adjusted base-year loading. The procedure outlined in Appendix A3 will be used for rainfall adjustment. 2. The base year data will be verified for reasonableness. The determination will be based on an analysis of outliers, an analysis of consistency with existing total phosphorus data, rainfall data, and other relevant information. Permitted structures for which monitoring data are determined to be unreasonable shall be excluded from further participation in the Early Baseline Option. 3. In determining compliance in any future year, the measured EAA total basin load for the specified May 1 - April 30 period will be compared to the Target for the EAA Basin for the specified May 1 - April 30 period, calculated according to Appendix A3. The comparison is represented by the following ratio: Y = Target / Measured 4. The Unit Area Loading (UAL) for each permitted structure and acreage tributary to it will be calculated. The calculation will be based on concentration and flow data reported by the permittee pursuant to the approved monitoring plan for the specified May 1 - April 30 period. The UAL will be calculated according to the following equation: UALi = Li / Ai where, UALi = Unit Area Load for Farmi (lbs/acre-year) Li = Load calculated by SFWMD from flow and concentration data
supplied by Farm i, plus other data obtained by SFWMD, as necessary (lbs/year)
EVERGLADES PROGRAM: EAA CHAPTER 40E-63, Appendix A4 July-01
July 13, 2017, Governing Board DRAFT
June 6, 2017, Version
A4-2
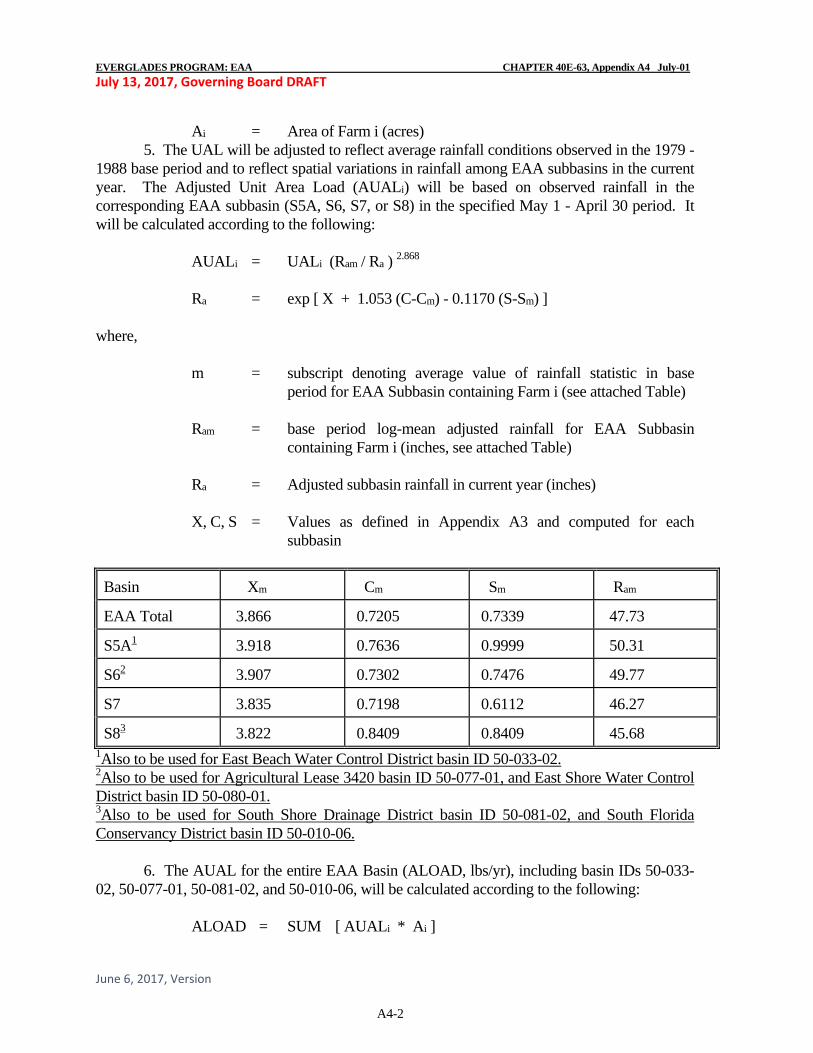
Ai = Area of Farm i (acres) 5. The UAL will be adjusted to reflect average rainfall conditions observed in the 1979 - 1988 base period and to reflect spatial variations in rainfall among EAA subbasins in the current year. The Adjusted Unit Area Load (AUALi) will be based on observed rainfall in the corresponding EAA subbasin (S5A, S6, S7, or S8) in the specified May 1 - April 30 period. It will be calculated according to the following: AUALi = UALi (Ram / Ra ) 2.868 Ra = exp [ X + 1.053 (C-Cm) - 0.1170 (S-Sm) ] where, m = subscript denoting average value of rainfall statistic in base
period for EAA Subbasin containing Farm i (see attached Table) Ram = base period log-mean adjusted rainfall for EAA Subbasin
containing Farm i (inches, see attached Table) Ra = Adjusted subbasin rainfall in current year (inches) X, C, S = Values as defined in Appendix A3 and computed for each
subbasin
Basin Xm Cm Sm Ram
EAA Total 3.866 0.7205 0.7339 47.73
S5A1 3.918 0.7636 0.9999 50.31
S62 3.907 0.7302 0.7476 49.77
S7 3.835 0.7198 0.6112 46.27
S83 3.822 0.8409 0.8409 45.68 1Also to be used for East Beach Water Control District basin ID 50-033-02. 2Also to be used for Agricultural Lease 3420 basin ID 50-077-01, and East Shore Water Control District basin ID 50-080-01. 3Also to be used for South Shore Drainage District basin ID 50-081-02, and South Florida Conservancy District basin ID 50-010-06. 6. The AUAL for the entire EAA Basin (ALOAD, lbs/yr), including basin IDs 50-033-02, 50-077-01, 50-081-02, and 50-010-06, will be calculated according to the following: ALOAD = SUM [ AUALi * Ai ]
EVERGLADES PROGRAM: EAA CHAPTER 40E-63, Appendix A4 July-01
July 13, 2017, Governing Board DRAFT
June 6, 2017, Version
A4-3
7. The Farm -Level Target Load (FTLOAD, lbs/yr) will be calculated based on the assumption that the percentage reduction in total load required at the Farm scale equals the percentage reduction required at the Basin scale. The calculation will be based on the following: FTLOAD = ALOAD * Y 8. For those permittees who elected to participate in the Early Baseline Option, compliance will be determined by adjusting both current and base year measured loads to average rainfall conditions using the procedure given in paragraph 5 above. Permittees who have achieved the 25% load reduction will be identified by comparing the adjusted load for the base year with the adjusted load for the current year. 9. Permittees who did not elect to participate in the Early Baseline Option are subject to a Maximum Unit Area Loading (MUAL, lbs/acre-yr) discharge limit, which is computed by solving the following equation: FTLOAD = SUM [MUAL * Aj] + SUM [AUALi * Ai] The first summation (j) is over all Farm s with AUALj greater than MUAL, excluding those who have taken the Early Baseline Option and achieved a minimum 25% load reduction. The second summation is over all remaining Farms, which include (a) Farms with AUALi below MUAL; and (b) Farms which elected the Early Baseline Option and met the minimum 25 percent load reduction requirement. 10. Revised BMP plans will be required for all permitted structures and tributary acreages whose AUALj exceed MUAL. Revised BMP plans will also be required from all permittees who elected the Early Baseline Option, but did not achieve at least a 25 percent load reduction. Compliance and enforcement procedures are set forth in Rule 40E-63.145(3), (4), and (5), F.A.C.