Embed Size (px)
Citation preview
76
CHAPTER 4
THEORETICAL APPROACH FOR CHAIN
ELONGATION AND FATIGUE
4.1 INTRODUCTION
In this chapter, motorcycle traction force, power available at
wheels, chain force calculation based on vehicle specification, force on links
due to meshing with sprockets, bush shrinkage, pin bush deflection,
modification of bush profile, theoretical elongation evaluation of chain under
various conditions are discussed.
4.2 MOTORCYCLE TRACTION LOAD
From the motorcycle specification shown in Table 3.4 discussed in
section 3.6, the traction effort and the power on rear drive wheel are evaluated
as discussed hereunder.
4.2.1 Traction and Tractive Effort
The force available at the contact between drive wheel tyres and
road is known as ‘Tractive effort”. The ability of the drive wheels to transmit
this effort without slipping is known as ‘Traction’. The tractive effort is given
by the Equation (4.1) (Giri 2006).
77
w et
t t
T T GFr r
(4.1)
where Te - mean engine torque, Nm
Tw - Torque at drive wheels, Nm
G - overall gear ratio
rt - radius of tyre, m
η - overall transmission efficiency
Ft - Traction force in N
Engine torque is related by the Equation (4.2).
260000
c ee
n TP (4.2)
where Pe - engine power in kW
nc - rpm of crankshaft.
Using Equations (4.1) and (4.2), and selecting the values from
Tables 3.4 and A2.3, the tractive effort is found. The results are shown in
Table 4.1.
In this work, motorcycles running on level roads are only
considered. Here, the roll resistance and air drag (Fenton 1996) are calculated
using the Equations (4.3) and (4.4).
Rolling resistance Rr=kr*wm (4.3)
78
where kr - rolling constant
wm - total weight of motorcycle, N
Air drag resistance Ra= 212 dc aAV (4.4)
where Cd - air drag coefficient
ρa - air density kg/m3
Af - projected frontal area m2
V - velocity of motorcycle m/s.
Table 4.1 Traction force under maximum engine power condition
Description Gear I Gear II Gear III Gear IV
Over all gear ratio 37.47216 20.03553 14.1737 10.96802
Traction Force N 817.8811 437.3027 309.3605 239.392
Assuming total weight of the vehicle to be 264 kg (motorcycle
weight 104kg plus two persons weight 160 kg) and rolling coefficient of
0.015, rolling resistance is calculated, which is 3.96N. Similarly, air drag
resistance when motorcycle moves from first to top gear are calculated. Total
resistance acting on motorcycle is evaluated as shown in Table 4.2.
79
Table 4.2 Motorcycle propulsion resistance
Motorcycle
speed in m/s
Motorcycle
speed in km/hr
Air resistance
N
Rolling
resistance N
Total
resistance N
6.388459 22.99845 6.121862 3.96 10.08186
11.94824 43.01368 21.41408 3.96 25.37408
16.88968 60.80286 42.78921 3.96 46.74921
21.82612 78.57405 71.45696 3.96 75.41696
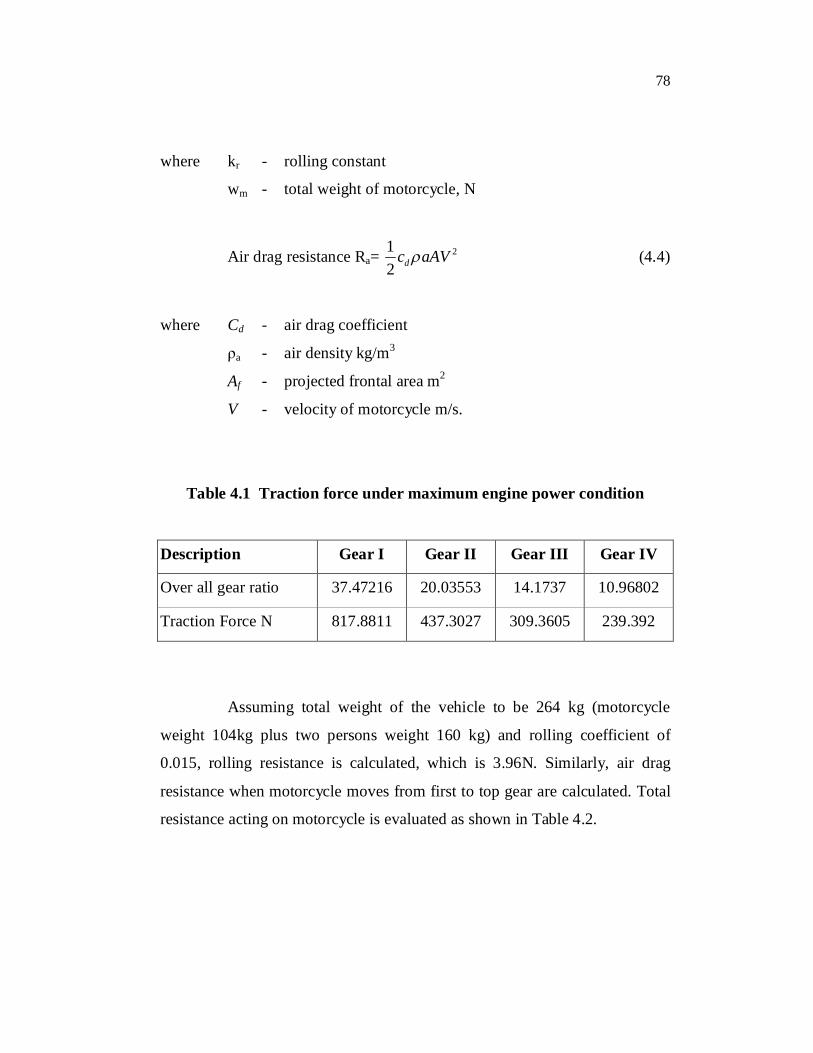
A plot is made for the tractive effort and motorcycle speed at all
four gears, which is shown in Figure 4.1.
-200
0
200
400
600
800
1000
0 20 40 60 80 100
Road resistance
1st gear
2nd gear3rd gear
Top gear
Figure 4.1 Traction force
4.2.2 Power at Wheels Under Full Throttle
Motorcycle performance is based on acceleration, ability to go up a
slope, top speed, fuel economy, noise level and durability. Transmission
gearing is designed to provide maximum acceleration at low speed. The
power required to drive an automobile increases as the cube of the speed i.e. it
Road speed in km/hr
Trac
tion
effo
rt in
N
80
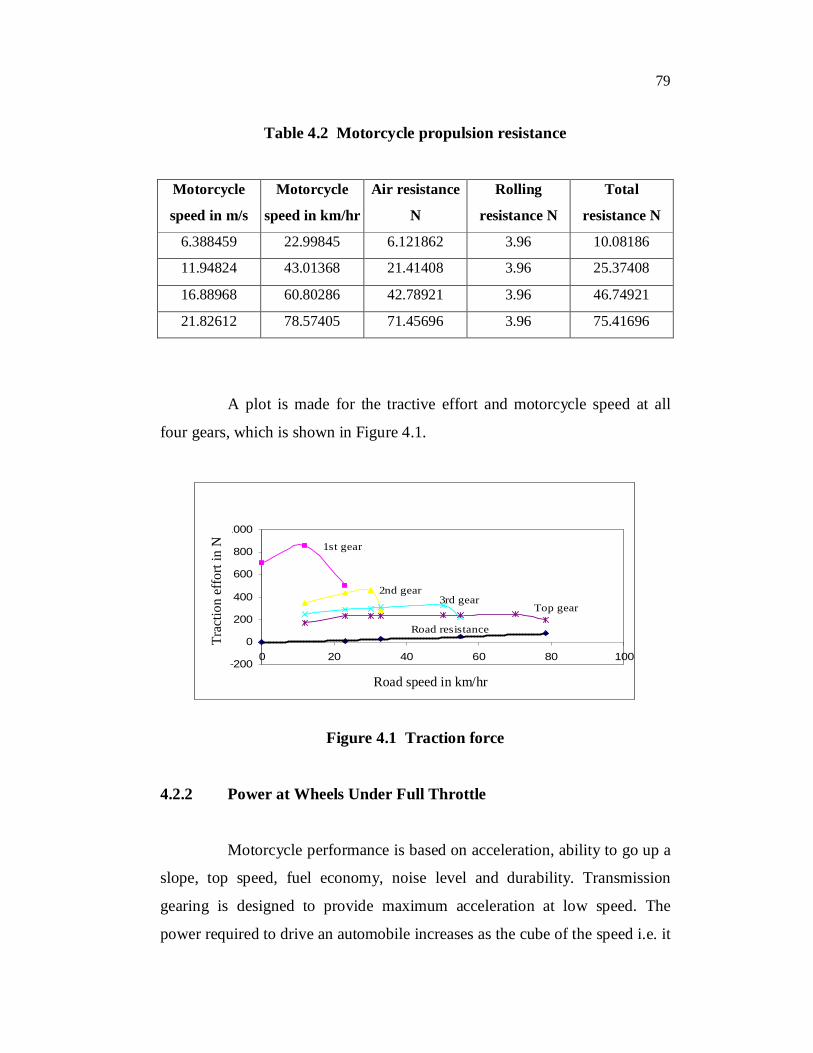
takes eight times the power to double the speed (Giri 2006). When the power
available matches the power required to push the vehicle, the speed becomes
constant. Excess power is required for acceleration and climbing. Maximum
speed is reached when there is no excess power (Giri 2006). Based on the
tractive effort and speed, the power available at the wheels is plotted as shown
in Figure 4.2.
-1
0
1
2
3
4
5
6
-20 0 20 40 60 80 100
1st gear 2nd gear 3rd gear 4th gear
Power required by vehicle on level road
Normal gear part throttle
Figure 4.2 Power at drive wheel
4.3 CHAIN FORCES IN TIGHT SPAN
Based on the power at drive wheel, it is found that under full
throttle condition maximum tractive force is developed and this would cause
more force to act on transmission chain. Hence, in this present investigation,
forces on chain are calculated for motorcycle of brand B, model 1 for
maximum power condition. Here, vehicle acceleration is classified into two
stages. In stage one, vehicle starts under first gear and during this stage,
maximum torque is required to accelerate with pay load and the acceleration
of vehicle continuous through 2nd, 3rd till it reaches considerable speed. In
stage two, vehicle is further accelerated in top gear by giving more throttles,
till vehicle attains maximum steady speed overcoming all resistances. Typical
Road speed in km/hr
Pow
er a
t whe
el in
kW
81
values of acceleration of motorcycle (ART 2008) of the same capacity used in
this work, moving from rest on a dry surface are shown in Table 4.3.
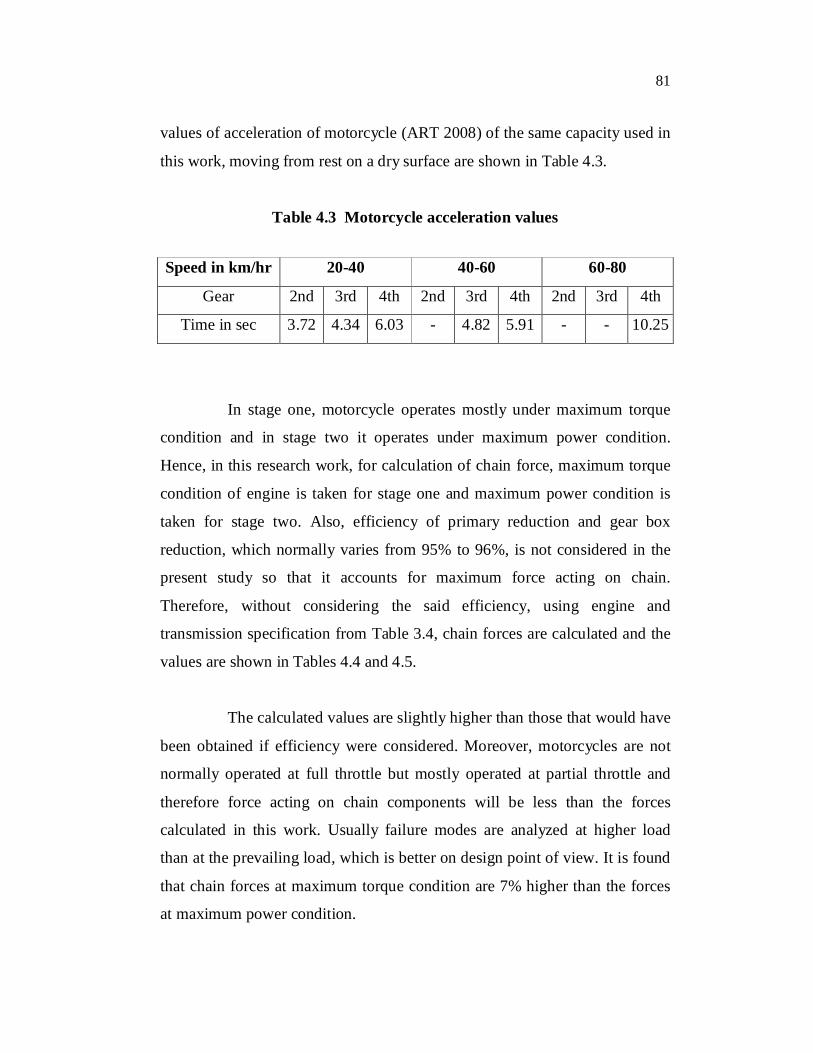
Table 4.3 Motorcycle acceleration values
Speed in km/hr 20-40 40-60 60-80
Gear 2nd 3rd 4th 2nd 3rd 4th 2nd 3rd 4th
Time in sec 3.72 4.34 6.03 - 4.82 5.91 - - 10.25
In stage one, motorcycle operates mostly under maximum torque
condition and in stage two it operates under maximum power condition.
Hence, in this research work, for calculation of chain force, maximum torque
condition of engine is taken for stage one and maximum power condition is
taken for stage two. Also, efficiency of primary reduction and gear box
reduction, which normally varies from 95% to 96%, is not considered in the
present study so that it accounts for maximum force acting on chain.
Therefore, without considering the said efficiency, using engine and
transmission specification from Table 3.4, chain forces are calculated and the
values are shown in Tables 4.4 and 4.5.
The calculated values are slightly higher than those that would have
been obtained if efficiency were considered. Moreover, motorcycles are not
normally operated at full throttle but mostly operated at partial throttle and
therefore force acting on chain components will be less than the forces
calculated in this work. Usually failure modes are analyzed at higher load
than at the prevailing load, which is better on design point of view. It is found
that chain forces at maximum torque condition are 7% higher than the forces
at maximum power condition.
82
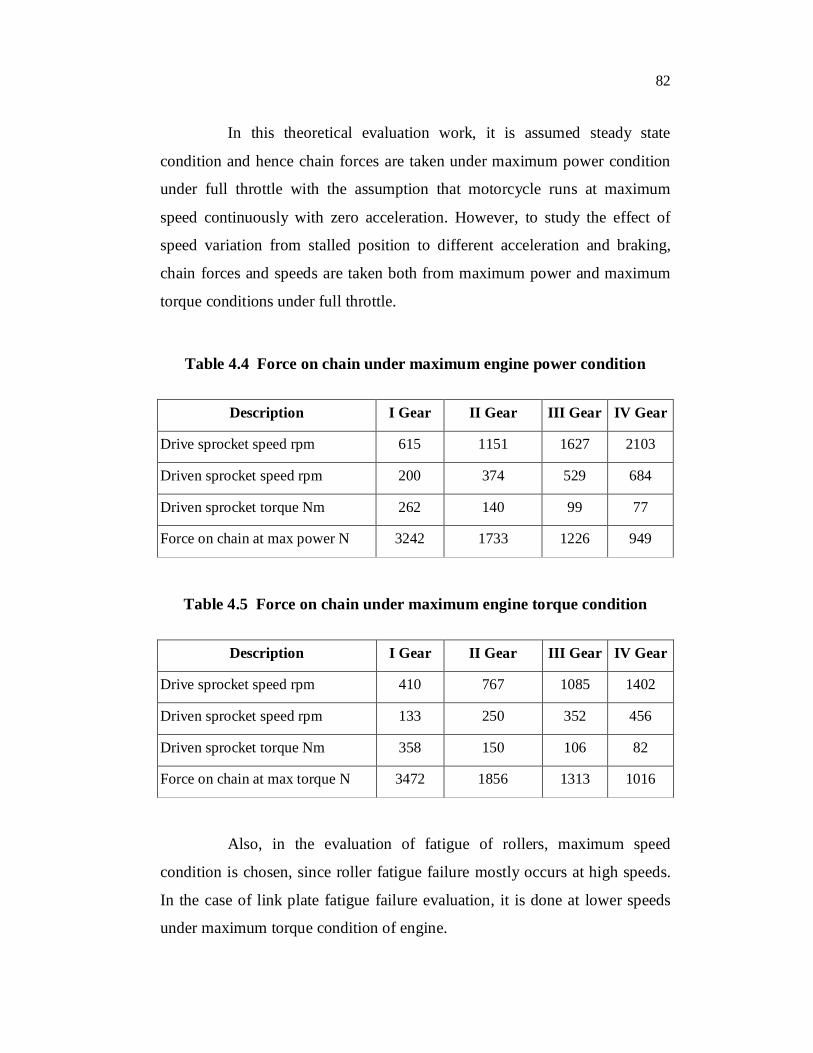
In this theoretical evaluation work, it is assumed steady state
condition and hence chain forces are taken under maximum power condition
under full throttle with the assumption that motorcycle runs at maximum
speed continuously with zero acceleration. However, to study the effect of
speed variation from stalled position to different acceleration and braking,
chain forces and speeds are taken both from maximum power and maximum
torque conditions under full throttle.
Table 4.4 Force on chain under maximum engine power condition
Description I Gear II Gear III Gear IV Gear
Drive sprocket speed rpm 615 1151 1627 2103
Driven sprocket speed rpm 200 374 529 684
Driven sprocket torque Nm 262 140 99 77
Force on chain at max power N 3242 1733 1226 949
Table 4.5 Force on chain under maximum engine torque condition
Description I Gear II Gear III Gear IV Gear
Drive sprocket speed rpm 410 767 1085 1402
Driven sprocket speed rpm 133 250 352 456
Driven sprocket torque Nm 358 150 106 82
Force on chain at max torque N 3472 1856 1313 1016
Also, in the evaluation of fatigue of rollers, maximum speed
condition is chosen, since roller fatigue failure mostly occurs at high speeds.
In the case of link plate fatigue failure evaluation, it is done at lower speeds
under maximum torque condition of engine.
83
In the present investigation, in all theoretical evaluations except
drive cycles, chain force and speed values are taken from Table 4.4, whereas
for drive cycle modes three and five their values are taken from Table 4.5. In
the case of drive cycles one, two and four, in which duration of running in 4th
gear (top gear) is longer, force and speed values are taken from Table 4.4 for
top gear and for 1st to 3rd gears, their values are taken from Table 4.5.
As already discussed in section 3.10, forces acting on the tight span
of chains do not contribute to wear since there is nil or negligible relative
movement between pin and bush. Hence, forces acting on chain links, which
are in mesh with drive and driven sprockets that contribute for wear, are
evaluated. The details of calculation are discussed in section 4.5.2.
4.4 PARAMETERS OF ROLLER CHAIN SPROCKETS
The basic data for a roller chain sprocket are number of teeth, chain
pitch, roller diameter and roller width, height of roller link plates. Thickness
of link plates is considered in case of multiple strand chains.
4.4.1 Tooth Form
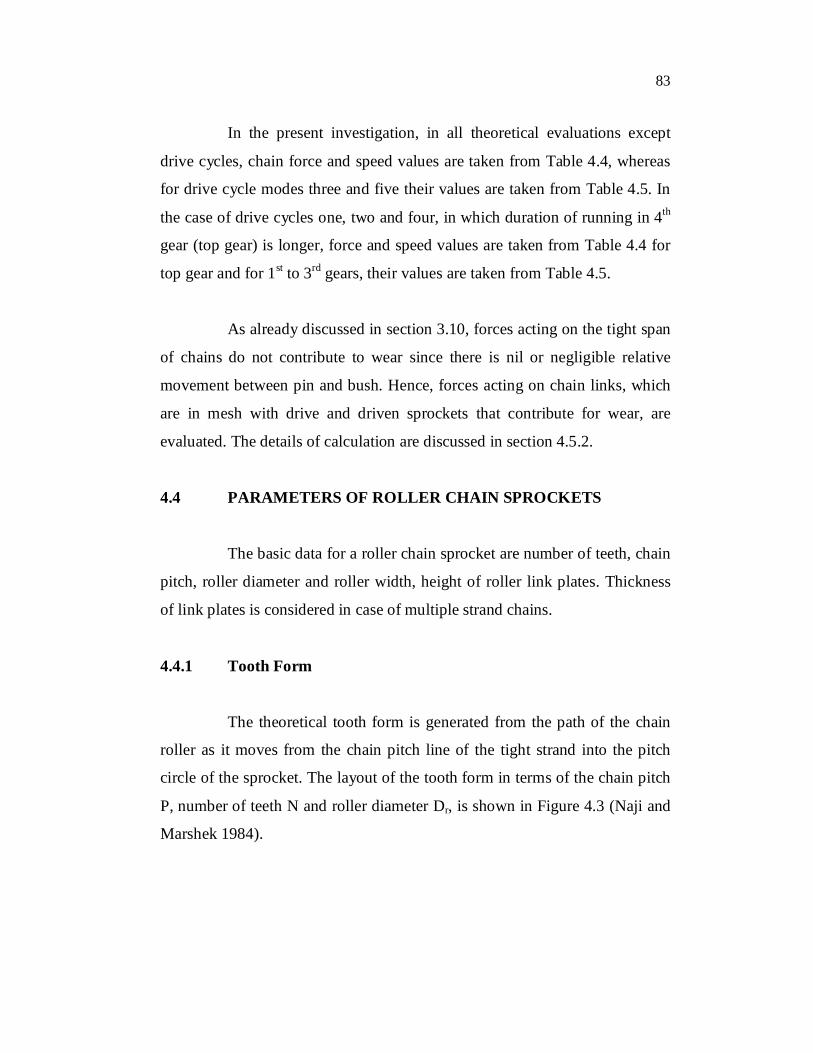
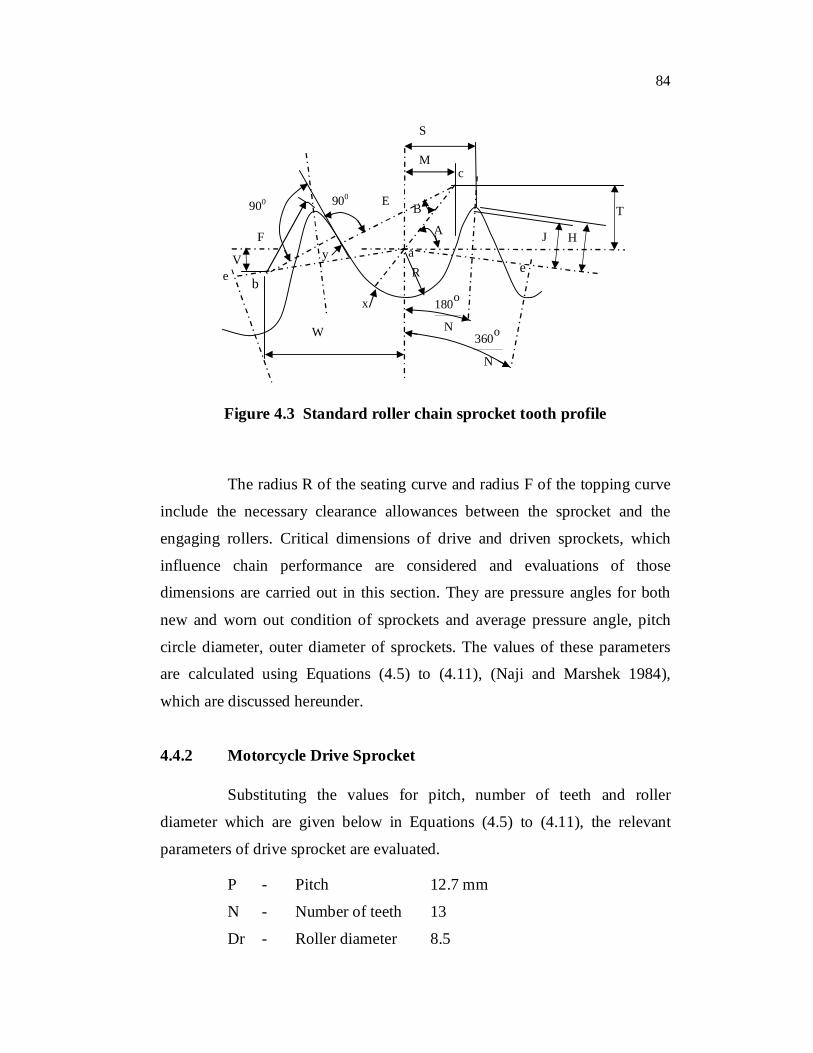
The theoretical tooth form is generated from the path of the chain
roller as it moves from the chain pitch line of the tight strand into the pitch
circle of the sprocket. The layout of the tooth form in terms of the chain pitch
P, number of teeth N and roller diameter Dr, is shown in Figure 4.3 (Naji and
Marshek 1984).
84
Figure 4.3 Standard roller chain sprocket tooth profile
The radius R of the seating curve and radius F of the topping curve
include the necessary clearance allowances between the sprocket and the
engaging rollers. Critical dimensions of drive and driven sprockets, which
influence chain performance are considered and evaluations of those
dimensions are carried out in this section. They are pressure angles for both
new and worn out condition of sprockets and average pressure angle, pitch
circle diameter, outer diameter of sprockets. The values of these parameters
are calculated using Equations (4.5) to (4.11), (Naji and Marshek 1984),
which are discussed hereunder.
4.4.2 Motorcycle Drive Sprocket
Substituting the values for pitch, number of teeth and roller
diameter which are given below in Equations (4.5) to (4.11), the relevant
parameters of drive sprocket are evaluated.
P - Pitch 12.7 mm
N - Number of teeth 13
Dr - Roller diameter 8.5
S
V
b
F
900 900
y
x
R a
A
B
c M
e
J H
T E
e
W
o180
N o360
N
85
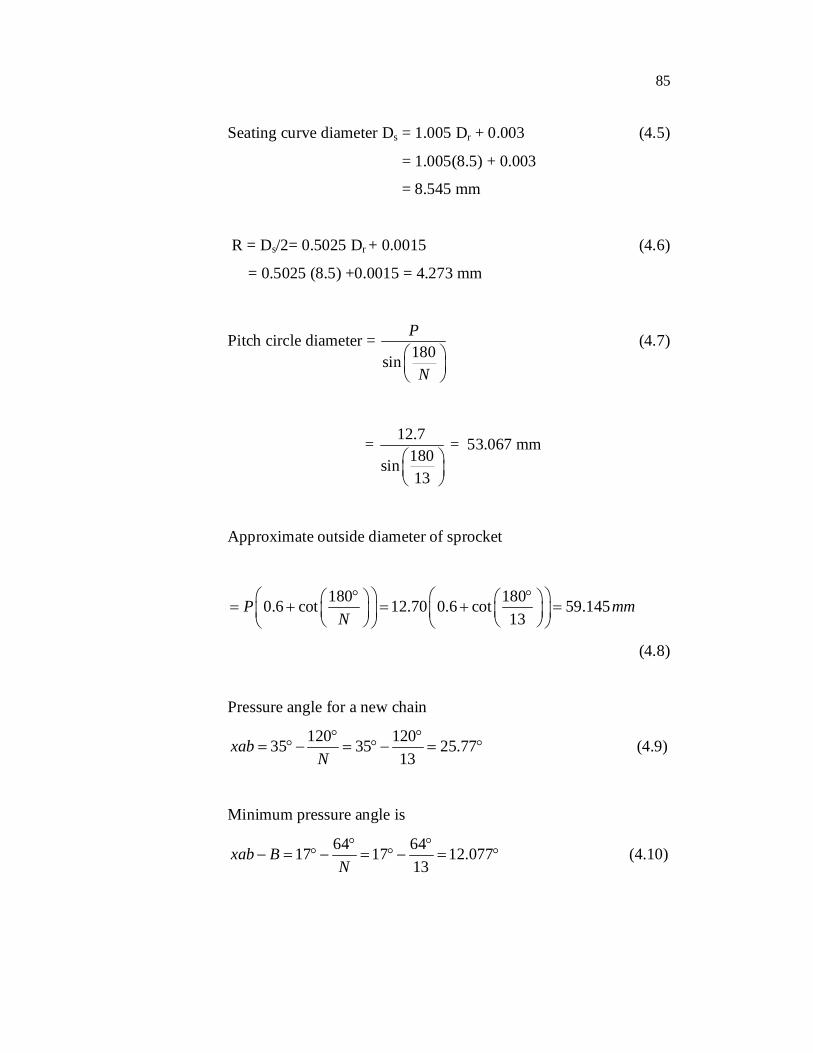
Seating curve diameter Ds = 1.005 Dr + 0.003 (4.5)
= 1.005(8.5) + 0.003
= 8.545 mm
R = Ds/2= 0.5025 Dr + 0.0015 (4.6)
= 0.5025 (8.5) +0.0015 = 4.273 mm
Pitch circle diameter = 180sin
P
N
(4.7)
= 12.7
180sin13
= 53.067 mm
Approximate outside diameter of sprocket
180 1800.6 cot 12.70 0.6 cot 59.14513
P mmN
(4.8)
Pressure angle for a new chain
120 12035 35 25.7713
xabN
(4.9)
Minimum pressure angle is
64 6417 17 12.07713
xab BN
(4.10)
86
Average pressure angle
92 9226 26 18.92313N
(4.11)
The calculated values are shown in Table 4.6.
4.4.3 Motorcycle driven sprocket
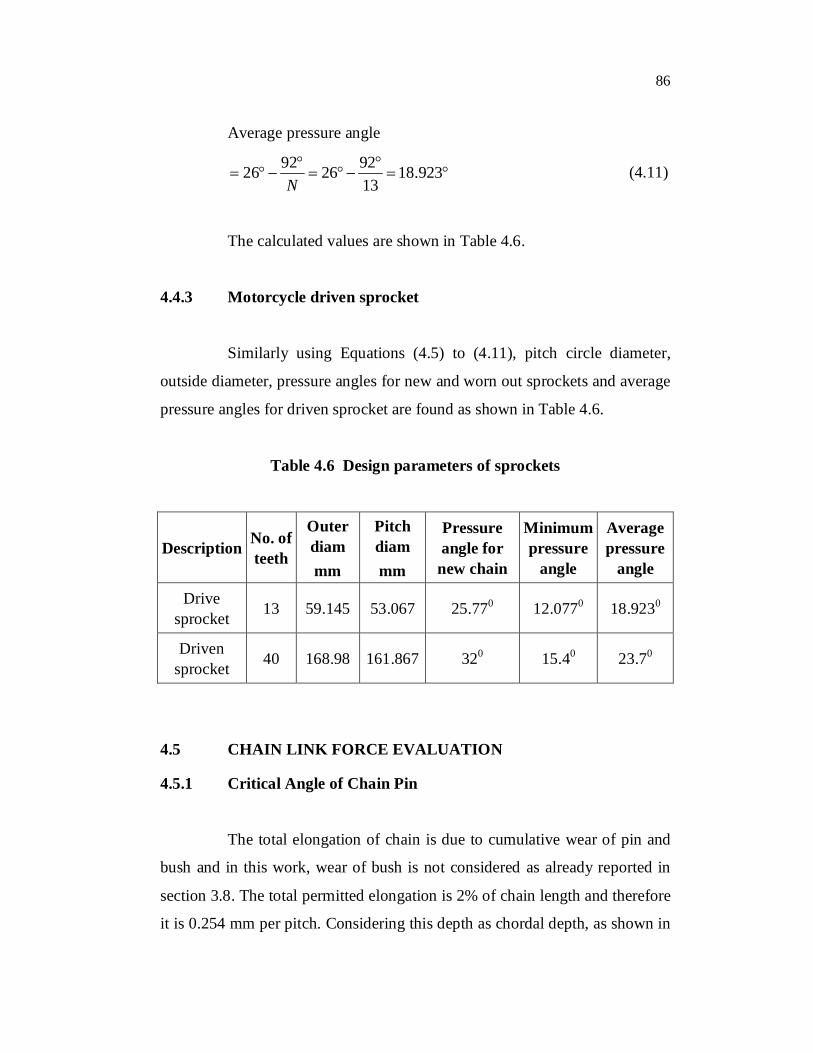
Similarly using Equations (4.5) to (4.11), pitch circle diameter,
outside diameter, pressure angles for new and worn out sprockets and average
pressure angles for driven sprocket are found as shown in Table 4.6.
Table 4.6 Design parameters of sprockets
Description No. of teeth
Outer diam mm
Pitch diam mm
Pressure angle for
new chain
Minimum pressure
angle
Average pressure
angle
Drive sprocket 13 59.145 53.067 25.770 12.0770 18.9230
Driven sprocket 40 168.98 161.867 320 15.40 23.70
4.5 CHAIN LINK FORCE EVALUATION
4.5.1 Critical Angle of Chain Pin
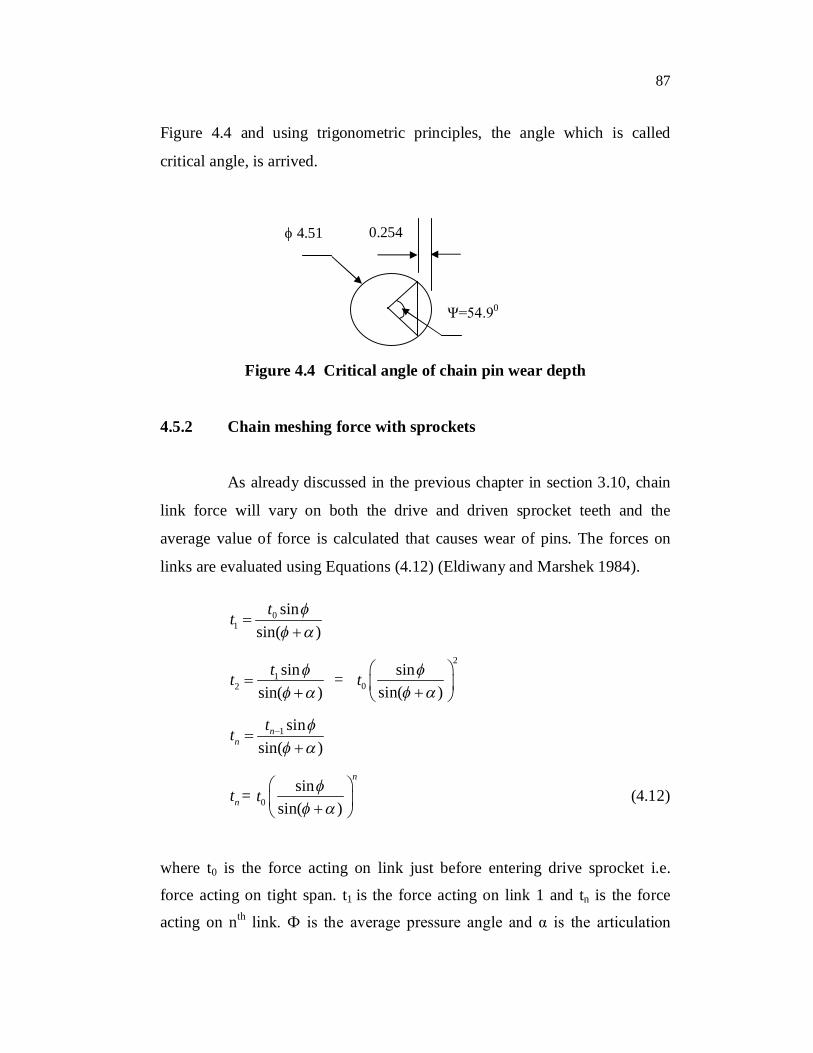
The total elongation of chain is due to cumulative wear of pin and
bush and in this work, wear of bush is not considered as already reported in
section 3.8. The total permitted elongation is 2% of chain length and therefore
it is 0.254 mm per pitch. Considering this depth as chordal depth, as shown in
87
Figure 4.4 and using trigonometric principles, the angle which is called
critical angle, is arrived.
Figure 4.4 Critical angle of chain pin wear depth
4.5.2 Chain meshing force with sprockets
As already discussed in the previous chapter in section 3.10, chain
link force will vary on both the drive and driven sprocket teeth and the
average value of force is calculated that causes wear of pins. The forces on
links are evaluated using Equations (4.12) (Eldiwany and Marshek 1984).
01
sinsin( )
tt
12
sinsin( )
tt
= 2
0sin
sin( )t
1 sinsin( )
nn
tt
nt = 0sin
sin( )
n
t
(4.12)
where t0 is the force acting on link just before entering drive sprocket i.e.
force acting on tight span. t1 is the force acting on link 1 and tn is the force
acting on nth link. Ф is the average pressure angle and α is the articulation
Ψ=54.90
0.254 4.51
88
angle (articulation angle = 360/numberof teeth). Substituting the values of t0,
ф and α (t0 =949 N, ф=18.90, α=27.690 in top gear) in the above Equation
(4.12) force acting on first link, while meshing drive sprocket teeth, becomes
t1 = 423 N. Similarly, forces acting on other links are calculated and average
value is taken for chain wear calculation. The average force acting on chain
links in drive sprocket, which contribute for critical angle wear is 686.07 N in
top gear. It may be noted that only two links contribute for critical angle of
movement in drive sprocket. Hence, average force on two links are taken.
By adopting the same procedure, force acting on links at driven
sprocket is calculated by substituting t0 =949 N, ф =23.70, α=90. The force
acting on first chain link while meshing with driven sprocket teeth is given by
t1 =706 N. Similarly, forces acting on other links are calculated and average
value is taken for chain wear calculation. The average force acting on chain
links in driven sprocket, which contribute for critical angle wear, is 513.07 N
in top gear. It may noted that unlike drive sprocket, the articulation movement
that contribute for critical angle movement is six links. Hence, average of
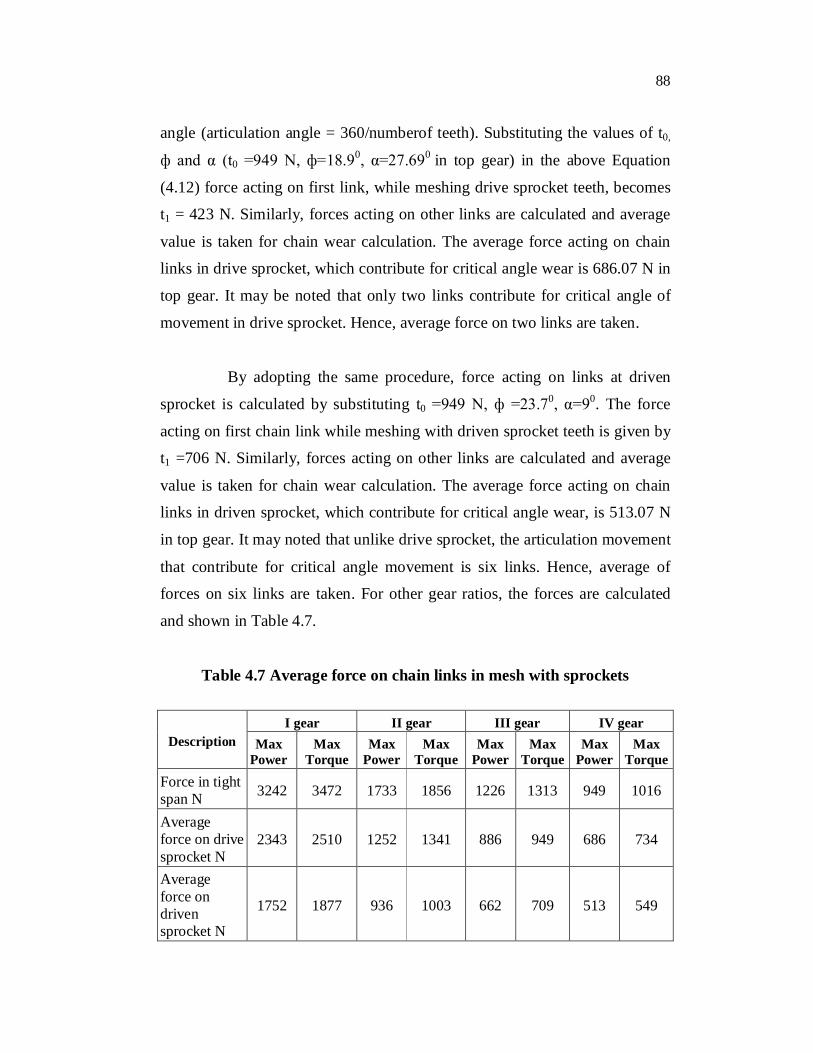
forces on six links are taken. For other gear ratios, the forces are calculated
and shown in Table 4.7.
Table 4.7 Average force on chain links in mesh with sprockets
Description I gear II gear III gear IV gear
Max Power
Max Torque
Max Power
Max Torque
Max Power
Max Torque
Max Power
Max Torque
Force in tight span N 3242 3472 1733 1856 1226 1313 949 1016
Average force on drive sprocket N
2343 2510 1252 1341 886 949 686 734
Average force on driven sprocket N
1752 1877 936 1003 662 709 513 549
89
4.5.3 Shrinkage Calculation
Chain bushes are assembled with inner link plates with interference
fit and this causes shrinkage of bushes at the ends due to elastic deformation.
The shrinkage causes pin bush contact at the shrunk portion during initial
usage of chains, which lead to quicker elongation. This phenomenon normally
occurs during running in period. If the shrunk depth is more, then elongation
will be more due to less pin bush contact and the corresponding distance
travelled by motorcycle during this period will be less. This leads to reduction
in total life of chain. The shrinkage depth can be reduced by reducing the
interference between pin and bush. But the reduction in interference can be
done to certain extent only beyond which it will cause bush rotation inside the
roller link plate and may lead to fatigue failure. Bearing this problem in mind,
it is proposed to modify the bush profile so that the pin bush contacts at the
ends are eliminated during initial stages. This leads to better pin bush
contacts, which lead to lower chain elongation.
Chain bushes are made either by curling operation or by forming
operation. In curled bushes, there is a closing seam and the circularity does
not match with that of solid bushes, which are mostly made from seamless
steel tubes. Also, during heat treatment, bushes get distorted due to thin wall
thickness and opens slightly due to expansion. On the other hand, plates are
punched and holes are shaved. During assembly of bushes with inner link
plates, because of distortion and seam opening, curled bushes may not
assemble properly as that of solid bushes. This causes non uniform shrinkage
of bushes that lead to improper contact of pins with bushes which cause non
uniform wear compare with seamless tube bushes.
90
However, due to cost constraints and that pin bush contact occurs
only in limited area due to articulation, curled bushes are still used in
automotive chain manufacturing. Non uniform pin bush contact is little
complicated and hence in this study uniform pin bush contact is assumed in
all chain links starting from 1st to nth links. Also, in this research work, the
shrinkage of bush is assumed to be uniform in all theoretical evaluations. The
above assumptions do not influence performance comparisons of existing
motorcycle chain and modified chain, since whatever the error that occur due
to non uniform shrinkage will be present in both the cases and hence get
nullified. Shrinkage value (Reshetov 1978) for existing chain bush as shown
in Figure 4.5 is calculated using Equations (4.13) and (4.14).
2 2 2 2
1 1 1 13 2 2
1 1 1
( ) ( )4 ( )
E b a c bP
b c a (4.13)
where, P-contact pressure in N/mm2 due to interference, E-Young’s modulus
in N/mm2, a1 - inner radius of bush in mm , b1 - outer radius of bush in mm,
c1 - outer radius of plate in mm, and -interference between bush and plate in
mm.
Shrinkage of bush 2
1 11 2 2
1 1
2( ) Pa baE b a
(4.14)
Substituting the value a1 = 2.275, b1 =3.15, c1 = 5.85, =0.05 and
E=2.12E05, shrinkage of bush at the ends is 0.0153 mm for nominal
interference value of 0.05 mm.
91
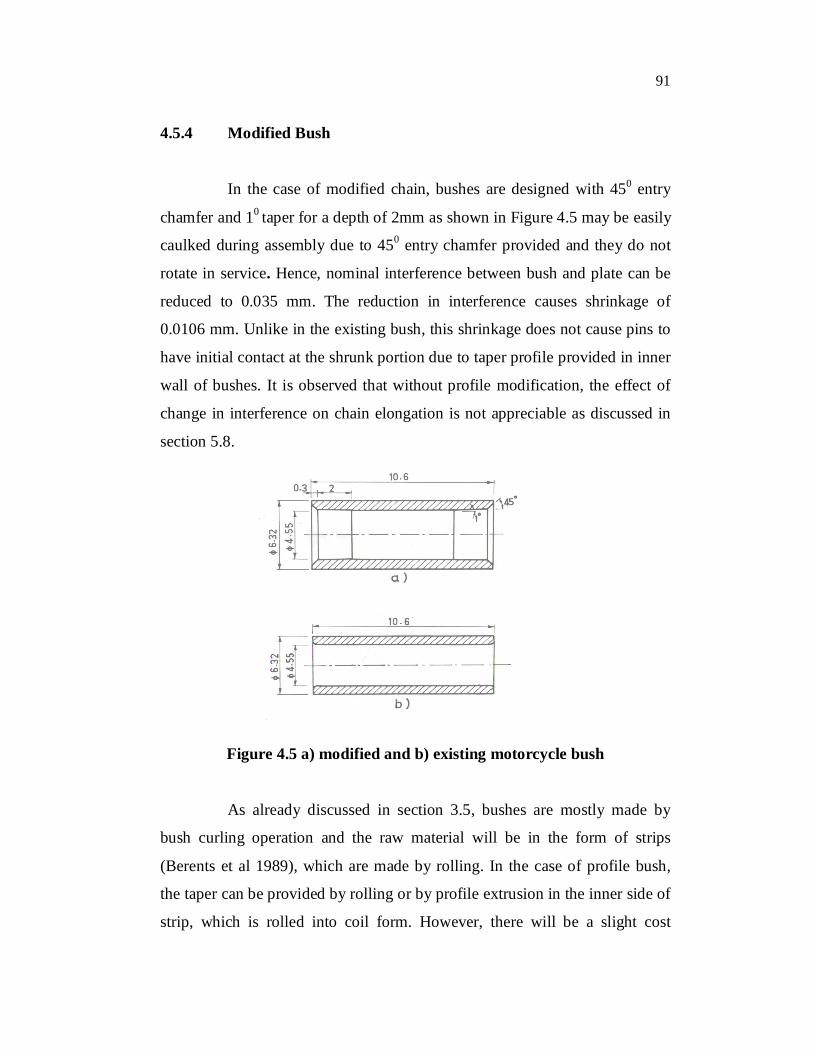
4.5.4 Modified Bush
In the case of modified chain, bushes are designed with 450 entry
chamfer and 10 taper for a depth of 2mm as shown in Figure 4.5 may be easily
caulked during assembly due to 450 entry chamfer provided and they do not
rotate in service. Hence, nominal interference between bush and plate can be
reduced to 0.035 mm. The reduction in interference causes shrinkage of
0.0106 mm. Unlike in the existing bush, this shrinkage does not cause pins to
have initial contact at the shrunk portion due to taper profile provided in inner
wall of bushes. It is observed that without profile modification, the effect of
change in interference on chain elongation is not appreciable as discussed in
section 5.8.
Figure 4.5 a) modified and b) existing motorcycle bush
As already discussed in section 3.5, bushes are mostly made by
bush curling operation and the raw material will be in the form of strips
(Berents et al 1989), which are made by rolling. In the case of profile bush,
the taper can be provided by rolling or by profile extrusion in the inner side of
strip, which is rolled into coil form. However, there will be a slight cost
92
l a
F F
difference while making profiled strip and it may not be appreciable. Hence,
the modified bush may be feasible to manufacture and easy to assemble and
caulked in chain assembly.
4.5.5 Pin Deflection
Maximum net power of engine is 5.5 kW at 7500 rpm. Gear over
all ratios is 10.97:1. Hence, speed of rear sprocket or rear wheel of motorcycle
is 683 rpm and the torque is 76.80 Nm. Pitch circle diameter of rear sprocket
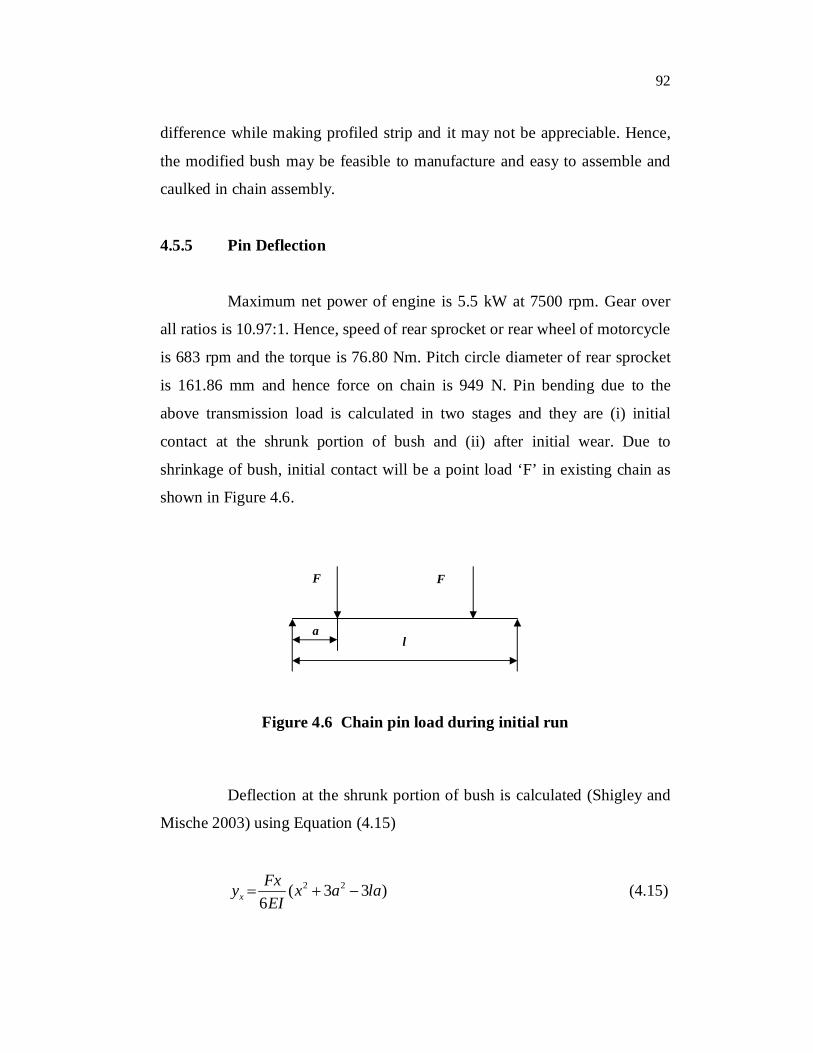
is 161.86 mm and hence force on chain is 949 N. Pin bending due to the
above transmission load is calculated in two stages and they are (i) initial
contact at the shrunk portion of bush and (ii) after initial wear. Due to
shrinkage of bush, initial contact will be a point load ‘F’ in existing chain as
shown in Figure 4.6.
Figure 4.6 Chain pin load during initial run
Deflection at the shrunk portion of bush is calculated (Shigley and
Mische 2003) using Equation (4.15)
2 2( 3 3 )6xFxy x a laEI
(4.15)
93
where, F = (Chain force / 2) = 474.5 N, ‘a’ distance between load centres of
inner and outer link plates - 1.6 mm, l - distance between load centres of outer
link plates - 13 mm, E - Youngs modulus - 2.12105 N/mm2, I - Moment of
innertia of pin.
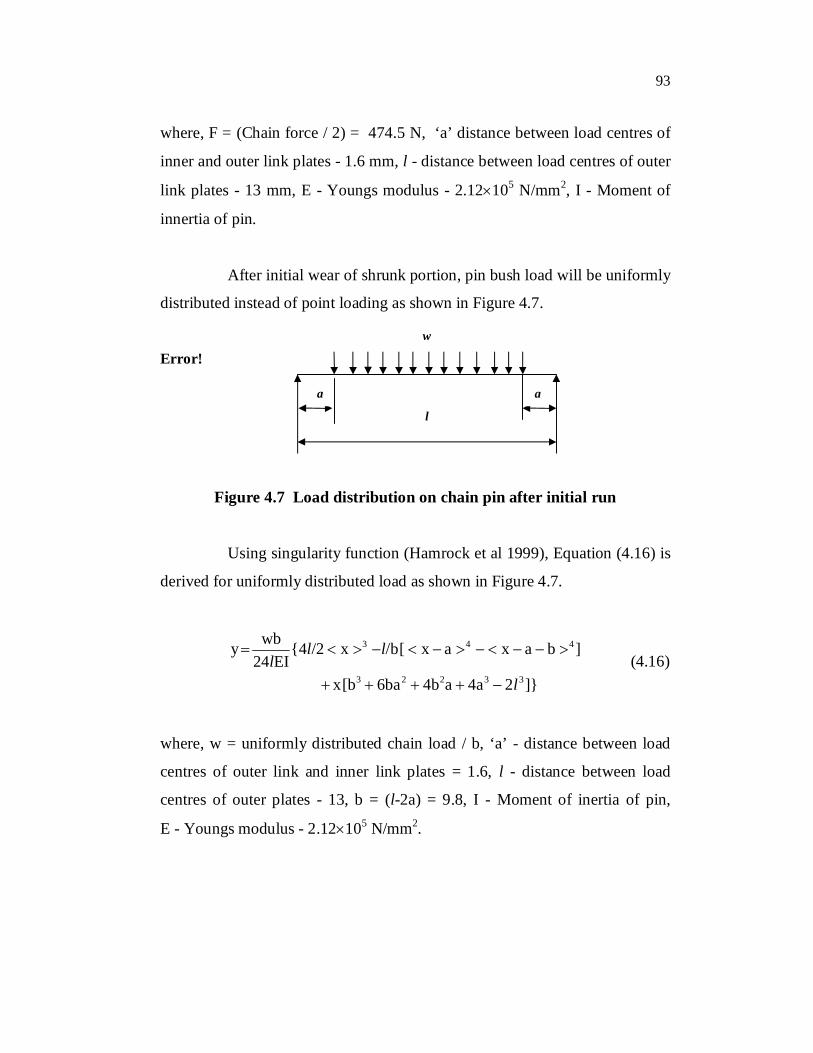
After initial wear of shrunk portion, pin bush load will be uniformly
distributed instead of point loading as shown in Figure 4.7.
Error!
Figure 4.7 Load distribution on chain pin after initial run
Using singularity function (Hamrock et al 1999), Equation (4.16) is
derived for uniformly distributed load as shown in Figure 4.7.
3 4 4
3 2 2 3 3
wby {4 /2 x /b[ x a x a b ]24 EI
x[b 6ba 4b a 4a 2 ]}
l ll
l
(4.16)
where, w = uniformly distributed chain load / b, ‘a’ - distance between load
centres of outer link and inner link plates = 1.6, l - distance between load
centres of outer plates - 13, b = (l-2a) = 9.8, I - Moment of inertia of pin,
E - Youngs modulus - 2.12105 N/mm2.
w
l
a a
94
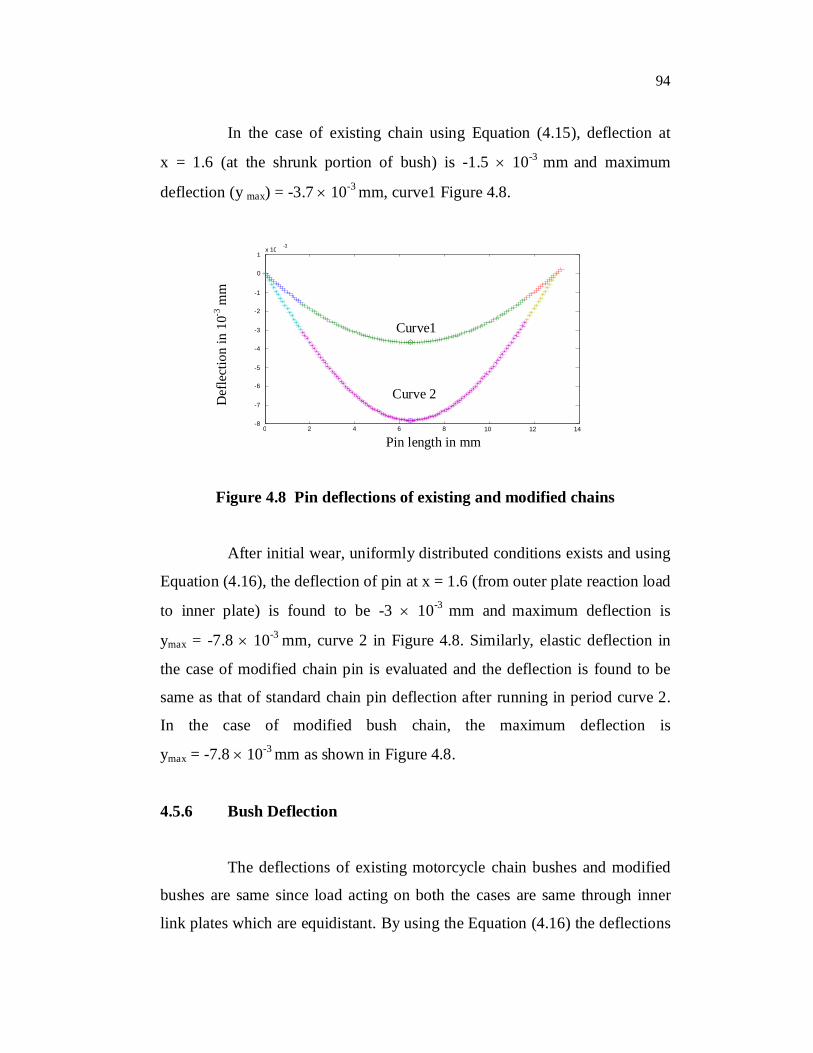
In the case of existing chain using Equation (4.15), deflection at
x = 1.6 (at the shrunk portion of bush) is -1.5 10-3 mm and maximum
deflection (y max) = -3.7 10-3 mm, curve1 Figure 4.8.
Figure 4.8 Pin deflections of existing and modified chains
After initial wear, uniformly distributed conditions exists and using
Equation (4.16), the deflection of pin at x = 1.6 (from outer plate reaction load
to inner plate) is found to be -3 10-3 mm and maximum deflection is
ymax = -7.8 10-3 mm, curve 2 in Figure 4.8. Similarly, elastic deflection in
the case of modified chain pin is evaluated and the deflection is found to be
same as that of standard chain pin deflection after running in period curve 2.
In the case of modified bush chain, the maximum deflection is
ymax = -7.8 10-3 mm as shown in Figure 4.8.
4.5.6 Bush Deflection
The deflections of existing motorcycle chain bushes and modified
bushes are same since load acting on both the cases are same through inner
link plates which are equidistant. By using the Equation (4.16) the deflections
0 2 4 6 8 10 12 14 -8
-7
-6
-5
-4
-3
-2
-1
0
1x 10 -3
Pin length in mm
Def
lect
ion
in 1
0-3 m
m
Curve1
Curve 2
95
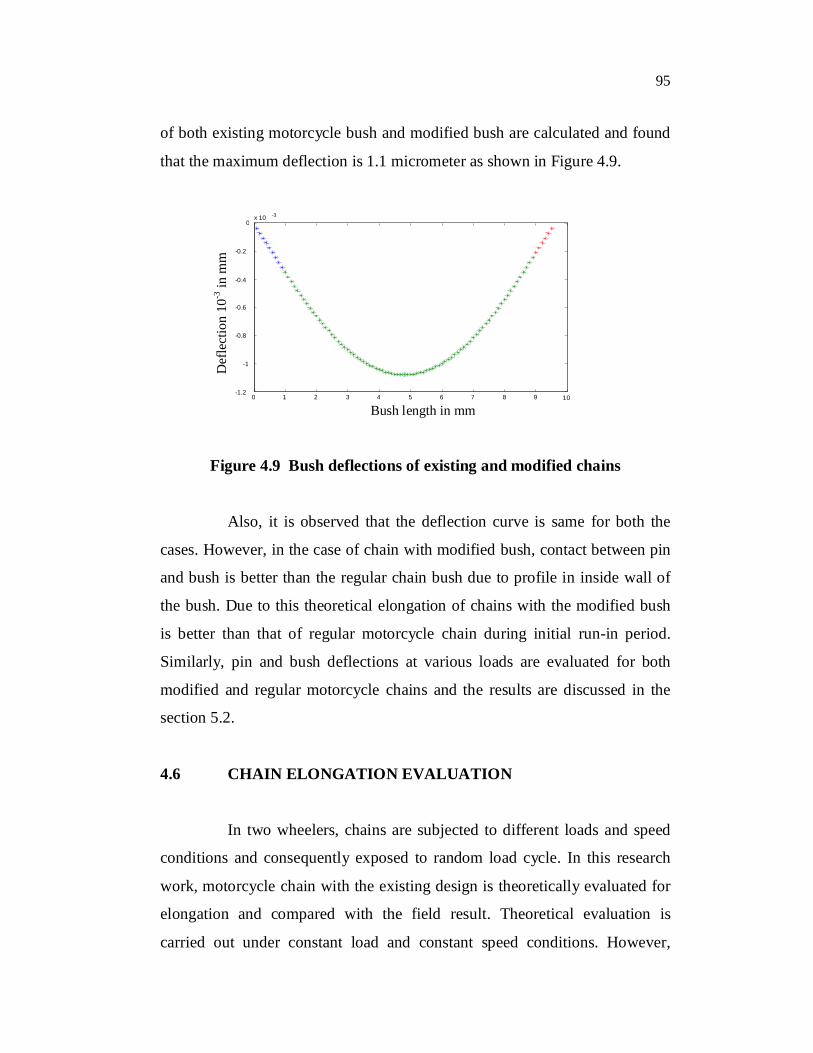
of both existing motorcycle bush and modified bush are calculated and found
that the maximum deflection is 1.1 micrometer as shown in Figure 4.9.
Figure 4.9 Bush deflections of existing and modified chains
Also, it is observed that the deflection curve is same for both the
cases. However, in the case of chain with modified bush, contact between pin
and bush is better than the regular chain bush due to profile in inside wall of
the bush. Due to this theoretical elongation of chains with the modified bush
is better than that of regular motorcycle chain during initial run-in period.
Similarly, pin and bush deflections at various loads are evaluated for both
modified and regular motorcycle chains and the results are discussed in the
section 5.2.
4.6 CHAIN ELONGATION EVALUATION
In two wheelers, chains are subjected to different loads and speed
conditions and consequently exposed to random load cycle. In this research
work, motorcycle chain with the existing design is theoretically evaluated for
elongation and compared with the field result. Theoretical evaluation is
carried out under constant load and constant speed conditions. However,
0 1 2 3 4 5 6 7 8 9 10-1.2
-1
-0.8
-0.6
-0.4
-0.2
0x 10 -3
Bush length in mm
Def
lect
ion
10-3
in m
m
96
chains which are used in motorcycles are subjected to variable load and that it
cannot be controlled since it purely depends on behaviour of drivers and the
nature of road conditions.
Due to different riding conditions and different nature of drivers,
there is no repeated pattern of loading. Therefore, it is difficult to simulate the
same conditions as experienced in the field. In low gears, chains are subjected
to higher forces and since wear is directly proportional to force acting on
chains, it will elongate faster compared with the chain subjected to low torque
in top gears. In order to study the effect of chain running from rest to top
speed, five fixed drive cycles are assumed as shown in Appendix 4 and the
elongation of chain is found using the wear model Equation (4.17) in each
case. In the theoretical evaluation of chain pin wear, yield value (Norton
2003) is taken as 1400 N/mm2 and any further increase in hardness will not
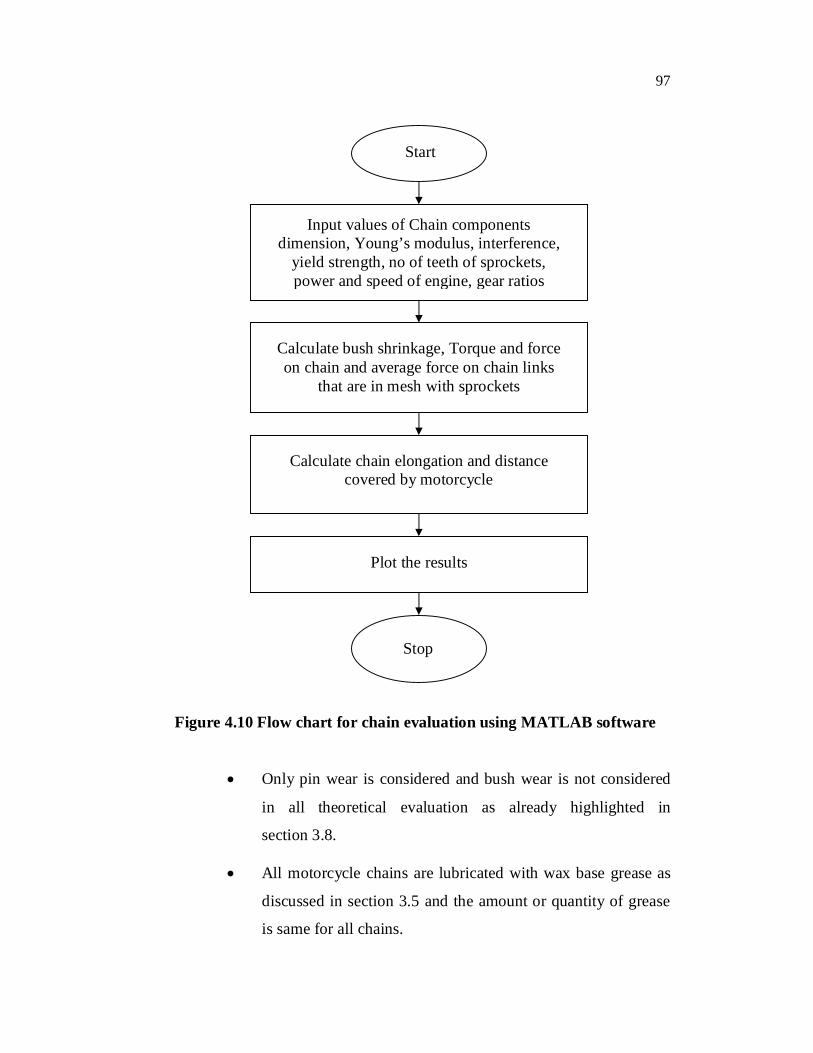
change the value drastically. The theoretical chain elongation is calculated
using MATLAB software as shown in the flow chart Figure 4.10.
4.6.1 List of Assumptions in Theoretical Evaluation
In theoretical evaluations it is assumed that bushes and plate
punched holes are having perfect circularity and the shrinkage
of bush is uniform.
Also, in chain assembly there is no twist and pitch variation.
There is no misalignment of chain and sprockets in
motorcycles.
The effect of pin bush surface finish is not considered and
assumed to be same in all theoretical elongation evaluation
comparisons.
97
Figure 4.10 Flow chart for chain evaluation using MATLAB software
Only pin wear is considered and bush wear is not considered
in all theoretical evaluation as already highlighted in
section 3.8.
All motorcycle chains are lubricated with wax base grease as
discussed in section 3.5 and the amount or quantity of grease
is same for all chains.
Start
Input values of Chain components dimension, Young’s modulus, interference,
yield strength, no of teeth of sprockets, power and speed of engine, gear ratios
Calculate bush shrinkage, Torque and force on chain and average force on chain links
that are in mesh with sprockets
Calculate chain elongation and distance covered by motorcycle
Plot the results
Stop
98
Effect of wear or deformation of sprocket tooth due to
excessive load is not considered.
The effect of dimensional accuracy level and geometrical
accuracy level of chain components are not considered and
assumed to be same in all theoretical evaluation.
Influence of only one variable is considered at a time among
the following variables already mentioned in section 3.7 viz.
load acting on chains, bearing area, yield strength based on
hardness, sliding distance and lubrication.
The effect of roller wear and roller impact on sprocket tooth is
not considered in the theoretical investigation.
Load distribution on bush through rollers from sprocket teeth
is assumed to be uniform. Skew in chain assembly and
misalignment of sprockets lead to non uniform load
distribution.
Since all motorcycles chains are preloaded to 1/3rd of breaking
load which is around 6000 N, the effect of extension of pitch
of plates and possible enlargement of holes due to excessive
load is not considered since maximum transmission load
acting on chain is 3472 N which acts for a short duration and
is within the preload value.
4.6.2 Theoretical Elongation Performance Evaluation of Motorcycle
Chain
In the case of existing chain, due to shrinkage of bush and elastic
bending of pin, contact area between pin and bush will be less during initial
running in period and hence wear will be higher, even though chains run with
99
lubrication done by manufacturers before packing. Pin wear is calculated
based on Archard’s adhesive wear model (Collins 2003). Initial wear is
calculated up to the shrinkage value of bush, beyond which, the contacts
between pin and bush increases to a maximum value. During initial wear
period, adhesive wear model is taken and later due to entrapment of worn out
particles from bushes as well as from pins to the grease, the wear
characteristics will change.
The following assumptions are made for evaluating the chain
performance. Total elongation percentage is divided into four stages as
already mentioned in section 3.8 and they are 1) Initial run 2) elongation upto
1% plus initial run percentage 3) upto 2% and 4) upto 2.8%. During initial
running in period, the coefficient of wear K is taken as 3 10-6. After running
in period, due to worn out particles that might get mixed with grease
lubricant, coefficient K is taken as 4.2 10-5 in stage two. Wear coefficient
K value is taken as 9 10-5 in stage three after 1% of chain elongation since
more worn out particles would be present in the grease. Finally, after 2%
elongation, K value is taken as 1.5 10-5 in stage four, since grease would
have lost its properties due to large quantities of worn out particles and the
wear system would be almost like abrasive wear condition.
Since, pin on disk wear method will not represent the similar
conditions of transmission chain with initial lubricated condition; it will be
difficult to find the wear coefficients in laboratory. Hence, the above four
wear coefficients are assumed as intermediate values of wear coefficients
which are taken from various test results reported by different researchers
(Table 4.8) (Collins 2003). It is to be noted that in all theoretical evaluations,
the above assumptions are maintained same in order to study the effect of
influence of one variable on chain elongation on comparison basis. The
100
equation for abrasive wear conditions is similar to that of adhesive wear
except change in wear coefficient.
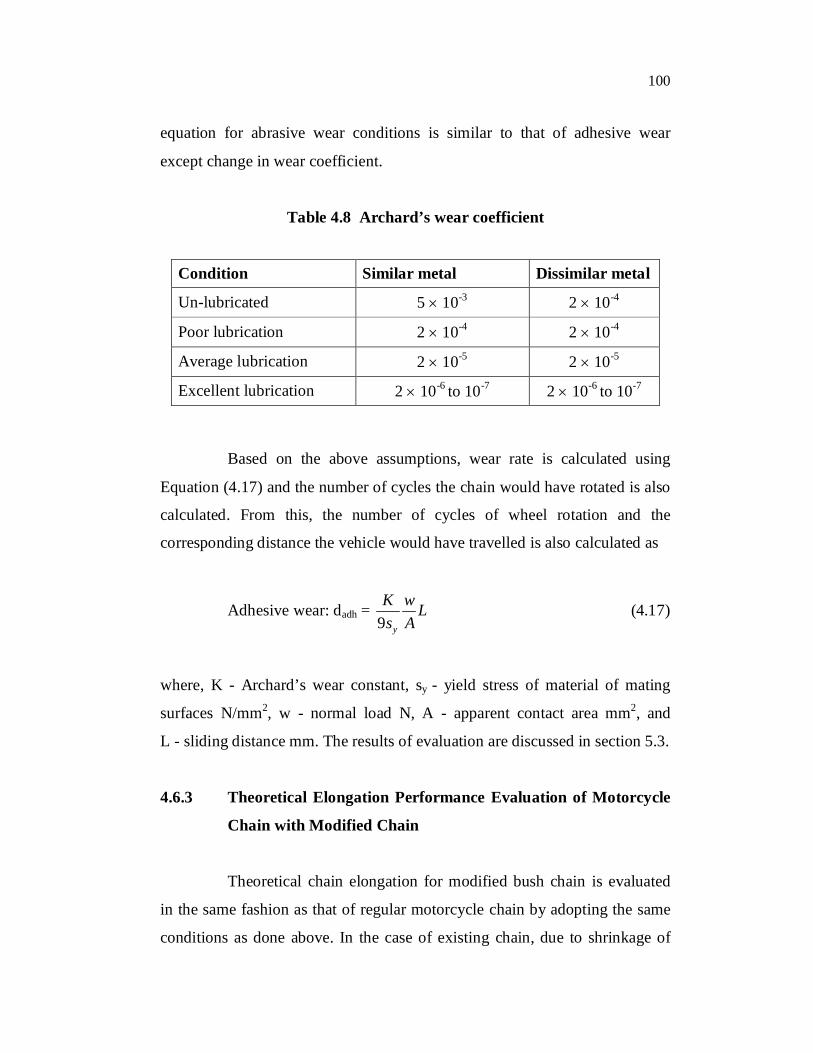
Table 4.8 Archard’s wear coefficient
Condition Similar metal Dissimilar metal
Un-lubricated 5 10-3 2 10-4
Poor lubrication 2 10-4 2 10-4
Average lubrication 2 10-5 2 10-5
Excellent lubrication 2 10-6 to 10-7
2 10-6 to 10-7
Based on the above assumptions, wear rate is calculated using
Equation (4.17) and the number of cycles the chain would have rotated is also
calculated. From this, the number of cycles of wheel rotation and the
corresponding distance the vehicle would have travelled is also calculated as
Adhesive wear: dadh = 9 y
K w Ls A
(4.17)
where, K - Archard’s wear constant, sy - yield stress of material of mating
surfaces N/mm2, w - normal load N, A - apparent contact area mm2, and
L - sliding distance mm. The results of evaluation are discussed in section 5.3.
4.6.3 Theoretical Elongation Performance Evaluation of Motorcycle
Chain with Modified Chain
Theoretical chain elongation for modified bush chain is evaluated
in the same fashion as that of regular motorcycle chain by adopting the same
conditions as done above. In the case of existing chain, due to shrinkage of
101
bush and elastic bending of pin, contact area between pin and bush will be
less during initial running in period whereas in the case of modified chain this
phenomenon is eliminated due to profile in bush and less interference adopted
due to bush riveting. It is to be noted that bush riveting neither permits
rotation of bush nor lateral movements. All parameters like Archard’s wear
coefficient, yield stress of pins, articulation distance etc are maintained same
as that of regular motorcycle chain. Only, one parameter that differs from the
existing chain is bush profile in modified chain as already discussed. Since,
assumed values are same for both the cases, the influence of errors in assumed
values do not affect the results which are compared. The effect of circularity
of bush for standard and modified chain is not considered as already discussed
in section 4.6.1.
4.6.4 Theoretical Elongation Performance Evaluation of Motorcycle
Chain with Modified Chain with Increased Grease Content
In this case, due to entry chamfer provided in the bush, the wax
base grease upon heating to around 1200C would melt and easily flow into the
pin bush clearance avoiding possible air pockets during chain lubrication in
the manufacturing stage or in service. Hence, it is assumed that the lubrication
may be better due to increased penetration of grease in the case of modified
bush chain. In order to find out the elongation trend due to this phenomenon,
which has to be verified by conducting practical test, it is assumed that if
there could be 10 to 20% improvement due to increased grease content, it will
be beneficial for chain life improvement. As a step to understand the
improvement in penetration of grease, by assuming 20% improvement in
lubrication, theoretical chain elongation is made and compared with existing
motorcycle chain. The results are discussed in section 5.5.1.
102
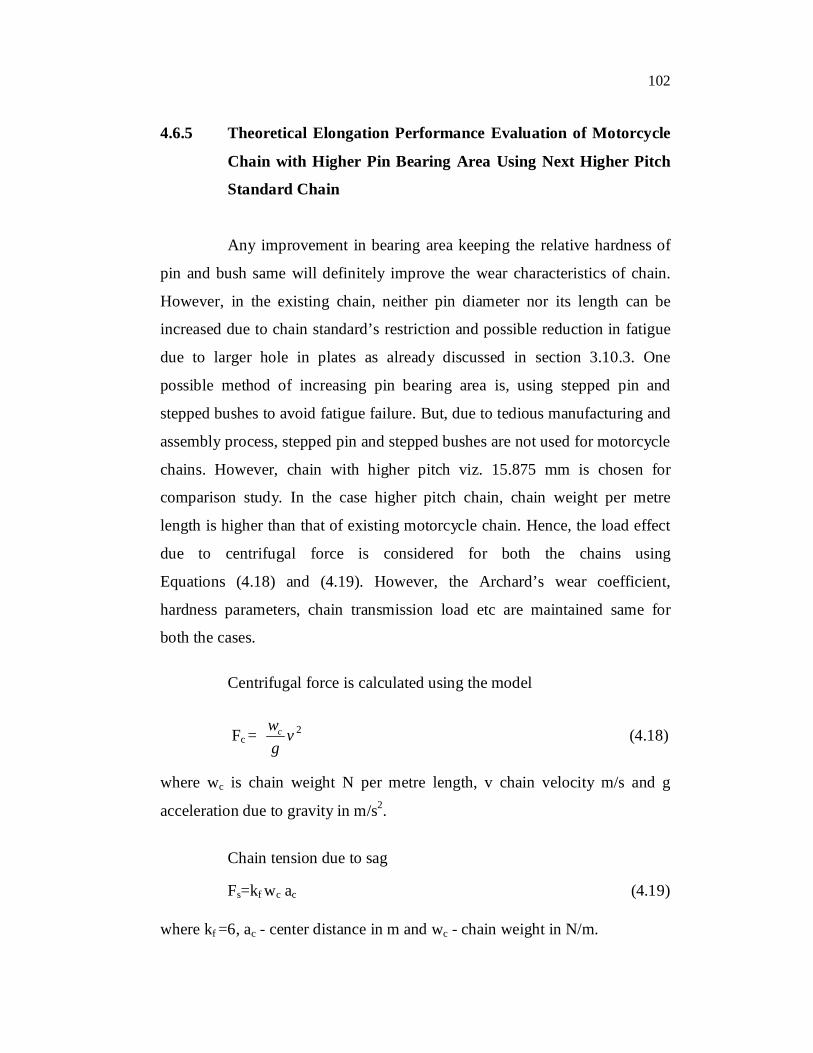
4.6.5 Theoretical Elongation Performance Evaluation of Motorcycle
Chain with Higher Pin Bearing Area Using Next Higher Pitch
Standard Chain
Any improvement in bearing area keeping the relative hardness of
pin and bush same will definitely improve the wear characteristics of chain.
However, in the existing chain, neither pin diameter nor its length can be
increased due to chain standard’s restriction and possible reduction in fatigue
due to larger hole in plates as already discussed in section 3.10.3. One
possible method of increasing pin bearing area is, using stepped pin and
stepped bushes to avoid fatigue failure. But, due to tedious manufacturing and
assembly process, stepped pin and stepped bushes are not used for motorcycle
chains. However, chain with higher pitch viz. 15.875 mm is chosen for
comparison study. In the case higher pitch chain, chain weight per metre
length is higher than that of existing motorcycle chain. Hence, the load effect
due to centrifugal force is considered for both the chains using
Equations (4.18) and (4.19). However, the Archard’s wear coefficient,
hardness parameters, chain transmission load etc are maintained same for
both the cases.
Centrifugal force is calculated using the model
Fc = cw vg
2 (4.18)
where wc is chain weight N per metre length, v chain velocity m/s and g
acceleration due to gravity in m/s2.
Chain tension due to sag
Fs=kf wc ac (4.19)
where kf =6, ac - center distance in m and wc - chain weight in N/m.
103
Total tension in driving side of chain=driving force+ Fc+ Fs
(Reshetov 1978). The results of the evaluation are discussed in section 5.6.
4.6.6 Theoretical Elongation Performance Evaluation of Motorcycle
Chain Under Fluctuating Loads
Theoretical chain elongation under steady load condition may be
easier to evaluate for performance comparison. Any change in design or
dimensional or surface characteristics can be compared easily for performance
level. However, it will not closely agree with chains that are used in field due
to fluctuation in loads. Simulating exact conditions for theoretical evaluation
will be arduous task. In order to study the effect of fluctuating load, ‘n’
number of fixed drive cycles may be assumed keeping all other variables
constant except chain forces. It requires lot of computing time. Hence, to
understand the effect of fluctuation in speeds, five drive cycles are assumed as
shown in Appendix 4 to study the characteristics of elongation on existing
chains and the results are discussed in section 5.7.
4.6.7 Elongation Performance of Field Chain
To study existing chain performance in field, initially about
25 motorcycles of brand B of 100cc category is chosen, which are being used
in the local city and are being serviced in a service centre. Of the
25 motorcycle chosen, only 16 motorcycle reading could be taken properly. In
the other remaining nine vehicles, results were discarded due to faulty meter
and/or could not track proper service records. Here, the chain elongation is
found by measuring chain at every 10 pitches using vernier scale and the
difference in elongation value is noted from the initial nominal value of
127 mm for 10 pitches and the percentage elongation is calculated. The
corresponding distance travelled as indicated by odometers is noted and the
104
results are tabulated as shown in Appendix 5. Also, a plot is made and the
results are discussed in section 5.4.
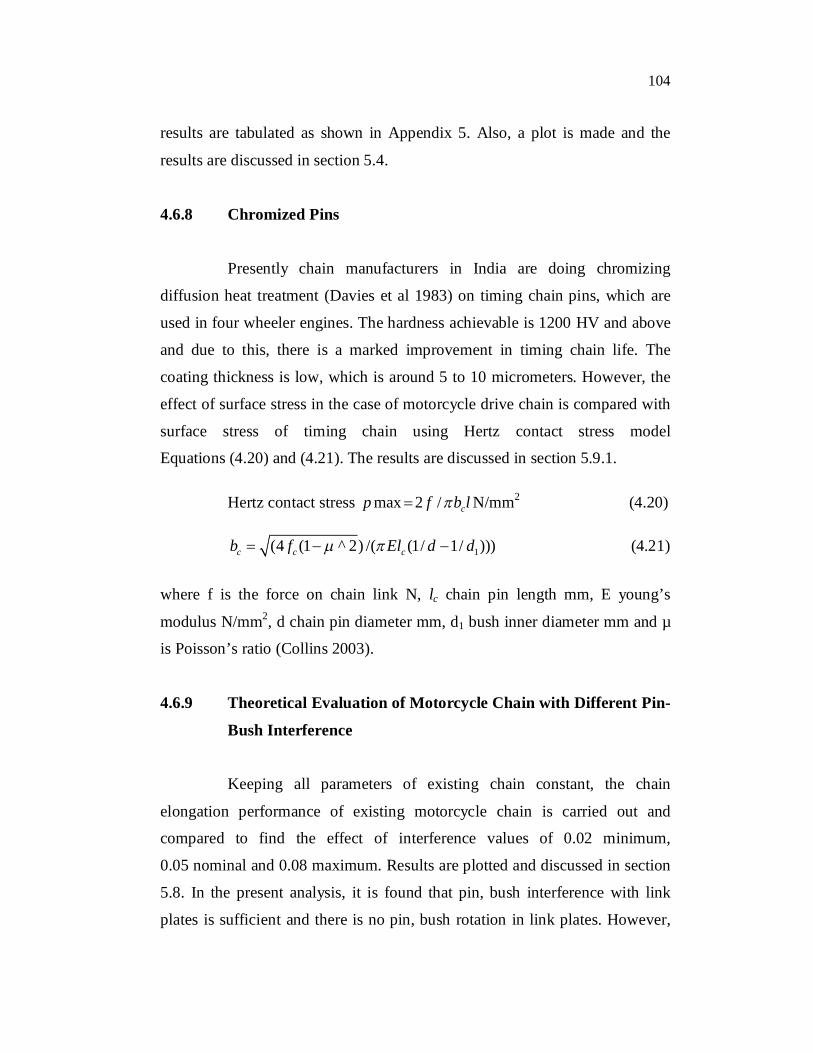
4.6.8 Chromized Pins
Presently chain manufacturers in India are doing chromizing
diffusion heat treatment (Davies et al 1983) on timing chain pins, which are
used in four wheeler engines. The hardness achievable is 1200 HV and above
and due to this, there is a marked improvement in timing chain life. The
coating thickness is low, which is around 5 to 10 micrometers. However, the
effect of surface stress in the case of motorcycle drive chain is compared with
surface stress of timing chain using Hertz contact stress model
Equations (4.20) and (4.21). The results are discussed in section 5.9.1.
Hertz contact stress max 2 / cp f b l N/mm2 (4.20)
1(4 (1 ^ 2) /( (1/ 1/ )))c c cb f El d d (4.21)
where f is the force on chain link N, lc chain pin length mm, E young’s
modulus N/mm2, d chain pin diameter mm, d1 bush inner diameter mm and µ
is Poisson’s ratio (Collins 2003).
4.6.9 Theoretical Evaluation of Motorcycle Chain with Different Pin-
Bush Interference
Keeping all parameters of existing chain constant, the chain
elongation performance of existing motorcycle chain is carried out and
compared to find the effect of interference values of 0.02 minimum,
0.05 nominal and 0.08 maximum. Results are plotted and discussed in section
5.8. In the present analysis, it is found that pin, bush interference with link
plates is sufficient and there is no pin, bush rotation in link plates. However,
105
at minimum interference value there is a possibility of bush rotation within
the plate hole that may cause failure of chain. Hence, it is not advisable to use
very low interference.
4.6.10 Theoretical Evaluation of Motorcycle Chain with Different Pin Hardness
In order to find the effects of hardness of pins, a comparative study
is made with four different hardness levels (800 N/mm2, 1000 N/mm2,
1200 N/mm2 and 1400 N/mm2 equivalent yield values) keeping all parameters
unchanged and the results are plotted and discussed in section 5.9.
4.7 MODAL ANALYSIS
Modal analysis is used to determine the vibration characteristics
(natural frequencies and mode shapes) of a structure or a machine component
while it is being designed. The natural frequencies and mode shapes are
important parameters in the design of a structure for dynamic load
consideration. They are also required for a spectrum analysis or a mode
superposition harmonic or transient analysis. Modal analysis in the
ANSYS is a linear analysis. Any nonlinearity, such as plasticity and contact
(gap) elements, are ignored even if they are defined. Several mode extraction
methods are used in ANSYS modal analysis. The various methods to
determine the mode shapes are as follows:
Block Lanczos (default) Method
Subspace Method
Power Dynamics Method
Reduced Method
Unsymmetrical Method
Damped Method
106
4.7.1 Procedure for Modal Analysis
1. Build the model.
2. Apply loads and obtain the solution.
3. Expand the modes.
4. Review the results.
4.7.2 Build the Model
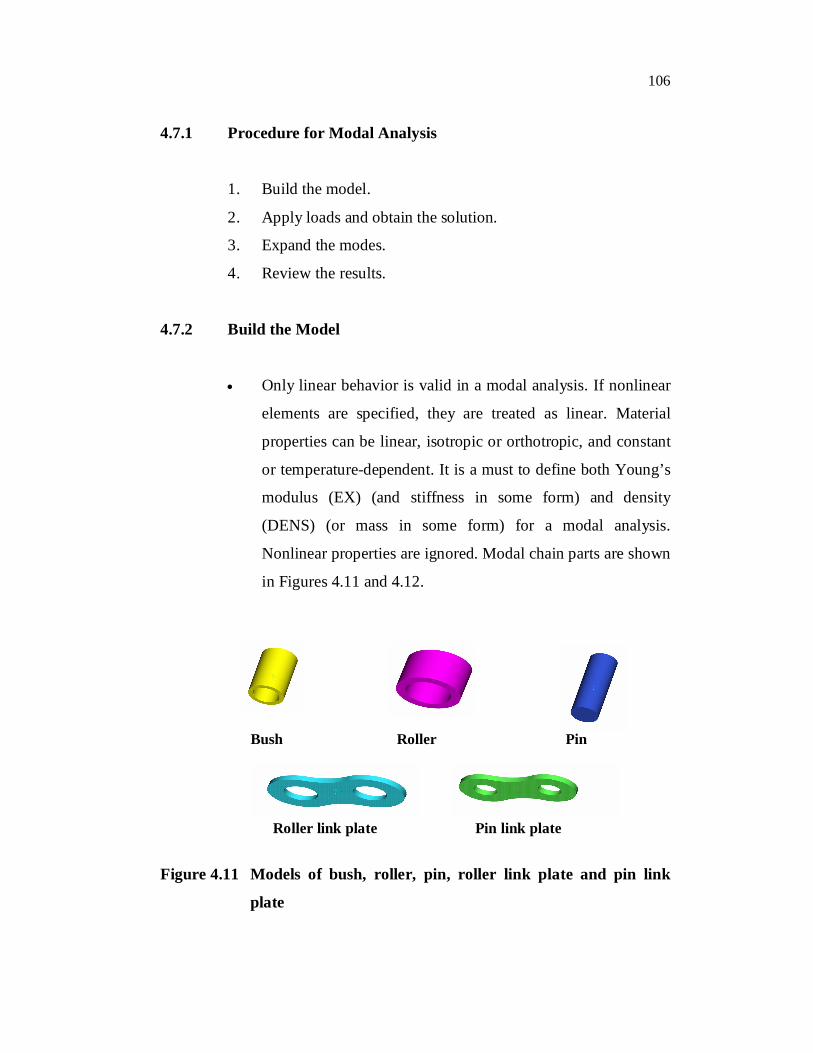
Only linear behavior is valid in a modal analysis. If nonlinear
elements are specified, they are treated as linear. Material
properties can be linear, isotropic or orthotropic, and constant
or temperature-dependent. It is a must to define both Young’s
modulus (EX) (and stiffness in some form) and density
(DENS) (or mass in some form) for a modal analysis.
Nonlinear properties are ignored. Modal chain parts are shown
in Figures 4.11 and 4.12.
Bush Roller Pin
Roller link plate Pin link plate
Figure 4.11 Models of bush, roller, pin, roller link plate and pin link
plate
107
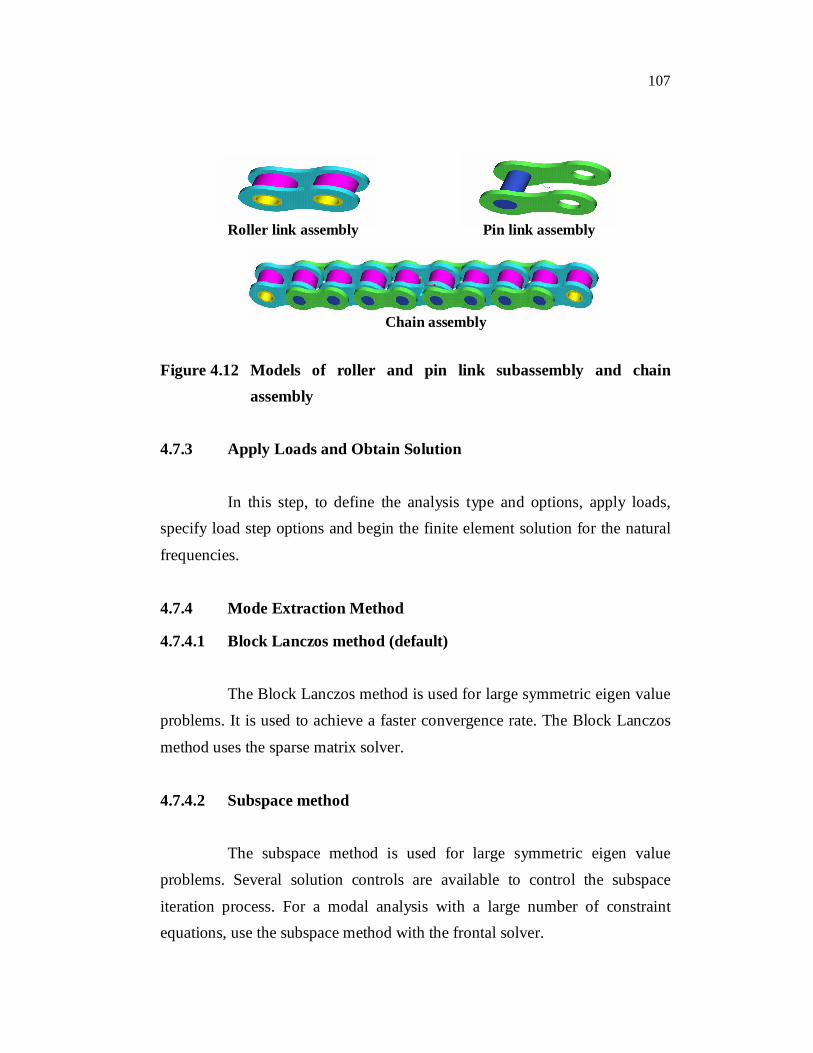
Roller link assembly Pin link assembly Chain assembly
Figure 4.12 Models of roller and pin link subassembly and chain assembly
4.7.3 Apply Loads and Obtain Solution
In this step, to define the analysis type and options, apply loads, specify load step options and begin the finite element solution for the natural
frequencies.
4.7.4 Mode Extraction Method
4.7.4.1 Block Lanczos method (default) The Block Lanczos method is used for large symmetric eigen value problems. It is used to achieve a faster convergence rate. The Block Lanczos
method uses the sparse matrix solver.
4.7.4.2 Subspace method The subspace method is used for large symmetric eigen value problems. Several solution controls are available to control the subspace
iteration process. For a modal analysis with a large number of constraint equations, use the subspace method with the frontal solver.
108
4.7.4.3 Power dynamics method The Power Dynamics method is used for very large models (100,000 + DOFs) and is especially useful to obtain a solution for the first several modes to learn how the model will behave.
4.7.4.4 Reduced (House holder) method The reduced method is faster than the subspace method because it
uses reduced (condensed) system matrices to calculate the solution. However, it is less accurate because the reduced mass matrix is approximate.
4.7.4.5 Unsymmetric method
The unsymmetric method is used for problems with un-symmetric
matrices, such as fluid-structure interaction problems.
4.7.4.6 Damped method
The damped method is used for problems where damping cannot be
ignored, such as bearing problems.
4.7.4.7 QR damped method
The QR damped method is faster and achieves better calculation
efficiency than the damped method. It uses the reduced modal damped matrix
to calculate complex damped frequencies in modal coordinates.
109
4.8 HARMONIC ANALYSIS
Harmonic response analysis is a technique used to determine the
steady-state response of a linear structure to loads that vary sinusoidally
(harmonically) with time. The idea is to calculate the structure's response at
several frequencies and obtain a display of some response quantity (usually
displacements) versus frequency. "Peak" responses are then identified and
stresses reviewed at those peak frequencies. This analysis technique calculates
only the steady-state, forced vibrations of a structure. The transient vibrations,
which occur at the beginning of the excitation, are not accounted for in a
harmonic response analysis. Any sustained cyclic load will produce a
sustained cyclic response (a harmonic response) in a structural system.
Harmonic response analysis gives the ability to predict the sustained dynamic
behavior of the structures, thus enabling to verify whether or not the designs
will successfully overcome resonance, fatigue, and other harmful effects of
vibrations.
Harmonic response analysis is a linear analysis. Any nonlinearity,
such as plasticity and contact (gap) elements, will be ignored, even if they are
defined. However, they have unsymmetric system matrices such as those
encountered in a fluid-structure interaction problem. Harmonic analysis can
also be performed on a pre stressed structure, such as a violin string
(assuming the harmonic stresses are much smaller than the pretension stress).
A harmonic analysis, by definition, assumes that any applied load
varies harmonically (sinusoidally) with time. To completely specify a
harmonic load, three pieces of information are usually required: the
amplitude, the phase angle, and the forcing frequency range.
110
The amplitude is the maximum value of the load.
The phase angle is a measure of the time, by which, the load
lags (or leads) a frame of reference.
The forcing frequency range is the frequency range of the
harmonic load (in cycles/time).
4.8.1 Steps in Harmonic Analysis
Step 1: Create the model
Step 2: Selected the element type and material properties
Step 3: Meshing
Step 4: Apply the Boundary conditions
Step 5: Set the frequency range and number of sub steps to be
extracted
Step 6: Solve and obtain the solution
Step 7: Plot the graph, Frequency Vs Deflection.
4.8.2 Three Solution Methods
Three harmonic response analysis methods are available. They are
Full Method, Reduced Method, Mode Superposition Method (A fourth,
relatively expensive method is to do a transient dynamic analysis with the
harmonic loads specified as time-history loading functions).
4.8.3 Full Method
The full method is the easiest of the three methods. It uses the full
system matrices to calculate the harmonic response (no matrix reduction). The
111
matrices may be symmetric or unsymmetric. The advantages of the full
method are:
It is easy to use, because it provides freedom for choosing
master degrees of freedom or mode shapes.
It uses full matrices, so no mass matrix approximation is
involved.
It allows unsymmetric matrices, which are typical of such
applications as acoustics and bearing problems.
It calculates all displacements and stresses in a single pass.
It accepts all types of loads: nodal forces imposed (nonzero)
displacements, and element loads (pressures and
temperatures).
4.8.4 Reduced Method
The reduced method enables to condense the problem size by using
master degrees of freedom and reduced matrices. After the displacements at
the master DOF have been calculated, the solution can be expanded to the
original full DOF set. The advantages of this method are:
It is faster and less expensive compared to the full method
when using the frontal solver.
Pre-stressing effects can be included.
4.8.5 Mode Superposition Method
The mode superposition method sums factored mode shapes
(eigenvectors) from a modal analysis to calculate the structure's response. Its
advantages are:
112
It is faster and less expensive than either the reduced or the
full method for many problems.
Element loads applied in the preceding modal analysis can be
applied in the harmonic response analysis.
It allows solutions to be clustered about the structure's natural
frequencies. This results in a smoother, more accurate tracing
of the response curve.
Pre-stressing effects can be included.
All three methods are subject to certain common restrictions:
All loads must be sinusoidally time-varying.
All loads must have the same frequency.
No nonlinearities are permitted.
Transient effects are not calculated.
4.8.6 Build the Model
Only linear behavior is valid in a harmonic response analysis.
Nonlinear elements, if any, will be treated as linear elements.
Both Young’s modulus (EX) and density (DENS) must be
defined. Material properties may be linear, isotropic or
orthotropic, and constant or temperature-dependent. Nonlinear
material properties, if any, are ignored.
4.9 FATIGUE EVALUATION
Roller braking is mainly due to impact of rollers with sprocket
tooth flank especially at high speeds. Roller fatigue strength is calculated
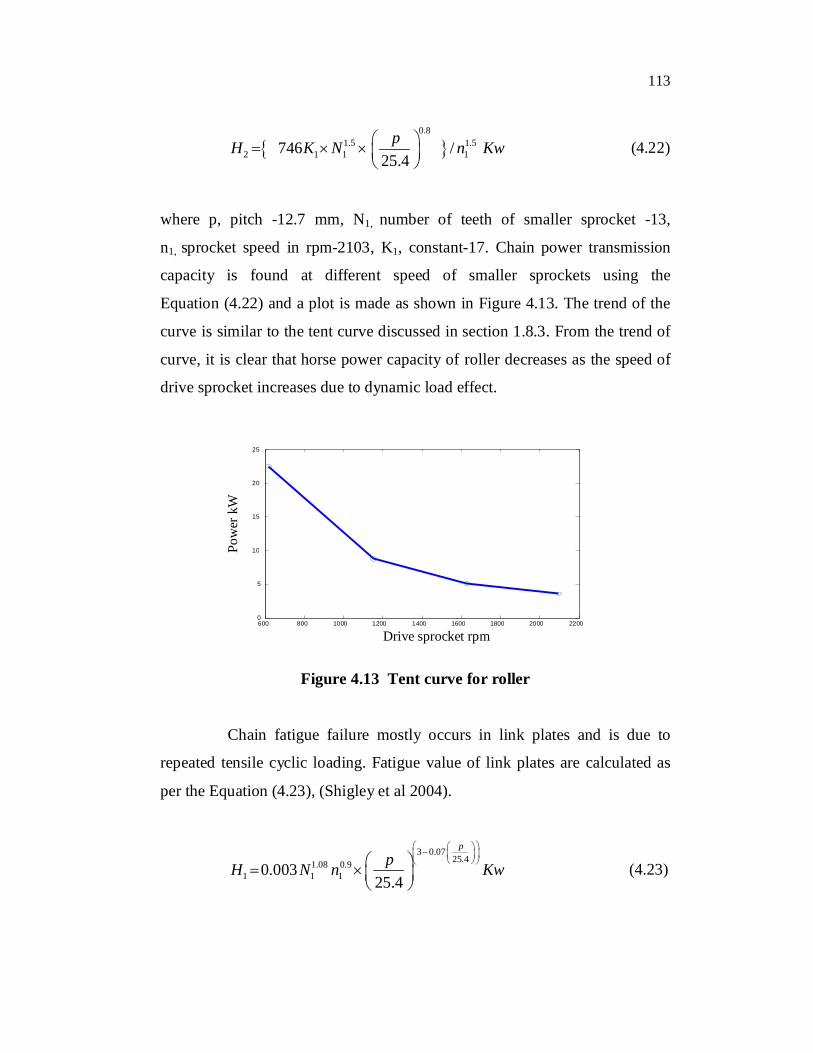
based on the following Equation (4.22), (Shigley et al 2004).
113
0.8
1.5 1.52 1 1 1746 /
25.4pH K N n Kw
(4.22)
where p, pitch -12.7 mm, N1, number of teeth of smaller sprocket -13,
n1, sprocket speed in rpm-2103, K1, constant-17. Chain power transmission
capacity is found at different speed of smaller sprockets using the
Equation (4.22) and a plot is made as shown in Figure 4.13. The trend of the
curve is similar to the tent curve discussed in section 1.8.3. From the trend of
curve, it is clear that horse power capacity of roller decreases as the speed of
drive sprocket increases due to dynamic load effect.
Figure 4.13 Tent curve for roller
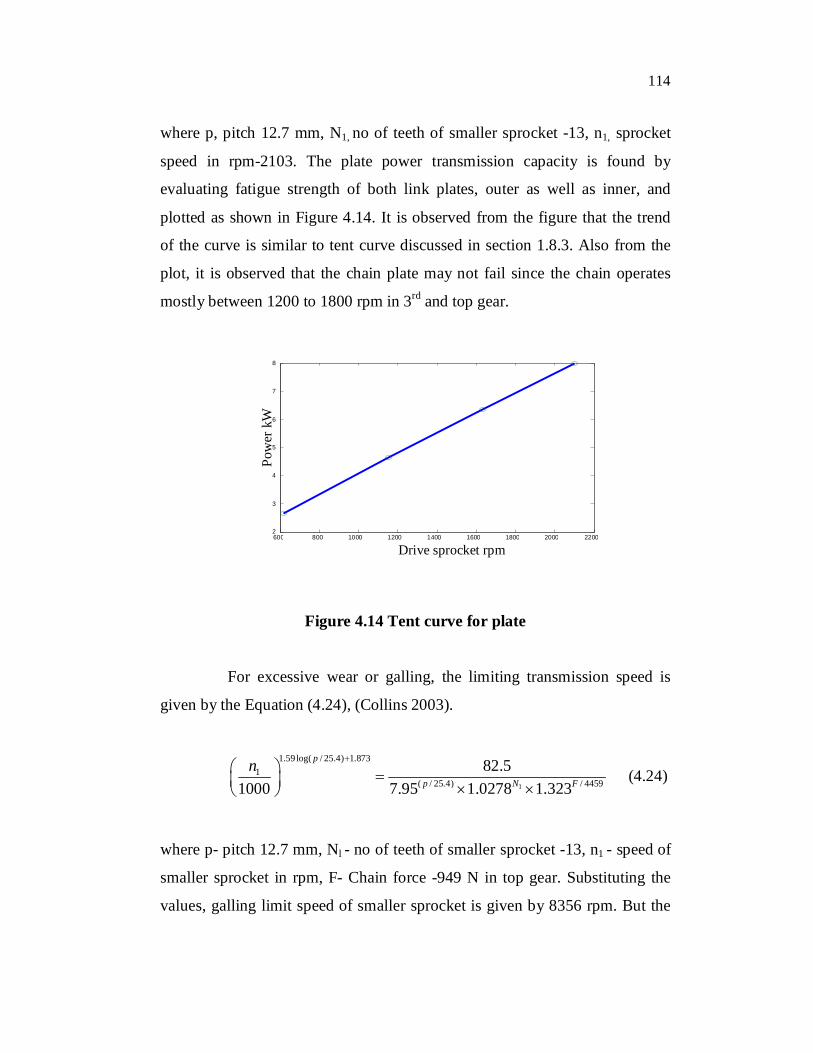
Chain fatigue failure mostly occurs in link plates and is due to
repeated tensile cyclic loading. Fatigue value of link plates are calculated as
per the Equation (4.23), (Shigley et al 2004).
3 0.07
25.41.08 0.91 1 10.003
25.4
ppH N n Kw
(4.23)
600 800 1000 1200 1400 1600 1800 2000 22000
5
10
15
20
25
Drive sprocket rpm
Pow
er k
W
114
where p, pitch 12.7 mm, N1, no of teeth of smaller sprocket -13, n1, sprocket
speed in rpm-2103. The plate power transmission capacity is found by
evaluating fatigue strength of both link plates, outer as well as inner, and
plotted as shown in Figure 4.14. It is observed from the figure that the trend
of the curve is similar to tent curve discussed in section 1.8.3. Also from the
plot, it is observed that the chain plate may not fail since the chain operates
mostly between 1200 to 1800 rpm in 3rd and top gear.
Figure 4.14 Tent curve for plate
For excessive wear or galling, the limiting transmission speed is
given by the Equation (4.24), (Collins 2003).
1
1.59log( / 25.4) 1.8731
( / 25.4) / 4459
82.51000 7.95 1.0278 1.323
p
Np F
n
(4.24)
where p- pitch 12.7 mm, Nl - no of teeth of smaller sprocket -13, n1 - speed of
smaller sprocket in rpm, F- Chain force -949 N in top gear. Substituting the
values, galling limit speed of smaller sprocket is given by 8356 rpm. But the
600 800 1000 1200 1400 1600 1800 2000 22002
3
4
5
6
7
8
Drive sprocket rpm
Pow
er k
W
115
maximum speed of small sprocket is 2103 rpm. Hence, the chain is safe under
galling condition.
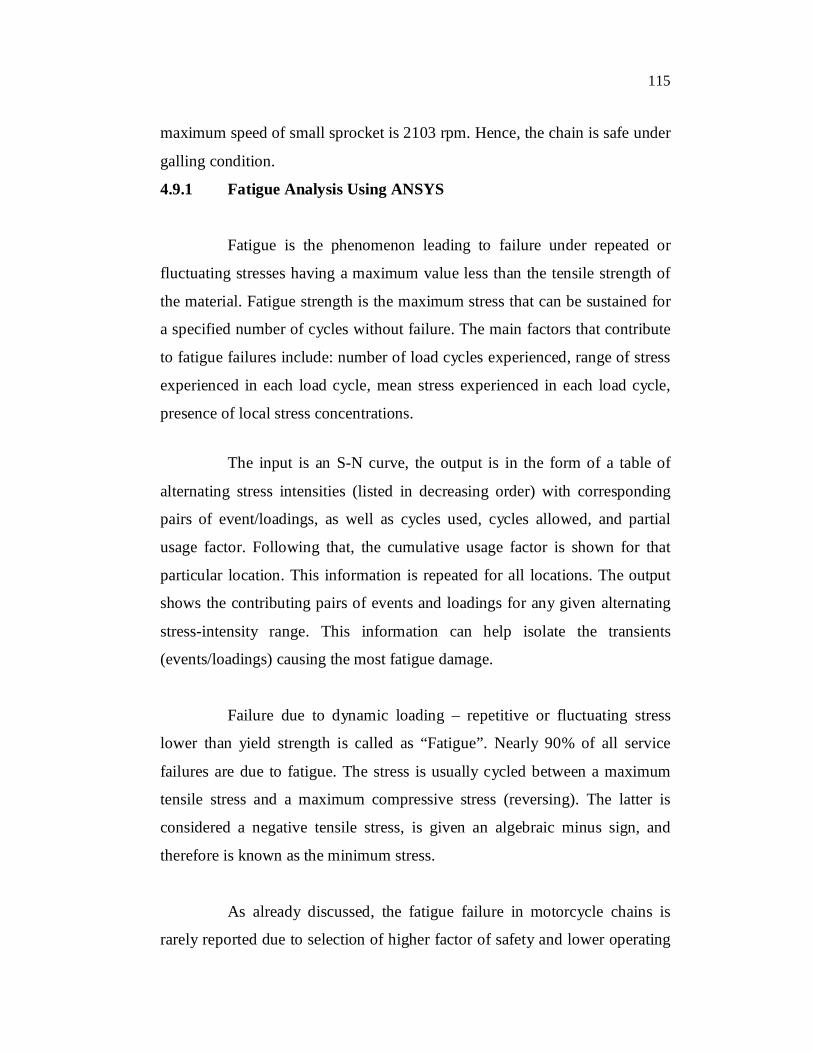
4.9.1 Fatigue Analysis Using ANSYS
Fatigue is the phenomenon leading to failure under repeated or
fluctuating stresses having a maximum value less than the tensile strength of
the material. Fatigue strength is the maximum stress that can be sustained for
a specified number of cycles without failure. The main factors that contribute
to fatigue failures include: number of load cycles experienced, range of stress
experienced in each load cycle, mean stress experienced in each load cycle,
presence of local stress concentrations.
The input is an S-N curve, the output is in the form of a table of
alternating stress intensities (listed in decreasing order) with corresponding
pairs of event/loadings, as well as cycles used, cycles allowed, and partial
usage factor. Following that, the cumulative usage factor is shown for that
particular location. This information is repeated for all locations. The output
shows the contributing pairs of events and loadings for any given alternating
stress-intensity range. This information can help isolate the transients
(events/loadings) causing the most fatigue damage.
Failure due to dynamic loading – repetitive or fluctuating stress
lower than yield strength is called as “Fatigue”. Nearly 90% of all service
failures are due to fatigue. The stress is usually cycled between a maximum
tensile stress and a maximum compressive stress (reversing). The latter is
considered a negative tensile stress, is given an algebraic minus sign, and
therefore is known as the minimum stress.
As already discussed, the fatigue failure in motorcycle chains is
rarely reported due to selection of higher factor of safety and lower operating
116
Apply load and displacements
Plot the stress results
Enter the fatigue properties
Enter the S-N data, Stress Locations
Calculate Fatigue
Plot fatigue results
Select element type and Analysis type
Enter material properties
stress level, which is mostly due to partial throttling in normal driving
conditions in cities. Even in highways, full throttling conditions may exist for
a short duration, which may not cause appreciable damage to chains by
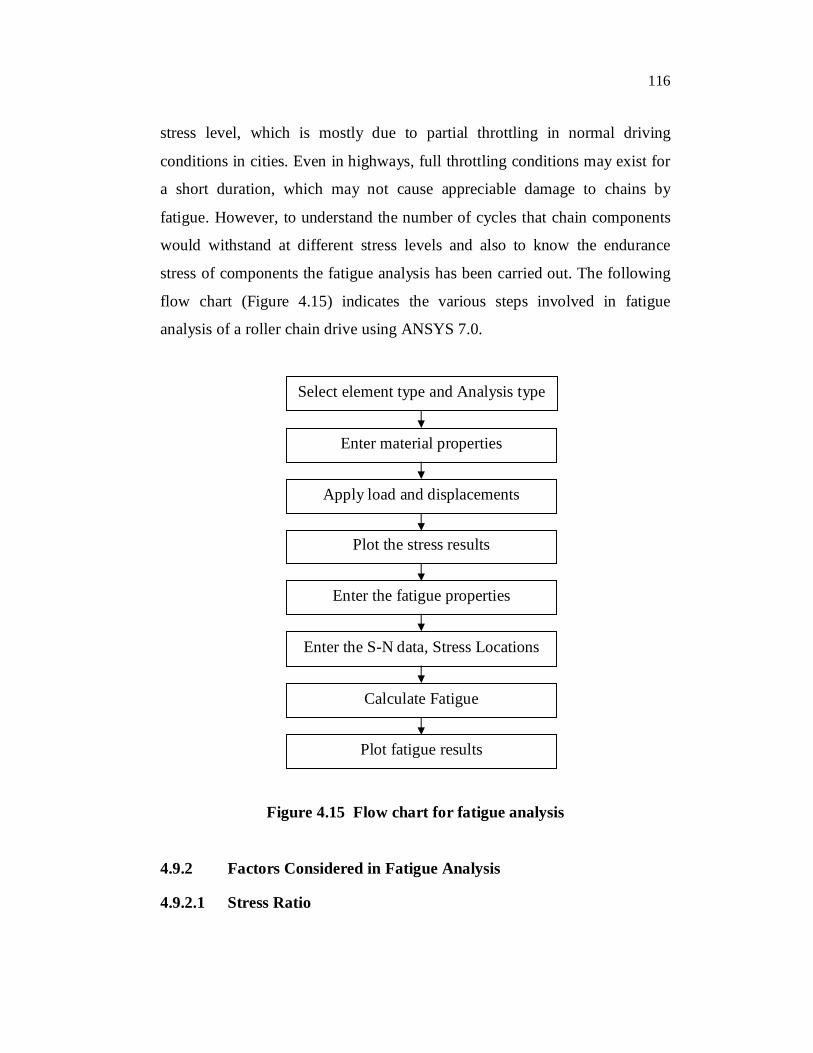
fatigue. However, to understand the number of cycles that chain components
would withstand at different stress levels and also to know the endurance
stress of components the fatigue analysis has been carried out. The following
flow chart (Figure 4.15) indicates the various steps involved in fatigue
analysis of a roller chain drive using ANSYS 7.0.
Figure 4.15 Flow chart for fatigue analysis
4.9.2 Factors Considered in Fatigue Analysis
4.9.2.1 Stress Ratio
117
It is the algebraic ratio of two specified stress value in a stress
cycle. Two commonly used stress ratios are the ratio, As, of the alternating
stress amplitude to the mean stress (As = Pa / Pm) and the ratio, Rs, of the
minimum stress to the maximum stress (Rs = Pmin / Pmax). If the stresses are
fully reversed, the stress ratio Rs becomes -1, if the stresses are partially
reversed; Rs becomes a negative number less than 0. If the stress is cycled
between two tensile stresses, the stress ratio R becomes a positive number less
than 1.
4.9.2.2 Applied stresses
It is described by three parameters. The mean stress, Pm, is the
algebraic average of the maximum and minimum stresses in one cycle,
Pm = (Pmax+ Pmin)/2. In the completely reversed cycle test, the mean stress is
zero. The range of stress, Pr, is the algebraic difference between the maximum
and minimum stresses in one cycle, Pr = Pmax– Pmin. The stress amplitude, Pa,
is one half the range of stress, Pa = Pr/2= (Pmax-Pmin)/2. During a fatigue test,
the stress cycle usually is maintained constant so that the applied stress
conditions can be written as Pm Pa, where Pm is the static or mean stress, and
Pa is the alternating stress, which is equal to half the stress range.
4.9.2.3 Stress - concentration factor
Stress is concentrated in a component by structural discontinuities,
such as notches, holes, or scratches, which act as stress raisers. The stress-
concentration factor Kt, is the ratio of the tested area stress in the region of the
notch (or other stress concentrators like holes, scratches, etc.) to the
corresponding nominal stress. The fatigue notch factor, Kf, is the ratio of the
fatigue strength of a smooth (unnotched) specimen to the fatigue strength of a
118
notched specimen at the same number of cycles. Fatigue notch sensitivity, for
a material is determined by comparing the fatigue notch factor, Kf, and the
stress-concentration factor, Kt, shape and size factors.
4.9.2.4 S-N curve
The results of fatigue test usually are plotted as maximum stress,
minimum stress, or stress amplitude to number of cycles, N, to failure using a
logarithmic scale for the number of cycles. Stress is plotted on either a linear
or a logarithmic scale. The resulting plot of the data is an S-N curve. The
number of cycles of stress that a metal can endure before failures increases
with decreasing stress. Below that limiting stress, known as the fatigue limit
or endurance limit, the material can endure an infinite number of cycles
without failure.
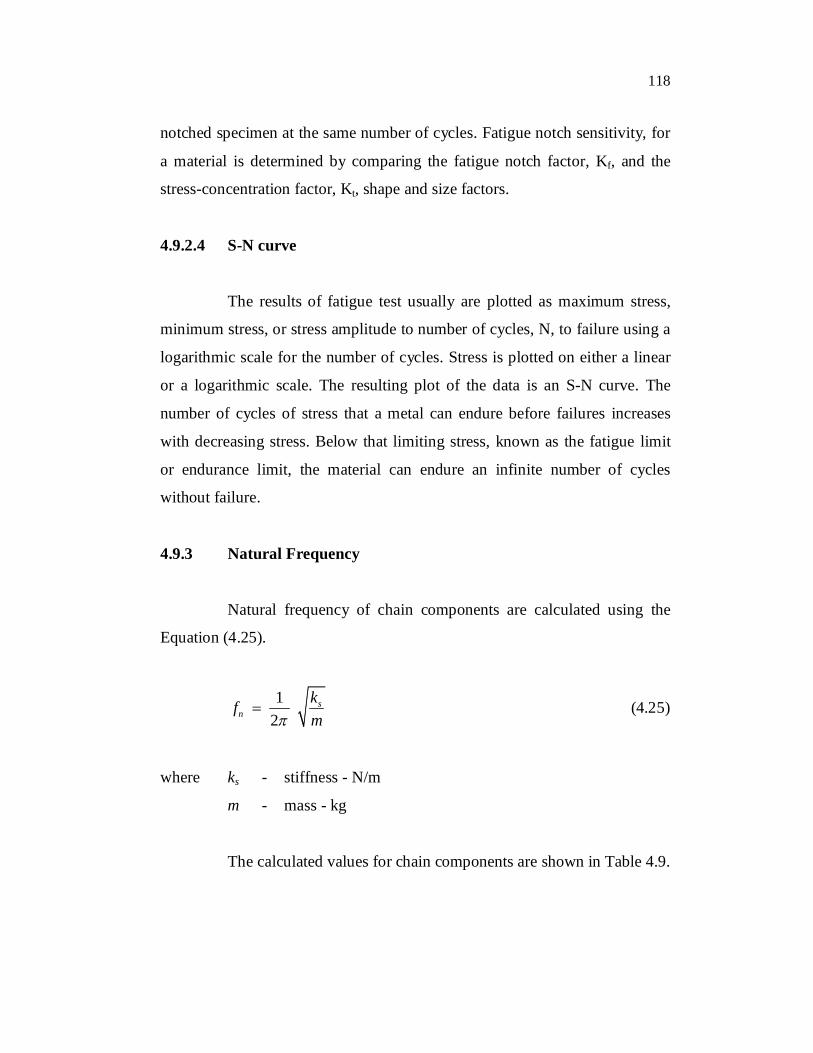
4.9.3 Natural Frequency
Natural frequency of chain components are calculated using the
Equation (4.25).
12
sn
kfm
(4.25)
where ks - stiffness - N/m
m - mass - kg
The calculated values for chain components are shown in Table 4.9.
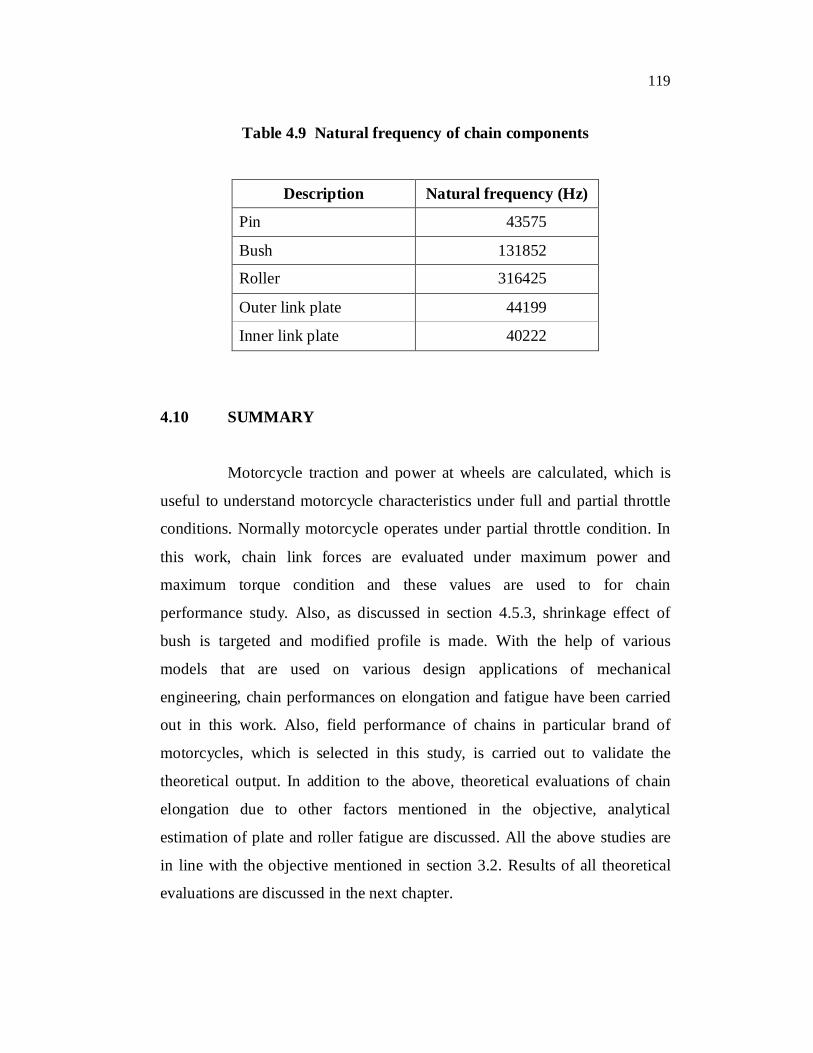
119
Table 4.9 Natural frequency of chain components
Description Natural frequency (Hz)
Pin 43575
Bush 131852
Roller 316425
Outer link plate 44199
Inner link plate 40222
4.10 SUMMARY
Motorcycle traction and power at wheels are calculated, which is
useful to understand motorcycle characteristics under full and partial throttle
conditions. Normally motorcycle operates under partial throttle condition. In
this work, chain link forces are evaluated under maximum power and
maximum torque condition and these values are used to for chain
performance study. Also, as discussed in section 4.5.3, shrinkage effect of
bush is targeted and modified profile is made. With the help of various
models that are used on various design applications of mechanical
engineering, chain performances on elongation and fatigue have been carried
out in this work. Also, field performance of chains in particular brand of
motorcycles, which is selected in this study, is carried out to validate the
theoretical output. In addition to the above, theoretical evaluations of chain
elongation due to other factors mentioned in the objective, analytical
estimation of plate and roller fatigue are discussed. All the above studies are
in line with the objective mentioned in section 3.2. Results of all theoretical
evaluations are discussed in the next chapter.