Embed Size (px)
Citation preview

77
Chapter 4
4. Optoelectronic Acquisition System Design
The present chapter deals with the design of the optoelectronic (OE) system required to
translate the obtained optical modulated signal with the photonic acquisition system
(described in Chapter 3). The OE module includes: a transimpedance amplifier (TIA) and a
filtering and amplification stage. Processing of the bioelectric signal is one of the most
important stages of a bioelectric sensor since it allows to isolate the signal of interest, while
preserving its content and integrity. Although filtering and amplification are crucial in most of
bioelectric signal measurements, the focus of this chapter is the design and optimization of the
front-end component between the photonic stage (Chapter 3) and the signal processing
electronics.

Chapter 4 Photonic Platform for Bioelectric Signal Acquisition on Wearable Devices
78
4.1 OE Conversion Module
The OE conversion module refers to the signal translation and conditioning required to
transform the photonic stage output optical signal into a bioelectric signal output. Part of the
information contained in the overall bioelectric signals may not be readily available from the
raw signal, requiring further analog or digital processing for feature extraction. Therefore, the
design of OE system for bioelectric signals must comprise appropriate instrumentation to
guarantee the integrity of the information, whereas minimizing interference or artifacts. In this
way it’s possible to guarantee that the acquired signal is useful for health condition
monitoring or diagnostics, since a corrupted signal could provide misleading or meaningless
information. In Chapter 1, the typical optical sensor acquisition diagram was presented
(Figure 1.4), which included a photodetector, amplification, filtering, A/D converter,
processing unit and a possible wireless data transmission component. The OE system may
include all, or some of these components, being the mandatory for bioelectric signal
acquisition: photodetection (photodiode & transimpedance amplifier), amplification and
filtering. The remaining blocks in Figure 1.4, are optional, although in the specific application
on wearable devices, the use of A/D converters and wireless transmission data are
fundamental
4.1.1 Current-to-Voltage Conversion
OE conversion is divided in two blocks: photodetection and current-to-voltage (I-V)
conversion. The first was explained in Chapter 3, and is the bridge between the light
modulation and the electronics used to process and interpret this phenomenon. The electrical
current obtained at the output of the photodiode needs to be converted to a readable voltage in
order to make the signal compatible with the remaining electronics [1, 2].
TIAs are used to convert the current signal from the photodiode, (iph), into a voltage
signal, (vout), providing a high-transimpedance gain, (GTIA), over the desired bandwidth.
Figure 4.1 shows an example of a simple TIA circuit with the photodiode in the photovoltaic
mode. As shown in Figure 4.1, the basic TIA comprises a combination of a photodiode in
series with an opamp and a feedback resistor (Rf), being the latter responsible for providing
amplification during I-V conversion. In addition Rf prevents the development of any
significant voltage at the circuit input, restoring the virtually zero voltage at the opamp input.
The TIA circuit in Figure 4.1, however, presents disadvantages for applications where gain,
bandwidth and stability are crucial.

Photonic Platform for Bioelectric Signal Acquisition on Wearable Devices Chapter 4
79
The main challenges when designing TIA for high-gain applications are related with:
DC offset errors, bandwidth and stability. In fact, the value of Rf strongly influences the
overall TIA performance. Therefore, compensation is often required to provide a stable TIA
operation. This holds true particularly for TIA with high sensitivities, which is the case for the
present application.
High-sensitivity Limitations
A common problem in TIA performance is related with DC offset errors mainly
originated by two error currents that flow through the feedback component: input bias current
of the amplifier and the leakage current of the photodiode. In fact, these currents will
experience the same gain as the desired current signal, superimposing the output. Ideally, an
opamp would cause !!! to flow through the Rf. However, what really happens is that some of
this input current is driving the opamp input terminal, causing the input bias and photodiode
leakage current to overlay the desired signal. Therefore, the selection of the opamp must
envisage a small bias current, since as higher this parameter is, less photodiode current goes
through the Rf. Also, in this way, higher current errors are generated. Another way to solve
this, is to use a compensation resistor in parallel with a capacitor, which together develop an
offset component that neutralizes the existent error.
Another common problem when dealing with high-gain TIA is a phenomenon called
gain peaking that induces an unstable behavior. Gain peaking is characterized by a ringing
effect on the output voltage of the circuit. Any noise signal can trigger an unstable circuit into
oscillation. In order to maintain stability, and therefore avoid gain peaking, a feedback
capacitor (Cf) is placed across Rf, creating a pole (fp) in the Noise Gain (NG) function. The
NG corresponds to the non-inverting closed-loop gain, and represents the amplification of the
Figure 4.1 Standard circuit of a transimpedance amplifier with photodiode in the photovoltaic mode.

Chapter 4 Photonic Platform for Bioelectric Signal Acquisition on Wearable Devices
80
inherent voltage noise of the opamp. A graphical analysis provides a better understanding of
the effect of Cf in gain peaking prevention (Figure 4.2).
As shown in Figure 4.2, the NG exhibits a flat response until a pole is created due to the
input capacitance of the TIA and Rf. After this pole, the NG begins to rise, but still within the
open-loop gain of the opamp, whereas this curve simultaneously drops. At a certain point, the
opamp lacks sufficient gain to support the feedback demands, i.e. exceeds the open-loop gain
of the opamp. This is the critical point of the circuit that defines the gain-peaking threshold.
At frequencies beyond this, i.e. frequencies higher than fGBW, the opamp doesn’t have
sufficient gain to support the feedback (Rf //Cf) demand, and the circuit’s I-V response rolls
off, leading to circuit instabilities and gain peaking (Figure 4.2). The selection of Cf and Rf
should, therefore, be made in order to position the high-frequency pole (fp) of the TIA inside
the open-loop gain opamp curve. This leads to an unconditional stability. The only associated
problem regards to bandwidth limitations, which is not the case for bioelectric signal
applications, where frequencies are in the range of few Hz to kHz.
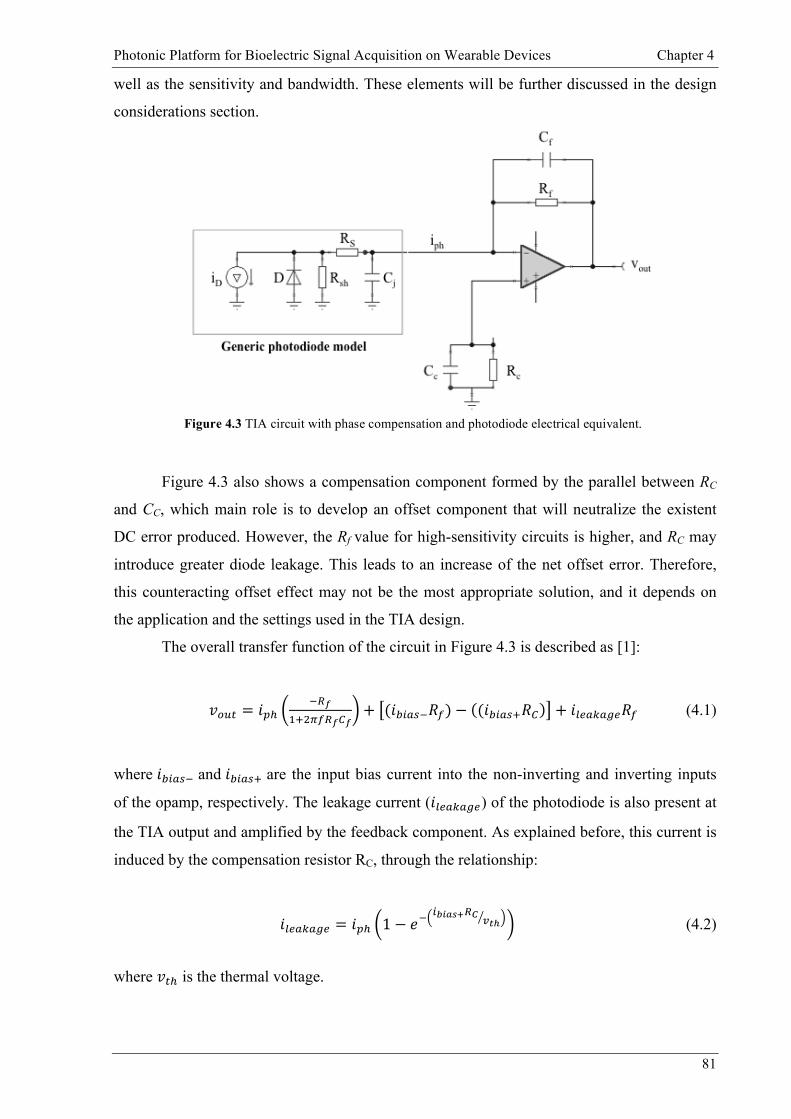
Figure 4.3 shows the TIA circuit with phase compensation to prevent gain peaking, as
well as the equivalent model of the photodiode. As shown in Figure 4.3, the photodiode is
represented by an equivalent model that includes a current source (iD), a shunt resistance
(Rsh), a junction capacitance (Cj), a diode (D) and a series of resistance (Rs). The latter passive
component is related with the semiconductor material used in the photodetector and is
generally negligible due to its low values. Regarding TIA overall performance, the most
important photodiode elements are Cj and Rsh, since they define the stability of the circuit, as
Figure 4.2 Bode plot of NG and opamp Open Loop Gain. The inset shows the gain peaking effect on the I-V
response curve.
Photonic Platform for Bioelectric Signal Acquisition on Wearable Devices Chapter 4
81
well as the sensitivity and bandwidth. These elements will be further discussed in the design
considerations section.
Figure 4.3 also shows a compensation component formed by the parallel between RC
and CC, which main role is to develop an offset component that will neutralize the existent
DC error produced. However, the Rf value for high-sensitivity circuits is higher, and RC may
introduce greater diode leakage. This leads to an increase of the net offset error. Therefore,
this counteracting offset effect may not be the most appropriate solution, and it depends on
the application and the settings used in the TIA design.
The overall transfer function of the circuit in Figure 4.3 is described as [1]:
!!"# = !!!!!!
!!!!"!!!!+ (!!"#$!!!)− (!!"#$!!! + !!"#$#%"!! (4.1)
where !!"#$! and !!"#$! are the input bias current into the non-inverting and inverting inputs
of the opamp, respectively. The leakage current (!!"#$#%") of the photodiode is also present at
the TIA output and amplified by the feedback component. As explained before, this current is
induced by the compensation resistor RC, through the relationship:
!!"#$#%" = !!! 1− !!!!"#$!!! !!! (4.2)
where !!! is the thermal voltage.
Figure 4.3 TIA circuit with phase compensation and photodiode electrical equivalent.

Chapter 4 Photonic Platform for Bioelectric Signal Acquisition on Wearable Devices
82
The relationship between the feedback element and the opamp of the photodiode
amplifier determine the well functioning of the TIA. There is a relationship by which an
optimum Cf is calculated to a specific Rf or TIA gain, expressed by:
!! =!!!
1+ 1+ 4 !!!!
(4.3)
where Ci combines the three input capacitances of the circuit: photodiode (Cj) opamp
common mode (Ccm) and differential (Cdiff). The capacitor Cc can be considered a virtual
capacitor determined by the relationship of Rf and the gain-bandwidth product of the opamp
(!!"#):
!! =!
!!!!!!"# (4.4)
Design Considerations
In order to guarantee proper photodiode amplifier circuit operation, some basic
requirements for the photodiode and opamp must be met. These requirements seek to increase
the signal of interest, in regards to the noises imposed by the photodiode, opamp, and other
elements, such as powering and electromagnetic interference (Table 4.1) [1, 3].
Table 4.1 Design consideration for TIA design.
Element Parameter Considerations
Photodiode
Biasing technique
In order to increase sensitivity, the photodiode must be used in the photovoltaic mode, i.e. with zero-bias operation. In this way, the dark current offset errors are not generated by the leakage current.
Capacitance This should be as low as possible since together with the Rf, forms a noise-gain zero (feedback pole), affecting frequency and noise.
Dark current Should be as low as possible, since this current is responsible for DC errors at the output.
Opamp
Input capacitance
This parameter contributes to the total capacitance that defines one of the poles in Figure 4.2.
Gain-bandwidth
product
As high as possible to prevent gain peaking. A trade-off must be made with the gain and feedback elements used.
Bias current This value should be set as low as possible, since bias current causes voltage offset errors, specially in the presence of large- Rf.

Photonic Platform for Bioelectric Signal Acquisition on Wearable Devices Chapter 4
83
Feedback
component
Resistor
Should be as high as possible in order to increase sensitivity. In general a high Rf is better than implementing a T-network. Although the gain is in principle higher, the T-network sacrifices performance due to the generation of higher noise current. In addition, input offset voltage, drift and voltage noise are multiplied by the ratio of the T-network, which constitutes a drawback for high sensitive applications. Nevertheless, using an opamp with low bias current, can overcome the limitations imposed by T-networks, providing better gain adjustment.
Capacitor
Usually a small capacitor is added to suppress oscillation, although for low-frequency signals, larger values can be used. However, the pole frequency introduced by this capacitor should be larger than the frequency of the desired signal in order to prevent attenuation.
The design considerations shown in Table 4.1 strongly depend on the type of signals
to measure, particularly regarding bandwidth and amplitude. It’s important to follow these
guidelines since the result of this stage, i.e. TIA output, provides with the voltage signal that
will be use for further processing and feature extraction.
4.1.2 Signal Processing
The actual output of a bioelectric signal acquisition device consists of several
components:
• desired bioelectric signal, e.g. Electrocardiogram (ECG), Electroencephalogram
(EEG) or Electromyogram (EMG);
• other bioelectric signals, for instance EMG may appear in ECG recordings;
• interference signals from power-line;
• motion artifacts and other interference from tissue/electrode interface;
• Inherent noise of the device.
The acquisition device, in this case the photonic system described in Chapter 3, should
inherently eliminate the undesired components, without requiring further processing.
However, in real acquisition systems, these undesired components are present and can overlay
the signal of interest, particularly in the case of EEG, where amplitudes are in the range
of µV. In Chapter 2, an overview of the noises and interferences involved in wearable
bioelectric signal acquisition was shown in Table 2.2. Those noises have amplitudes close,

Chapter 4 Photonic Platform for Bioelectric Signal Acquisition on Wearable Devices
84
and in some cases, higher than the bioelectric signals of interest. For example, skin motion
artifact limit the gain factor of the amplification stages, since their amplitudes are typically
between 5 to 15 mV. Thus, it’s important to remove this component at an early stage [4].
Therefore, after OE conversion it’s important to include a processing block featuring
low noise amplification and filtering. This stage is also important in order to match the input
range of analog-to-digital converters and to limit its bandwidth to the desired range. Filtering
can be performed in two ways: analog or digitally. At a first stage, signals are filtered using
analog technology that is implemented in the acquisition platform. These analog filters
generally include band-pass and notch filters, which contribute for the removal of low and
high frequency noise, as well as power-lines interference centered at 50/60 Hz. However,
there must be a careful definition of the analog filter settings, since they may cause some
distortion to the significant frequency components of the monitored bioelectric signal.
Therefore, the design of analog filters must envision a linear phase frequency response over
the spectral components included in the band of interest.
In addition to this filtering stage, bioelectric signals can also be processed in its digital
format, after A/D conversion. These filters have several advantages over analog filtering since
they are easily handled in terms of settings. In fact, in the case of analog filters, it may be
necessary to change passive and active components that may be already soldered to the circuit
board. In addition, they are susceptible to environmental factors, such as temperature and
corrosion. Nevertheless, it’s preferable to first filter the signals in the analog format and if
necessary, include digital filtering techniques.
4.2 OE Conversion System
The output signal of the photonic stage, described in Chapter 3, needs to be converted
back to an electrical value in order to perform signal processing and possible feature
extraction. In addition to OE conversion, the TIA also performs amplification of the signal
into a readable value. Nevertheless, this amplification is limited by the settings of the previous
stage, i.e. photonic stage, such as input optical power and DC current levels.
4.2.1 TIA Design
Current-to-voltage conversion is performed by a high gain TIA, since it needs to detect
even the small variations of current produced by EEGs. In fact, for input optical powers of

Photonic Platform for Bioelectric Signal Acquisition on Wearable Devices Chapter 4
85
10 mW, the resultant variations of electrical current at the output of the photodiode reach
minimums of a few nA. Nevertheless, the DC component of the modulated signal is higher in
several orders of magnitude. For instance, considering the photonic setup settings specified in
Table 3.4, the DC input current to the TIA would be 1.3 mA. This current imposes a limit on
the GTIA, since in order to prevent opamp saturation, the output voltage to each terminal,
should not exceed its supply voltage. In addition, high-level DC signals can also induce
unintended biasing voltage on the following signal processing stages
In order to prevent TIA saturation, an additional feedback block is used to compensate
the high DC levels introduced (Figure 4.4). This DC suppression block works as a high-pass
filter, and the low-cut frequency is adjusted according to minimal frequency component of the
monitored bioelectric signals (Table 2.1). The TIA design used was based on Figure 4.3, i.e.
including the Cf to avoid gain peaking, although with the additional feedback block.
The overall transfer function (TF) of the circuit in Figure 4.4 takes into account both
blocks and follows the typical feedback control system. Thus, TF(s) can be expressed as:
!" ! =!! !!
!!!!!! !!!!!!!!!!!!!!
(4.5)
where natural frequency is expressed as !! = 1!!!!!!!!
.
Figure 4.4 TIA circuit schematic, with DC suppression block and compensation block.

Chapter 4 Photonic Platform for Bioelectric Signal Acquisition on Wearable Devices
86
4.2.1 Circuit Dimensioning
The TIA circuit design is performed according to the considerations shown in Table 4.1,
whose main purpose is to prevent unsuitable operation of the OE conversion stage. First, it’s
essential to define the required TIA performance characteristics, particularly gain and
bandwidth. As it was explained before, an upper limit to the GTIA has to be determined in order
to prevent the opamp to reach a stage of saturation. On the other hand, there’s a minimum
value for this setting, since modulated currents that carry information about the monitored
signal can reach a few nA. Thus, dimensioning of the circuit in Figure 4.4 needs to take into
account the requirements shown in Table 4.2.
Table 4.2 TIA circuit requirements for gain and bandwidth.
Transimpedance
Gain
Lower (recommended) threshold
These calculations were based on: a minimum AC current of 10 nA, respective to a measurement of an EEG; as well as a minimum output voltage of 1 mV.
!!"# = 1x 10⁵ V/A
Upper threshold
The upper threshold is only valid for DC currents, facing the high DC levels produced by an input optical power of 10 mW
!!"# (@DC)= 1.25 x 10⁴ V/A
Bandwidth
This value is estimated according to the lower and upper frequency components of interest of the main bioelectric signals: ECG, EEG and EMG.
BW = 0.2 Hz – 1 kHz
Besides requirements shown in Table 4.2, it’s also important to take into account the
remaining design considerations shown in Table 4.1. As it was explained before, high-
sensitivity TIA circuits are prone to oscillate facing inappropriate phase compensation, i.e.,
when the frequency pole of the transfer function (Figure 4.2) falls outside the stability region.
In order to achieve this, the selection of the minimum recommended !! needs to be calculated
according to (4.3), and considering the following settings:

Photonic Platform for Bioelectric Signal Acquisition on Wearable Devices Chapter 4
87
- The photodiode is used in the photovoltaic mode, which reduces the effects of dark
current in terms of offset errors, becoming less affected by power supply-related noises. The
compromise of using this mode of operation is an increase of junction capacitance (!!).
However, typical !! values are often in the range of pF, depending on the bias voltage and
active area of the photodiode. For calculations and estimations, a capacitance of 5 pF was
chosen based on commercially available PIN photodiodes for optical-fiber applications.
- The opamp selection was made through a compromise between !!"##, !!", !!"#, and
input bias current and offset voltage. The three first settings contribute to the selection of the
right capacitor to bypass the Rf. A complementary metal-oxide-semiconductor (CMOS)
opamp with low bias current (OPA2337, Burr-Brown) can be used, with !!"## of 2 pF, !!"
of 4 pF and a !!"# of 3 MHz. According to these values and using (4.3), the minimum
recommended Cf value for a Rf range of 0.5 to 10 MΩ was calculated, and results are shown
in Table 4.3.
Table 4.3 TIA phase compensation results for a selected range of !!.
As shown in Table 4.3, it’s possible to use capacitors of lower values, which not only
reduces the capacitive coupling of external signals, but also allows for high flexibility in
defining the high frequency pole. In order to reduce band-pass range of the TIA, a higher
capacitor (!! = 22 !") can be used towards a high-frequency pole of 1 kHz.
Since the photodiode amplifier is a very high impedance and sensitive circuit, it requires
a good shielding and effective power supply bypassing. Therefore, this circuit will take
advantage of the use of batteries instead of a power supply subjective to drift.
!! (MΩ) !! (pF) !! (pF) !! (pF) !!!"# (kHz)
0.5 0.10 11 1.13 280
1 0.05 11 0.79 201
5 0.01 11 0.346 91.7
10 0.005 11 0.244 65.1

Chapter 4 Photonic Platform for Bioelectric Signal Acquisition on Wearable Devices
88
4.2.1 Performance Assessment
The performance of the TIA circuit can be simulated in TINA® (Texas Instruments) in
order to determine the optimum values for each component in Figure 4.4, as well as to
investigate the resultant frequency response, gain and SNR. From the simulations, the
optimum values for each component are the following: !! = 22 pF, !! = 5 MΩ, !! = 10
MΩ and !! = 5 kΩ. Regarding !!, this component determines the TIA low-cut off frequency,
and a careful selection must be made since higher capacitors contribute for an increase of the
capacitive coupling of unwanted signals as well as crosstalk between different points of the
circuit.
Table 4.4 shows the TIA performance results in terms of bandwidth, SNR and total
output noise for different !!values.
Table 4.4 Performance results simulated in TINA for different C1 values.
As expected, the SNR decreases for capacitors with higher value, since the noise pick-
up is higher due to capacitive coupling and crosstalk effects. In some cases, it may be an
advantage to compromise the low-frequency components over a stable and high-sensitivity
TIA. In fact, even if the low-cut frequency is set to 3.5 Hz, the components from this point to
0.2 Hz are still converted over a gain from 95-130 dB.
4.3 Electrical Processing Unit
The processing unit includes the components needed to: remove unwanted
components or signals, and amplify the resultant signal if needed. Figure 4.5 shows the block
diagram of the acquisition electronics designed for the photonic platform.
C1 ( µF) Bandwidth (Hz) SNR (dB) Total output
noise (µV) 0.2 -1 kHz 10 Hz
1 16 – 597 131.76 – 72.8 100.5 0.258 – 229 4.7 3.5 – 597 130.74 – 72.8 93.08 0.292 – 229
10 1.68 – 597 128.29 – 72.8 91.75 0.387 – 229
100 0.17 – 597 113.3 – 72.8 90.7 2.18 – 229

Photonic Platform for Bioelectric Signal Acquisition on Wearable Devices Chapter 4
89
The power supply used may be a problem since it includes unwanted periodic
oscillation called ripple. This artifact often has higher amplitudes than some of the bioelectric
signals such as EEG. Therefore, to improve system stability as well as to remove this typical
interference, batteries of 9 V, are used to power the acquisition electronics.
4.3.1 Band-pass Filtering
In order to eliminate the interference from other bioelectric signals, as well as from
environmental conditions (Table 2.2), analog band-pass filters with unity gain are used. The
selection of filter range depends on the monitored bioelectric signal, as shown in Figure 4.5.
Although both EEG and ECG have frequency ranges from 0.05 to 200 Hz, some clinical
applications are only interested on data among a window of 0.2 to 40 Hz [5], [6]. In this case,
the band-pass filtering allows to perform some extra attenuation of the 50 Hz power line
interference. On the other hand, EMG signals have clinical importance considering spectrum
components from 5 to 500 Hz [7].
The band-pass filter circuit implemented is shown in Figure 4.6 and is based on a
Sallen-Key topology [8]. The transfer function of the filter is obtained by the product of the
transfer functions of both cascaded components:
!"(!) = !!
!!!!! !!!!!!!!!!!!!
!!!
!!!!! !!!!!!!!!!!!!
(4.6)
where the low-pass cut-off frequency is defined as
!! =!
!! !!!! (4.7)
Figure 4.5 Block diagram of the acquisition electronics, including an optional voltage amplifier.

Chapter 4 Photonic Platform for Bioelectric Signal Acquisition on Wearable Devices
90
and the high pass cut-off frequency as:
!! =!
!! !!!! . (4.8)
The selection of the values for resistances and capacitors is performed according to
(4.7) and (4.8), and it’s a good practice to first select the values for capacitors since the
available values are more limited. Table 4.5 shows the calculated values for resistors and
capacitors for each filter: 0.2–40 Hz and 5–500 Hz. The Integrated Circuit (IC) chosen for the
band-pass filter were the low-noise high-speed JFET-Input operational amplifiers (TL071CP,
Texas Instruments).
Table 4.5 Optimum resistor and capacitor values for band-pass filter.
R1 R2 R3 C1 C2 C3
ECG, EEG (0.2-40 Hz)
239 kΩ 119 kΩ 2.81 kΩ 4.7 µF 1 µF 2 µF
EMG (5-500 Hz)
9.58 kΩ 4.78 kΩ 225 Ω
In order to analyze the frequency response of the designed band-pass filter, the band-
pass filter in Figure 4.6 was implemented in the software TINA®, and the transfer function in
(4.6) was simulated in Matlab®. The results for both simulations are depicted in Figure 4.7.
Figure 4.6 Circuit schematic of the Sallen-key band-pass filter.

Photonic Platform for Bioelectric Signal Acquisition on Wearable Devices Chapter 4
91
As shown, the results of both simulated and theoretical frequency response are similar
for the two tested filters with unity gain (0 dB) over the selected bandwidth. The cut-off
frequencies are also very close to the expected and desired values, which suggest that the
designed filters are adequate for each bioelectric signal acquisition system.
4.3.2 Notch Filtering
A notch filter with an active twin-tee network topology is used to suppress the 50 Hz
power-line interference. This filter is composed by two T-networks as shown in Figure 4.8.
With this topology it is possible to achieve higher Q filters by using an operation amplifier
configured as a voltage follower.
Figure 4.7 Frequency response of the band-pass filter for: ECG and EEG filter obtained in a)Matlab® from
the transfer function and b) TINA® from circuit simulation; EMG filter obtained in c) Matlab® from the
transfer function and d) TINA® from circuit simulation. Arrows indicate the low and high cut-off
frequencies.

Chapter 4 Photonic Platform for Bioelectric Signal Acquisition on Wearable Devices
92
The characteristic transfer function of this filter is:
!" ! =!!!! !!!!!!
!!!!! !!!!!!!!!!!!
(4.9)
where the notch frequency is determined by:
!!"#$! =!
!!!!!! (4.10)
The notch frequency should be centered at 50 Hz for European applications, and at
60 Hz if used in the United States.
Similar to the band-pass filter, the circuit shown in Figure 4.8 was simulated in TINA®
and the transfer function (4.9) was plotted in Matlab®. The values for resistors and capacitors
Figure 4.8 Circuit schematic of twin-t notch filter.
Figure 4.9 Frequency response of the notch filter obtained in a) Matlab® from the transfer function and b)
TINA® from circuit simulation. Arrows indicate the notch frequency.

Photonic Platform for Bioelectric Signal Acquisition on Wearable Devices Chapter 4
93
were chosen according to a !!"#$! of 50 Hz, which results in a !! = 47 nF and in
consequence a !! = 67.7 kΩ. Results for these settings are shown in Figure 4.9, where the
simulated and theoretical notch frequency meets the expectations. Thus, the settings defined
for each component in Figure 4.8 are the recommended for notch filter implementation.
4.3.3 Voltage Amplifiers
Since bioelectric signals detected are commonly converted to digital signals for further
processing and communication for instance to health monitors, amplification is usually
required. Inverting amplifiers can be optionally included in this platform, with different gains
depending on the monitored bioelectric signal. In particular, for EEGs high gains are required
facing its typical amplitudes that can go down to 5 µV. The gain settings depend on the
voltage gain produced in subsequent stages. The use of negative feedback over non-inverting
amplifiers is related with their advantages such as stable gain and less signal distortion.
4.4 Performance Simulation of Overall OE System
The overall acquisition electronics platform can be simulated in TINA® in order to
have a general picture of its performance. The implemented circuits are those shown in
Figure 4.4, Figure 4.6 and Figure 4.8, with the described components. Regarding the TIA, the
value for the capacitor C1 was 100 µF, since the goal is to test the acquisition electronics setup
for the best-case scenario where a low-frequency cut-off of 0.2 Hz is assured.
First, the transfer function was plotted using both band-pass filter settings: 0.2 – 40 Hz
and 5 – 500 Hz, being the results shown in Figure 4.10.
Figure 4.10 Frequency response obtained in TINA® for the overall acquisition electronics setup using
band–pass filter for a) ECG and EEG acquisition (0.2 – 40 Hz); and b) 5 – 500 Hz.

Chapter 4 Photonic Platform for Bioelectric Signal Acquisition on Wearable Devices
94
The results in Figure 4.10 show the evident 50 Hz power–lines suppression performed
by the twin-T notch filter, with an attenuation factor of 36 dB. The band-pass range is
according to the pre-set values for each bioelectric signal monitored.
A noise analysis was also performed in order to assess the SNR of the overall circuit, as
well as to determine the input noise, which only includes the noises of the components used,
such as opamps, resistors, capacitors and photodiode. This analysis was performed for both
band-pass filters, although only the results for ECG and EEG acquisition electronics setup are
depicted in Figure 4.11.
Figure 4.11 Simulation results obtained in TINA® for the overall acquisition electronics setup in terms of a)
Input noise; and b) SNR.
As shown in Figure 4.11a, the input noise of the OE system includes the 1/f noise that
is present in most active and passive devices. The input noise floor over the frequencies of
interest is 1.88 pV/Hz1/2, which is in the limits described in Chapter 2 (EEG – 1 µV; ECG –
10 µV). Figure 4.11b shows the SNR for the overall circuit, which values are above the limit
of 0dB, which means that, in principle, the designed acquisition electronics will overcome the
input noises and provide sufficient resolution for bioelectric signal measurements. In fact, the
minimum SNR (< 89.39 dB) is obtained for frequencies above the highest component of
interest for both ECG and EEG signals.
Despite the results shown for the overall OE system, it’s important to have in mind
that in real applications, other sources of noises (e.g. photodiode noises) and interferences
contaminate the signal of interest. These sources are not accounted in these results, although
the efficiency of the filtering stage points for the effective isolation of the bioelectric signal
monitored.

Photonic Platform for Bioelectric Signal Acquisition on Wearable Devices Chapter 4
95
4.5 PCB Design
Once the OE system is well defined, is possible to design a printed circuit board
(PCB) with the following. The PCB was designed using PADS® (Mentor Graphics) and a
single board was used for the entire OE system. First, the electrical circuit and the PCB layout
were elaborate and are shown in Annex I. Figure 4.12 shows the resultant OE system
equivalent PCB. The dimensions selected for the OE prototype were 4 cm x 8cm in order to
fit the black box shown in Figure 1.5.
Figure 4.12 PCB of the OE system designed for bioelectric signal acquisition. a) top view and b) bottom view.
References [1] J. G. Graeme, Photodiode amplifiers. McGraw-Hill, 1995. [2] K. IIzuka, Elements of Photonics - Volume II. Wiley-Interscience, 2002. [3] “Designing Photodiode amplifier circuits with OPA128,” 1994. [4] E. Huigen, “Noise in biopotential recording using surface electrodes,” no. November, 2000. [5] V. K. Murthy, T. M. Grove, G. A. Harvey, and L. J. Haywood, “Clinical Usefulness of ECG
Frequency Spectrum Analysis,” Proceedings of the Annual Symposium on Computer Application in Medical Care, no. 2, pp. 610-612, 1978.
[6] E. Niedermeyer and F. H. L. D. Silva, Electroencephalography: Basic Principles, Clinical Applications, and Related Fields, vol. 1. Lippincott Williams & Wilkins, 2004, p. 1309.
[7] K. Heinrichs, “Introduction to Surface Electromyography,” Journal of Athletic Training, vol. 10, no. 1, p. 69, 1999.
[8] T. Hayes and P. Horowitz, “The Art of Electronics - Student Manual.”


![Electronics VII... · 2019-01-21 · 2' 3' 4(a) 4(b) out2 (3836) [08] outl in2 Figure 2 OR Analyze the two—stage CMOS opamp. shown in figure 3 for small signal voltage gain. Also](https://img.pdfslide.us/doc/110x75/5e7980290b5bdf41494126f5/-electronics-vii-2019-01-21-2-3-4a-4b-out2-3836-08-outl-in2-figure.jpg)