Embed Size (px)
Citation preview

Chapter 4 Rehabilitation Works for Hydropower Stations

Final Report Chapter 4 Rehabilitation Works for Hydropower Stations
4 - 1
CHAPTER 4 REHABILITATION WORKS FOR HYDROPOWER STATIONS
4.1 Sutami and Wlingi Hydropower Stations
4.1.1 Basic Concept for Rehabilitation Works
According to the results of the site investigation, the civil structures in Sutami and Wlingi do not
require the rehabilitation works at the moment. On the other hand, in order to achieve a
sustainable operation of the power stations, the hydro-mechanical equipment and generating
equipment are recommended to be rehabilitated considering the following concepts.
(1) Hydro-mechanical Equipment (Gates and Penstocks)
Neither serious damage nor deterioration of hydro-mechanical equipment was observed to cause
the reduction of power generation. No remarkable defect was found during this study. However,
local control cabinets for intake gates at Sutami are obsolete and do not comply with the present
safety codes for electrical appliances. Further, a few colored glasses on the indicator light have
been broken. The rehabilitation works are recommended to be made for the control cabinets
which do not comply with the safety codes for electrical appliances.
On the other hand, no rehabilitation work is required for the hydro-mechanical equipment at
Wlingi.
(2) Generating Equipment (Water Turbine, Generators and Control System)
The existing generating equipment was designed based on the technology and practice in the
1970’s, and major components such as turbine runner, generator stator windings and control and
protection panel have not yet been rehabilitated to date. Under such situation, some
damage/deterioration can be possibly identified even if no severe problems have been observed so
far. In addition, spare parts for the original equipment are difficult to find in the market.
According to “IEC 62256 - Hydraulic turbines, storage pumps and pump-turbines - Rehabilitation
and performance improvement”, the opportune time for starting rehabilitation should be prior to the
equipment experiencing frequent and severe problems with its major components such as for
example: generator winding failures, major runner cracking, cavitations or particle erosion damage,
bearing failures and/or equipment alignment problems due to foundation or substructure movement
or distortion. To avoid long term stoppage due to a severe problem and/or non availability of spare
parts for damaged components in the near future, rehabilitation work is recommended to restore at
least the original performance and reliability to maintain continuous long time operation. This can
be achieved by adopting advanced and modern technology for the major components. Upon

Final Report Chapter 4 Rehabilitation Works for Hydropower Stations
4 - 2
renovating the major components, each power station is expected to have an extended life of
another 40 years.
(3) Methods of Rehabilitation
As a scope of the rehabilitation work, partial or entire replacement of the component is
considerable, but it is not recommended to adopt a partial replacement because the components
were very old and designed in the 1970’s practice and therefore the partial replacement is very
difficult in procurement of parts and may cause a limited tender only by the original manufacturer.
Therefore the entire replacement of the component is recommended to make a competitive tender.
4.1.2 Rehabilitation Works
(1) Hydro-mechanical Equipment (Gates and Penstocks)
The gate leaf and structure of the hydro-mechanical equipment in Sutami are working in good
condition and no serious problems have been observed. Therefore, only three (3) sets of local and
remote control cabinets for intake gates have been considered for rehabilitation. It is
recommended to design, to fabricate and install the new control cabinets in accordance with the
latest codes for electric appliances.
(2) Generating Equipment (Water Turbine, Generators and Control System)
The generating equipment is composed of various components and Table 4.1.2-1 shows major
components with their functions and possible problem/trouble.
Table 4.1.2-1 Major Components of Generating Equipment
Component Part Function Possible problem/trouble -Turbine runner -Convert hydraulic energy to mechanical
energy -cavitations -corrosion
-Spiral casing -Embedded water passage to runner -crack and corrosion -Guide vane -Adjust water volume to runner -crack due to cavitations
-corrosion -Inlet valve -Open and close water passage to water
turbine -water leakage
-Turbine bearing -Support turbine shaft -vibration -high temperature
1 Water Turbine
-Governor -Adjust speed and load of water turbine -non control of speed and load
-Stator -Generate voltage -short circuit of windings -earth fault of windings
-Rotor -Convert mechanical energy to electrical energy
-short circuit of windings -earth fault of windings
-Thrust bearing -Support rotor and generator shaft -vibration -high temperature
2 Generator
-AVR -Adjust generator voltage -non control of voltage -Control panel -Operate and control machines
-Record events and status -non control of machines 3 Control and
Protection
-Protection panel -Protect machines from trouble -malfunction of protection 4 Transformer -Main transformer -Step-up generator voltage to high voltage -high temperature
-oil leakage
(Prepared by JICA Study Team)
Final Report Chapter 4 Rehabilitation Works for Hydropower Stations
4 - 3
These are classified as major components since any problem or trouble in any of these will cause a
significant damage to the hydropower station, resulting in forced long term stoppage.
Based on the data collected during the site investigation, evaluation for the major components was
made to clarify a scope of rehabilitation works. Results of the evaluation was made in three (3)
statuses, namely,
A: Deterioration is remarkable and replacement is urgently required,
B: Deterioration is going and repair and/or replacement at annual inspection (AI) or major
overhaul (MO) is recommended, and
C: Deterioration has not yet been appeared but observation in the regular maintenance is
recommended.
It is noted that the evaluation in this study was carried out based on visual inspection and collected
data, but not based on non-destructive inspection.
For Sutami Hydropower Station
Results of evaluation for the existing generating equipment are shown in Table 4.1.2-2 and
considerations for the results for key parts such as turbine runner, generator stator windings and
control and protection panel are described below.
Table 4.1.2-2 Evaluation of Major Components of Generating Equipment (Sutami)
Evaluation Observation Component Part
A B C -Turbine runner
○
Spare runner is changed by other unit runner. The used runner had cavitations damage and repaired by welding, but depth of cavitations was very deep. Maximum use of repaired runner could be less than 3 times.
-Spiral casing ○
Spiral casing was embedded and then inspection was not carried out in this study.
-Guide vane ○
Inspection was not carried out in this study, but there could be corrosion because of about 40 year of operation.
-Inlet valve ○ Continuous water leakage was observed. -Turbine bearing ○ Bearing temperature is maintained within the allowance.
1 Water Turbine
-Governor ○
Type is very old mechanical type and spare parts are not available in the market.
-Stator ○
Breaking voltage has dropped and residual life was evaluated at 2 years in the examination conducted in 2004.
-Rotor ○
Taking the examination results of stator into consideration, the deterioration is the same as that of the stator.
-Thrust bearing ○
Bearing temperature is maintained within the allowance, but about 7 degrees increased above the initial temperature.
2 Generator
-AVR ○
Type is very old analog type and spare parts are not available in the market.
-Control panel ○
Type is very old analog type and spare parts are not available in the market. Automatic data logger to record operating status is not equipped.
3 Control and Protection
-Protection panel ○
Protection relays are old mechanical type and spare parts are not available in the market.
4 Transformer -Main transformer ○
Temperatures of winding and oil are maintained within the allowance.
(Prepared by JICA Study Team)

Final Report Chapter 4 Rehabilitation Works for Hydropower Stations
4 - 4
1) Evaluation of Turbine Runner
Turbine runner of unit 1 was inspected during the examination carried out in 2004 and
cavitations corrosion on the surface of the turbine blades were measured in terms of length,
width and depth. The results are shown in Appendix D. The measured depth of corrosions
ranges from 2.5 mm to 8 mm. The photograph of the corrosion is shown below. As seen in
the photos, corrosion was considered serious because of its substantial depth. Turbine runner
is usually evaluated whether the depth of corrosion exceeds 1 mm or not, if it exceeds, it is
judged whether repair by welding or replace depend on the degree. However, the number of
repair by welding is recommended to be less than 3 times to avoid deterioration due to welding
stress. The damaged turbine runner of Sutami was repaired by welding and used for the other
unit. Taking such deep cavitations corrosion into consideration, it is recommended to replace
with new runners to avoid a serious problem causing the turbine runner to crack.
Cavitations Corrosion at Outlet Side Detail of Cavitations Corrosion
(on Blade No. 11) (Size of Corrosion: 40L x 10W x 8.0D mm)
2) Evaluation of Generator (Stator Windings)
Comparing with the commissioning test records in 1973, the air cooler inlet air temperature at
full load (35 MW) increased by more than 10 C and the air cooler outlet air temperature
reached to 45 C which is a very high value for the cooling air of the generator. (Generally,
the temperature of cooling air entering into the generator should not be higher than 40 C.)
As a result, the stator winding temperatures increased by about 10 C. However, the cause of
this temperature increase has not been examined yet.
In 2004, the diagnostic tests were carried out to make an assessment of the residual life of the
stator winding. Consequently, the residual life of the stator windings is estimated at two or
three years by the following study.
For safe continuous operation of the generator, it is required that the breakdown voltage of the
stator winding should be higher than the safety operational level, which is obtained by the
formula: 2E + 1 kV where E is the normal operating voltage. In case of Sutami, the safety
operation level is calculated at 23 kV (as E=11kV).

Final Report Chapter 4 Rehabilitation Works for Hydropower Stations
4 - 5
The breakdown voltage of the stator winding of Sutami was estimated at 26.9 kV by the
measured values referring to the criteria of the Central Research Institute of Electric Power
Industry in Japan. According to the relationship between stator winding breakdown voltage
and operation year (Reference: Central Research Institute of Electric Power Industry in Japan),
it is estimated that the stator winding breakdown voltage of 26.9 kV will drop to 23 kV in two
years.
3) Evaluation of Control and Protection Panel
Control and protection panel was designed by the 1970’s technology and no computer system
was applied to the panels. Therefore, all operating control is made by manual operations and
all protection relays are mechanical type. Operating staff read and write down the data by hand
and then the operating data are input in a personal computer for logging. Selection switch of
temperature measurement in the control desk was repaired and control numbers of the
operation knob were worn and then the operator can not read the numbers, which may cause a
safety problem such as mal-operation. Therefore, the existing control and protection panel is
recommended to replace entirely with new system. Modern control and protection panel is
computerized system with redundant system to achieve a reliable operation and automatic data
logger is equipped in the system.
Moreover, PJB has a plan to replace the existing control and protection panels of 12
hydropower stations in the Brantas River basin under control by them including Sutami and
Wlingi with new system to control and manage all the hydropower stations from the head
office of PJB. Therefore, needs for replacement of the control and protection panel is very
high.
4) Recommended Scope of Rehabilitation Work
The scope of the rehabilitation work was studied based on the above evaluation. The
recommended scope involves replacements of the major component which was evaluated as
“A”. However, guide vanes and turbine bearings are also included in the scope since both
parts are closely related to design of the new turbine runner for improvement of turbine
performance. In order to maximize the performance and reliability of the new turbine runner,
these parts are also recommended to be replaced with a new design even they are evaluated as
“B”.
The recommended rehabilitation scope is shown as follows and illustrated in Figure 4.1.2-1.
i) For Water Turbine:
- Replacement of Turbine Runner, Guide Vane and Turbine Bearing
- Replacement of Inlet Valve
- Replacement of Governor
ii) For Generator:
- Replacement of Stator and Rotor

Final Report Chapter 4 Rehabilitation Works for Hydropower Stations
4 - 6
- Replacement of Thrust Bearing
- Replacement of AVR
iii) For Control and Protection Panel:
- Replacement of Control Panel and Operation Desk
- Replacement of Protection Panel
Figure 4.1.2-1 Scope of Rehabilitation Works for Sutami Hydropower Station (Prepared by JICA Study Team)
Concepts for introduction of new technology under the rehabilitation are described as follows.
Turbine Runner
Turbine runner and guide-vanes including facing plates and wearing ring for three units are
replaced with new ones. New runner is designed using modern computational fluid dynamics
(CFD) technology and the performance is verified through model test. Guide vane is
designed to make a smooth water passage in combination with the newly designed runner to
increase efficiency and performance of water turbine. Oil-less lubricating bushing for guide
vanes operating mechanism is recommended for easy maintenance. The outline of the
existing stay ring, which is a part of the embedded spiral case, is modified during installation
work to match the design of the new runner. Turbine guide bearing is also changed from the
existing cylinder type to the segment type.
Generator -Excitation System
Generator -Stator -Rotor
Generator -Thrust Bearing
Water Turbine -Turbine Runner -Guide Vane -Turbine Bearing
Inlet Valve
Control Panel Protection Panel
Governor AVR

Final Report Chapter 4 Rehabilitation Works for Hydropower Stations
4 - 7
Inlet Valve
The existing inlet valve is of the butterfly type and continuous water leakage from the seals is
observed. Inlet valve is changed into the through flow type which has less water loss than the
original type, to increase the water turbine efficiency.
Governor
The existing governor is of the mechanical type and no production has been made by any
manufacturer. The entire governor system is replaced with a modern digital governor with
proportional, integral and derivative (PID) computing functions to achieve quick response and
stable control. Main processor and power supply unit is recommended to be redundant in
hot-standby arrangement to achieve high reliability.
Generator Stator and Rotor
Stator and rotor are essential parts of the generator which convert mechanical energy to
electrical energy. Electrical insulation is required to be maintained in good conditions
throughout the operation. However, it is noted that the electrical insulation tends to
deteriorate proportionally with operating hours due to heat or vibration stress. Damage of
stator and/or rotor windings due to less electrical insulation is the most serious accident that
could occur, causing the machines to trip and long term stoppage is forced. Thus, stator
windings are recommended to be replaced with new ones. At the same time, stator frame,
rotor windings and air cooler is redesigned in order to realize the optimum performance of the
generator.
Thrust Bearing
Considering that the temperature of the existing thrust bearing has increased from the initial
stage, thrust bearing is recommended to be replaced with non-metallic material to provide low
friction coefficient, less wear resistance and reduction of loss. In order to avoid oil vapor
leakage from the thrust bearing, an advanced new technology of brush seal is also applied.
AVR
The existing AVR is of the analog type and no similar model has been made by any
manufacturer. The whole AVR system is replaced with a modern digital AVR to achieve
high speed computation, high control precision and stability and easy maintenance. Main
processor and power supply unit is recommended to be redundant in hot-standby arrangement
to achieve high reliability.
Control and Protection Panel
The existing control and protection panel is of the analog type with mechanical protection
relays and no similar production has been made by any manufacturer. The whole control
system is replaced with new distributed control system (DCS) with programmable logic
controller to perform automatic control, indications, protection and alarm management for
water turbine, generator, station service circuit with advanced technology including
Final Report Chapter 4 Rehabilitation Works for Hydropower Stations
4 - 8
control/monitoring desk, supervisory and control panel. Digital type electrical protective
relays are also used to achieve quick response, wide applications, wide setting ranges and
compact space. The electrical protective relays for the generating equipment are arranged in
dual configuration to enhance high reliability. Supervisory control and data acquisition
(SCADA) system is introduced to perform supervisory control of the whole components, data
trending, data logging, event recording and compiling of daily and monthly reports. The
SCADA system mitigates the operator’s daily duty and also be useful to check and analyze the
operating status of the whole power station. At the same time, the AC/DC power supply
system is recommended to be replaced with a new one to coordinate the new control and
protection system.
For Wlingi Hydropower Station
Results of evaluation for the existing generating equipment are shown in Table 4.1.2-3 and
considerations for the results for key parts such as turbine runner, stator windings, control and
protection panel etc. are described below.
Table 4.1.2-3 Evaluation of Major Components of Generating Equipment (Wlingi)
Evaluation Observation Component Part
A B C
-Turbine runner ○ No Spare runner is provided. The used runner had cavitations damage and repaired by welding. Maximum use of repaired runner could be less than 3 times.
-Spiral casing ○ Spiral casing was embedded and then inspection did not carry out in this study.
-Guide vane ○ Inspection did not carry out in this study, but there could be corrosion because of more than 30 year operation.
-Turbine bearing ○ Bearing temperature is maintained within the allowance.
1 Water Turbine
-Governor ○ Type is very old mechanical type and spare parts are not available in the market.
-Stator ○ Insulation resistance is measured and the values are plotted in a wide range from small to large. It is recommended to examine the breaking voltage of windings.
-Rotor ○ Detail examination is recommended as the same as stator windings.
-Thrust bearing ○ Bearing temperature is maintained within the allowance.
2 Generator
-AVR ○ Type is very old analog type and spare parts are not available in the market.
-Control panel ○ Type is very old analog type and spare parts are not available in the market. Automatic data logger to record operating status is not equipped.
3 Control and Protection
-Protection panel ○ Protection relays are old mechanical type and spare parts are not available in the market.
4 Transformer -Main transformer
○ Temperatures of winding and oil are maintained within the allowance.
(Prepared by JICA Study Team)
1) Evaluation of Turbine Runner
Turbine runner is of Kaplan type, which is applied for lower head turbine, and the turbine
blades can be moved by pressure oil to adjust water volume. Therefore, runner blades are

Final Report Chapter 4 Rehabilitation Works for Hydropower Stations
4 - 9
important and sensitive part for speed and load control against the power network fluctuation.
Taking long term operation more than 30 years into consideration, details examination
including pressured oil operating system for the runner blades is recommended.
2) Evaluation of Generator (Stator Windings)
The insulation resistances were plotted in the range between 235 M-ohm and 1.03 G-ohm for
stator windings and between 253 M-Ohm and 1.74 G-ohm for rotor windings according to data
of MO carried out by PJB in 2008. The measured values were randomly plotted in a wide
range from a small one to large one, which is considerable to have tendency of potential
insulation problem inside stator and rotor windings. Thus, the insulation resistance values
might indicate a sign of deteriorating electrical insulation.
3) Evaluation of Control and Protection Panel
Control and protection panel was designed by the 1970’s technology and no computer system
was applied to the panels. Therefore, all operating control is made by manual operations and
all protection relays are mechanical type. Operating staff read and write down the data by
hand and then the operating data are input in a personal computer for logging. Control
numbers of the operation knob were worn and then the operator can not read the numbers,
which may cause a safety problem such as mal-operation. Therefore, the existing control and
protection panel is recommended to replace entirely with new system. Modern control and
protection panel is computerized system with redundant system to achieve a reliable operation
and automatic data logger is equipped in the system.
4) Recommended Scope of Rehabilitation Work
Scope of the rehabilitation work was studied based on the above evaluation and the
recommended scope was considered that replacement of major components which are
evaluated as “A”. However, guide vanes and turbine bearings are also included in the scope
since both parts are closely related to design of new turbine runner and it is quite effective to
improve the performance of water turbine. In order to maximize the performance and
reliability of new turbine runner, those parts are also recommended to be replaced with new
design even they were evaluated as “B”.
On the other hand, AVR is excluded in the scope because the existing AVR is scheduled to be
replaced with new one with PJB fund.
Recommended rehabilitation scope is listed as follows and illustrated in Figure 4.1.2-2.
i) For Water Turbine:
- Replacement of Turbine Runner, Guide Vane and Turbine Bearing
- Replacement of Governor
ii) For Generator:
- Replacement of Stator and Rotor
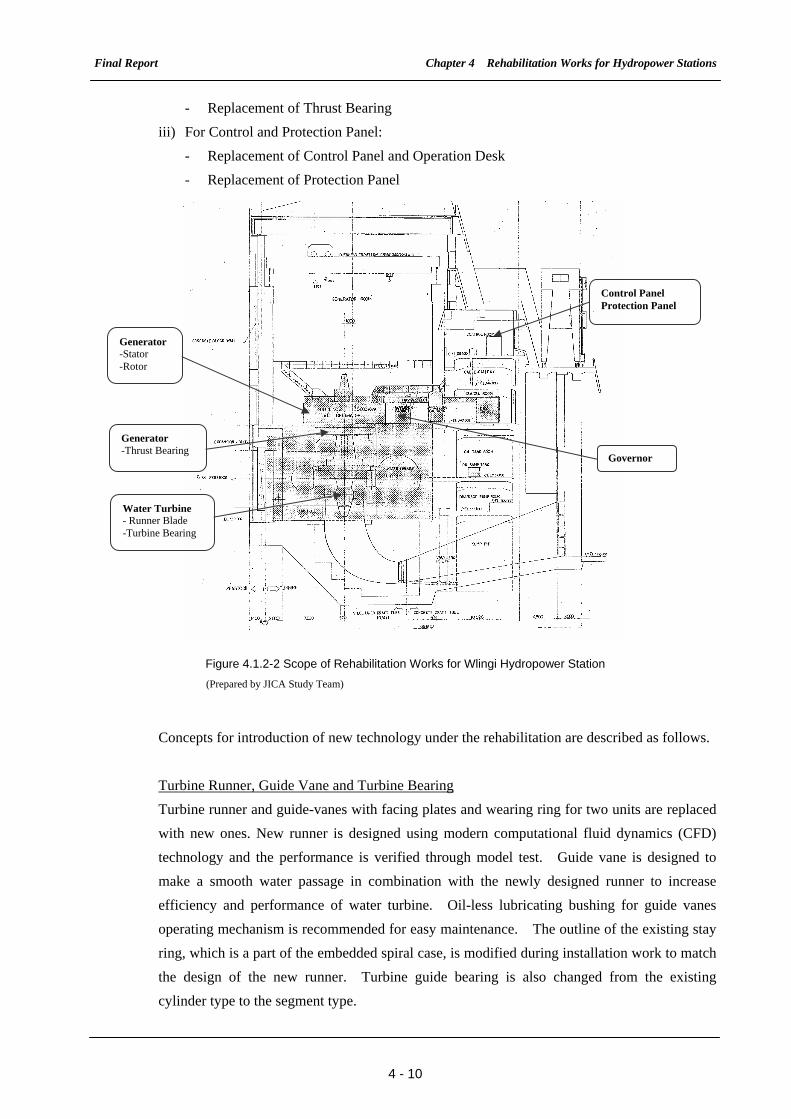
Final Report Chapter 4 Rehabilitation Works for Hydropower Stations
4 - 10
- Replacement of Thrust Bearing
iii) For Control and Protection Panel:
- Replacement of Control Panel and Operation Desk
- Replacement of Protection Panel
Figure 4.1.2-2 Scope of Rehabilitation Works for Wlingi Hydropower Station (Prepared by JICA Study Team)
Concepts for introduction of new technology under the rehabilitation are described as follows.
Turbine Runner, Guide Vane and Turbine Bearing
Turbine runner and guide-vanes with facing plates and wearing ring for two units are replaced
with new ones. New runner is designed using modern computational fluid dynamics (CFD)
technology and the performance is verified through model test. Guide vane is designed to
make a smooth water passage in combination with the newly designed runner to increase
efficiency and performance of water turbine. Oil-less lubricating bushing for guide vanes
operating mechanism is recommended for easy maintenance. The outline of the existing stay
ring, which is a part of the embedded spiral case, is modified during installation work to match
the design of the new runner. Turbine guide bearing is also changed from the existing
cylinder type to the segment type.
Control Panel Protection Panel
Governor
Generator -Stator -Rotor
Generator -Thrust Bearing
Water Turbine - Runner Blade -Turbine Bearing
Final Report Chapter 4 Rehabilitation Works for Hydropower Stations
4 - 11
Since the existing Kaplan runner is the oil filled type inside the runner hub, it is recommended
to change to the water filled type so that the runner blade operating mechanism is immersed in
water with anti-rust liquid instead of only water.
Governor
As the same as Sutami, the existing governor is of the mechanical type and no production has
been made by any manufacturer. The entire governor system is replaced with a modern
digital governor with proportional, integral and derivative (PID) computing functions to
achieve quick response and stable control. Main processor and power supply unit is
recommended to be redundant in hot-standby arrangement to achieve high reliability.
Stator and Rotor
Stator and rotor are essential parts of the generator which convert mechanical energy to
electrical energy. Electrical insulation is required to be maintained in good conditions
throughout the operation. However, it is noted that electrical insulation tends to deteriorate
proportionally with operating hours due to heat or vibration stress. Damage of stator and/or
rotor windings due to less electrical insulation is the most serious accident that could occur,
causing the machines to trip and long term stoppage is forced. Stator windings are
recommended to be replaced with new ones. At the same time, stator frame, rotor windings
and air cooler should be redesigned in order to realize the optimum performance of the
generator.
Thrust Bearing
Although temperatures of the existing thrust bearing are within tolerances, thrust bearing is
recommended to be replaced with non-metallic material to provide low friction coefficient,
less wear resistance and reduction of loss. In order to avoid oil vapor leakage from the thrust
bearing, an advanced new technology of brush seal is also applied.
Control and Protection Panel
The existing control and protection panel is of the analog type with mechanical protection
relays and no similar production has been made by any manufacturer. The whole control
system is replaced with new DCS with programmable logic controller to perform automatic
control, indications, protection and alarm management for water turbine, generator, station
service circuit with advanced technology including control/monitoring desk and supervisory
and control panel. Digital type electrical protective relays are also used to achieve quick
response, wide applications, wide setting ranges and compact space. The electrical protective
relays for the generating equipment are arranged in dual configuration to enhance high
reliability. SCADA system is introduced to perform supervisory control of the whole
components, data trending, data logging, event recording and compiling of daily and monthly
reports. The SCADA system mitigates the operator’s daily duty and also be useful to check
and analyze the operating status of the whole power station. At the same time, the AC/DC
Final Report Chapter 4 Rehabilitation Works for Hydropower Stations
4 - 12
power supply system is recommended to be replaced with a new one to coordinate the new
control and protection system.
4.1.3 Effectiveness of the Rehabilitation Works
(1) Stable and Reliable Power Supply in the Regional Area
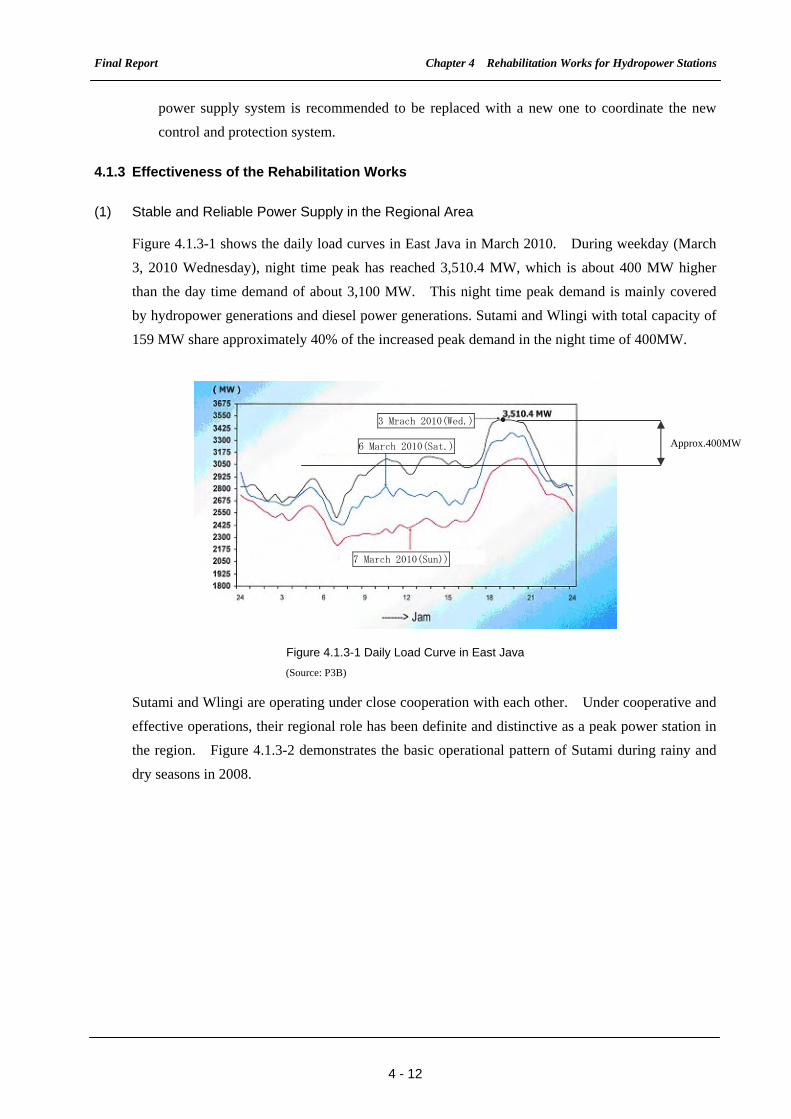
Figure 4.1.3-1 shows the daily load curves in East Java in March 2010. During weekday (March
3, 2010 Wednesday), night time peak has reached 3,510.4 MW, which is about 400 MW higher
than the day time demand of about 3,100 MW. This night time peak demand is mainly covered
by hydropower generations and diesel power generations. Sutami and Wlingi with total capacity of
159 MW share approximately 40% of the increased peak demand in the night time of 400MW.
Figure 4.1.3-1 Daily Load Curve in East Java (Source: P3B)
Sutami and Wlingi are operating under close cooperation with each other. Under cooperative and
effective operations, their regional role has been definite and distinctive as a peak power station in
the region. Figure 4.1.3-2 demonstrates the basic operational pattern of Sutami during rainy and
dry seasons in 2008.
3 Mrach 2010(Wed.)
6 March 2010(Sat.)
7 March 2010(Sun))
Approx.400MW

Final Report Chapter 4 Rehabilitation Works for Hydropower Stations
4 - 13
Operation curve of Sutami HPS in 2008(Rainy_Season)
0
20
40
60
80
100
120
0.302.00
3.305.00
6.308.00
9.3011.0
012.3
014.0
015.3
017.0
018.3
020.0
021.3
023.0
0
(Hour)
(MW)
(Rainy_Season_total)
Operation curve of Sutami HPS in 2008(Dry_Season)
0
20
40
60
80
100
120
0.302.00
3.305.00
6.308.00
9.3011.0
012.3
014.0
015.3
017.0
018.3
020.0
021.3
023.0
0
(Hour)
(MW)
(Dry_Season_Total)
Figure 4.1.3-2 Operational Pattern Curve of Sutami Hydropower Station in 2008 (Source: PJB)
Based on the reservoir operational plan, the night time peak power supply primarily takes control
during both rainy and dry seasons. Moreover, during the rainy season except for night time peak
two generator units are basically operated with as much water as available to generate power
during daytime. During dry season, only one unit is essentially operated.
The adjustment for the night time peak demand is significantly large during the dry season. From
around 5 p.m., all of the three units are fully operated. At around this same time, Wlingi is also
fully operated in collaboration with Sutami in order to supply peak power.
Figure 4.1.3-3 demonstrates the operational pattern curves of the combined outputs of Sutami and
Wlingi during rainy and dry seasons in 2008.
This figure clarifies that both hydropower stations were operated so as to cover their respective
outputs. In particular, both stations have adjusted to the night time peak demand at the same time.
0
20
40
60
80
100
120
140
160
0.30 2.30 4.30 6.30 8.30 10.30 12.30 14.30 16.30 18.30 20.30 22.30(Hour)
(MW)
(Rainy_Season_Total)
(Dry_Season_Total)
Figure 4.1.3-3 Operational Pattern Curve of Sutami and Wlingi hydro power stations in 2008 (Source: PJB)
Approx.100MW

Final Report Chapter 4 Rehabilitation Works for Hydropower Stations
4 - 14
According to the records in the dry season, the output of Sutami and Wlingi was increased by
100MW as much as possible in order to catch up with the night time peak, which accounts 25% of
the increase of night time peak in the whole East java. Judging from this fact, Sutami and Wlingi
are inevitable power stations in terms of night time peak-adjustment in the region.
Furthermore, it is important to ensure the best allocation of power supply in accordance with daily
load in terms of maintaining stable and reliable power supply considering the characteristic of
power sources. Sutami and Wlingi hydropower station are functioning as power stations which
supply the power for peak and middle loads. At present, the power supply from thermal power
stations are confined in the region due to interruption of 150kV transmission line, which means that
the supplying power for base load has to be strengthened. It is required that both stations are
functioning so as to supplement portion of base load in addition to the power supply of middle and
peak loads. Thus, the rehabilitation works will highly contribute to maintain a stable and reliable
power supply to the regional area.
In addition, Sutami has a function of black start of Paiton thermal power station. When a power
plant starts operation, the electricity from its own power source (i.e., diesel engine generator) or
from external power source is required. The large scale thermal plant such as Paiton requires a
huge amount of electricity for starting. The existence of Sutami is justified being a power source to
Paiton for the starting. Therefore, Sutami contributes significantly to the reliability and stability of
the 500 kV Java-Bali power transmission network.
(2) Performance Improvement
As a performance improvement of the generating equipment by the rehabilitation works, increase
of efficiency of the water turbine is expected. Water turbine is composed of spiral casing, guide
vanes and turbine runner, which formulate a water passage. Usually, efficiency of the water
turbine is gradually decreasing by increase of friction loss due to corrosions of the water passage,
and corrosions of the turbine runner is most effective to the efficiency since it directly convert the
hydro energy to the mechanical energy. Potential efficiency gains expected by turbine runner
replacement are guided by IEC 62256 depending on the age of unit as shown in Table 4.1.3-1.
Table 4.1.3-1 Potential Total Gain in Efficiency from the Replacement of a Francis Runner
Francis Turbine Potential Runner Efficiency Gains
Age of unit 60 years 40 years 20 years
1.Profile improvement 2.2 1.0 0.5
2.Restoration of surface condition 1.0 0.5 0.25
3.Reduction of seal loss 1.0 0.75 0.5
Total potential gain 4.2 2.25 1.25
(Source: IEC 62256)
Both Sutami and Wlingi are nearly 40 years old. Thus, 2.25% gain can be expected by the runner
Final Report Chapter 4 Rehabilitation Works for Hydropower Stations
4 - 15
replacement. In addition, according to IEC 62256, potential additional efficiency improvement by
replacement of guide vanes is about 0.2 to 1.0 %. Taking these potential gains into consideration,
total turbine efficiency is expected to increase by about 3%.
On the other hand, increase of the generator efficiency is not so expected by replacement of stator
and rotor windings since the electrical insulation is only expected to be improved by the
replacement.
(3) Power Generation Benefit
Dependable Output and Power Generation
After completion of the rehabilitation work, life time of the generating equipment is expected to
extend and the efficiency is also increased by the performance improvement. In order to estimate
the power generation benefit after the rehabilitation work, the dependable output and the power
generation were calculated respectively in accordance with data of runoff inflow to Sutami
Reservoir from 2004 to 2009.
For comparison of the benefit, calculations for ‘Without Project (without rehabilitation)’ and ‘With
Project (with rehabilitation)’ have been carried out and details of the calculation are shown in
Appendix E. In this study, ‘Without Project’ and ‘With Project’ are considered with the following
assumptions.
Without Project
‘Without Project’ means that the rehabilitation works are not implemented and the generating
equipment stop its operation at the expected life period, that is, 44 years1 is assumed after the
initial operation. In addition, the following two cases are considered for “Without Project”
Case-1: The existing generating equipment stop due to a severe problem on the major
components, e.g., short circuit of generator stator windings or cracking of turbine runner,
after 44 years from the initial operation, namely, unit 1 in 2017 and the other 2 units in
2020 and they are no longer operated.
Case-2: The existing generating equipment stop due to a severe problem on the major
components, e.g., short circuit of generator stator windings or cracking of turbine runner,
after 44 years from the initial operation, namely, unit 1 in 2017 and the other 2 units in
2020. The damaged components will be rehabilitated after the accident and for this study
at least 5 years outage is assumed to be required for the rehabilitation including financial
procurement, design, tender, equipment procurement, transportation and installation,
which means total 8 years is required for the recovery of the whole 3 units (unit 1 restart
in 2022 and the other units restart in 2024).
1 44 years is assumed by taking twice of the legal life time of 22 years and referring IEC 62256 in which expected life time for Francis turbine is
described in between 30 to 50 years.

Final Report Chapter 4 Rehabilitation Works for Hydropower Stations
4 - 16
With Project
‘With Project’ means that the rehabilitation work start in 2011 with the financial assistance of
Japanese ODA and total implementation period is assumed in 5 years for three units including
consultancy services, tender, design, equipment procurement, transportation and installation. The
installation work of the first unit will start in 2014 and complete replacements of three units in
2017.2
The operation pattern for ‘Without Project’ and ‘With Project’ is shown in Table 4.1.3-2.
Table 4.1.3-2 Combination of Operated Generating Equipment
Without Project Case 1 Case 2
With Project Year
Existing unit
New unit Existing unit
New unit Existing unit
New unit.
2014 3 - 3 - 2 -
2015 3 - 3 - 1 1
2016 3 - 3 - - 2
2017 2 - 2 - - 3
2018 2 - 2 - - 3
2019 2 - 2 - - 3
2020 - - - - - 3
2021 - - - - - 3
2022 - - - 1 - 3
2023 - - - 1 - 3
2024 - - - 1 - 3
2025 - - - 3 - 3
2026 - - - 3 - 3
…… - - - 3 - 3
2060 - - - 3 - 3
(Prepared by JICA Study Team)
The results of the calculation for the dependable output and the power generation for ‘Without
Project’ and ‘With Project’ scenario are shown in Table 4.1.3-3. The calculations under ‘With
Project’ and ‘Without Project-Case 2’ are considered using total efficiency with 3% increase after
the completion of rehabilitation works. Figure 4.1.3-4 shows comparison of the power generation
for ‘Without Project’ and ‘With Project’.
2 For economic and financial analysis purpose, it is assumed that each unit will be returned to service every year after the
rehabilitation.

Final Report Chapter 4 Rehabilitation Works for Hydropower Stations
4 - 17
Table 4.1.3-3 Power Generation Simulation Results in Sutami
Without Project Case 1 Case 2
With Project
Power Generation (GWh) Power Generation
(GWh) Power Generation (GWh)
Year Dependable Output (MW) Primary Secondary Total
Dep. Output.(MW) Prm. Sec. Tot.
Dep. Output. (MW) Prm. Sec. Tot.
1976 80.0 215 210 425 - - - -
…… …… …… …… …… …… …… …… …… …… …… …… ……
2014 71,2 202 225 427 71,2 202 225 427 67.9 159 255 414
2015 71.1 202 225 427 71.1 202 225 427 68.9 161 259 420
2016 71.0 202 225 427 71.0 202 225 427 69.9 164 263 427
2017 67.9 159 255 414 67.9 159 255 414 72.9 208 232 440
2018 67.9 159 255 414 67.9 159 255 414 72.9 207 233 440
2019 67.9 159 255 414 67.9 159 255 414 72.6 207 233 440
2020 - - - - - - - - 72.5 207 233 440
2021 - - - - - - - - 72.5 207 233 440
2022 - - - - 37.2 84 223 307 72.3 207 233 440
2023 - - - - 37.2 84 223 307 72.0 206 234 440
2024 - - - - 37.2 84 223 307 72.0 206 234 440
2025 - - - - 71.8 206 234 440 71.8 206 234 440
2026 - - - - 71.7 206 234 440 71.7 206 234 440
…… …… …… …… …… …… …… …… …… …… …… …… ……
2060 - - - - 67.3 201 240 440 67.3 201 240 440
(Prepared by JICA Study Team)
0
50
100
150
200
250
300
350
400
450
500
2011 2012 2013 2014 2015 2016 2017 2018 2019 2020 2021 2022 2023 2024 2025 2026 2027 2028 2029 2030 2060 2061
Tot
al E
nerg
y(G
WH
)
Total Energy(GWh) with Project
WithoutProjectCase 1
Without ProjectCase 2
Project Starts
Design,Tender andProcurement
Installation
414GWh 420GWh
414GWh
427GWh
440GWh
1973 1976
425GWh
427GWh
Figure 4.1.3-4 Power Generation for Without Project and With Project in Sutami (Prepared by JICA Study Team)
As seen in the above table and figure, it can be said that the power generation in ‘With Project’
during the rehabilitation work is reduced by only 13 GWh (427 GWh-414 GWh) because the

Final Report Chapter 4 Rehabilitation Works for Hydropower Stations
4 - 18
available water for generation is nearly same even two or three units operation.
The power generation benefit of Case-1 is much higher than Case-2 since the expected power
generation (440 GWh) after the rehabilitation work account as benefit during the whole period of
new life time.
On the other hand, in case of Case-2, the power generation benefit is differences of the power
generations in the period of rehabilitation work of damaged components between 2017 and 2024,
because the power generation in ‘Without Project’ can be restored after the rehabilitation.
4.1.4 Project Financial Cost
The project financial cost for the recommended rehabilitation works is estimated with the direct
cost and the indirect cost, and those are estimated with the following considerations.
(1) Direct Cost
The equipment cost for each component to be rehabilitated for Sutami and Wlingi was estimated
based on the estimated cost submitted by the manufacturer at the time of application for the JBIC
export credit line in 2004. The cost was reviewed for this study taking into account for recent
similar hydropower project and international tendering. In addition to the equipment cost, costs
for foreign supervisors during the site installation works and site erection work were included in
the direct cost. The erection work is estimated as 10% of the total equipment cost.
(2) Indirect Cost
The indirect cost is estimated in the following assumptions:
1) The engineering services (E/S) is 8 % of the direct cost.
2) Project administration cost is 3 % of the direct cost.
3) Physical contingency is 15 % of the direct cost, engineering services and project
administration cost in the indirect cost.
4) Price contingencies is estimated referring to the similar projects in Indonesia as follows:
Foreign currency (FC) is 1.3 % per annum, local currency (LC) is 3.2 % per annum
(3) Project Financial Cost
The estimated project financial cost for Sutami and Wlingi is shown in Table 4.1.4-1 and
summarized as follows with the exchange rate of 1US$=94.07 JPY and 1Rp.=0.01143 JPY (as of
April 30, 2010).
1) For Sutami hydropower station
FC: JPY 3,335x106, LC: Rp. 30,059 x106
Equivalent total: JPY 3,679x106

Final Report Chapter 4 Rehabilitation Works for Hydropower Stations
4 - 19
2) For Wlingi hydropower station
FC: JPY 2,561x106, LC: Rp. 22,742 x106
Equivalent total: JPY 2,821x106
3) For Sutami and Wlingi hydropower stations
FC: JPY 5,896x106, LC: Rp. 52,801 x106
Equivalent total: JPY 6,500x106
Table 4.1.4-1 Estimated Project Financial Cost for Sutami and Wlingi 1Rp.= 0.01143
1.Sutami
Category Item to be Rehabilitated Quantity Unit Unit Cost Cost Remarks
FC(JPY) LC(IDR) FC(JPY) LC(IDR)1.Direct Cost
1 Hydromechnical Equipment Local control cabinets 3 Sets 750,000 2,250,000Remote control cabinets 1 Sets 500,000 500,000Demolishing and installation 1 LS 87,489,000
Sub-total 01 2,750,000 87,489,0002 Generating Equipment Turbine 3 Sets 164,000,000 492,000,000
Inlet valve 3 Sets 110,000,000 330,000,000Governor 3 Sets 54,000,000 162,000,000Generator 3 Sets 337,000,000 1,011,000,000Exciter System 3 Sets 44,000,000 132,000,000Control, Protection and Monitoring Sys 3 Sets 118,000,000 354,000,000Necessary Parts for Overhaul 3 sets 6,000,000 18,000,000Supervising for Rehabilitation 1 Lot 48,000,000Site Erection Work 1 LS 0 21,863,000,000
Sub-total 02 2,547,000,000 21,863,000,0003 Transmission and Substation Disconnecting Switch(PJB) 3 Sets 4,000,000 12,000,000
Disconnecting Switch(P3B) 9 Sets 4,000,000 36,000,000Control equipment 1 Lot 5,000,000Site Erection Work 1 LS 463,692,000
Sub-total 03 53,000,000 463,692,0004 Civil N/A
Total 1 2,602,750,000 22,414,181,0002,858,944,000
2. Indirect Cost1 Engineering services LS 208,220,000 1,793,134,000 8 % of Total 12 Project administration LS3 Physical contingencies LS 421,646,000 3,631,097,000 15 % of Total 1 and 01,02 of Indirect Cos4 Price contingencies LS 102,833,000 2,221,352,000 FC; 1.3 %, LC; 3.2 %
Total 2 732,699,000 7,645,583,000820,088,000
Grand Total 3,335,449,000 30,059,764,0003,679,032,000
2. WlingiCategory Item to be Rehabilitated Quantity Unit Unit Cost Cost Remarks
FC(JPY) LC(IDR) FC(JPY) LC(IDR)1.Direct Cost
1 Generating Equipment Turbine 2 Sets 309,000,000 618,000,000Governor 2 Sets 60,000,000 120,000,000Generator 2 Sets 370,000,000 740,000,000Control, Protection and Monitoring Sys 2 Sets 220,000,000 440,000,000Necessary Parts for Overhaul 1 Lot 20,000,000Supervising for Rehabilitation 2 Sets 16,000,000 32,000,000Site Erection Work 1 LS 16,955,000,000
Sub-total 01 1,970,000,000 16,955,000,0002 Transmission and Substation Disconnecting Switch(PJB) 2 Sets 4,000,000 8,000,000
Disconnecting Switch(P3B) 4 Sets 4,000,000 16,000,000Control Equipment 1 Lot 5,000,000Site Erection Work 1 LS 2900000
Sub-total 02 29,000,000 2,900,0003 Civil N/A
Total 1 1,999,000,000 16,957,900,0002,192,829,000
2. Indirect Cost1 Engineering services LS 159,920,000 1,356,632,000 8 % of Total 12 Project administration LS3 Physical contingencies LS 323,838,000 2,747,180,000 15 % of Total 1 and 01,02 of Indirect Cos4 Price contingencies LS 78,979,000 1,680,609,000 FC; 1.3 %, LC; 3.2 %
Total 2 562,737,000 5,784,421,000628,853,000
Grand Total 2,561,737,000 22,742,321,0002,821,682,000
(Prepared by JICA Study Team)
4.1.5 Implementation of Rehabilitation Works
(1) Implementation Schedule of the Rehabilitation Works
Schedule of the rehabilitation works is proposed as shown in Figure 4.1.5-1.
Final Report Chapter 4 Rehabilitation Works for Hydropower Stations
4 - 20
1st Year 2nd Year 3rd Year 4th Year 5th Year
(2011) (2012) (2013) (2014) (2015)
1. Consultancy Services
1.1 Tendering for Consultant (ICB)
1.2 Design and Preparation of Tender Documents
1.3 Construction Supervision
2. Rehabilitation Works
2.1 Tendering for Contractor (ICB)
2.2 Design and Manufacturing
2.3 Transportation
2.4 Unit 1 Rehabilitation for Sutami
2.5 Unit 2 Rehabilitation for Sutami
2.6 Unit 3 Rehabilitation for Sutami
2.7 Unit 1 Rehabilitation for Wlingi
2.8 Unit 2 Rehabilitation for Wlingi
Items
Figure 4.1.5-1 Implementation Schedule for Rehabilitation Works for Sutami and Wlingi (Prepared by JICA Study Team)
The implementation period is estimated at five (5) years in total including the consultancy service
and the international competitive bidding (ICB) for the rehabilitation works.
Procurement of equipment including design, model test, manufacturing, factory test and
transportation will take around 18 months from the date of contractual commencement. Site
rehabilitation works including dismantling the existing equipment, installation of new equipment
and commissioning test is estimated to take around 6 months for each unit. The rehabilitation
works is recommended to carry out unit by unit to minimize the power generation loss during the
works, therefore total 18 months are taken for the whole site works. For the execution of site
works, the installation work is proposed to be done by the power station personnel of PJB while the
manufacturer provide necessary technical supervisors for the smooth execution of the rehabilitation
works.
The rehabilitation works for Wlingi is recommended to carry out at the same time as Sutami in
order to shorten the period of the rehabilitation works and also minimize outage periods due to the
rehabilitation works.
(2) Implementation Agencies
Sutami and Wlingi hydropower stations are operated and maintained by PJB at the moment.
Therefore, the implementation agency for the rehabilitation works could be PJB under management
of PLN.

Final Report Chapter 4 Rehabilitation Works for Hydropower Stations
4 - 21
4.2 Soedirman (Mrica) Hydropower Station
4.2.1 General
Soedirman (Mrica) Hydropower Station is located on the Serayu River flowing near Banjarnegara
City in the Central Java province. The principal features and the general layout of the facilities are
shown in Appendix B
k
Soedirman (Mrica) Hydropower Station (Source: Indonesia Power)
(1) Present Situation of Reservoir Sedimentation
The previous study report
as shown in ANNEX C
concluded that 80% of the
gross storage volume of the
Mrica reservoir will be
filled with sediment by
2014 considering an annual
sediment trapping volume
of 4.2 MCM/year.
According to the simple
prediction, the reservoir will also be filled up to the high water level (HWL) in 2021. If so,
irrigation water supply to the downstream area (10,000 ha) which is the primary purpose of the
reservoir, and power generation will become difficult. Further, securing the dam safety will become
questionable. Under the above circumstances, it is very urgent to mitigate the sedimentation
problems in the Mrica reservoir from the regional as well as the national perspectives.
Differences between initial storage volume and current volume in the Mrica Reservoir in each are
Powerhouse
Drawdown Culvert
Main dam
Intake
Reservoir
Spillway
Figure 4.2.1-1 Prediction of Remaining Useful Life of Mrica Reservoir
(Source: Sedimentation Control: Part II. Intensive Measures inside of the Mrica Riservoir, Central Java)
Final Report Chapter 4 Rehabilitation Works for Hydropower Stations
4 - 22
shown in Table 4.2.2-1.
Table 4.2.1-1 Difference Ratio between Initial Storage Volume and Current Volume in Mrica Reservoir
Storage Volume Initial in 1989Observed in
2010 Observed
/Initial Note
Dead Storage Volume (m3) 101.99 23.90 23% Below EL.214.50
Effective Storage Volume(m3)
46.30 32.00 69% EL.214.50 to 231.00
Flood Storage Volume(m3) 35.47 35.47 100% EL.231.00 to 234.50
(Source of data: Indonesia Power)
(2) Present Countermeasures against Reservoir Sedimentation
IP and the local government have carried out several activities related to the sediment problem in
the Serayu River basin. The on-going countermeasures by IP and the local government are
described below.
Long-term Countermeasure
- Greenery program: Greenery program was initiated in 1996 and green-belt surrounding the
reservoir in the Meraw and Serayu watersheds has been carried out.
- Elucidation to farmers : The local government of Wonosobo promotes various elucidations to
farmers, propose reforestation policy and cultivation program of mini papaya “carica” at the
plateau and surrounding areas. In November 2009, IP conducted a “field course” which aimed
to thoroughly educate farmers on sprouting method, proper land plowing cultivation practice,
and plant preservation, up to harvesting. Through this course, about 6,000 seedlings of
coffee and albazia trees were provided to farmers.
- Introduction of new practices on potato field cultivation: One of the main reasons of sediment
production in the upper reach of the Serayu and Merawu river basins is that potatoes are
cultivated on the hill side area without terracing. The local government has carried out
numerous studies and researchers and introduced new practices on potato field cultivation.
Medium-term Countermeasure
- Sabo dam construction: In order to trap produced sediment in the Serayu, Merawu and other
small river basins, sabo dam construction has been proposed by the Center for Water Research
and Development, Sabo Center Yogyakarta. The sabo dam construction project is on-going.
Six sabo dams have been constructed and another 15 are being planned.
Short-term Countermeasure
- Small scale dredging work: IP has carried out dredging work about 0.05 to 0.1 MCM/year.
Dredged material has been utilized as the construction material by the local residents.
- Sediment flushing operation: The Mrica Dam is equipped with drawdown culvert so as to flush

Final Report Chapter 4 Rehabilitation Works for Hydropower Stations
4 - 23
sediment from the reservoir and to lower the water level during emergency case. The profile
of the drawdown culvert intake is shown in Figure 4.2.1-2. IP has carried out sediment
flushing operation through the drawdown culvert from 1996 up to now. Annual average
volume of sediment flushing is about 75,000 m3. Yearly sediment flushing volume from the
drawdown culvert is shown in Table 4.2.1-2. According to the IP’s estimation, sediment
flushing volume will drastically increase from 2010 to 2014, since IP assumed that the toe of
the sediment deposit slope will reach the drawdown culvert by 2014.
- Modification of reservoir operation: IP has modified the reservoir operation rule of the Mrica
reservoir. The operation rule established the water level restriction during the rainy season
from December to April so as to minimize the spill out discharge from the reservoir and to
prevent sedimentation above EL.228.00 m.
224.00
225.00
226.00
227.00
228.00
229.00
230.00
231.00
232.00
Jan Feb Apr May Jul Sep Oct Dec
Date
Wat
er L
evel
(m)
Target Water Level
Obserbed Water Level
HWL
LWL
Figure 4.2.1-3 Target Water Level and Observed Water Level (Prepared by JICA Study Team based on observation record and estimation results by IP)
Figure 4.2.1-2 Profile of Drawdown Culvert Intake(Source: Indonesia Power)
YearSediment Fulusing Volume
(MCM)Note
1996 7,733199719981999 24,6282000 33,9542001 66,6582002 17,8842003 16,7832004 403,8192005 80,1192006 34,0982007 54,5012008 58,3852009 94,8422010 750,0002011 1,250,0002012 2,000,0002013 3,000,0002014 4,200,000
Obs
erve
dP
lann
ed
Table 4.2.1-2 Sediment Flushing Volume
(Source: Indonesia Power)
Month
Final Report Chapter 4 Rehabilitation Works for Hydropower Stations
4 - 24
The above countermeasures are basically appropriate. However, there are some difficulties in
getting the expected results to address the sedimentation problems. The major reasons for such
difficulties are as described below;
Difficulty in Reforestation and Introduction of New Cultivation Program
0
1
2
3
4
5
6
7
8
9
10
1989 1990 1991 1992 1993 1994 1995 1996 1997 1998 1999 2000 2001 2002 2003 2004 2005 2006 2007 2008 2009
Year
Sedi
men
t Vol
ume
(MC
M
0
1
2
3
4
5
6
7
8
9
10Trapped Sediment in Reservoir *1)
Assumed *2) Sediment Inflow
5yr. mov. ave. of Assumed Sediment Inflow
Average of Assumed Sediment Inflow
Figure 4.2.1-4 Trapped Sediment Record and Assumed Sediment Inflow in the Reservoir (Prepared by JICA Study Team based on observation record by IP)
*1): Based on observed record by Indonesia Power
*2): Assumed by Brune’s middle curve formula. Calculation of sediment inflow is as described in Table BA1.1 of Annex B.
As shown in Figure 4.2.1-2, the sediment inflow to the reservoir has not been reduced greatly by
means of the above-described long-term countermeasures. The main reason is as listed below:
- The high sediment production in the Serayu River basin has been triggered by large scale
deforestation for developing cultivation area. In order to reduce sediment production, drastic
reforestation program should be required with new job creation for the local farmers utilizing
the cultivation area. However, it is difficult for the local government and IP to perform the
program.
- It takes time to introduce new practices on potato field cultivation instead of the traditional
practice due to cultural and economical reasons of the local farmers.
Low Progress and Low Trapping Capacity of the Sabo Dam
- Due to financial reasons of the local government and IP, the sabo dam construction has been
delayed.
- The developed sabo dam storage capacity (less than 0.5 MCM) is less than 10% of the
assumed annual sediment production (5.6 MCM, as described in Table BA1.1 of Annex B) in
the watershed.
Low Effectiveness of Sediment Flushing Operation
The effectiveness of the above countermeasure is too small to recover the storage volume or to

Final Report Chapter 4 Rehabilitation Works for Hydropower Stations
4 - 26
- To execute prompt construction and effective management of the sabo dam, IP considers that
the assistance of the Ministry of the Public Works is required.
As described the above, sedimentation problem in the Mrica Reservoir is related to the sediment
management in the Serayu River basin closely. Hence the sedimentation countermeasure in the
reservoir should be carried out as part of the Watershed sediment management in the basin. In
addition to the above findings, it is recommended to execute the following measures in order to
achieve sustainable watershed sediment management in the Serayu River basin.
- The riverbed of the Serayu River at the bridge, located about 60 km downstream of the Mrica
dam, has been degraded by around 5 m as shown in Figure 4.2.1-6. The degradation has been
caused by the sediment trapping at the Mrica Dam. To achieve sustainable watershed
sediment management in the Serayu river basin, comprehensive sediment balance study and
management plan shall be conducted taking into consideration of environmental, social aspect,
technical, and economical aspects.
- To perform effective sediment control and to maintain the sustainable watershed sediment
management, a special organization of the Serayu watershed management, which consists of
GoI, the local government, IP, and stakeholders along the river basin, shall be established.
- To execute the sustainable watershed sediment management and to obtain stakeholder’s
consent, the sediment management should aim to achieve comprehensive benefit over the
watershed.
Figure 4.2.1-6 Degradation of the Riverbed at Downstream of Mrica Dam (Prepared by JICA Study Team based on pictures provided by IP)
Soedirman Dam
Degradation of Riverbed Bridge
Final Report Chapter 4 Rehabilitation Works for Hydropower Stations
4 - 27
4.2.2 Sustainable Watershed Sediment Management
(1) Strategy for Watershed Sediment Management
Based on the considerations as described in Sub-clause 4.2.1, the sedimentation problems of the
Mrica Reservoir shall be solved in terms of the sediment management over the Serayu River basin.
This section describes the strategy of the sustainable watershed sediment management over the
Serayu River basin.
The objectives of watershed sediment management over the Serayu River basin are: 1) to restore
normal function of the watershed by means of balancing the sediment flow between upstream and
downstream of the reservoir, 2) to achieve sustainable water utilization of reservoir by means of
recovering and keeping storage capacity, and 3) to keep the safety of the dam by means of
preventing intake plugging due to sediment.
As a commonly practiced in the world in recent years, the watershed sediment management is
classified into three methods, namely: 1) to reduce sediment inflow to the reservoir, 2) to pass
the sediment inflow directly to the downstream of the reservoir, and 3) to recover storage
volume. So as to achieve the above-described objectives, all the sediment management methods
shall be required over the Serayu River basin.
The watershed sediment management shall be executed to minimize the negative impact due to
sediment discharge to the downstream watershed area and to maximize positive impact
through sediment balance over the watershed.
Final Report Chapter 4 Rehabilitation Works for Hydropower Stations
4 - 28
Strategy of Watershed Sediment Management
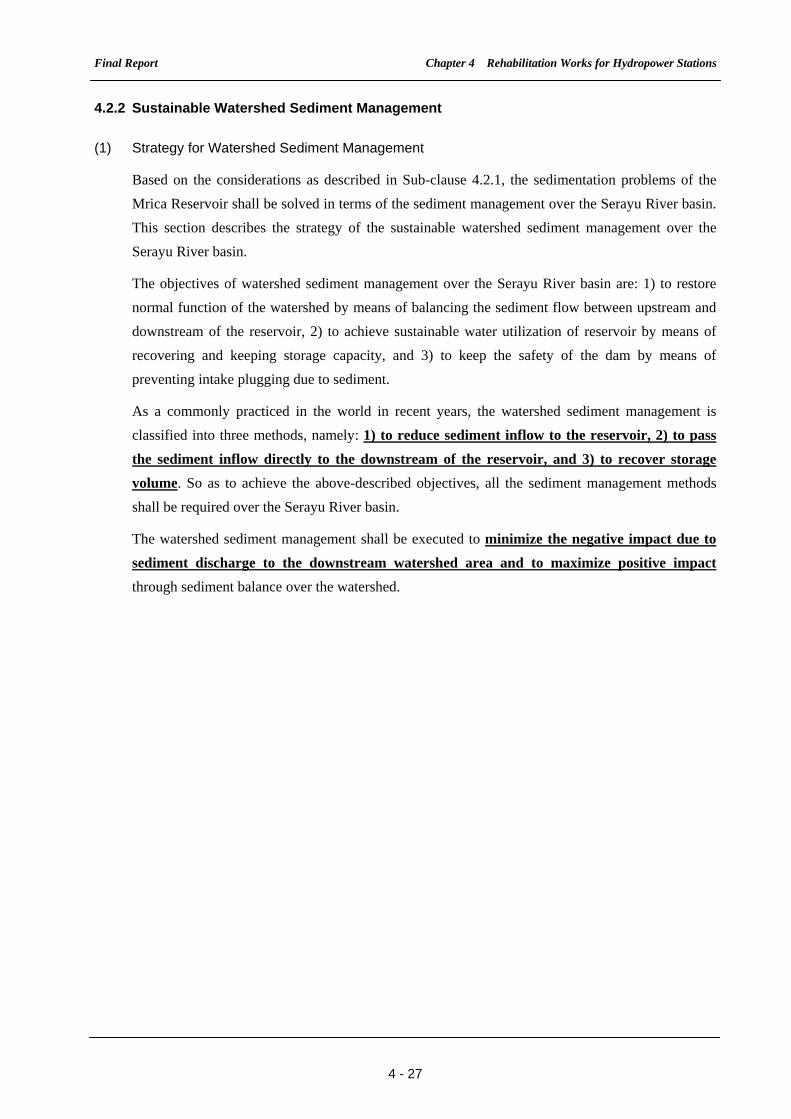
Objectives of Watershed Sediment Management1) Restore normal function of the watershed2) Achieve sustainable water utilization of reservoir.3) Keep safety of the dam, river channel and inhabitant over the watershed.
Sediment Countermeasure1) Reduce the sediment inflow to the reservoir2) Pass the sediment inflow directly to downstream of the reservoir3) Recovery of storage volume
Environmental MonitoringMinimize the negative impact of
sediment discharge.Maximize the positive impact by
balancing sediment over the watershed.
Figure 4.2.2-1 Strategy of Watershed Sediment Management of Serayu River Basin (Prepared by JICA Study Team)
(2) Final Target of Watershed Sediment Management
Appropriate sediment management shall be performed for each area of the Serayu River basin and
the countermeasures shall be managed to achieve overall benefit over the Serayu River basin.
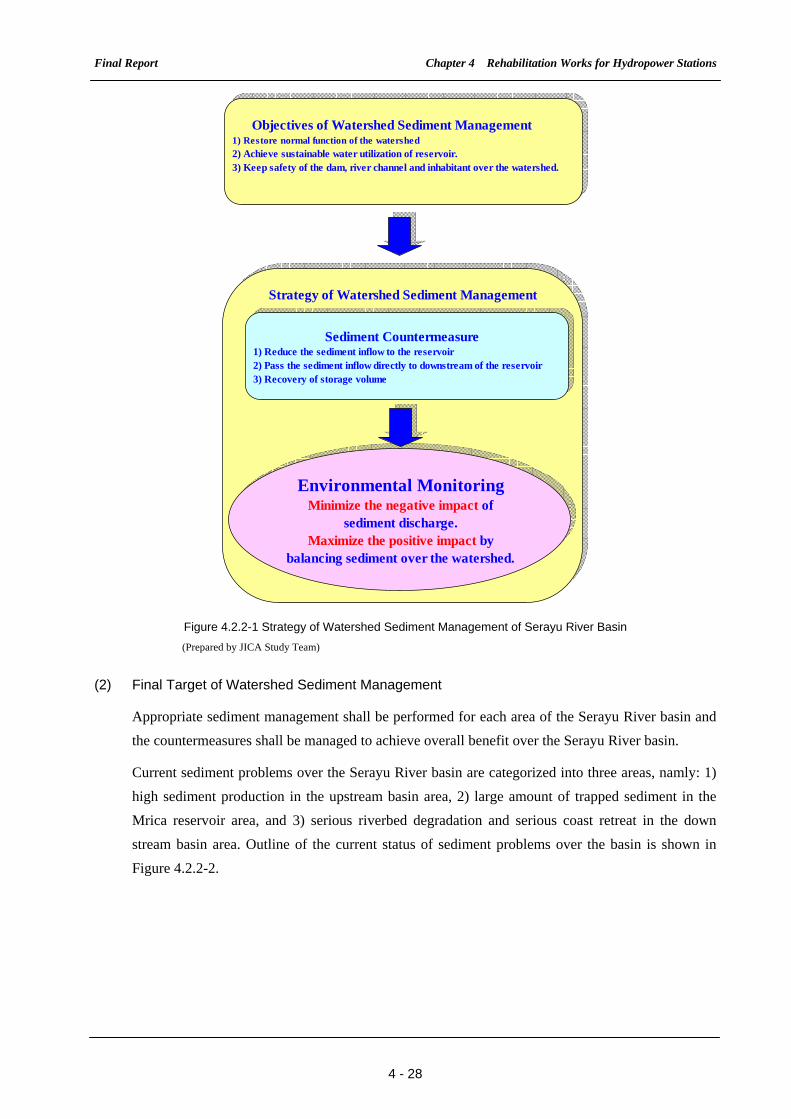
Current sediment problems over the Serayu River basin are categorized into three areas, namly: 1)
high sediment production in the upstream basin area, 2) large amount of trapped sediment in the
Mrica reservoir area, and 3) serious riverbed degradation and serious coast retreat in the down
stream basin area. Outline of the current status of sediment problems over the basin is shown in
Figure 4.2.2-2.
Final Report Chapter 4 Rehabilitation Works for Hydropower Stations
4 - 31
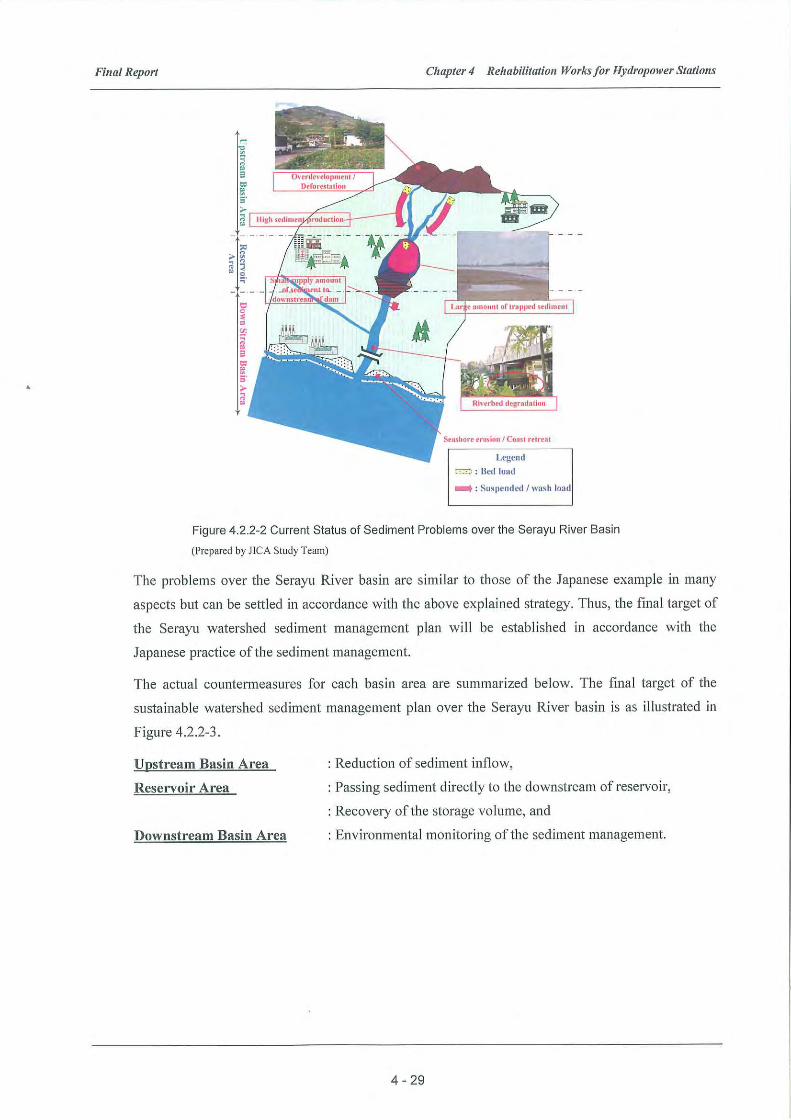
(3) Implementation Policy of Watershed Sediment Management
Implementation policy (preliminary level) of the watershed sediment management has been
established to achieve the final target of the management with the following considerations:
- Implementation policy shall be prepared considering the basin area and the target time frame,
- Current and on-going countermeasures shall be utilized as much as possible, and
- Target of each basin area and each time frame shall be clearly defined.
The implementation policy is proposed by the JICA Study Team based on the current and on-going
countermeasures and as shown in Table 4.2.2-1. According to the policy, the sediment
countermeasures in the reservoir area and the monitoring plan for the downstream basin area have
not been studied yet by the local government and IP. Hence, the JICA Study Team will carry out
the remaining studies preliminarily initially and finalize the implementation policy in Sub-clause
4.2.3.
Table 4.2.2-1 Implementation Policy of Watershed Sediment Management
Target Period Area
Sort-term Medium-term Long-term
Target of sediment management
Prevention of increasing sediment production
Trapping of bed load material
Reduction of Sediment Product
Conceivable Countermeasure
- Restriction of deforestation - Sabo dam construction
- Reforestation - Introduction of watershed conservation program (Elucidation to farmers, introduction of new cultivation program)
Current status on-going on-going on-going Ups
trea
m B
asin
Are
a
Implementing agency at present
Local government and Indonesia Power
Target of sediment management Maintain intake function
Passing the sediment inflow directly to
downstream of the reservoir
Recovery of effective storage volume
Conceivable Countermeasure
- Improvement of reservoir operation rule - Sediment flushing operation
- to be determined - to be determined
Current status on-going Not yet studied Not yet studied
Res
ervo
ir A
rea
Implementing agency at present
Indonesia Power
Target of sediment management
Protection against riverbed degradation and
coastal encroachment Improve sediment balance
Minimize negative impact and maximize positive
impact
Conceivable Countermeasure / Monitoring
- Riverbed protection, - Bridge replacement - Coastal protection
- Monitoring quality and volume of sediment
- PDCA management for the watershed sediment management
Current status on-going Not yet studied Not yet studied
Dow
nstr
eam
Bas
in A
rea
Implementing agency at present
Ministry of Public Works
(Prepared by JICA Study Team)

Final Report Chapter 4 Rehabilitation Works for Hydropower Stations
4 - 32
4.2.3 Supplementary Study on Sediment Countermeasures
This section describes the additional sediment countermeasures to reinforce the watershed sediment
management over the Serayu River basin.
(1) Countermeasure for Passing Sediment Inflow Directly to the Downstream of the Reservoir
(Sediment Routing)
The countermeasure aims to achieve natural sediment balance over the Serayu River basin by
means of passing the sediment inflow directly to the downstream of the Mrica reservoir. Basic
concept of the countermeasure is listed below.
- In principle, sediment inflow shall not be trapped in the reservoir as much as possible,
- Bed load (over 1.0 mm) cannot pass through the reservoir. The material shall be trapped by
the sabo dams constructed in the upstream basin area,
- Only suspended load (0.1 to 1.0 mm) and wash load (below 0.1 mm) material can pass directly
to the downstream of the reservoir,
- Reservoir water level shall not be lowered below the low water level of EL224.50 m in order
to maintain irrigation water supply throughout the year.
There are two conceivable countermeasures for the sediment routing operation as shown in the
Table 4.2.3-1. The sediment sluicing operation requires the reservoir to draw down below the low
water level. This is not acceptable because the Mrica Reservoir is supposed to maintain the
irrigation water supply. On the other hand, sediment inflow can be diverted by the bypass tunnel
regardless the reservoir water level.
The sediment bypass tunnel is only one countermeasure to meet the above requirements. Hence, the
bypass tunnel has been selected for the sediment routing countermeasure.


Final Report Chapter 4 Rehabilitation Works for Hydropower Stations
4 - 35
(3) Disposal Method for Dredging Work
There are three conceivable disposal methods as shown in Table 4.2.3-3. Each method has some
merits and demerits. However, it is not ideal to select only one method for the sediment disposal.
Therefore, integration of the methods has been proposed for the dredging work with the following
considerations:
- Bed load material shall be disposed to the disposal area,
- The bed load material shall be utilized as construction material as much as possible,
- Only the suspended load and the wash load materials shall be discharged to the downstream of
the reservoir, and
- Quality and quantity of the discharged sediment materials shall be controlled based on the
monitoring results in the downstream river basin.
Table 4.2.3-3 Disposal Method for Dredging Work
Discharge to Downstream of Reservoir Disposal Area
Temporary Placing + Wash out Dredging + Sediment Flushing
Outline Transport the dredged sediment
material to the disposal area. Bed
load will be utilized as
construction material.
Place the dredged sediment at the
downstream of the reservoir and
wash out by the power generation
discharge, or spill out discharge.
Move the trapped sediment close
to the flushing gate by the dredger
and flush out the sediment.
Application
for Dam in
Japan
Sakuma Dam, Miwa Dam,
Koshib Dam
Nagashima Dam, Akiba Dam Sakuma Dam (sediment movement
only), Akiba Dam (sediment
movement only)
Applicable
Material
Bed load, suspended load and
wash load
Suspended load and wash load Suspended load and wash load
Merit -Bed load material can be
disposed.
-Large amount of sediment can be
disposed.
-Transportation cost is not
required.
Demerit -Only small quantity can be
disposed due to limitation of
available disposal area.
-Bed load material cannot be
washed out to minimize
environmental impact.
-Quality of the sediment shall be
controlled.
-Bed load material cannot be
washed out to minimize
environmental impact.
-Large amount of spill out water
will be required.
-Quality of the sediment shall be
controlled.
Environmental
Impact
-Impact on land utilization and
natural environment of disposal
area.
-Social impact caused by noise,
vibration, exhaust fume, and dust
due to the truck transport.
-Impact on natural environment and
water utilization along the
downstream river due to sediment
discharge.
-Impact on underwater
environment due to river bed
fluctuation.
-Impact on natural environment
and water utilization along the
downstream river due to sediment
discharge.
-Impact on underwater
environment due to river bed
fluctuation.
Cost High Medium Low (Disposal cost only)
Evaluation Applicable for small quantity Applicable for suspended load and wash load. However, quality and
quantity shall be controlled.
(Prepared by JICA Study Team)

Final Report Chapter 4 Rehabilitation Works for Hydropower Stations
4 - 36
(4) Monitoring Plan for Downstream River Basin Area
In order to achieve the sustainable sediment management in the Serayu River basin, environmental
monitoring shall be carried out to meet the target in each time frame. The medium-term and
long-term targets of the environmental monitoring plan have been proposed based on the
implementation policy of the watershed sediment management plan as shown in Table 4.2.2-1.
Medium-term target: Achieve sediment balance in the Serayu River basin
Long-tem target: Minimize negative impact and maximize positive impact
Conceivable monitoring measures in the downstream river basin are as follows:
- Impact on water utilization such as irrigation water supply and domestic water supply,
- Impact on aquatic organism (mainly fish), aquatic plant,
- Impact on riverbed and seashore topography and landscape, and
- Impact on river and coastal structural due to topographic change.
Based on the above monitoring, quality and volume of the sediment discharge from the reservoir
shall be controlled appropriately.
Finally, the monitoring system should be carried out by Plan, Do, Check and Action (PDCA)
quantity control system. The environmental management system to achieve the long-term target
is illustrated below:

Final Report Chapter 4 Rehabilitation Works for Hydropower Stations
4 - 38
basin into the upstream river basin area, reservoir area and downstream river basin area by
fixing boundaries; establish the target of the sediment management; and to definite the
required countermeasures and monitoring plan for each river basin area.
Since the manifestations of the expected effectiveness and implementation progress depends
on the type of the sediment countermeasure, the target of the sediment management in terms of
time frame, such as short-term, medium-term and long-term, shall also be established in target
set for each river basin area.
2) Improvement of Sediment Balance
The sediment countermeasures carried out by the local government and IP have been analyzed
and compared with the watershed sediment management in Japan. In order to execute the
sustainable sediment management, the sediment countermeasure that has been carried out so
far should be continued and reinforced. Moreover, the sediment imbalance, which has been
caused by the large amount of trapped sediment in the Mrica reservoir, shall be improved.
In order to improve the above sediment imbalance, the sediment diversion weir and the bypass
tunnel for the sediment bypass are recommended. However, adjustment of the quality and
volume of the sediment to be supplied to the downstream is required. This shall be examined
based on the detailed investigation results to be executed in a further study.
3) Recovery of the Reservoir Storage Volume
The effective reservoir storage volume which will be totally reduced in the near future shall be
recovered to secure not only the water utilization and flood control functions of the reservoir
but also the dam safety by plugging the power intake.
As a result of the examination, the dredging in the reservoir shall be effective for the recovery
of the reservoir storage volume. However, as to the dredging volume and the disposal
method of the dredged material, the appropriate scale and method shall be examined based on
the detailed investigation in a further study.
4) Execution of Environmental Monitoring in the Downstream Area and the Realization of the
Sustainable Watershed Sediment Management
In order to execute the sustainable watershed sediment management, environmental
monitoring in the downstream area is absolutely imperative. Following the improvement of
the watershed sediment balance, main items to be monitored are as follows:
- Impact on the water utilization in the downstream,
- Impact on the aquatic life (in particular, fishes) and aquatic plant,
- Impact on topography of the river such as the river bed fluctuation and the coastal retreat,
and
- Impact on the structures of the river.
It is important that the watershed sediment balance management and the required

Final Report Chapter 4 Rehabilitation Works for Hydropower Stations
4 - 39
countermeasures shall be timely improved considering the above influence. Finally, the
sustainable river basin sediment management shall require the PDCA cycle.
5) Future Vision of the Watershed Sediment Management
Based on the examination results in Section 4.2, the future vision of the sustainable sediment
management in the Serayu River basin (i.e., long-term target) is summarized below.
Table 4.2.4-1 Future Vision of River Basin Sediment Management
Area Target of the Sediment Management Countermeasures to be Implemented / Operation
and Maintenance
Up-stream
Basin Area
-Trapping of bed load
-Reduction of sediment inflow
-Sabo dams construction and the maintenance
-Revival of forest
-River basin conservation countermeasure
Reservoir
Area
-Passing the sediment inflow
-Recovery of the reservoir storage volume
-Construction of sediment bypass tunnel and
appropriate operation and maintenance
-Execution of dredging in the reservoir and
appropriate disposal of the dredged material
Downstream
Basin Area
-Improvement of sediment balance
-Minimizing the negative impact in the
downstream area and maximizing the positive
impact on whole benefit of the watershed.
Execution of the environmental monitoring
Execution of the sustainable sediment monitoring
through the PDCA cycle
(Prepared by JICA Study Team)
6) Comprehensive Master Plan for the Watershed Sediment Management and Urgent
Countermeasure
In order to solve the serious sedimentation problems in the Mrica reservoir and to execute the
sustainable sediment management, the comprehensive master plan for the watershed sediment
management shall be prepared first. Further, the road map for the appropriate sediment
balance planning including the downstream area of the reservoir, and the sedimentation
countermeasures / O&M planning shall be prepared.
Based on the master plan, the survey/investigation, design and implementation for the urgent
sediment countermeasures in the Serayu River basin shall be executed in order to solve the
serious sediment problems.
In this preliminary study, based on the limited information, study period and the bold
assumptions, the urgent sedimentation countermeasures in the reservoir area are examined for
reference. The components are shown below and in Annex B.
- Sand bypass tunnel: Length=7,500 m, Width/Height= 5.8 m / 6.4 m
- Diversion weir: Type: Full face slicing gated type.
- Dredging work to be conducted by cutter suction type dredger: 1,300 PS, 3 nos.
The above countermeasure is prepared only for considering the sediment balance in the
upstream basin of the Serayu River and Mrica reservoir area as well as the economic benefit of
the irrigation water supply and power generation at the Mrica reservoir. This countermeasure

Final Report Chapter 4 Rehabilitation Works for Hydropower Stations
4 - 40
however can be considered only for reference. Optimization study of the countermeasure
based on the detailed survey and study results through the proposed master plan shall be
performed.
(2) Organization of Implementation and O&M for River Basin Sediment Management
In order to execute a sustainable sediment management in the Serayu River basin, the watershed
sediment management shall be planned and executed aiming not only to maximize of the irrigation
and power generation benefits but also to maximize the whole benefit in the Serayu River basin.
From this point of view, the organization of the implementation and the O&M for the watershed
sediment management is recommended as follows:
1) Establishment of the Organization for the Watershed Sediment Management
Each organization has carried out the implementation and O&M of the sediment
countermeasures in the Serayu River basin without cooperating with the other organization so
far. However, to execute a sustainable sediment management effectively, proper
coordination with other organizations is absolutely necessary. Moreover, the management
plan and O&M plan aimed at maximizing the whole benefit in the river basin are essential.
Therefore, it is recommended that the implementation organization for the watershed sediment
management consisting of the local government, IP, Ministry of Public Works and users within
the river basin shall be established in the Serayu River basin.
2) Participation of the Residents in Decision Making, Planning and O&M
The participation of the residents in the Serayu River basin in the decision making, river basin
conservation countermeasures and in the planning and operation of the sediment management
is recommended from the sustainable watershed sediment management point of view.
Following the above establishment of the organization for the river basin sediment
management, the watershed sediment management method with the participation of the
residents in the Serayu River basin shall be executed.
3) Initiation of Watershed Sediment Management with Financial Support
IP and the local government have performed appropriate countermeasure for sediment control
in the Serayu River basin. However, due to their limited competence and funding, the scale
of the countermeasures is too small to get effective results on the sediment issues.
Therefore, it is strongly recommended that the watershed sediment management measure in
the Serayu River basin as well as countermeasure for the Mrica reservoir should be initiated as
a practical solution with definite financial support.

Chapter 5 Economic and Financial Analysis
Final Report Chapter 5 Economic and Financial Analysis
5 - 1
CHAPTER 5 ECONOMIC AND FINANCIAL ANALYSIS
5.1 Economic and Financial Analysis of the Rehabilitation Work for Sutami
5.1.1 Economic Analysis
(1) Methodology
In conducting economic analysis of the rehabilitation work for Sutami Hydropower Station, the
economic effect brought by the project is evaluated from the viewpoint of national economy.
Here, the economic value of cost and benefit expressed by a discounted cash flow are compared.
The economic internal rate of return (EIRR), net present value (NPV) and benefit cost ratio (B/C)
are employed as key indicators in the evaluation. NPV can be expressed by the following
formula:
NPV=ΣBn
(1+r)n
n
n=0ー
CnΣn
n=0 (1+r)nNPV=ΣBn
(1+r)n
n
n=0ー
CnΣn
n=0 (1+r)n
Here, n = number of year in the future, Bn = benefit in n year, Cn= cost in n year, r = discount rate, while IRR is the value of “r” with
which the value of NPV becomes 0, as denoted below.
(2) Basic Assumption
With reference to other examples in the Indonesian power sector, the analysis is conducted with the
following basic assumptions:
1) Opportunity Cost of Capital (Social Discount Rate)
The opportunity cost of capital adopted as the reference value for EIRR in most cases is
between 10% and 12%. Here, it is assumed to be 10% as it is commonly applied in power
sector projects in Indonesia..
2) Standard Conversion Factor (SCF)
In the economic analysis, the local currency portion of the construction and indirect costs,
which are calculated based on local market prices, need to be converted into economic price
using an appropriate SCF. In this study, the SCF is assumed to be 0.9 with reference to other
relevant examples.
3) Period Subject to Evaluation
The period subject to evaluation is 45 years including 40 years of expected lifetime (economic
life) and 5 years of construction period.
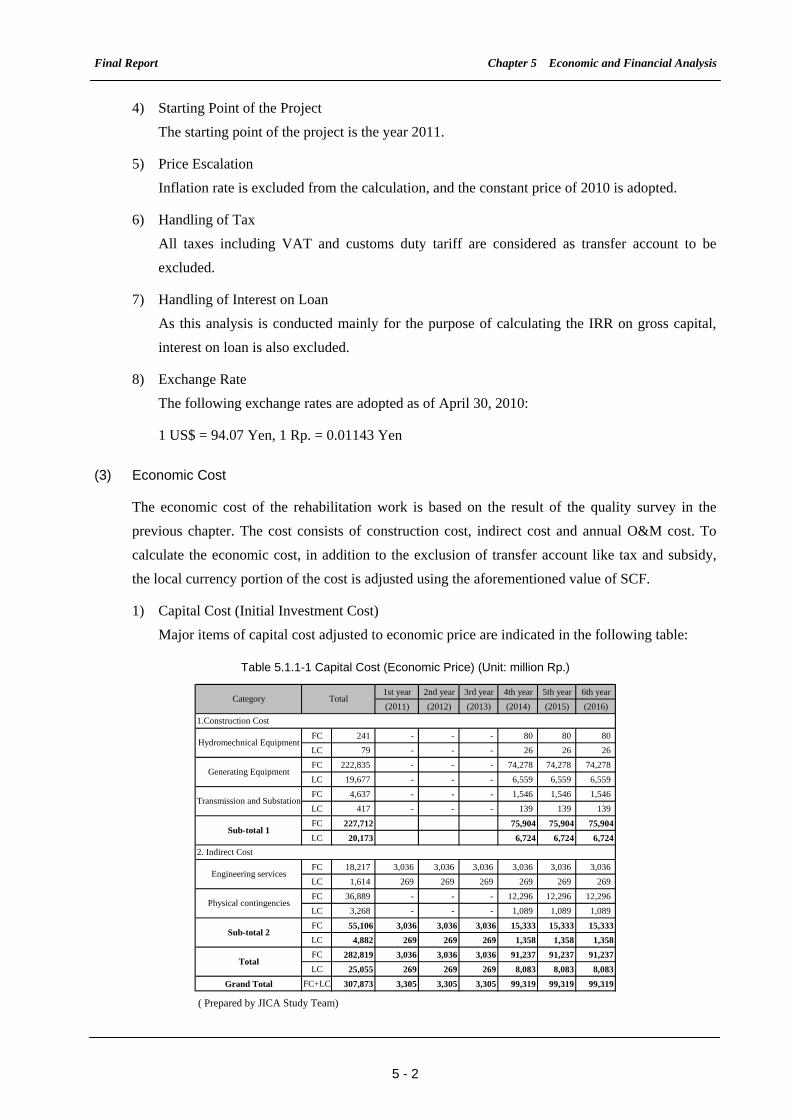
Final Report Chapter 5 Economic and Financial Analysis
5 - 2
4) Starting Point of the Project
The starting point of the project is the year 2011.
5) Price Escalation
Inflation rate is excluded from the calculation, and the constant price of 2010 is adopted.
6) Handling of Tax
All taxes including VAT and customs duty tariff are considered as transfer account to be
excluded.
7) Handling of Interest on Loan
As this analysis is conducted mainly for the purpose of calculating the IRR on gross capital,
interest on loan is also excluded.
8) Exchange Rate
The following exchange rates are adopted as of April 30, 2010:
1 US$ = 94.07 Yen, 1 Rp. = 0.01143 Yen
(3) Economic Cost
The economic cost of the rehabilitation work is based on the result of the quality survey in the
previous chapter. The cost consists of construction cost, indirect cost and annual O&M cost. To
calculate the economic cost, in addition to the exclusion of transfer account like tax and subsidy,
the local currency portion of the cost is adjusted using the aforementioned value of SCF.
1) Capital Cost (Initial Investment Cost)
Major items of capital cost adjusted to economic price are indicated in the following table:
Table 5.1.1-1 Capital Cost (Economic Price) (Unit: million Rp.)
1st year 2nd year 3rd year 4th year 5th year 6th year
(2011) (2012) (2013) (2014) (2015) (2016)
FC 241 - - - 80 80 80
LC 79 - - - 26 26 26
FC 222,835 - - - 74,278 74,278 74,278
LC 19,677 - - - 6,559 6,559 6,559
FC 4,637 - - - 1,546 1,546 1,546
LC 417 - - - 139 139 139
FC 227,712 75,904 75,904 75,904
LC 20,173 6,724 6,724 6,724
FC 18,217 3,036 3,036 3,036 3,036 3,036 3,036
LC 1,614 269 269 269 269 269 269
FC 36,889 - - - 12,296 12,296 12,296
LC 3,268 - - - 1,089 1,089 1,089
FC 55,106 3,036 3,036 3,036 15,333 15,333 15,333
LC 4,882 269 269 269 1,358 1,358 1,358
FC 282,819 3,036 3,036 3,036 91,237 91,237 91,237
LC 25,055 269 269 269 8,083 8,083 8,083
Grand Total FC+LC 307,873 3,305 3,305 3,305 99,319 99,319 99,319
Physical contingencies
Sub-total 1
Sub-total 2
Total
2. Indirect Cost
Hydromechnical Equipment
Generating Equipment
Transmission and Substation
Category Total
1.Construction Cost
Engineering services
( Prepared by JICA Study Team)

Final Report Chapter 5 Economic and Financial Analysis
5 - 3
2) O&M Cost
Annual O&M cost is expected to come up during the start of operation of equipment installed
for this project. However, it should be noted that in the case of a rehabilitation project, the
O&M cost refers only to the net increase of cost under the ‘With Project’ case as compared to
the ‘Without Project’ case. With regard to the Sutami Project, two possible cases are
assumed. It is also worth pointing out that the negative values of the O&M cost can be
understood as the benefit resulting from the savings in O&M cost with the implementation of
the project.
i) Case 1
O&M cost in the ‘With Project’ case is expected to decline by 20% starting from 2017
following the completion of the construction work. On the other hand, O&M cost in the
‘Without Project’ scenario is supposed to remain at the same level until 2020, when the
operation of the aging machines will come to a total stop and the O&M cost will become
0.
ii) Case 2
O&M cost in the ‘With Project’ case is expected to be the same as in Case 1 but in the
‘Without Project’ case, it is supposed to return to the same level in 2019 when the rusty
machines have been repaired one way or another.
Table 5.1.1-2 Net Increase of O&M Cost over the Project Period (Case 1) (Unit: million Rp)
Without Project With Project
Year Turbine #1 Turbine #2 Turbine #3
Total O&M Cost
Turbine #1 Turbine #2 Turbine #3 Total
O&M Cost
Net Increase of O&M
Cost
2011 136 136 136 409 136 136 136 409 0
…… 136 136 136 409 136 136 136 409 0
2016 136 136 136 409 136 136 136 409 0
2017 136 136 136 409 109 109 109 327 -82
2018 136 136 136 409 109 109 109 327 -82
2019 136 136 136 409 109 109 109 327 -82
2020~ 0 0 0 0 109 109 109 327 327
( Prepared by JICA Study Team)
Note: The value of Annual O&M cost for one turbine is estimated based on the average value of Annual O&M cost for one turbine in
Sutami power station in the past 6 years.
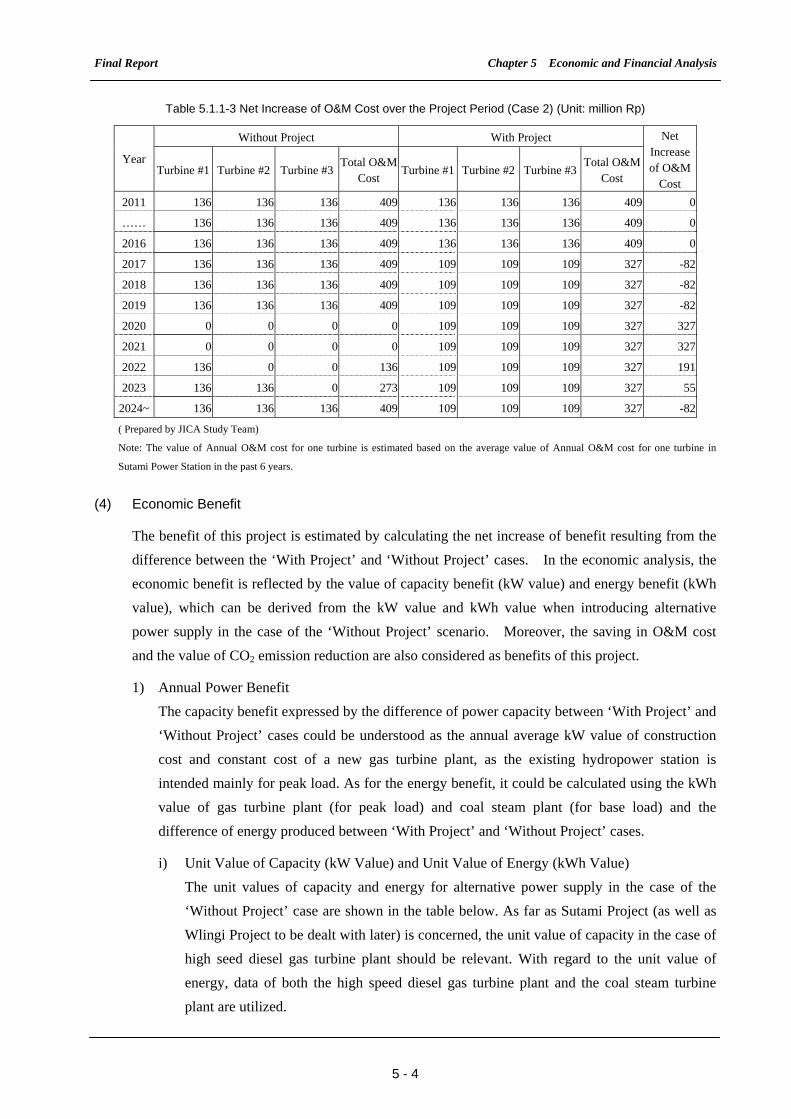
Final Report Chapter 5 Economic and Financial Analysis
5 - 4
Table 5.1.1-3 Net Increase of O&M Cost over the Project Period (Case 2) (Unit: million Rp)
Without Project With Project
Year Turbine #1 Turbine #2 Turbine #3
Total O&M Cost
Turbine #1 Turbine #2 Turbine #3 Total O&M
Cost
Net Increase of O&M
Cost
2011 136 136 136 409 136 136 136 409 0
…… 136 136 136 409 136 136 136 409 0
2016 136 136 136 409 136 136 136 409 0
2017 136 136 136 409 109 109 109 327 -82
2018 136 136 136 409 109 109 109 327 -82
2019 136 136 136 409 109 109 109 327 -82
2020 0 0 0 0 109 109 109 327 327
2021 0 0 0 0 109 109 109 327 327
2022 136 0 0 136 109 109 109 327 191
2023 136 136 0 273 109 109 109 327 55
2024~ 136 136 136 409 109 109 109 327 -82
( Prepared by JICA Study Team)
Note: The value of Annual O&M cost for one turbine is estimated based on the average value of Annual O&M cost for one turbine in
Sutami Power Station in the past 6 years.
(4) Economic Benefit
The benefit of this project is estimated by calculating the net increase of benefit resulting from the
difference between the ‘With Project’ and ‘Without Project’ cases. In the economic analysis, the
economic benefit is reflected by the value of capacity benefit (kW value) and energy benefit (kWh
value), which can be derived from the kW value and kWh value when introducing alternative
power supply in the case of the ‘Without Project’ scenario. Moreover, the saving in O&M cost
and the value of CO2 emission reduction are also considered as benefits of this project.
1) Annual Power Benefit
The capacity benefit expressed by the difference of power capacity between ‘With Project’ and
‘Without Project’ cases could be understood as the annual average kW value of construction
cost and constant cost of a new gas turbine plant, as the existing hydropower station is
intended mainly for peak load. As for the energy benefit, it could be calculated using the kWh
value of gas turbine plant (for peak load) and coal steam plant (for base load) and the
difference of energy produced between ‘With Project’ and ‘Without Project’ cases.
i) Unit Value of Capacity (kW Value) and Unit Value of Energy (kWh Value)
The unit values of capacity and energy for alternative power supply in the case of the
‘Without Project’ case are shown in the table below. As far as Sutami Project (as well as
Wlingi Project to be dealt with later) is concerned, the unit value of capacity in the case of
high seed diesel gas turbine plant should be relevant. With regard to the unit value of
energy, data of both the high speed diesel gas turbine plant and the coal steam turbine
plant are utilized.

Final Report Chapter 5 Economic and Financial Analysis
5 - 5
Table 5.1.1-4 Unit Values of Capacity and Energy for Alternative Power Plants
Name of Data Type of Power Plant Rate in US$ Rate in Rp
High speed diesel gas turbine 63.49 US$/kW/year 522,523 Rp/kW/yearUnit value of capacity
Coal steam Turbine 216.95 US$/kW/year 1,785,499 Rp/kW/year
High speed diesel gas turbine 0.106 US$/kWh 872 Rp/kWhUnit value of energy
Coal steam Turbine 0.02028 US$/kWh 167 Rp/kWh
(Source: Prepared by JICA Study Team based on PLN Rencana Usaha Penyediaan Tenaga Listrik 2006 - 2015)
ii) Calculation of Annual Power Benefit
By using the abovementioned kW value and kWh value, the annual power benefit
including capacity benefit and energy benefit are derived as shown in the following two
tables, which respectively reflect two cases that are different only in the ‘Without Project’
case.
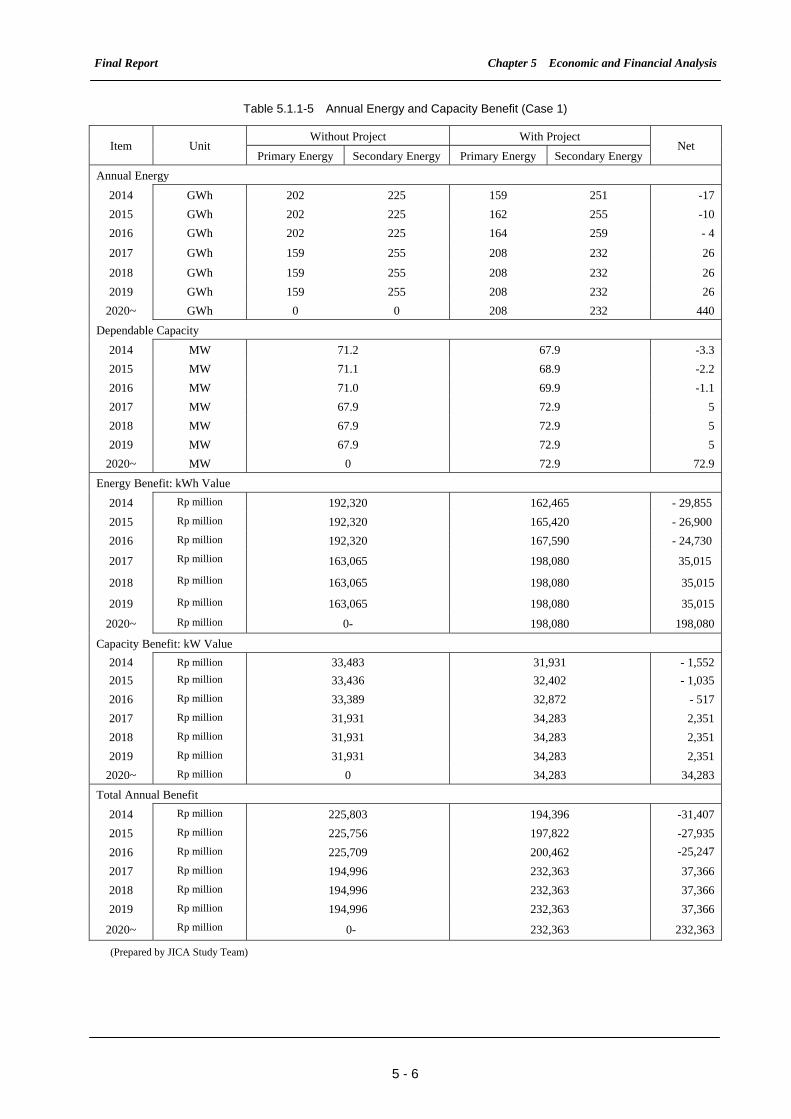
Final Report Chapter 5 Economic and Financial Analysis
5 - 6
Table 5.1.1-5 Annual Energy and Capacity Benefit (Case 1)
Without Project With Project Item Unit
Primary Energy Secondary Energy Primary Energy Secondary Energy Net
Annual Energy
2014 GWh 202 225 159 251 -17
2015 GWh 202 225 162 255 -10
2016 GWh 202 225 164 259 - 4
2017 GWh 159 255 208 232 26
2018 GWh 159 255 208 232 26
2019 GWh 159 255 208 232 26
2020~ GWh 0 0 208 232 440
Dependable Capacity
2014 MW 71.2 67.9 -3.3
2015 MW 71.1 68.9 -2.2
2016 MW 71.0 69.9 -1.1
2017 MW 67.9 72.9 5
2018 MW 67.9 72.9 5
2019 MW 67.9 72.9 5
2020~ MW 0 72.9 72.9
Energy Benefit: kWh Value
2014 Rp million 192,320 162,465 - 29,855
2015 Rp million 192,320 165,420 - 26,900
2016 Rp million 192,320 167,590 - 24,730
2017 Rp million 163,065 198,080 35,015
2018 Rp million 163,065 198,080 35,015
2019 Rp million 163,065 198,080 35,015
2020~ Rp million 0- 198,080 198,080
Capacity Benefit: kW Value
2014 Rp million 33,483 31,931 - 1,552
2015 Rp million 33,436 32,402 - 1,035
2016 Rp million 33,389 32,872 - 517
2017 Rp million 31,931 34,283 2,351
2018 Rp million 31,931 34,283 2,351
2019 Rp million 31,931 34,283 2,351
2020~ Rp million 0 34,283 34,283
Total Annual Benefit
2014 Rp million 225,803 194,396 -31,407
2015 Rp million 225,756 197,822 -27,935
2016 Rp million 225,709 200,462 -25,247
2017 Rp million 194,996 232,363 37,366
2018 Rp million 194,996 232,363 37,366
2019 Rp million 194,996 232,363 37,366
2020~ Rp million 0- 232,363 232,363
(Prepared by JICA Study Team)
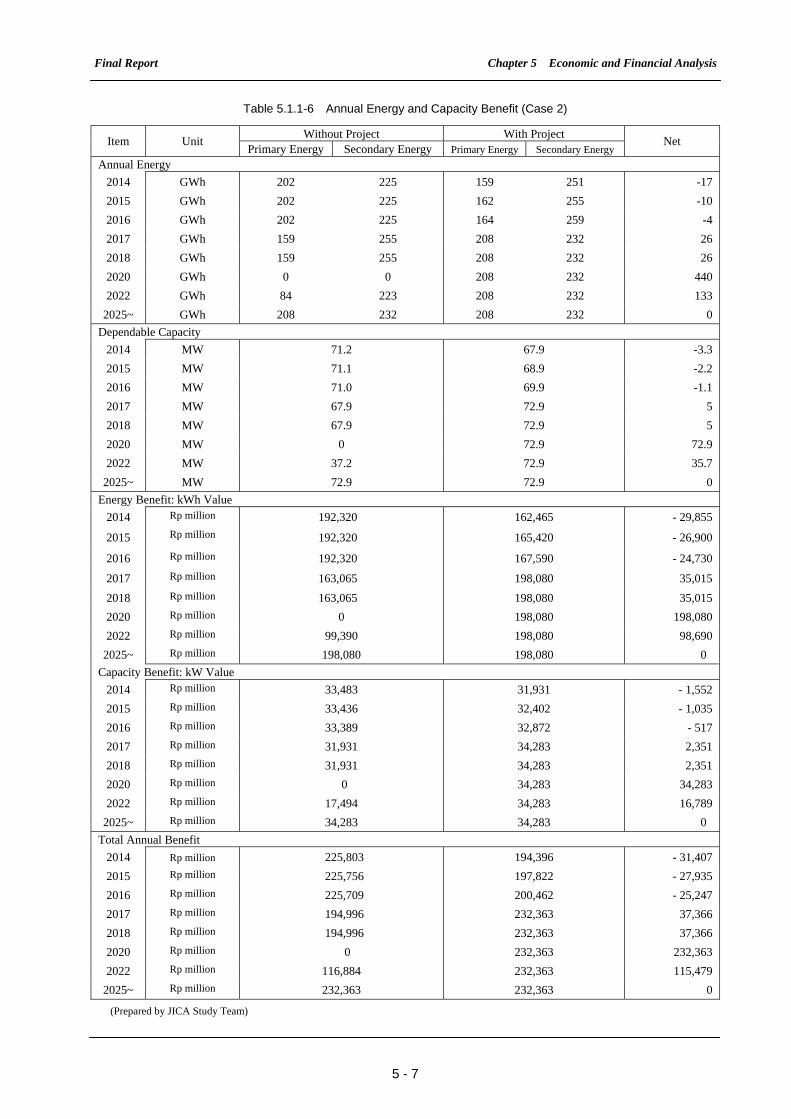
Final Report Chapter 5 Economic and Financial Analysis
5 - 7
Table 5.1.1-6 Annual Energy and Capacity Benefit (Case 2)
Without Project With Project Item Unit
Primary Energy Secondary Energy Primary Energy Secondary Energy Net
Annual Energy
2014 GWh 202 225 159 251 -17
2015 GWh 202 225 162 255 -10
2016 GWh 202 225 164 259 -4
2017 GWh 159 255 208 232 26
2018 GWh 159 255 208 232 26
2020 GWh 0 0 208 232 440
2022 GWh 84 223 208 232 133
2025~ GWh 208 232 208 232 0
Dependable Capacity
2014 MW 71.2 67.9 -3.3
2015 MW 71.1 68.9 -2.2
2016 MW 71.0 69.9 -1.1
2017 MW 67.9 72.9 5
2018 MW 67.9 72.9 5
2020 MW 0 72.9 72.9
2022 MW 37.2 72.9 35.7
2025~ MW 72.9 72.9 0
Energy Benefit: kWh Value
2014 Rp million 192,320 162,465 - 29,855
2015 Rp million 192,320 165,420 - 26,900
2016 Rp million 192,320 167,590 - 24,730
2017 Rp million 163,065 198,080 35,015
2018 Rp million 163,065 198,080 35,015
2020 Rp million 0 198,080 198,080
2022 Rp million 99,390 198,080 98,690
2025~ Rp million 198,080 198,080 0
Capacity Benefit: kW Value
2014 Rp million 33,483 31,931 - 1,552
2015 Rp million 33,436 32,402 - 1,035
2016 Rp million 33,389 32,872 - 517
2017 Rp million 31,931 34,283 2,351
2018 Rp million 31,931 34,283 2,351
2020 Rp million 0 34,283 34,283
2022 Rp million 17,494 34,283 16,789
2025~ Rp million 34,283 34,283 0
Total Annual Benefit
2014 Rp million 225,803 194,396 - 31,407
2015 Rp million 225,756 197,822 - 27,935
2016 Rp million 225,709 200,462 - 25,247
2017 Rp million 194,996 232,363 37,366
2018 Rp million 194,996 232,363 37,366
2020 Rp million 0 232,363 232,363
2022 Rp million 116,884 232,363 115,479
2025~ Rp million 232,363 232,363 0
(Prepared by JICA Study Team)
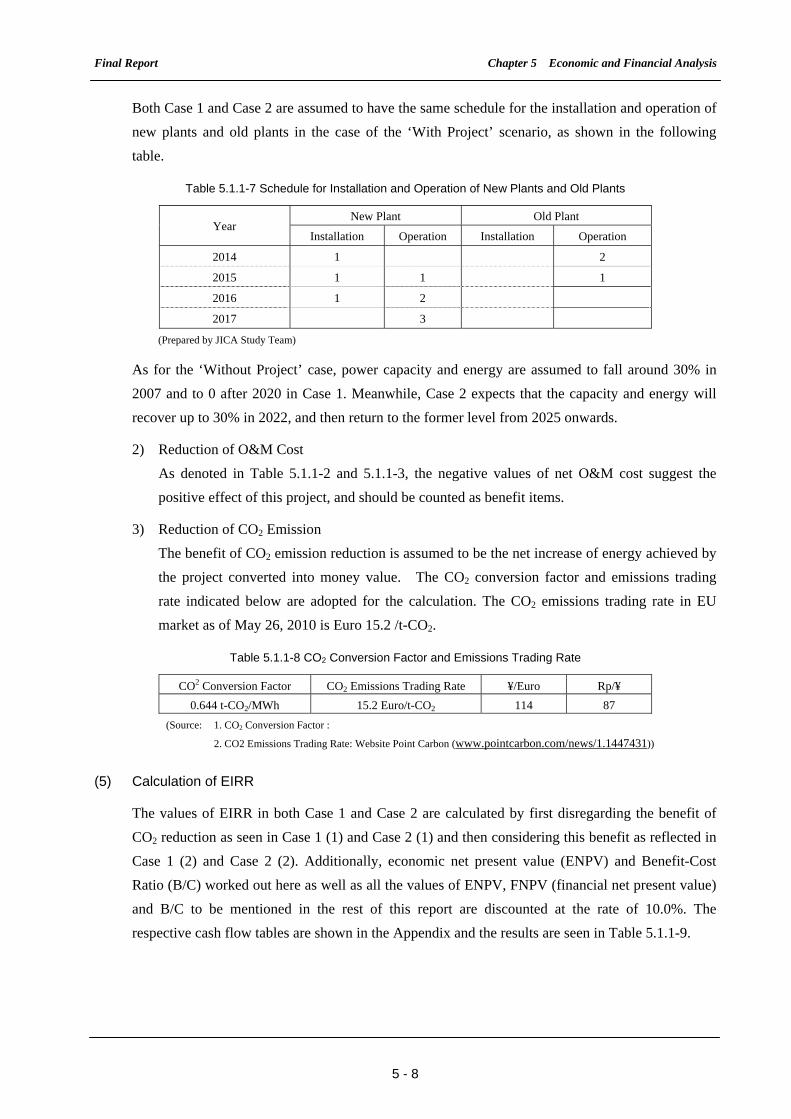
Final Report Chapter 5 Economic and Financial Analysis
5 - 8
Both Case 1 and Case 2 are assumed to have the same schedule for the installation and operation of
new plants and old plants in the case of the ‘With Project’ scenario, as shown in the following
table.
Table 5.1.1-7 Schedule for Installation and Operation of New Plants and Old Plants
New Plant Old Plant Year
Installation Operation Installation Operation
2014 1 2
2015 1 1 1
2016 1 2
2017 3
(Prepared by JICA Study Team)
As for the ‘Without Project’ case, power capacity and energy are assumed to fall around 30% in
2007 and to 0 after 2020 in Case 1. Meanwhile, Case 2 expects that the capacity and energy will
recover up to 30% in 2022, and then return to the former level from 2025 onwards.
2) Reduction of O&M Cost
As denoted in Table 5.1.1-2 and 5.1.1-3, the negative values of net O&M cost suggest the
positive effect of this project, and should be counted as benefit items.
3) Reduction of CO2 Emission
The benefit of CO2 emission reduction is assumed to be the net increase of energy achieved by
the project converted into money value. The CO2 conversion factor and emissions trading
rate indicated below are adopted for the calculation. The CO2 emissions trading rate in EU
market as of May 26, 2010 is Euro 15.2 /t-CO2.
Table 5.1.1-8 CO2 Conversion Factor and Emissions Trading Rate
CO2 Conversion Factor CO2 Emissions Trading Rate ¥/Euro Rp/¥
0.644 t-CO2/MWh 15.2 Euro/t-CO2 114 87
(Source: 1. CO2 Conversion Factor :
2. CO2 Emissions Trading Rate: Website Point Carbon (www.pointcarbon.com/news/1.1447431))
(5) Calculation of EIRR
The values of EIRR in both Case 1 and Case 2 are calculated by first disregarding the benefit of
CO2 reduction as seen in Case 1 (1) and Case 2 (1) and then considering this benefit as reflected in
Case 1 (2) and Case 2 (2). Additionally, economic net present value (ENPV) and Benefit-Cost
Ratio (B/C) worked out here as well as all the values of ENPV, FNPV (financial net present value)
and B/C to be mentioned in the rest of this report are discounted at the rate of 10.0%. The
respective cash flow tables are shown in the Appendix and the results are seen in Table 5.1.1-9.

Final Report Chapter 5 Economic and Financial Analysis
5 - 9
Table 5.1.1-9 Major Results of Economic Analysis
Case EIRR ENPV B/C
1(1) 26% Rp. 760,852 million 4.9 CO2 Reduction Benefit Excluded 2(1) 15% Rp. 77,325 million 1.4
1(2) 28% Rp.938,928 million 5.8 CO2 Reduction Benefit Included 2(2) 18% Rp121,776million 1.6
(Prepared by JICA Study Team)
The results show that whether the benefit of CO2 reduction is considered or not, EIRR values of
both Case 1 and Case 2 are expected to exceed the Indonesian social discount rate of 10%. The
economic effect of Case 1 is better than Case 2 mainly because the net increase of power benefit
(including energy benefit and capacity benefit) in Case 1 is much greater.
(6) Sensitivity Analysis
1) Assumptions for Analysis
Here, the sensitivity analysis is conducted with the purpose of verifying how the change of
previous assumptions for the project will affect the results of the evaluation. The analysis is
focused on Case 1(1) and Case 2(1) where the benefit of CO2 reduction is not considered.
Three scenarios are assumed as follows:
- Scenario 1: Construction cost rises by 10% and 20%. (Scenario 1a and 1b)
- Scenario 2: Fuel cost for alternative power supply decreases by 10% and 20%. (Scenario
2a and 2b)
- Scenario 3: Construction cost rises by 20% concurrently with the decline of fuel cost by
20% for alternative power supply.
2) Results of Analysis
The results of sensitivity analysis are indicated in the following two tables.
For case 1(1), with the change of previous assumptions for the project, the value of EIRR is
expected to vary from 22% to 25%. However, the results of all the cases assumed here are well
above the level of 10%, and even under the strictest conditions assumed in Scenario 3, the
project is still economically feasible.
Table 5.1.1-10 Results of Sensitivity Analysis for Case 1(1)
Scenario 1a 1b 2a 2b 3
EIRR 25% 24% 25% 24% 22%
ENPV(million Rp) 745,413 729,9754 679,932 599,141 568,264
B/C 4.5 4.2 4.5 4.1 3.5
(Prepared by JICA Study Team)
Regarding Case 2(1), the value of EIRR is expected to vary between 10% and 14%. Even
under the strictest conditions assumed in Scenario 3, the project is still economically feasible.

Final Report Chapter 5 Economic and Financial Analysis
5 - 10
Table 5.1.1-11 Results of Sensitivity Analysis for Case 2(1)
Scenario 1a 1b 2a 2b 3
EIRR 14% 13% 14% 12% 10%
ENPV(million Rp) 61,886 46,447 54,460 31,712 666
B/C 1.3 1.2 1.3 1.2 1.0
(Prepared by JICA Study Team)
5.1.2 Financial Analysis
(1) Methodology
With regard to the financial analysis of the rehabilitation work for Sutami Hydropower Station, the
point of evaluation is the financial profitability of the project. Here, the basic assumptions for
analysis in terms of the period subject to evaluation, starting point of the project, price escalation,
handling of tax and interest on loan are the same with those of the economic analysis.
(2) Financial Cost
The financial cost of the rehabilitation work consists of the initial capital investment already
estimated in the previous chapter and O&M cost. The O&M cost is calculated based on the values
denoted in the economic analysis dealt with in the previous section.
1) Capital Cost
Major items of the capital cost are denoted by the following table:

Final Report Chapter 5 Economic and Financial Analysis
5 - 11
Table 5.1.2-1 Capital Cost (Unit: million Rp.)
1st year 2nd year 3rd year 4th year 5th year 6th year
(2011) (2012) (2013) (2014) (2015) (2016)
FC 241 - - - 80 80 80
LC 87 - - - 29 29 29
FC 222,835 - - - 74,278 74,278 74,278
LC 21,863 - - - 7,288 7,288 7,288
FC 4,637 - - - 1,546 1,546 1,546
LC 464 - - - 155 155 155
FC 227,712 75,904 75,904 75,904
LC 22,414 7,471 7,471 7,471
FC 18,217 3,036 3,036 3,036 3,036 3,036 3,036
LC 1,793 299 299 299 299 299 299
FC 36,889 - - - 12,296 12,296 12,296
LC 3,631 - - - 1,210 1,210 1,210
FC 55,106 3,036 3,036 3,036 15,333 15,333 15,333
LC 5,424 299 299 299 1,509 1,509 1,509
FC 282,819 3,036 3,036 3,036 91,237 91,237 91,237
LC 27,838 299 299 299 8,981 8,981 8,981
Grand Total FC+LC 310,657 3,335 3,335 3,335 100,217 100,217 100,217
Sub-total 2
Total
Sub-total 1
2. Indirect Cost
Engineering services
Physical contingencies
1.Construction Cost
Hydromechnical Equipment
Generating Equipment
Transmission and Substation
Category Total
(Prepared by JICA Study Team)
2) O&M Cost
The values of annual O&M cost are calculated in the same way as in the economic analysis.
The only difference is that while the values of O&M cost need to be adjusted into the
economic price using the SCF in the economic analysis, the financial analysis does not require
such adjustment. Values of O&M cost in Case 1 and Case 2 are shown in the following two
tables.
Table 5.1.2-2 Net Increase of O&M Cost over the Project Period (Case 1) (Unit: million Rp.)
Without Project With Project
Year Turbine #1
Turbine #2
Turbine #3
Total O&M Cost
Turbine #1
Turbine #2
Turbine #3
Total O&M Cost
Net Increase of O&M Cost
2011 151 151 151 454 151 151 151 454 0
…… 151 151 151 454 151 151 151 454 0
2016 151 151 151 454 151 151 151 454 0
2017 151 151 151 454 121 121 121 364 -91
2018 151 151 151 454 121 121 121 364 -91
2019 151 151 151 454 121 121 121 364 -91
2020~ 0 0 0 0 121 121 121 364 364
(Prepared by JICA Study Team)
Note: The value of annual O&M cost for one turbine is estimated based on the average value of Annual O&M cost for one turbine in Sutami
power station in the past 6 years.
Final Report Chapter 5 Economic and Financial Analysis
5 - 12
Table 5.1.2-3 Net Increase of O&M Cost over the Project Period (Case 2) (Unit: million Rp.)
Without Project With Project Year Turbine
#1 Turbine
#2 Turbine
#3 Total O&M
Cost Turbine
#1 Turbine
#2 Turbine
#3 Total O&M
Cost
Net Increase of O&M Cost
2011 151 151 151 454 151 151 151 454 0
…… 151 151 151 454 151 151 151 454 0
2016 151 151 151 454 151 151 151 454 0
2017 151 151 151 454 121 121 121 364 -91
2018 151 151 151 454 121 121 121 364 -91
2019 151 151 151 454 121 121 121 364 -91
2020 0 0 0 0 121 121 121 364 364
2021 0 0 0 0 121 121 121 364 364
2022 151 0 0 151 121 121 121 364 212
2023 151 151 0 303 121 121 121 364 61
2024~ 151 151 151 454 121 121 121 364 -91
(Prepared by JICA Study Team)
Note: The value of Annual O&M cost for one turbine is estimated based on the average value of Annual O&M cost for one turbine in Sutami
power station in the past 6 years.
(3) Financial Benefit
With regard to the financial benefit, values of net increase of tariff revenue resulting from the net
increase of energy produced and reduction of O&M cost are calculated.
1) Increase of Electric Tariff Revenue
The values of net increase in electric tariff revenue are derived from the net increase of energy
with the project (With Project – Without Project) and the average electric tariff, which is
worked out based on the present electric tariff of Rp 740/kWh (as of 2010) with annual
escalation of 1.5% . Values of annual net increase of energy over the project period are
presumed to be as follows (Case 1 and Case 2): (The reasons for the assumption of Case 1
and Case 2 are already explained in the section on economic analysis.)

Final Report Chapter 5 Economic and Financial Analysis
5 - 13
Table 5.1.2-4 Annual Net Increase of Energy Produced (Unit: GWh)
Without PrWith Pro. Net Increase Without Pro. With Pro. Net Increase
2014 427 410 17- 427 410 17-
2015 427 417 10- 427 417 10-
2016 427 423 4- 427 423 4-
2017 414 440 26 414 440 26
2018 414 440 26 414 440 26
2019 414 440 26 414 440 26
2020 0 440 440 0 440 440
2021 0 440 440 0 440 440
2022 0 440 440 307 440 133
2023 0 440 440 307 440 133
2024 0 440 440 307 440 133
2025 0 440 440 440 440 -
…... 0 440 440 440 440 -
2060 0 440 440 440 440 -
yearCase 1 Case 2
(Prepared by JICA Study Team)
2) Reduction of O&M Cost
As denoted in the previous section, the negative values of net O&M cost suggest the positive
effect of this project, and should be counted as benefit items.
(4) Calculation of FIRR
FIRR is calculated using the values of financial cost and benefit, which are arranged in the cash
flow table as shown in the Appendix. Major results are as follows:
Table 5.1.2-5 Major Results of Financial Analysis
Case FIRR FNPV B/C
1 35% Rp1,606,755 million 9.2
2 23% Rp. 203,117 million 2.0
(Prepared by JICA Study Team)
The results show that FIRR values of both Case 1 and Case 2 exceed the Indonesian social discount
rate of 10% by a large margin, FNPV values appear as positive values, and values of B/C are far
larger than 1. The financial effect of Case 1 is better than Case 2 mainly because the net increase of
power benefit (including energy benefit and capacity benefit) in Case 1 is much greater.
(5) Sensitivity Analysis
1) Assumptions for Analysis
The sensitivity analysis is conducted with the purpose of verifying how the change of previous
assumptions for the project will affect the results of the evaluation. Three scenarios for both
Case 1 and Case2 are assumed as follows:

Final Report Chapter 5 Economic and Financial Analysis
5 - 14
- Scenario 1: Construction cost rises by 10% and 20%. (Scenario 1a and 1b)
- Scenario 2: Electric tariff decreases by 10% and 20%. (Scenario 2a and 2b)
- Scenario 3: Construction cost rises by 20% concurrently with the decline of electric tariff
by 20%.
2) Results of Analysis
The results of sensitivity analysis are revealed in the following two tables.
For case 1, with the change of previous assumptions for the project, the value of FIRR is
expected to vary between 30% and 34%. The results of all the cases assumed here are well
above the level of 10%. Even under the strictest conditions assumed in Scenario 3, the project
is still far better than what is required.
Table 5.1.2-6 Results of Sensitivity Analysis for Case 1
Scenario 1a 1b 2a 2b 3
FIRR 34% 33% 34% 32% 30%
FNPV(million Rp) 1,591,177 1,575,600 1,429,677 1,245,992 1,214,836
B/C 8.5 7.9 8.3 7.3 6.3
(Prepared by JICA Study Team)
Regarding Case 2, the value of FIRR is expected to vary from 16% to 21%. Although Case 2
does not seem as profitable as Case 1, it is still far better than what is required.
Table 5.1.2-7 Results of Sensitivity Analysis for Case 2
Scenario 1a 1b 2a 2b 3
FIRR 21% 20% 21% 19% 16%
FNPV(million Rp) 187,539 171,962 166,542 123,391 92,236
B/C 1.9 1.8 1.9 1.6 1.4
(Prepared by JICA Study Team)

Final Report Chapter 5 Economic and Financial Analysis
5 - 15
5.2 Economic and Financial Analysis of Rehabilitation Work for Wlingi
5.2.1 Economic Analysis
(1) Methodology and Basic Assumption
The economic analysis of the rehabilitation work for Wlingi Hydropower Station is conducted
using the same methodology and basic assumptions as those for the Sutami project.
(2) Economic Cost
1) Capital Cost (Initial Investment Cost)
Table 5.2.1-1 Capital Cost (Economic Price) (Unit: million Rp.)
1st year 2nd year 3rd year 4th year 5th year 6th year Category Total
(2011) (2012) (2013) (2014) (2015) (2016)
1.Construction Cost
FC 172,353 - - - 57,451 57,451 57,451 Generating Equipment LC 15,260 - - - 5,087 5,087 5,087
FC 2,537 - - - 846 846 846 Transmission and Substation LC 3 - - - 1 1 1
FC 174,891 0 0 0 58,297 58,297 58,297Sub-total 1
LC 15,262 0 0 0 5,087 5,087 5,087
2. Indirect Cost
FC 13,991 2,332 2,332 2,332 2,332 2,332 2,332 Engineering services LC 1,221 203 203 203 203 203 203
FC 28,332 - - - 9,444 9,444 9,444 Physical contingencies LC 2,472 - - - 824 824 824
FC 42,324 2,332 2,332 2,332 11,776 11,776 11,776Sub-total 2
LC 3,693 203 203 203 1,028 1,028 1,028
FC 217,214 2,332 2,332 2,332 70,073 70,073 70,073Total
LC 18,956 203 203 203 6,115 6,115 6,115
Grand Total FC+LC 236,170 2,535 2,535 2,535 76,188 76,188 76,188
(Prepared by JICA Study Team)
2) Annual O&M Cost
i) Case 1
Regarding Case 1, the O&M cost in the ‘With Project’ case is expected to decline by 20%
starting from 2017 following the completion of the construction work. On the other hand,
the O&M cost in the ‘Without Project’ scenario is supposed to remain at the same level
until 2022, when the operation of the aging machines will come to a total stop and the
O&M cost will become 0.
ii) Case 2
As for Case 2, O&M cost in the ‘With Project’ case is expected to be the same as in Case
1. In the ‘Without Project’ case, however, it is supposed to come up again to around half
of the normal level starting from 2024 and will reach this level from 2027 onwards when
the rusty machines have been repaired one way or another.
Final Report Chapter 5 Economic and Financial Analysis
5 - 16
Table 5.2.1-2 Net Increase of O&M Cost over the Project Period (Case 1) (Unit: million Rp.)
Without Project With Project
Year Turbine #1
Turbine #2
Total O&M Cost
Turbine #1
Turbine #2Total O&M Cost
Net Increase of
O&M Cost
2011 80 80 160 80 80 160 0
…… 80 80 160 80 80 160 0
2017 80 80 160 64 64 128 -32
…… 80 80 160 64 64 128 -32
2022~ 0 0 0 64 64 128 128
(Prepared by JICA Study Team)
Note: The value of Annual O&M cost for one turbine is estimated based on the average value of Annual O&M cost for one turbine
in Wlingi Power Station in the past 6 years
Table 5.2.1-3 Net Increase of O&M Cost over the Project Period (Case 2) (Unit: million Rp.)
Without Project With Project Year Turbine
#1 Turbine
#2 Total O&M
Cost Turbine
#1 Turbine
#2 Total O&M
Cost
Net Increase of O&M
Cost
2011 80 80 160 80 80 160 0
…... 80 80 160 80 80 160 0
2017 80 80 160 64 64 128 -32
…... 80 80 160 64 64 128 -32
2022 0 0 0 64 64 128 128
2023 0 0 0 64 64 128 128
2024~ 40 40 80 64 64 128 48
…... 40 40 80 64 64 128 48
2027~ 80 80 160 64 64 128 -32
(Prepared by JICA Study Team)
Note: The value of Annual O&M cost for one turbine is estimated based on the average value of Annual O&M cost for one turbine
in Wlingi Power Station in the past 6 years.
(4) Economic Benefit
1) Annual Power Benefit
Regarding the Wlingi project, owing to the lack of reliable output data, the capacity benefit
expressed by the difference of power capacity between the ‘With Project’ and ‘Without
Project’ cases is neglected. Accordingly, the annual power benefit here refers only to the
values of energy benefit, which are calculated using the kWh value of gas turbine plant (for
peak load) and coal steam plant (for base load), and the difference of energy produced between
‘With Project’ and ‘Without Project’ cases.
By using the kWh value mentioned in the section on Sutami project, the values of annual
energy benefit are derived as denoted in the following table, which reflect the two cases that
are different only under the ‘Without Project’ case.

Final Report Chapter 5 Economic and Financial Analysis
5 - 17
Table 5.2.1-4 Net Increase of Energy Benefit (Unit: GWh)
Case 1 Case 2 Year
Without Project With Project Net Increase Without Project With Project Net Increase
2011 140 140 0 140 140 0
…... 140 140 0 140 140 0
2016 140 140 0 140 140 0
2017 140 144 4 140 144 4
…... 140 144 4 140 144 4
2021 140 144 4 140 144 4
2022 0 144 144 0 144 144
2023 0 144 144 0 144 144
2024 0 144 144 70 144 74
2025 0 144 144 70 144 74
2026 0 144 144 70 144 74
2027~ 0 144 144 140 144 4
(Prepared by JICA Study Team)
With regard to the ‘Without Project’ case, the values of power generated are assumed to fall to
0 from 2022 with the shutdown of the aging equipment in Case 1, while it is assumed that the
power generated would partially restored starting in 2024 and fully restored from 2027
onwards.
2) Reduction of O&M Cost
The negative values of net O&M cost denoted in Table 5.2.1-2 and 5.2.1-3 are to be counted as
benefit items.
3) Reduction of CO2 Emission
The benefit of CO2 emission reduction is estimated using the same methodology and
assumptions as those for the Sutami project.
(5) Calculation of EIRR
As what have been done in the analysis of the Sutami project, the values of EIRR in both Case 1
and Case 2 of the Wlingi project are calculated first by disregarding the benefit of CO2 reduction
and then considering this benefit. The respective cash flow tables are shown in the Appendix, and
major results are as follows:
Table 5.2.1-5 Major Results of Economic Analysis
Case EIRR ENPV B/C
1(1) 13% Rp.82,539 million 1.6 CO2 Reduction Benefit
Excluded 2(1) 2% Rp. -74,924 million 0.5
1(2) 15% Rp. 130,801 million 1.9 CO2 Reduction Benefit
Included 2(2) 4% Rp. -59,561 million 0.6
(Prepared by JICA Study Team)

Final Report Chapter 5 Economic and Financial Analysis
5 - 18
The results show that the EIRR value of Case 1 is expected to pass the Indonesian social discount
rate requirement even when the CO2 reduction benefit is excluded. As for Case 2, the EIRR value
is expected to fall to 2% if the CO2 reduction benefit is disregarded and will remain far below the
level of the social discount rate even if the benefit of CO2 reduction is taken into account.
Therefore, Case 2 is economically unfeasible whether the benefit of CO2 reduction is considered or
not.
(6) Sensitivity Analysis
1) Assumptions for Analysis
The sensitivity analysis here focuses on Case 1(1) which disregards the effect of CO2 reduction
benefit. Three scenarios are assumed as follows:
- Scenario 1: Construction cost rises by 10%. (Scenario 1a and 1b)
- Scenario 2: Fuel cost for alternative power supply decreases by 10% and 20%. (Scenario
2a and 2b)
- Scenario 3: Construction cost rises by 20% concurrently with the decline of fuel cost by
20% for alternative power supply.
2) Results of Analysis
The results of sensitivity analysis are indicated in the following table.
For case 1(1), with the change of previous assumptions for the project, the value of EIRR is
expected to vary between 11% and 13%, but, even under the strictest conditions assumed in
Scenario 3, EIRR value will remain above the level of social discount rate.
Table 5.2.1-6 Results of Sensitivity Analysis for Case 1(1)
Scenario 1a 1b 2a 2b 3
EIRR 13% 12% 12% 12% 11%
ENPV (million Rp.) 70,697 58,853 59,507 36,475 12,789
B/C 1.4 1.3 1.4 1.2 1.1
(Prepared by JICA Study Team)
5.2.2 Financial Analysis
(1) Methodology and Basic Assumptions
The methodology and basic assumptions for the financial analysis of the Wlingi project are the
same as what have been adopted in the case of the Sutami project.
(2) Financial Cost
1) Capital Cost

Final Report Chapter 5 Economic and Financial Analysis
5 - 19
Major items of the capital cost are indicated in the following table:
Table 5.2.2-1 Capital Cost (Unit: million Rp.)
1st year 2nd year 3rd year 4th year 5th year 6th year
(2011) (2012) (2013) (2014) (2015) (2016)
FC 172,353 - - - 57,451 57,451 57,451
LC 16,955 - - - 5,652 5,652 5,652
FC 2,537 - - - 846 846 846
LC 3 - - - 1 1 1
FC 174,891 0 0 0 58,297 58,297 58,297
LC 16,958 0 0 0 5,653 5,653 5,653
FC 13,991 2,332 2,332 2,332 2,332 2,332 2,332
LC 1,357 226 226 226 226 226 226
FC 28,332 - - - 9,444 9,444 9,444
LC 2,747 - - - 916 916 916
FC 42,324 2,332 2,332 2,332 11,776 11,776 11,776
LC 4,104 226 226 226 1,142 1,142 1,142
FC 217,214 2,332 2,332 2,332 70,073 70,073 70,073
LC 21,062 226 226 226 6,794 6,794 6,794
Grand Total FC+LC 238,276 2,558 2,558 2,558 76,867 76,867 76,867
2. Indirect Cost
Engineering services
Physical contingencies
Sub-total 2
Total
Category Total
1.Construction Cost
Generating Equipment
Transmission and Substation
Sub-total 1
(Prepared by JICA Study Team)
2) O&M Cost
Values of O&M cost in Case 1 and Case 2 are shown in the following two tables.
Table 5.2.2-2 Net Increase of O&M Cost over the Project Period (Case 1) (Unit: million Rp.)
Without Project With Project
Year Turbine #1 Turbine #2
Total O&M
Cost Turbine #1 Turbine #2
Total O&M
Cost
Net
Increase of
O&M Cost
2011 89 89 178 89 89 178 0
…… 89 89 178 89 89 178 0
2017 89 89 178 71 71 143 -36
…… 89 89 178 71 71 143 -36
2022~ 0 0 0 71 71 143 143
(Prepared by JICA Study Team)
Note: The value of Annual O&M cost for one turbine is estimated based on the average value of annual O&M cost for one turbine in
Wlingi Power Station in the past 6 years.

Final Report Chapter 5 Economic and Financial Analysis
5 - 20
Table 5.2.2-3 Net Increase of O&M Cost over the Project Period (Case 2) (Unit: million Rp.)
Without Project With Project
Year Turbine #1 Turbine #2
Total O&M
Cost Turbine #1 Turbine #2
Total O&M
Cost
Net Increase
of O&M
Cost
2011 89 89 178 89 89 178 0
…... 89 89 178 89 89 178 0
2017 89 89 178 71 71 143 -36
…... 89 89 178 71 71 143 -36
2022 0 0 0 71 71 143 143
2023 0 0 0 71 71 143 143
2024 45 45 89 71 71 143 53
…... 45 45 89 71 71 143 53
2027~ 89 89 178 71 71 143 -36
(Prepared by JICA Study Team)
Note: The value of Annual O&M cost for one turbine is estimated based on the average value of annual O&M cost for one turbine in
Wlingi Power Station in the past 6 years.
(3) Financial Benefit
With regard to the financial benefit, values of net increase of tariff revenue resulting from the net
increase of energy produced and reduction of O&M cost are calculated.
1) Increase of Electric Tariff Revenue
The values of net increase in electric tariff revenue are derived from the net increase of energy
with the project (With Project – Without Project) and the average electric tariff, worked out in
the same way as what has been done in the section of Sutami. Values of annual net increase of
energy over the project period are the same as what have been revealed in Table 5.2.1-4 under
the economic analysis.
2) Reduction of O&M Cost
As denoted in the previous section, the negative values of net O&M cost suggest the positive
effect of this project, and should be counted as benefit items.
(4) Calculation of FIRR
FIRR is calculated using the values of financial cost and benefit, which are arranged in the cash
flow table as shown in the Appendix. Major results are as follows:
Table 5.2.2-4 Major Results of Economic Analysis
Case FIRR FNPV B/C
1 14% Rp. 218,062 million 1.8
2 3% Rp. -138,696 million 0.5
(Prepared by JICA Study Team)
The results show that the FIRR value of Case 1 exceeds the Indonesian social discount rate of 10%.
Final Report Chapter 5 Economic and Financial Analysis
5 - 21
In Case 2, however, FIRR value comes out as 3%, FNPV value appears to be a negative value, and
the B/C value is less than 1. Accordingly, Case 2 is financially unfeasible.
(5) Sensitivity Analysis
1) Assumptions for Analysis
Three scenarios for Case 1 are assumed as follows:
- Scenario 1: Construction cost rises by 10% and 20%. (Scenario 1a and 1b)
- Scenario 2: Electric tariff decreases by 10% and 20%. (Scenario 2a and 2b)
- Scenario 3: Construction cost rises by 20% concurrently with the decline of electric tariff
by 20%.
2) Results of Analysis
The results of sensitivity analysis are revealed in the following table.
With the change of previous assumptions, the value of FIRR is expected to vary from 12% to
14%. Even under the strictest conditions assumed in Scenario 3, EIRR value will remain above
the level of social discount rate.
Table 5.2.2-5 Results of Sensitivity Analysis for Case 1
Scenario 1a 1b 2a 2b 3
FIRR 14% 14% 13% 12% 12%
FNPV (million Rp.) 206,113 194,165 168,420 118,310 94,413
B/C 1.7 1.6 1.6 1.4 1.3
(Prepared by JICA Study Team)

Final Report Chapter 5 Economic and Financial Analysis
5 - 22
5.3 Economic and Financial Analysis of Rehabilitation Work for Sutami and Wlingi
5.3.1 Calculation of EIRR
(1) Results of EIRR
When the rehabilitation works in Sutami and Wlingi are combined into a single project, the results
of EIRR calculation for Case 1 and Case 2, both considering and disregarding the CO2 reduction
effect, are derived as follows:
Table 5.3.1-1 Major Results of Economic Analysis
Case EIRR ENPV B/C
1(1) 22% Rp.843,391 million 3.5 CO2 Reduction Benefit
Excluded 2(1) 10% Rp.2,401 million 1.0
1(2) 24% Rp. 1,069,730 million 4.1 CO2 Reduction Benefit
Included 2(2) 12% Rp.62,215 million 1.2
(Prepared by JICA Study Team)
The results show that EIRR values of both Case 1 and Case 2 will exceed the Indonesian social
discount rate of 10% whether the CO2 reduction effect is considered or not. The economic effect of
Case 1 is better than Case 2 mainly because the net increase of power benefit in Case 1 is much
greater. It is worth noting that even in the economically unfeasible Case 2 for Wlingi project, it will
become feasible when implemented together with Sutami project.
(2) Sensitivity Analysis
1) Assumptions for Analysis
Three scenarios for Case 1(1) and Case 2(2) are assumed as follows:
- Scenario 1: Construction cost rises by 10% (Scenario 1a and 1b)
- Scenario 2: Fuel cost for alternative power supply decreases by 10% and 20%. (Scenario
2a and 2b)
- Scenario 3: Construction cost rises by 20% concurrently with the decline of fuel cost by
20% for alternative power supply.
2) Results of Analysis
The results of the sensitivity analysis are revealed in the following tables.
Regarding Case 1(1), the value of EIRR is expected to vary between 18% and 21%. Even
under the strictest conditions assumed in Scenario 3, the project is still economically feasible.

Final Report Chapter 5 Economic and Financial Analysis
5 - 23
Table 5.3.1-2 Results of Sensitivity Analysis for Case 1(1)
Scenario 1a 1b 2a 2b 3
EIRR 21% 20% 21% 20% 18%
ENPV (million Rp.) 816,907 789,626 740,236 6,536,413 581,851
B/C 3.2 3.0 3.2 2.9 2.5
(Prepared by JICA Study Team)
As for Case 2(2), the value of EIRR will be from 8% to 11%, and it will slip to the level below
10% only when in the strictest Scenario 3. But it is worth noting that Case 2(2) takes into
account the benefit of CO2 reduction, so the result could be worse when this item is excluded.
Table 5.3.1-3 Results of Sensitivity Analysis for Case 2(2)
Scenario 1a 1b 2a 2b 3
EIRR 11% 10% 11% 10% 8%
ENPV (million Rp.) 34,935 7,654 32,020 1,771 -52,790
B/C 1.1 1.0 1.1 1.0 0.9
(Prepared by JICA Study Team)
5.3.2 Calculation of FIRR
(1) Results of FIRR
FIRR is calculated using the values of financial cost and benefit, which are arranged in the cash
flow table as shown in the Appendix. Major results are as follows:
Table 5.3.2-1 Major Results of Financial Analysis
Case FIRR FNPV B/C
1 25% Rp. 1,824,815 million 4.8
2 12% Rp. 64,422 million 1.1
(Prepared by JICA Study Team)
The results show that both Case 1 and Case 2 are financially sound with their values of FIRR
exceeding the social discount rate, FNPV coming out as positive figures and B/C higher than 1.
(2) Sensitivity Analysis
1) Assumptions for the Analysis
Three scenarios for Case 1 and Case 2 are assumed as follows:
- Scenario 1: Construction cost rises by 10% and 20%. (Scenario 1a and 1b)
- Scenario 2: Electric tariff decreases by 10% and 20%. (Scenario 2a and 2b)
- Scenario 3: Construction cost rises by 20% concurrently with the decline of electric tariff
by 20%.

Final Report Chapter 5 Economic and Financial Analysis
5 - 24
2) Results of Analysis
The results of the sensitivity analysis are revealed in the following tables.
Regarding Case 1, the value of FIRR is expected to vary between 21% and 25%, but will
remain well above the level of the social discount rate even under the strictest conditions
assumed in Scenario 3.
Table 5.3.2-2 Results of Sensitivity Analysis for Case 1
Scenario 1a 1b 2a 2b 3
FIRR 25% 24% 24% 23% 21%
FNPV (million Rp.) 1,797,287 1,769,762 1,594,724 1,364,244 1,309,275
B/C 4.5 4.3 4.3 3.8 3.4
(Prepared by JICA Study Team)
As for Case 2, when electric tariff is cut down by 20%, the value of FIRR is expected to fall to
9%, and if the 20% cut of electric tariff occurs concurrently with a 20% rise in construction
cost, the value of FIRR is will further slip down to 7%.
Table 5.3.2-3 Results of Sensitivity Analysis for Case 2
Scenario 1a 1b 2a 2b 3
FIRR 11% 10% 10% 9% 7%
FNPV (million Rp.) 36,895 9,369 10,205 -43,991 -99,044
B/C 1.1 1.0 1.0 0.9 0.8
(Prepared by JICA Study Team)

Chapter 6 Environmental and Social Considerations

Final Report Chapter 6 Environmental and Social Considerations
6 - 1
CHAPTER 6 ENVIRONMENTAL AND SOCIAL CONSIDERATIONS
6.1 Basic Information
6.1.1 Objectives
The purpose of environmental and social considerations in this Study is to confirm issues for the
implementation of rehabilitation project of Sutami and Wlingi hydropower stations and
countermeasures for sedimentation of Mrica Reservoir selected as the results of screening of the
existing hydropower stations.
In addition, examinations for the current environmental condition at the Brantas River basin, in
where Sutami and Wlingi are located, were conducted and the study results were described based
on the collected data and information in Section 6.5.
6.1.2 Regulations and Administrative Framework
(1) Relevant Regulations
Table 6.1-1 shows the relevant regulations in Indonesia related to environmental and social
considerations as referred to in this study.
Table 6.1-1 Relevant Environmental Regulations
Regulation No. Regulation Title
Law No. 5/1990 Conservation of living natural resources and its ecosystem
Law No. 24/1992 Spatial Design
Law No. 23/1997 Management of living environment
Presidential Decree No. 32/1990 Management of protected area
Government Regulation No. 10/1993 Protection of cultural heritage
Decree of Ministry of Environment No. 48/MENLH/11/1996
Noise standards
Decree of Ministry of Environment No. 49/MENLH/11/1996
Vibration standards
Decree of Ministry of Environment No. 50/MENLH/11/1996
Odor standards
Government Regulation No.7/1999 Protection of plant and animal species
Government Regulation No. 19/1999 Seawater pollution control
Government Regulation No. 41/1999 Air quality management and pollution control
Government Regulation No. 82/2001 Water quality management and water quality control
Government regulation No. 74 Hazardous waste material management
Presidential Decree No. 36/2005 Provision of land for development in public interest
(Prepared by JICA Study Team)
(2) AMDAL Approval Procedure
Relevant regulations on environmental impact assessment in Indonesia (AMDAL: Analysis

Final Report Chapter 6 Environmental and Social Considerations
6 - 2
Mengenai Dampak Lingkungar Hidup) are listed in Table 6.1-2.
Table 6.1-2 Relevant Regulations on AMDAL
Regulation No. Regulation Title
Decree of State Minister of Environment No.
56/1996
Criteria on significant environmental impact
Decree of Head of BAPEDAL No.
KEP299/11/1996
Guideline on the social aspect in AMDAL
Decree of Head of BAPEDAL No.
KP124/12/1997
Guideline on public health aspect in AMDAL
Governmental Regulation No. 27/1999 Environmental Impact Analysis (AMDAL)
Presidential Decree No. 10/2000 Environmental Impact Management Agency (BAPEDAL)
Decree of Minister of Environment No.
2/MENLH/02/2000
Guideline on AMDAL document evaluation
Decree of Ministry of Environment No.
4/MENLH/02/2000
Guideline on preparing the AMDAL document for integrated
residential development activity
Decree of Ministry of Environment No.
5/MENLH/2000
Guideline on preparing the AMDAL document for development
activity in wetland area
Decree of Ministry of Environment No.
8/MENLH/02/2000
Public involvement and information release on the analytical process
concerning AMDAL
Decree of Ministry of Environment No.
9/MENLH/02/2000
Designing guideline of environmental impact assessment
Decree of Ministry of Environment No.
17/2001
Type and size of business and/or activities requiring AMDAL
document
Decree of Ministry of Environment No.
40/2000
About the Guideline Administration Commission of Assessor for
Environmental Impact Analysis. (AMDAL)
Decree of Ministry of Environment No.
41/2000
Guideline in Forming the Commission of Assessor for
Environmental Impact Analysis (AMDAL).
Decree of Ministry of Environment No.
42/2000
Formation of Membership of Commission of Technical Team and
Assessor of AMDAL.
(Prepared by JICA Study Team)
AMDAL approval procedure is shown in Figure 6.1-1 and outlined below.
A project executer submits the prepared terms of reference (TOR) to the AMDAL committee for
appraisal. After appraisal, an environmental study is implemented. The environmental
assessment report (ANDAL: Analisis Dampak Lingkungan), environmental management plan
(RKL: Rencana Pengelolaan Lingkungan) and environmental monitoring plan (RPL: Rencana
Pemantauan Lingkungan) are then prepared and appraised by the AMDAL committee. The result
of the appraisal is reported by the AMDAL committee to the designated ministry responsible for
the project. Information about environmental approval is announced within 75 days after obtaining
the appraisal result from the AMDAL committee.

Final Report Chapter 6 Environmental and Social Considerations
6 - 3
Figure 6.1-1 AMDAL Approval Procedure (Prepared by JICA Study Team)
6.2 Environmental Considerations for Rehabilitation Activities at Sutami and Wlingi
Section 4.1 proposes rehabilitation project for Sutami and Wlingi hydropower stations in order to
improve facility functions. Environmental and social considerations for the project are therefore
examined, and the expected impacts are shown in Table 6.2-1. The environmental checklist from
Japan Bank for International Cooperation Guideline for Confirmation of Environmental and Social
Considerations issued in April 2002 (the JBIC Guideline) for proposed activities is shown in Table
6.4-1.
Table 6.2-1 Expected Impact and Examination Points for Rehabilitation Activities at Sutami and Wlingi
Power Stations
Rehabilitation Activities Expected Impact Examination Points
Sutami and Wlingi
Rehabilitation for generating equipment (Water Turbine, Inlet Valves, Governor, AVR, Generator, Control/Protection System)1
[During Construction] Oil pollution Treatment of wastes (oil, concrete, iron) Noise and vibration [Operation and Maintenance] Oil pollution due to operation and maintenance work
[During Construction] Establishment of risk management Setting sheet or frame to prevent oil leakageAnnouncement to local residents in advance[Operation and Maintenance] Establishment of risk management Setting sheet or frame to prevent oil leakage. Safety education of workers
(Prepared by JICA Study Team)
1 As for Wlingi power station, rehabilitation activities are proposed for Water Turbine, Governor, Generator, Control/Protection System.

Final Report Chapter 6 Environmental and Social Considerations
6 - 4
6.3 Environmental Considerations for Mrica Reservoir
6.3.1 Current Condition
(1) Situation of Environmental Impact Assessment
The ANDAL report was prepared in 1993. However, its existence was not confirmed according to
the environmental department of IP. RKL and RPL were also prepared and kept by IP, and
outline of them is shown below.
1) RLK
It was considered in RLK that optimum environmental management of Mrica reservoir might be
possible through several approaches such as technical, economic and institutional approaches. The
outline of these approaches is described below.
a) Technical Approach
- Installation of warning system such as radio announcement
- Installation of protection in a garbage dumping place in the upstream to prevent
flowing garbage into the river basin
- Cleaning aquatic weed and garbage in the reservoir, and utilizing aquatic weed
for domestic animal feed
- Relocation of infrastructure and public facilities
- Development of the reservoir area in order to utilize labor force from the
agriculture sector
- Securing landslide around the reservoir area, and utilizing open area effectively
where construction activities occupied
b) Economic Approach
- Providing priority to local residents for construction labors
- Providing opportunities to local residents to take advantages of existing social
facilities
- Using local resources for development and operation of the project including
socio-economic condition
c) Institutional Approach
- Handling natural and social environmental issues with relevant authorities by
establishing a special team
- Establishing a special team to control inundation chaired by the deputy governor

Final Report Chapter 6 Environmental and Social Considerations
6 - 5
of Central Java province
- Establishing a rescue team for an accident due to water from the reservoir and
establishing a health unit at the time of inundation or filling of water
- Establishing a technical unit of transportation of the lake and the river
Expected impacts and mitigation measures were highlighted in Table 6.3-1.
Table 6.3-1 Outline of RLK for Mrica Reservoir
Stage Factor Expected Impact Mitigation Measures Pre-Construction Land Acquisition 10 villages accounting for
2,550 households were project affected people who were requested resettlement, and there was difficulty on negotiation of compensation amount.
PLN provided compensation amount according to discussion with the project affected people.
Construction 1. Transportation - Road & Bridge - Public health and
safety 2. Land
- Hydrology - Flora and Fauna
1. Transportation - Degradation of road
condition due to transportation of construction machines.
- Negative impact to public health and safety due to increasing of transportation of construction machines
2. Land - Increasing the risk of run
off and erosion - Disruption of ecological
balance due to loss of vegetation and habitat
1. Transportation - Maintenance and repair of road and
bridge regularly - Installation of traffic signal - Spraying water - Plantation trees and preparation of
wall 2. Land
- Creating greenbelt around the reservoir by planting perennial plants
Operation 1. Inundation - Displacement - Loss of Public Facility - Public Health - Discharging Water - Safety at downstream
area - Safety at reservoir area
3. Water Quality - Degradation of water
quality in reservoir
1. Inundation - Unrest of displaced
people - Loss of public facilities - Some accidents during
inundation - Unhealthy condition due
to weed growing and garbage flowing
2. Discharging Water - Risk of people who used
river water at downstream
- Unstabilization of slop around reservoir area
- Impact to irrigation at downstream due to lack of nutrition
3. Water Quality - Stratification of water
temperature - Impact to aquatic flora
and fauna in the reservoir4. Dislocation
- Risk of dislocation due to the scale of the reservoir and geological feature
1. Inundation - No clear description about mitigation
measures of people displacement - Relocation and rebuild of public
facilities - Preparation of rescue team for filling
water - Cleaning water to prevent growing
weed and providing medication for employees at the power station
- Clearing the land before inundation 2. Discharging Water
- Installing radio announcement system of discharging water
- Applying the best technical method such as surface drainage, slope treatment, sub-drainage, rock-fill, earth-fill, etc.
- Appropriate water quality treatment by considering the water quality standard
3. Water Quality - Conducting turnover of water in he
reservoir 4. Dislocation
- Consultation with communities around the reservoir
- Cooperation with regional geological office
(Source: Prepared by JICA Study Team based on RLK for Mrica Reservoir)
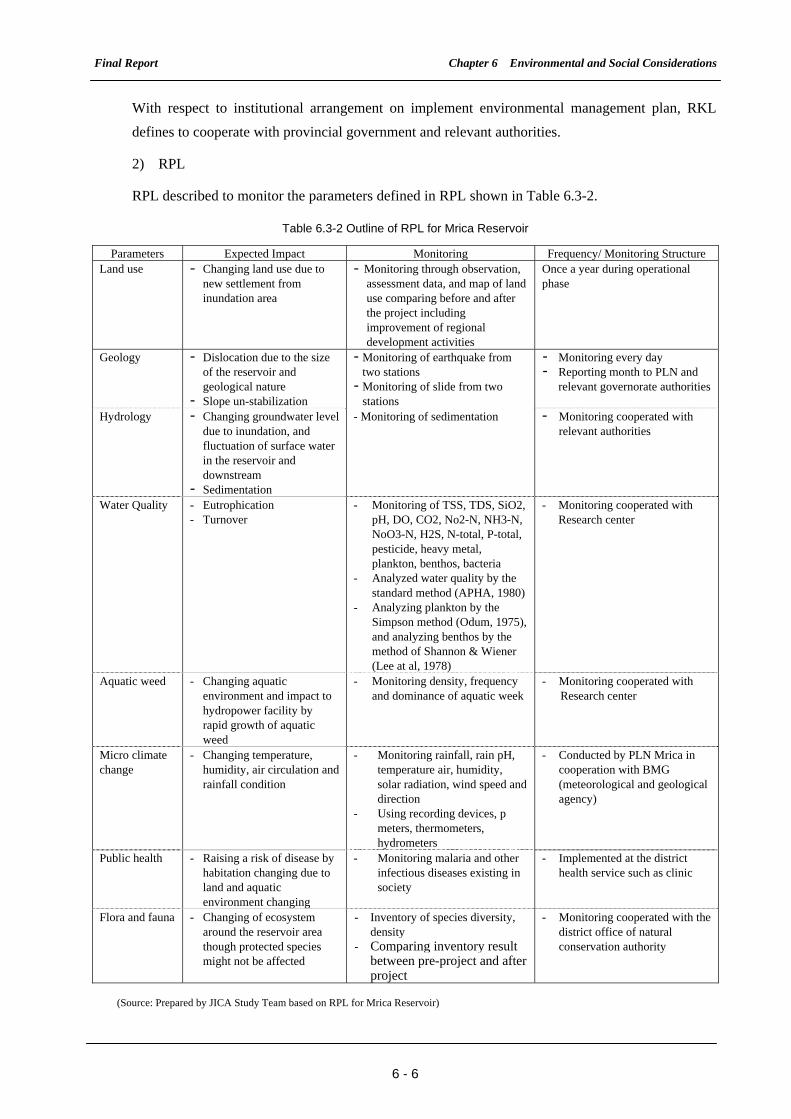
Final Report Chapter 6 Environmental and Social Considerations
6 - 6
With respect to institutional arrangement on implement environmental management plan, RKL
defines to cooperate with provincial government and relevant authorities.
2) RPL
RPL described to monitor the parameters defined in RPL shown in Table 6.3-2.
Table 6.3-2 Outline of RPL for Mrica Reservoir
Parameters Expected Impact Monitoring Frequency/ Monitoring Structure Land use - Changing land use due to
new settlement from inundation area
- Monitoring through observation, assessment data, and map of land use comparing before and after the project including improvement of regional development activities
Once a year during operational phase
Geology - Dislocation due to the size of the reservoir and geological nature
- Slope un-stabilization
- Monitoring of earthquake from two stations
- Monitoring of slide from two stations
- Monitoring every day - Reporting month to PLN and
relevant governorate authorities
Hydrology - Changing groundwater level due to inundation, and fluctuation of surface water in the reservoir and downstream
- Sedimentation
- Monitoring of sedimentation - Monitoring cooperated with relevant authorities
Water Quality - Eutrophication - Turnover
- Monitoring of TSS, TDS, SiO2, pH, DO, CO2, No2-N, NH3-N, NoO3-N, H2S, N-total, P-total, pesticide, heavy metal, plankton, benthos, bacteria
- Analyzed water quality by the standard method (APHA, 1980)
- Analyzing plankton by the Simpson method (Odum, 1975), and analyzing benthos by the method of Shannon & Wiener (Lee at al, 1978)
- Monitoring cooperated with Research center
Aquatic weed - Changing aquatic environment and impact to hydropower facility by rapid growth of aquatic weed
- Monitoring density, frequency and dominance of aquatic week
- Monitoring cooperated with Research center
Micro climate change
- Changing temperature, humidity, air circulation and rainfall condition
- Monitoring rainfall, rain pH, temperature air, humidity, solar radiation, wind speed and direction
- Using recording devices, p meters, thermometers, hydrometers
- Conducted by PLN Mrica in cooperation with BMG (meteorological and geological agency)
Public health - Raising a risk of disease by habitation changing due to land and aquatic environment changing
- Monitoring malaria and other infectious diseases existing in society
- Implemented at the district health service such as clinic
Flora and fauna - Changing of ecosystem around the reservoir area though protected species might not be affected
- Inventory of species diversity, density
- Comparing inventory result between pre-project and after project
- Monitoring cooperated with the district office of natural conservation authority
(Source: Prepared by JICA Study Team based on RPL for Mrica Reservoir)
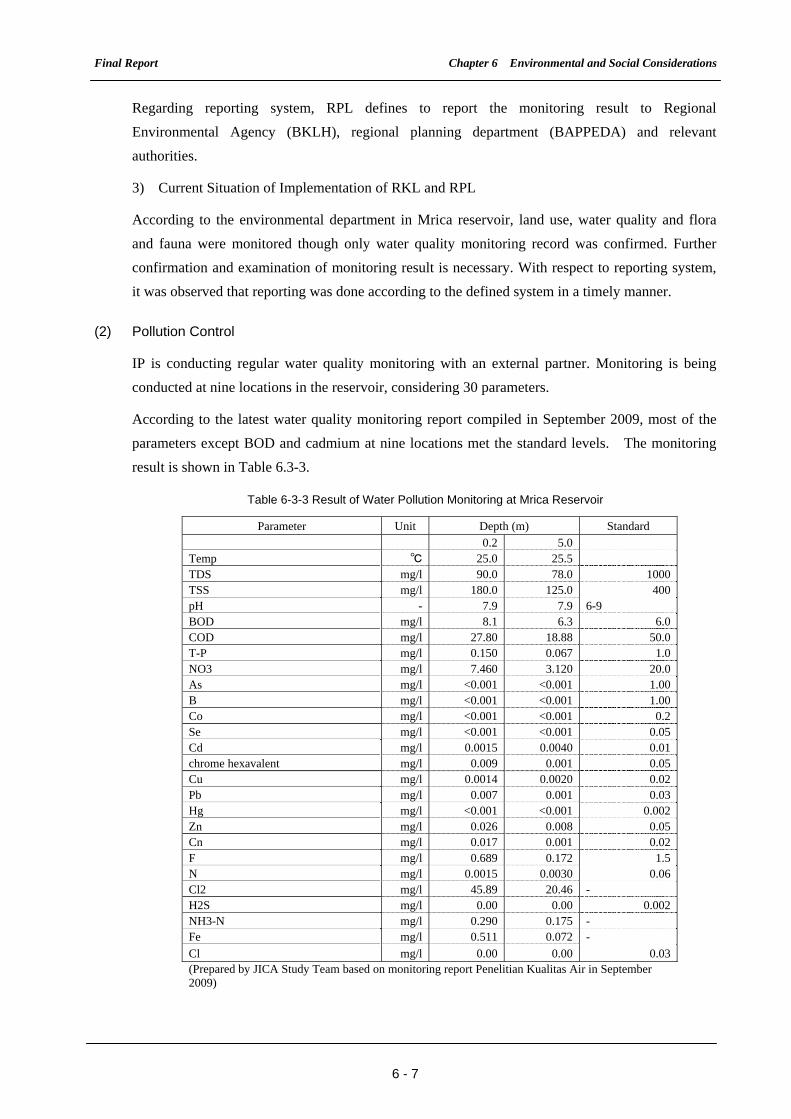
Final Report Chapter 6 Environmental and Social Considerations
6 - 7
Regarding reporting system, RPL defines to report the monitoring result to Regional
Environmental Agency (BKLH), regional planning department (BAPPEDA) and relevant
authorities.
3) Current Situation of Implementation of RKL and RPL
According to the environmental department in Mrica reservoir, land use, water quality and flora
and fauna were monitored though only water quality monitoring record was confirmed. Further
confirmation and examination of monitoring result is necessary. With respect to reporting system,
it was observed that reporting was done according to the defined system in a timely manner.
(2) Pollution Control
IP is conducting regular water quality monitoring with an external partner. Monitoring is being
conducted at nine locations in the reservoir, considering 30 parameters.
According to the latest water quality monitoring report compiled in September 2009, most of the
parameters except BOD and cadmium at nine locations met the standard levels. The monitoring
result is shown in Table 6.3-3.
Table 6-3-3 Result of Water Pollution Monitoring at Mrica Reservoir
Parameter Unit Depth (m) Standard
0.2 5.0 Temp ℃ 25.0 25.5 TDS mg/l 90.0 78.0 1000TSS mg/l 180.0 125.0 400pH - 7.9 7.9 6-9 BOD mg/l 8.1 6.3 6.0 COD mg/l 27.80 18.88 50.0 T-P mg/l 0.150 0.067 1.0 NO3 mg/l 7.460 3.120 20.0 As mg/l <0.001 <0.001 1.00 B mg/l <0.001 <0.001 1.00 Co mg/l <0.001 <0.001 0.2Se mg/l <0.001 <0.001 0.05Cd mg/l 0.0015 0.0040 0.01chrome hexavalent mg/l 0.009 0.001 0.05Cu mg/l 0.0014 0.0020 0.02Pb mg/l 0.007 0.001 0.03Hg mg/l <0.001 <0.001 0.002Zn mg/l 0.026 0.008 0.05Cn mg/l 0.017 0.001 0.02F mg/l 0.689 0.172 1.5N mg/l 0.0015 0.0030 0.06Cl2 mg/l 45.89 20.46 - H2S mg/l 0.00 0.00 0.002NH3-N mg/l 0.290 0.175 - Fe mg/l 0.511 0.072 -
Cl mg/l 0.00 0.00 0.03(Prepared by JICA Study Team based on monitoring report Penelitian Kualitas Air in September 2009)
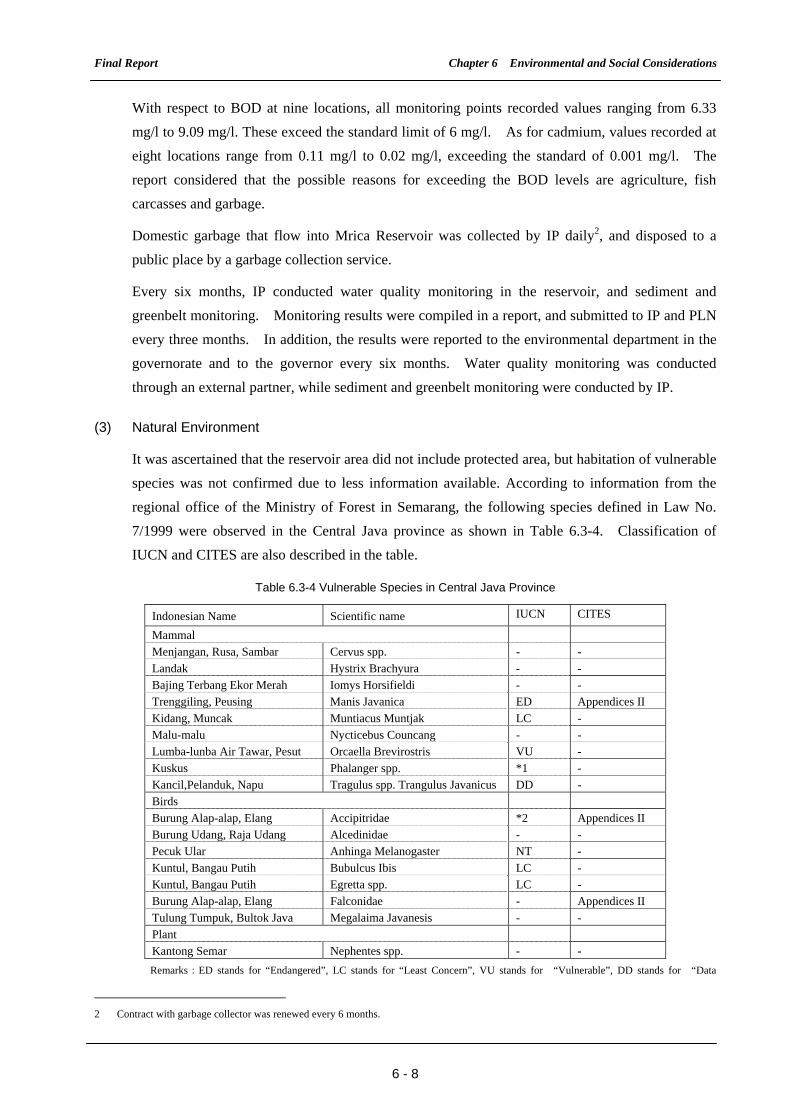
Final Report Chapter 6 Environmental and Social Considerations
6 - 8
With respect to BOD at nine locations, all monitoring points recorded values ranging from 6.33
mg/l to 9.09 mg/l. These exceed the standard limit of 6 mg/l. As for cadmium, values recorded at
eight locations range from 0.11 mg/l to 0.02 mg/l, exceeding the standard of 0.001 mg/l. The
report considered that the possible reasons for exceeding the BOD levels are agriculture, fish
carcasses and garbage.
Domestic garbage that flow into Mrica Reservoir was collected by IP daily2, and disposed to a
public place by a garbage collection service.
Every six months, IP conducted water quality monitoring in the reservoir, and sediment and
greenbelt monitoring. Monitoring results were compiled in a report, and submitted to IP and PLN
every three months. In addition, the results were reported to the environmental department in the
governorate and to the governor every six months. Water quality monitoring was conducted
through an external partner, while sediment and greenbelt monitoring were conducted by IP.
(3) Natural Environment
It was ascertained that the reservoir area did not include protected area, but habitation of vulnerable
species was not confirmed due to less information available. According to information from the
regional office of the Ministry of Forest in Semarang, the following species defined in Law No.
7/1999 were observed in the Central Java province as shown in Table 6.3-4. Classification of
IUCN and CITES are also described in the table.
Table 6.3-4 Vulnerable Species in Central Java Province
Indonesian Name Scientific name IUCN CITES
Mammal
Menjangan, Rusa, Sambar Cervus spp. - -
Landak Hystrix Brachyura - -
Bajing Terbang Ekor Merah Iomys Horsifieldi - -
Trenggiling, Peusing Manis Javanica ED Appendices II
Kidang, Muncak Muntiacus Muntjak LC -
Malu-malu Nycticebus Councang - -
Lumba-lunba Air Tawar, Pesut Orcaella Brevirostris VU -
Kuskus Phalanger spp. *1 -
Kancil,Pelanduk, Napu Tragulus spp. Trangulus Javanicus DD -
Birds
Burung Alap-alap, Elang Accipitridae *2 Appendices II
Burung Udang, Raja Udang Alcedinidae - -
Pecuk Ular Anhinga Melanogaster NT -
Kuntul, Bangau Putih Bubulcus Ibis LC -
Kuntul, Bangau Putih Egretta spp. LC -
Burung Alap-alap, Elang Falconidae - Appendices II
Tulung Tumpuk, Bultok Java Megalaima Javanesis - -
Plant
Kantong Semar Nephentes spp. - -
Remarks:ED stands for “Endangered”, LC stands for “Least Concern”, VU stands for “Vulnerable”, DD stands for “Data
2 Contract with garbage collector was renewed every 6 months.
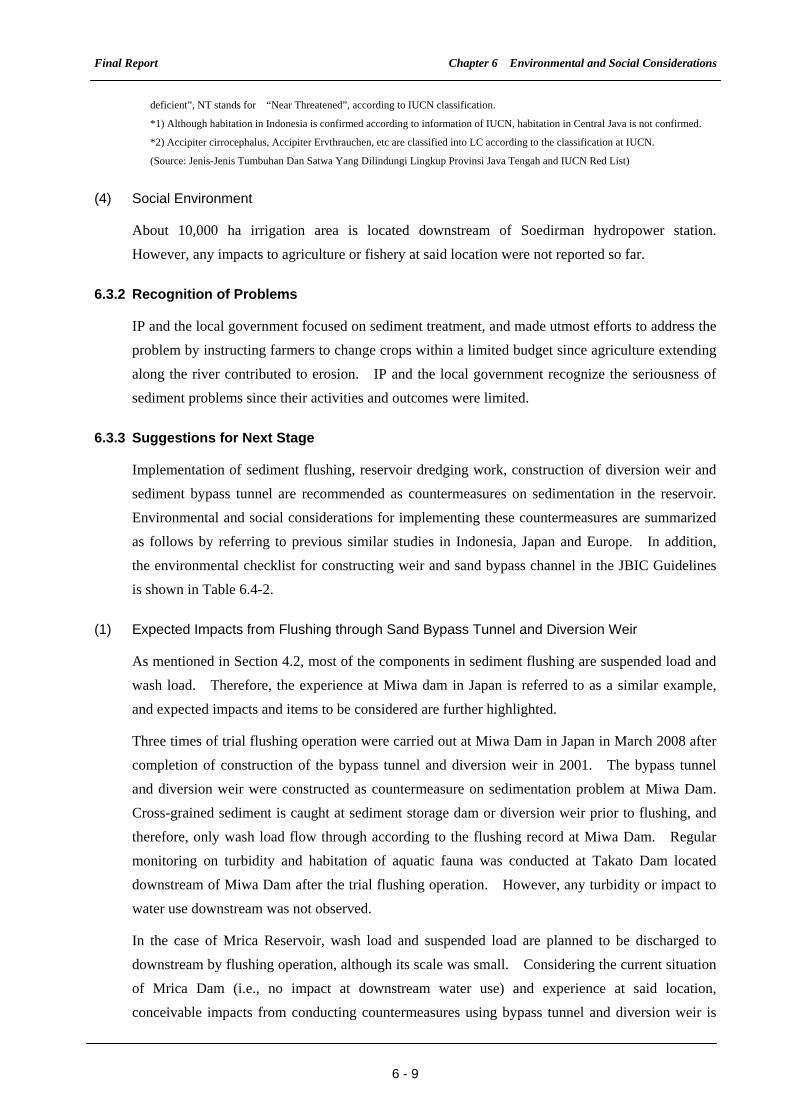
Final Report Chapter 6 Environmental and Social Considerations
6 - 9
deficient”, NT stands for “Near Threatened”, according to IUCN classification.
*1) Although habitation in Indonesia is confirmed according to information of IUCN, habitation in Central Java is not confirmed.
*2) Accipiter cirrocephalus, Accipiter Ervthrauchen, etc are classified into LC according to the classification at IUCN.
(Source: Jenis-Jenis Tumbuhan Dan Satwa Yang Dilindungi Lingkup Provinsi Java Tengah and IUCN Red List)
(4) Social Environment
About 10,000 ha irrigation area is located downstream of Soedirman hydropower station.
However, any impacts to agriculture or fishery at said location were not reported so far.
6.3.2 Recognition of Problems
IP and the local government focused on sediment treatment, and made utmost efforts to address the
problem by instructing farmers to change crops within a limited budget since agriculture extending
along the river contributed to erosion. IP and the local government recognize the seriousness of
sediment problems since their activities and outcomes were limited.
6.3.3 Suggestions for Next Stage
Implementation of sediment flushing, reservoir dredging work, construction of diversion weir and
sediment bypass tunnel are recommended as countermeasures on sedimentation in the reservoir.
Environmental and social considerations for implementing these countermeasures are summarized
as follows by referring to previous similar studies in Indonesia, Japan and Europe. In addition,
the environmental checklist for constructing weir and sand bypass channel in the JBIC Guidelines
is shown in Table 6.4-2.
(1) Expected Impacts from Flushing through Sand Bypass Tunnel and Diversion Weir
As mentioned in Section 4.2, most of the components in sediment flushing are suspended load and
wash load. Therefore, the experience at Miwa dam in Japan is referred to as a similar example,
and expected impacts and items to be considered are further highlighted.
Three times of trial flushing operation were carried out at Miwa Dam in Japan in March 2008 after
completion of construction of the bypass tunnel and diversion weir in 2001. The bypass tunnel
and diversion weir were constructed as countermeasure on sedimentation problem at Miwa Dam.
Cross-grained sediment is caught at sediment storage dam or diversion weir prior to flushing, and
therefore, only wash load flow through according to the flushing record at Miwa Dam. Regular
monitoring on turbidity and habitation of aquatic fauna was conducted at Takato Dam located
downstream of Miwa Dam after the trial flushing operation. However, any turbidity or impact to
water use downstream was not observed.
In the case of Mrica Reservoir, wash load and suspended load are planned to be discharged to
downstream by flushing operation, although its scale was small. Considering the current situation
of Mrica Dam (i.e., no impact at downstream water use) and experience at said location,
conceivable impacts from conducting countermeasures using bypass tunnel and diversion weir is

Final Report Chapter 6 Environmental and Social Considerations
6 - 10
summarized as follows:
- Degradation of water quality due to decreasing water flow into Mrica Reservoir
- Short period turbidity at downstream area
- Impact to aquatic flora and fauna due to turbidity
- Changing aquatic environment due to the increase in river bed level
(2) Expected Impacts from Sediment Flushing Operation
With respect to sediment flushing, the experience at Dashidaira Dam in Japan and study result from
“Water Resources Existing Facilities Rehabilitation and Capacity Improvement Project,” conducted
under JBIC loan No.IP-510 in 2005 is useful references in examining the impacts at Serayu River
basin.
At Dashidaira Dam, the first sediment flushing operation was conducted in 1985, six years after
operation started. Organic substances changed its nature in an anaerobic condition for six years,
which caused turbidity with offensive odor at downstream after the flushing operation.
Meanwhile, study results from “Water Resources Existing Facilities Rehabilitation and Capacity
Improvement Project”, revealed the outcomes of flushing as summarized below.
- A few days of offensive odor; however, its impact was not serious;
- Increasing the level of turbidity, BOC, COD, SS by approximately 10 times the usual
condition; and
- Many dead fishes after several days of flushing operation.
Although flushing and dredging have been carried out at Mrica Dam, its scale of 0.1 MCM/year is
considered small. There are no records on impacts at downstream of the dam so far. However,
BOD level is higher than the standard level according to the monitoring result. Based on such
condition, it is considered that there is a possibility of causing offensive odor and turbidity at
downstream when flushing operation is conducted at the dam, although its impact is not as serious
as in Dashidaira Dam. In addition, impact to aquatic flora and fauna and fisheries is expected
based on the findings from “Water Resources Existing Facilities Rehabilitation and Capacity
Improvement Project”. Expected impacts are summarized below.
- Short period offensive odor in downstream river basin
- Short period turbidity in downstream river
- Short to middle period of impact to aquatic flora and fauna due to wash load
- Impact to fisheries along downstream river
(3) Expected Impacts from Dredging Operation
Flushing dredged sediment to downstream and disposing dredged sediment at the dead area in the
reservoir site is proposed. Regarding flushing of dredged sediment to downstream, dredged
sediments, divided into wash load/suspended load, should be flushed while the bed load to be
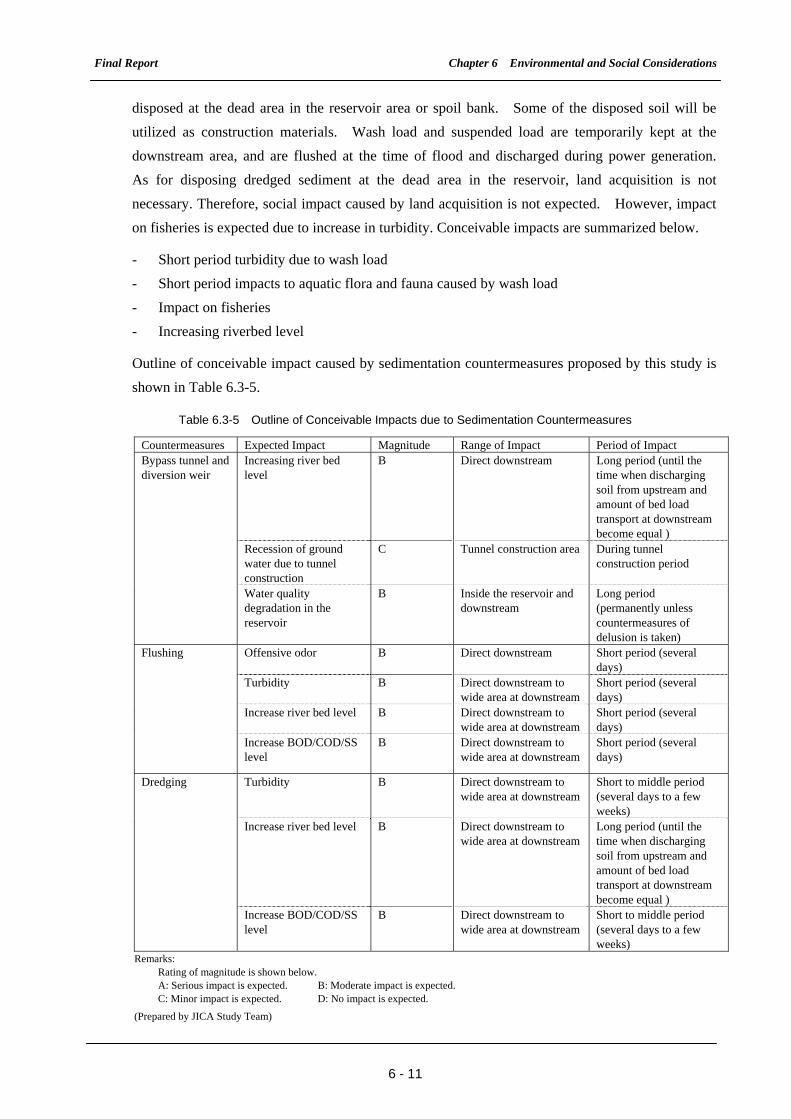
Final Report Chapter 6 Environmental and Social Considerations
6 - 11
disposed at the dead area in the reservoir area or spoil bank. Some of the disposed soil will be
utilized as construction materials. Wash load and suspended load are temporarily kept at the
downstream area, and are flushed at the time of flood and discharged during power generation.
As for disposing dredged sediment at the dead area in the reservoir, land acquisition is not
necessary. Therefore, social impact caused by land acquisition is not expected. However, impact
on fisheries is expected due to increase in turbidity. Conceivable impacts are summarized below.
- Short period turbidity due to wash load
- Short period impacts to aquatic flora and fauna caused by wash load
- Impact on fisheries
- Increasing riverbed level
Outline of conceivable impact caused by sedimentation countermeasures proposed by this study is
shown in Table 6.3-5.
Table 6.3-5 Outline of Conceivable Impacts due to Sedimentation Countermeasures
Countermeasures Expected Impact Magnitude Range of Impact Period of Impact Increasing river bed level
B Direct downstream Long period (until the time when discharging soil from upstream and amount of bed load transport at downstream become equal )
Bypass tunnel and diversion weir
Recession of ground water due to tunnel construction
C Tunnel construction area During tunnel construction period
Water quality degradation in the reservoir
B Inside the reservoir and downstream
Long period (permanently unless countermeasures of delusion is taken)
Offensive odor B Direct downstream Short period (several days)
Turbidity B Direct downstream to wide area at downstream
Short period (several days)
Increase river bed level B Direct downstream to wide area at downstream
Short period (several days)
Flushing
Increase BOD/COD/SS level
B Direct downstream to wide area at downstream
Short period (several days)
Turbidity B Direct downstream to wide area at downstream
Short to middle period (several days to a few weeks)
Increase river bed level B Direct downstream to wide area at downstream
Long period (until the time when discharging soil from upstream and amount of bed load transport at downstream become equal )
Dredging
Increase BOD/COD/SS level
B Direct downstream to wide area at downstream
Short to middle period (several days to a few weeks)
Remarks: Rating of magnitude is shown below. A: Serious impact is expected. B: Moderate impact is expected. C: Minor impact is expected. D: No impact is expected.
(Prepared by JICA Study Team)
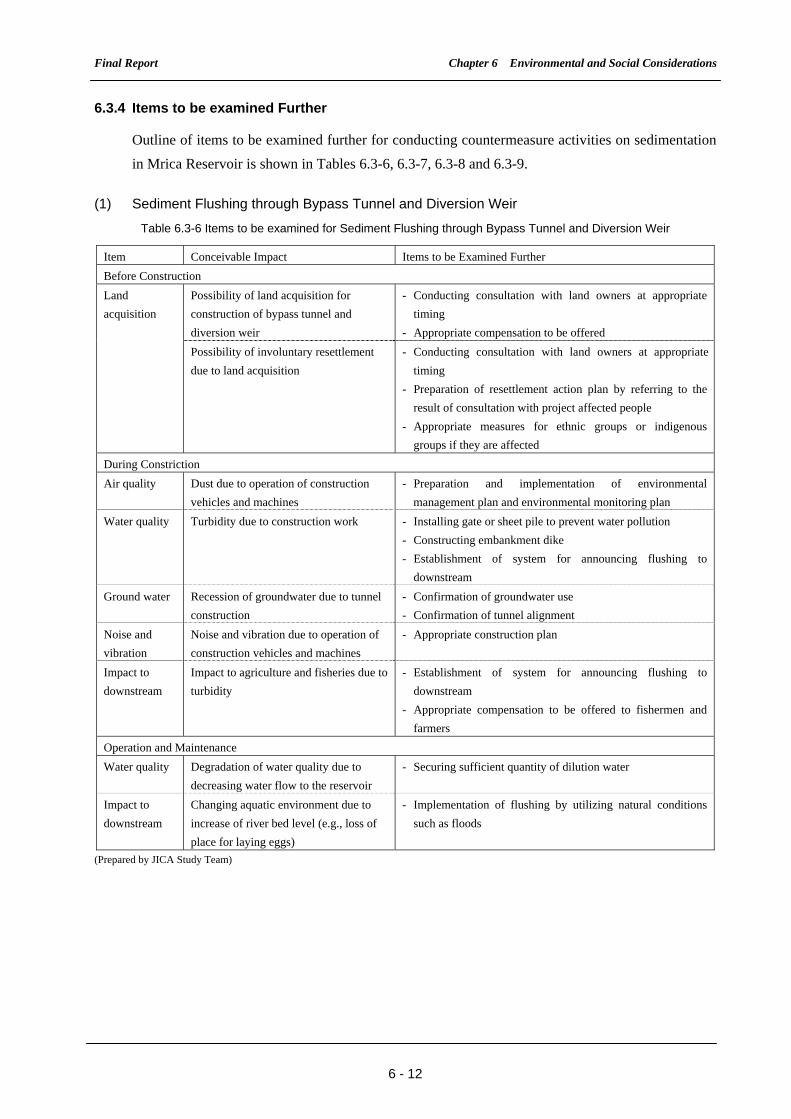
Final Report Chapter 6 Environmental and Social Considerations
6 - 12
6.3.4 Items to be examined Further
Outline of items to be examined further for conducting countermeasure activities on sedimentation
in Mrica Reservoir is shown in Tables 6.3-6, 6.3-7, 6.3-8 and 6.3-9.
(1) Sediment Flushing through Bypass Tunnel and Diversion Weir
Table 6.3-6 Items to be examined for Sediment Flushing through Bypass Tunnel and Diversion Weir
Item Conceivable Impact Items to be Examined Further
Before Construction
Possibility of land acquisition for
construction of bypass tunnel and
diversion weir
- Conducting consultation with land owners at appropriate
timing
- Appropriate compensation to be offered
Land
acquisition
Possibility of involuntary resettlement
due to land acquisition
- Conducting consultation with land owners at appropriate
timing
- Preparation of resettlement action plan by referring to the
result of consultation with project affected people
- Appropriate measures for ethnic groups or indigenous
groups if they are affected
During Constriction
Air quality Dust due to operation of construction
vehicles and machines
- Preparation and implementation of environmental
management plan and environmental monitoring plan
Water quality Turbidity due to construction work - Installing gate or sheet pile to prevent water pollution
- Constructing embankment dike
- Establishment of system for announcing flushing to
downstream
Ground water Recession of groundwater due to tunnel
construction
- Confirmation of groundwater use
- Confirmation of tunnel alignment
Noise and
vibration
Noise and vibration due to operation of
construction vehicles and machines
- Appropriate construction plan
Impact to
downstream
Impact to agriculture and fisheries due to
turbidity
- Establishment of system for announcing flushing to
downstream
- Appropriate compensation to be offered to fishermen and
farmers
Operation and Maintenance
Water quality Degradation of water quality due to
decreasing water flow to the reservoir
- Securing sufficient quantity of dilution water
Impact to
downstream
Changing aquatic environment due to
increase of river bed level (e.g., loss of
place for laying eggs)
- Implementation of flushing by utilizing natural conditions
such as floods
(Prepared by JICA Study Team)
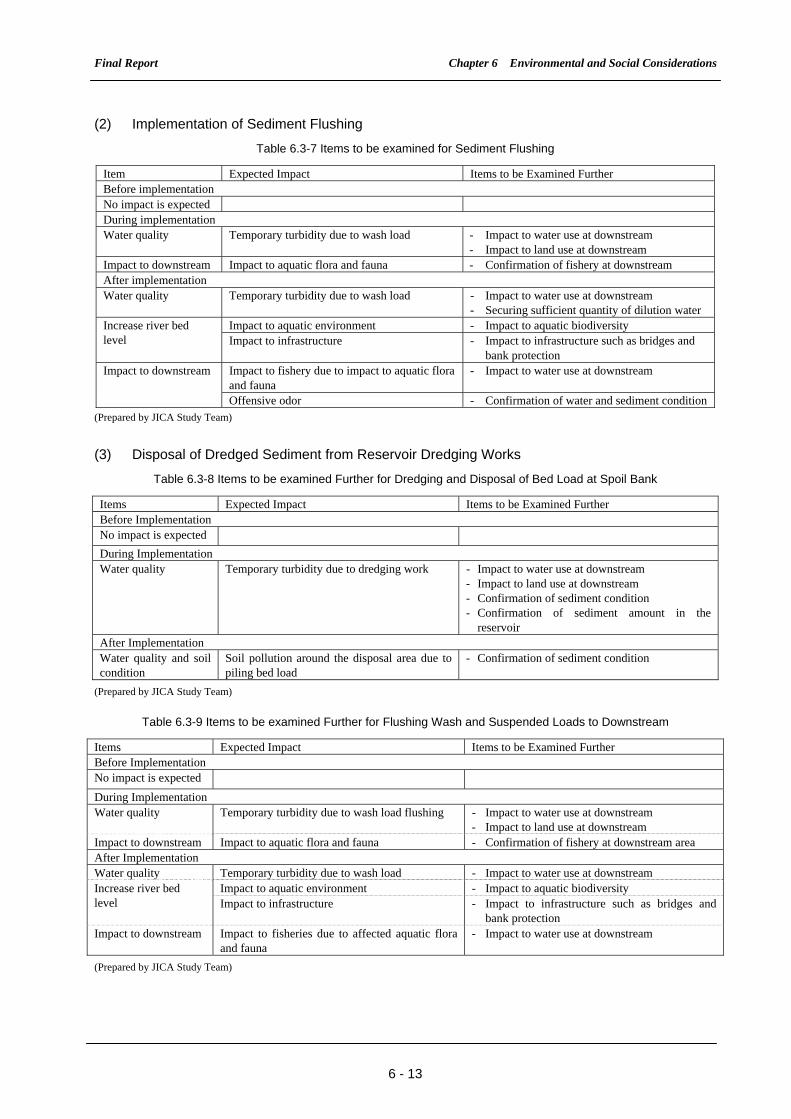
Final Report Chapter 6 Environmental and Social Considerations
6 - 13
(2) Implementation of Sediment Flushing
Table 6.3-7 Items to be examined for Sediment Flushing
Item Expected Impact Items to be Examined Further Before implementation No impact is expected During implementation Water quality Temporary turbidity due to wash load - Impact to water use at downstream
- Impact to land use at downstream Impact to downstream Impact to aquatic flora and fauna - Confirmation of fishery at downstream After implementation Water quality Temporary turbidity due to wash load - Impact to water use at downstream
- Securing sufficient quantity of dilution water Impact to aquatic environment - Impact to aquatic biodiversity Increase river bed
level Impact to infrastructure - Impact to infrastructure such as bridges and bank protection
Impact to downstream Impact to fishery due to impact to aquatic flora and fauna
- Impact to water use at downstream
Offensive odor - Confirmation of water and sediment condition(Prepared by JICA Study Team)
(3) Disposal of Dredged Sediment from Reservoir Dredging Works
Table 6.3-8 Items to be examined Further for Dredging and Disposal of Bed Load at Spoil Bank
Items Expected Impact Items to be Examined Further Before Implementation No impact is expected
During Implementation Water quality Temporary turbidity due to dredging work - Impact to water use at downstream
- Impact to land use at downstream - Confirmation of sediment condition - Confirmation of sediment amount in the
reservoir After Implementation Water quality and soil condition
Soil pollution around the disposal area due to piling bed load
- Confirmation of sediment condition
(Prepared by JICA Study Team)
Table 6.3-9 Items to be examined Further for Flushing Wash and Suspended Loads to Downstream
Items Expected Impact Items to be Examined Further Before Implementation No impact is expected
During Implementation Water quality Temporary turbidity due to wash load flushing - Impact to water use at downstream
- Impact to land use at downstream Impact to downstream Impact to aquatic flora and fauna - Confirmation of fishery at downstream area After Implementation Water quality Temporary turbidity due to wash load - Impact to water use at downstream
Impact to aquatic environment - Impact to aquatic biodiversity Increase river bed level Impact to infrastructure - Impact to infrastructure such as bridges and
bank protection Impact to downstream Impact to fisheries due to affected aquatic flora
and fauna - Impact to water use at downstream
(Prepared by JICA Study Team)

Final Report Chapter 6 Environmental and Social Considerations
6 - 14
(4) Common Issues to be examined for the Implementation of Sediment Countermeasures
The following items need to be examined as common issues for the implementation of sediment
countermeasures mentioned in above (1) to (3).
- Preparation and implementation of appropriate environmental management plan and
environmental monitoring plan
- Establishment of an organization to implement environmental management plan and
environmental monitoring plan
- Establishment of a framework for reporting environmental monitoring result
(5) Items to be examined for the Implementation of Comprehensive Sedimentation
Countermeasures
Due to urgency in implementing sedimentation countermeasures, this Study proposes at (1) and (2)
in Section 4.2.3 to conduct several countermeasures comprehensively, namely: i) flushing through
sand bypass tunnel and diversion weir, ii) flushing, and iii) dredging. Expected impacts for each
countermeasure are examined in Section 6.3.3. When each countermeasure is implemented
comprehensively, the degree of impact is expected to increase. For instance, degradation of water
quality worsens when a diversion weir is constructed since quantity of water inflow to Mrica
Reservoir seemed decreasing. By conducting flushing operation with the degraded condition of
water quality, impact to environment is considered to be much serious compared with flushing
operation during usual condition. Accordingly, examination of an appropriate plan for conducting
sediment countermeasure activities is necessary in addition to examination of mitigation measures
against the expected environmental impact.
(7) Other Issues to be examined
AMDAL approval is necessary depending on the length of tunnel and dredging amount. Thus,
confirmation with the local environmental authority on the necessity of AMDAL is important when
the tunnel length and amount of sediment flushing is examined in detail. In addition, impact
caused by implementing activities related to the sedimentation measures needs to be examined
further.
6.4 Environmental Checklist in the JBIC Guidelines
The environmental checklist as per the JBIC Guidelines for the proposed rehabilitation activities at
Sutami and Wlingi hydropower stations and the countermeasures for sedimentation of Mrica
Reservoir are shown in Tables 6.4-1 and 6.4-2, respectively.

Final Report Chapter 6 Environmental and Social Considerations
6 - 15
6.5 Environmental and Social Issues of Brantas River Basin and Saguling Reservoir
6.5.1 Current Condition of the Brantas River Basin
(1) General
During the site investigation related to Sutami and Wlingi hydropower stations, examinations for
environmental and social conditions of Brantas River basin including Sutami and Wlingi
Reservoirs as well as briefly examination of the Sengguruh Reservoir3 was conducted. Because of
the limited period, confirmation was done through interviews with the environmental departments
at each reservoir and by reviewing existing water quality conditions presented in the water quality
monitoring report.
(2) Situation of Environmental Assessment at the Existing Reservoirs
Environmental impact assessment was not conducted for the Sutami and Wlingi Reservoirs since
they were constructed before the AMDAL relevant regulations were enforced. However,
environmental study was conducted for said reservoirs in 2004 with the purpose of initiating
internal confirmation of the current environmental situation around both reservoirs. The report on
the study result was prepared and submitted to the Ministry of Environment. This however was not
considered as an official report. Therefore, there was no approved ANDAL/ RKL/ RPL for both
reservoirs, and no comments were received from the AMDAL committee.
Apart from the report and as a part of Corporate Social Responsibilities (CSR), PJB has conducted
regular public consultations (i.e., once a year) with neighboring communities to obtain information
on the condition of the reservoir and power station. However, detailed information and results of
regular public consultations were not described in the report regarding CSR namely “Laporan
Lealissi Program CSR/ Community Development, PT PJB Brantas (Tahun 2009)”.
As a part of CSR, plantation at the greenbelt area has also been conducted in order to enhance
nature conservation around the reservoir area.
(3) Pollution Control
1) Result of water quality monitoring
PJB conducted monitoring (mainly machine maintenance) every three months, while water
quality monitoring was conducted once a year by an external partner.
At the reservoirs in Brantas River basin, PJT I also regularly conducted water quality
monitoring at the reservoirs and rivers. The monitoring parameters included temperature,
TDS, TSS, pH, BOD, COD, DO, TP, NO3, NH3, F, NO2, oil and grease, although only BOD,
COD and DO levels were publicized in the monitoring report, Pemantauan Kualitas Air Di Das
3 The Sengguruh Reservoir locates just upstream of the Sutami Reservoir and functions sediment and garbage storage dam for the Sutami
Dam. (Refer to Section 3.4)
Final Report Chapter 6 Environmental and Social Considerations
6 - 16
kali Brantas Tahun 2008.
i) Sutami Reservoir
Water quality monitoring was conducted at three locations by manual sampling and one
location by automatic sampling in Sutami Reservoir. Both BOD and DO levels almost
met the standard, while COD was beyond the normal value. The monitoring result is
shown in Table 6.5-1.
ii) Wlingi Reservoir
Water quality monitoring was conducted at one location by automatic sampling point in
Wlingi Reservoir. Water quality monitoring was conducted every four months, and most
of the parameters met the standard level except for COD measured in April. The
Monitoring result is shown in Table 6.5-1.
2) Implementation structure of water quality monitoring
The results of both monitoring by PJB and PJT I were compiled and reported to PJB Jakarta
office via PJB Surabaya office.
Regarding water quality monitoring conducted by PJT I, monitoring parameters and frequency
were set for each river. Meanwhile, the laboratory of PJT I conducted water quality monitoring
by themselves. The monitoring results were compiled in the annual report, and distributed to
all stakeholders including the environmental department in a municipality.
3) Structure of environmental management at Brantas River basin
Current environmental management structure is formulated with the environmental department
in Malang Region and PJT I. When the environmental department received inquiries from
the public, they explained the condition based on the report from PJT I. They were only in a
position to coordinate between the public and PJT I. However, PJT I request the environmental
department could have responsibility in managing environmental conditions in the Brantas
River basin not only the coordination. Hence, the environmental management structure was
not yet established firmly.
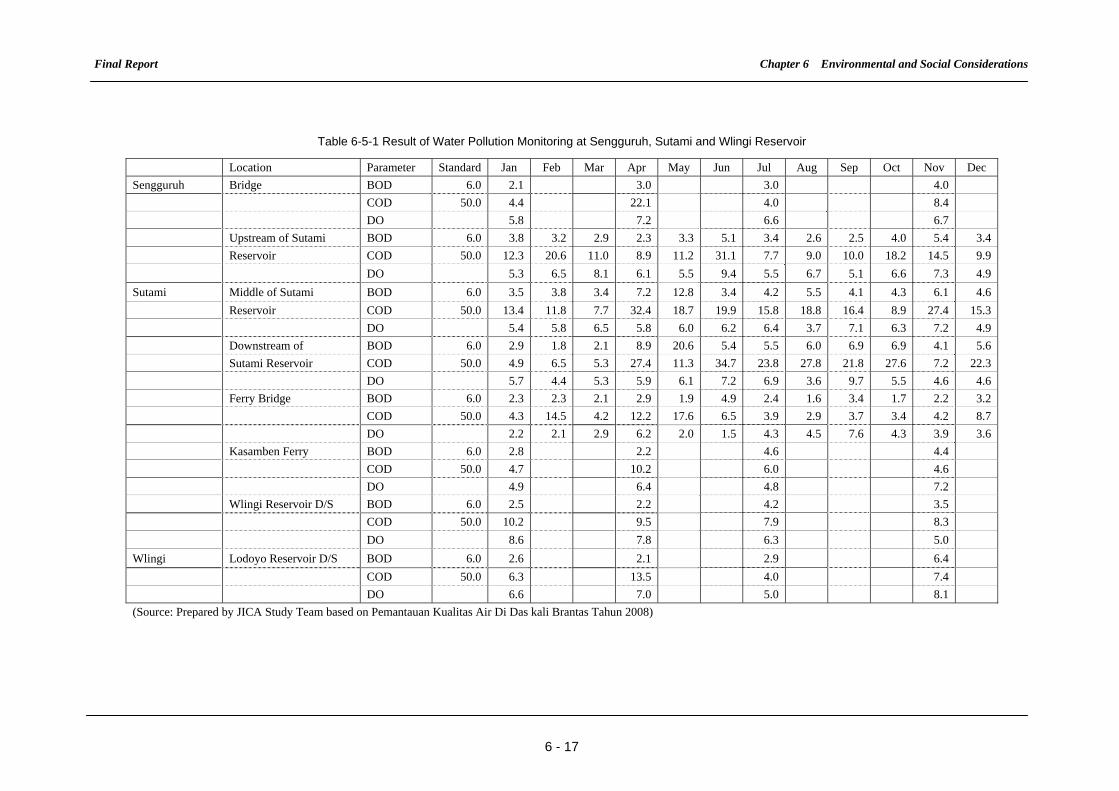
Final Report Chapter 6 Environmental and Social Considerations
6 - 17
Table 6-5-1 Result of Water Pollution Monitoring at Sengguruh, Sutami and Wlingi Reservoir
Location Parameter Standard Jan Feb Mar Apr May Jun Jul Aug Sep Oct Nov Dec
Sengguruh Bridge BOD 6.0 2.1 3.0 3.0 4.0
COD 50.0 4.4 22.1 4.0 8.4
DO 5.8 7.2 6.6 6.7
Upstream of Sutami BOD 6.0 3.8 3.2 2.9 2.3 3.3 5.1 3.4 2.6 2.5 4.0 5.4 3.4
Reservoir COD 50.0 12.3 20.6 11.0 8.9 11.2 31.1 7.7 9.0 10.0 18.2 14.5 9.9
DO 5.3 6.5 8.1 6.1 5.5 9.4 5.5 6.7 5.1 6.6 7.3 4.9
Sutami Middle of Sutami BOD 6.0 3.5 3.8 3.4 7.2 12.8 3.4 4.2 5.5 4.1 4.3 6.1 4.6
Reservoir COD 50.0 13.4 11.8 7.7 32.4 18.7 19.9 15.8 18.8 16.4 8.9 27.4 15.3
DO 5.4 5.8 6.5 5.8 6.0 6.2 6.4 3.7 7.1 6.3 7.2 4.9
Downstream of BOD 6.0 2.9 1.8 2.1 8.9 20.6 5.4 5.5 6.0 6.9 6.9 4.1 5.6
Sutami Reservoir COD 50.0 4.9 6.5 5.3 27.4 11.3 34.7 23.8 27.8 21.8 27.6 7.2 22.3
DO 5.7 4.4 5.3 5.9 6.1 7.2 6.9 3.6 9.7 5.5 4.6 4.6
Ferry Bridge BOD 6.0 2.3 2.3 2.1 2.9 1.9 4.9 2.4 1.6 3.4 1.7 2.2 3.2
COD 50.0 4.3 14.5 4.2 12.2 17.6 6.5 3.9 2.9 3.7 3.4 4.2 8.7
DO 2.2 2.1 2.9 6.2 2.0 1.5 4.3 4.5 7.6 4.3 3.9 3.6
Kasamben Ferry BOD 6.0 2.8 2.2 4.6 4.4
COD 50.0 4.7 10.2 6.0 4.6
DO 4.9 6.4 4.8 7.2
Wlingi Reservoir D/S BOD 6.0 2.5 2.2 4.2 3.5
COD 50.0 10.2 9.5 7.9 8.3
DO 8.6 7.8 6.3 5.0
Wlingi Lodoyo Reservoir D/S BOD 6.0 2.6 2.1 2.9 6.4
COD 50.0 6.3 13.5 4.0 7.4
DO 6.6 7.0 5.0 8.1
(Source: Prepared by JICA Study Team based on Pemantauan Kualitas Air Di Das kali Brantas Tahun 2008)

Final Report Chapter 6 Environmental and Social Considerations
6 - 18
(4) Natural Environment
It was confirmed from the existing reports that both Sutami and Wlingi reservoirs do not include
any protected area although there were no descriptions about protected areas in the review of the
ANDAL report. It is noted however that there is a nature conservation forest called Grand Forest
Park R. Soerjo, which consist of pine natural forest, savanna, and mountain rainforest. Grand
Forest Park R. Soerjo locates approximately 30km south from Sutami Reservoir.
The following flora and fauna were observed around both reservoirs although these were not
included in the list of protected species in Law No.7/1999 as well as CITES. The Internal Union for
Conservation of Nature (IUCN) red list meanwhile includes the species as shown in Tables 6.5-2,
6.5-3 and 6.5-4.
Table 6.5-2 Flora at Sutami Reservoir
Indonesian Name Scientific Name IUCN
Akasia Acacia Avriabiformis -
Albasia Albizzia Falcataria -
Flamboyan Delonya Regia -
Bungur LagestromiaPtecocarpus -
Angasana Indicus -
Mahoni Switenia Mahagoni -
Beringin Ficus Benyamina -
Waru Hibicus Tiliaceus -
Pinus Pinus Merkusii VN (*1)
Remarks:VN stands for “Vulnerable” according to the definition of IUCN.
*1) Habitation of Pinus Merkusii was mentioned at Sumatra Island, according to IUCN.
(Source: Review ANDAL, Sutami Reservoir 2004, IUCN and IUCN Red List)
Table 6.5-3 Fauna at Sutami Reservoir
Indonesian Name Scientific Name IUCN
1.Mamala
Musang Paradoxurus Hermaphoditus -
Kelelawar Pteropus Vampirus -
Codot Hyposideras sp -
2.Birds
Pipit Lonchura lecogastoides -
Gereja Passer montanus LC
Kutilang Pycnonotus Caver -
Bercet Cisticola spp LC (*1)
Pcikrak Prinia familiaris -
Perkutut Gopelia striata
Tekukur Straptopelia chinensis -
Layang-layang Hirundo rustrica -

Final Report Chapter 6 Environmental and Social Considerations
6 - 19
3. Reptiles
Katak daun Hyela parasitica -
Katak sawah Rana cancrivora LC (*2)
Katak darat Bufo melanostotus -
4. Amphibians
Kadal Mabuia multifasciata -
Bunglon Draco lineatus -
Biawak Varanus slvator -
Ular air Natrix piscator -
Remarks:LC stands for the classification of “Least Concern”, according to IUCN.
*1) Cisticola juncidis is classified into LC, according to IUCN.
*2) Fejervarya cancrivora is classified into LC, according to IUCN.
(Source: Review ANDAL, Sutami Reservoir 2004 and IUCN Red List)
Table 6.5-4 Fish at Sutami Reservoir
Indonesian Name Scientific Name IUCN
Wakkai, Jendi, Jambai Pangatiu Micronema -
Keprek Puntius Binaculata -
Palung Hamoala Macrolepidota -
Tawes Puntius Javanicus -
Baderbang Puntius Bramoides -
Gabus Ophiochepalus Striatus -
Tombro Cyprianus Carpio -
Gurami Osprhonemus Gouramy -
Mujair Tilapia Mosambica -
Nila Osteochilus Nilaticus -
Lele Clarias Batrocus -
(Source: Review ANDAL, Sutami Reservoir 2004 and IUCN)
In addition to the above tables, several species, as enumerated in Table 6.5-5, were confirmed at
Wlingi Reservoir.
Table 6.5-5 Additional Species Confirmed at Wlingi Reservoir
Indonesian Name Scientific name IUCN
1 Birds
Puyuh Tumix Susciator
Elang Ruuk、Egreta Garzeta (Kuntul Kecil) Spilornis Cheela LC
Tilil Triaga sp
Copsychus Saularis Aur LC
Heleyon Cloris Raja undang biru
2 Amphibians
Ular belang Bungarus candidus
3 Fishes
Labepbarbus sp Sengkaleng
(Source: Review ANDAL, Wlingi Reservoir 2004)

Final Report Chapter 6 Environmental and Social Considerations
6 - 20
(5) Social Environment
Social environmental issues, caused by the reservoir after its operation, are considered as impacts
to land use and water use in the downstream area. According to the environmental department in
PJB, there were no claims on land use or water use such as agriculture or fishery.
(6) Current Condition at Sengguruh Reservoir
1) General
The “Engineering Study for the Brantas River and Bengawan Solo River Basin” finalized in
February 2005 explained that the pulp factory or tapioca factory in Malang City as well as
along Lesti and Juwok Rivers are the pollution sources of Sengguruh Reservoir. The reservoir
located just upstream of the Sutami Reservoir functions as sediment and garbage storage dam
for the Sutami Dam, as described in Section 3.4. During the site reconnaissance in this Study,
conducted on April 2010, it was found that the condition has not improved, and that
wastewater and garbage continue to flow into the reservoir. Sediments mixed with sand and
garbage was temporarily piled near the reservoir, causing offensive odor. It was confirmed
that a master plan has not yet been prepared for the water and garbage management in Malang
City, except for the planning of an industrial area.
2) Result of water quality monitoring
Manual sampling at one location and automatic sampling at another location were conducted at
Sengguruh Reservoir. Although the BOD and DO almost met the standard levels, COD
exceeded the acceptable value. The monitoring result is shown in Table 6.5-1.
(7) Current Condition of Natural and Social Considerations in Conducting Sediment Treatment in
the Brantas River Basin
Construction of a sediment bypass channel as the sediment countermeasure for the Wlingi
Reservoir is on-going at the time of this Study. AMDAL relevant regulations define the necessity
to obtain AMDAL approval depending on the length of the channel. Environmental impact
assessment was separately conducted by University of Brawijaya in 1995, and by Sinotech
Engineering Consultants Inc. in 1996. However, actual mitigation measures were not confirmed
during the Study.
PJT I and Besar Balley Willya Sungai (BBWS) have been conducting sediment countermeasures
such as dredging, sediment flushing operations and sabo-dam construction works as part of their
job description5, although the responsible party for such countermeasures is the Ministry of the
5 According to the study result of the “Water Resources Existing Facilities Rehabilitation and Capacity Improvement Project, December 2005”,
BAPEPEDAL requested PJR I to prepare RKL and RPL although AMDAL approval was not necessary.
Final Report Chapter 6 Environmental and Social Considerations
6 - 21
Public Works. A spoil bank was established at a vacant space in Wlingi Reservoir6. However, the
environmental condition around the spoil bank was not confirmed prior to the piling of sediment
soil.
6.5.2 Recognition of Problems
PJT I, the responsible authority for the operation and maintenance of reservoirs in the Brantas
River basin, has strategies on watershed management in the river basin for the short term (i.e.,
regular dredging), medium term (i.e., construction of sabo dam) and long term (i.e., conducting
rehabilitation programs in the entire basin). In addition, they understood the importance of
conducting environmental impact assessment and preparing mitigation measures at the time of
implementing these strategies. Moreover, they are also concerned with the necessity to cooperate
with other authorities in order to realize these strategies.
With respect to the prevention of troubles with neighbors due to the dredging treatment, PJT I paid
attention to the social environment of said neighbors such as establishing a system to rent the spoil
bank as the agriculture land, or considering advance announcement to neighbors, including farmers
and fishermen, regarding the dredging to be implemented.
6.5.3 Suggestions for the Next Stage
Establishment of the framework discussed below is recommended to be considered as the next
stage.
(1) Pollution Control
Although wastewater and garbage from Malang City is considered as one of the reasons for the
water pollution at Brantas River, there was no master plan related to wastewater and garbage
management. Preparation of such plan is necessary as soon as possible.
(2) Establishment of Cooperation Mechanism for Water Quality Improvement
It was confirmed from interview survey that demarcation or cooperation among relevant authorities
for the management of Brantas River was vague. Confirmation of the role and responsibility on
river environmental management is necessary within relevant parties such as the environmental
department in a municipality or region. Moreover, cooperation among relevant parties for water
quality improvement and enhancement of river environmental management are necessary to be
examined.
The “Basin Coordination Committee” for the Brantas River basin has been established consisting
of members such as the deputy mayor as the committee leader, and staff from each relevant
6 According to the study result of the “Water Resources Existing Facilities Rehabilitation and Capacity Improvement Project, December 2005”,
the land for three spoil banks around Sutami Reservoir and Wling Reservoir was property of PJT I. Regarding spoil bank around Sutami
Reservoir, it was used by local residents as cultivated area.
Final Report Chapter 6 Environmental and Social Considerations
6 - 22
authority in a province7. However, it does not work effectively. Therefore, reviewing the
structure of the committee is necessary to ensure comprehensive management of the Brantas River
basin.
(3) Establishment of Checking Function on Management of the Brantas River Basin
It is necessary to monitor the environmental administration for sound river basin management.
Therefore, establishment of a committee to monitor river basin management is considered as
necessary in the future.
In Japan and Europe, the monitoring on environmental and social considerations is conducted by a
committee, which involves academic people. Said committee is established to examine the impacts
caused by the maintenance of reservoir and conducting sediment treatment. In order to effectively
conduct river basin management at Brantas River, involvement of academic people in the Basin
Coordination Committee is important. In addition, participation of the committee in
environmental and social monitoring is essential.
7 According to “Brantas River Case Study Indonesia (Dr. Kikkeri V. Pamu, P.E., December 2004)” NGOs and academic people were not
included in the committee as of December 2004.

Table 6.4-1 Environmental Checklist for Sutami and Wlingi Power Stations (1/4)
Category Environmental Item Main Check Items Confirmation of Environmental Considerations
(1) EIA andEnvironmentalPermits
① Have EIA reports been officially completed?② Have EIA reports been approved by authorities of the host country’sgovernment?③ Have EIA reports been unconditionally approved? If conditions are imposed onthe approval of EIA reports, are the conditions satisfied?④ In addition to the above approvals, have other required environmental permitsbeen obtained from the appropriate regulatory authorities of the host country’sgovernment?
①-④ Necessity to prepare EIA report is not expected though confirmation toprepare environmental management plan and environmental monitoring plan to localenvironmental agency is necessary.
(2) Explanation tothe Public
① Are contents of the project and the potential impacts adequately explained to thepublic based on appropriate procedures, including information disclosure? Isunderstanding obtained from the public?② Are proper responses made to comments from the public and regulatoryauthorities?
①-② Explanation of the rehabilitation activities to public is necessary prior toconducting activities.
(1) Air Quality
① Do air pollutants, such as sulfur oxides (SOx), nitrogen oxides (NOx), and sootand dust, and dioxins emitted from various sources, such as incinerators, andvehicles used for waste collection and transportation comply with the country’semission standards and ambient air quality standards?
① Appropriate vehicle operation according to Indonesian regulations and standardsis necessary.
(2) Water Quality
① Do effluents from various facilities comply with the country’s effluent standardsand ambient water quality standards?② Does the water quality of leachates from the waste disposal sites comply with thecountry’s effluent standards and ambient water quality standards?③ Are adequate measures taken to prevent contamination of surface water andgroundwater by these effluents and leachates?
① Effluent from power station is almost met the Indonesian standard though someparameters exeeded it.②-③ Wastes generated from proposed rehabilitation activiteis are expected to bedisposed at an existing waste treatment plant which meets the Indonesian standardfor waste management. Therefore, leachate quality is expected to meet theIndonesian standard accordingly.
(3) Wastes
① Are wastes, such as treatment residues, cinder, and fly ash generated fromcrushing and segregation processes, and diverted wastes from composting processproperly treated and disposed of in accordance with the country’s standards?② Are hazardous and dangerous wastes properly segregated from other wastes,stabilized, treated, and disposed of in accordance with the country’s standards?
①-② Wastes generated from proposed rehabilitation activities are expected to betreated at an existing waste treatment plant which meet the Indonesian standards.
(4) SoilContamination
① Are adequate measures taken to prevent contamination of soil and groundwaterby leachates from the waste disposal sites?
① Wastes generated from proposed rehabilitation activiteis are expected to bedisposed at an existing waste treatment plant which meets the Indonesian standardfor waste management. Therefore, countermeasures for leachate is expected to beconducted by an existing waste treatment plant according to the Indonesianstandards.
(5) Noise andVibration
① Do noise and vibrations generated by the facility operations (especiallyincinerators, waste segregation and crushing facilities), and vehicle traffic for wastecollection and transportation comply with the country’s standards?
① Rehabilitation activities proposed in this Study does not include impact noise andvibration generated by facility operations. Regarding noise and vibration due tovehicle transportation, it will be accord with the Indonesian standards.
(6) Odor ① Are there any odor sources? Are adequate odor control measures taken? ① Any odor sources are not expected.
1 Permits andExplanation
2 MitigationMeasures

Table 6.4-1 Environmental Checklist for Sutami and Wlingi Power Stations (2/4)
Category Environmental Item Main Check Items Confirmation of Environmental Considerations
(1) Protected Areas
① Is the project site located in protected areas designated by the country’s laws orinternational treaties and conventions? Is there a possibility that the project willaffect the protected areas?
① The project site does not include protected areas.
(2) Ecosystem
① Does the project site encompass primeval forests, tropical rain forests,ecologically valuable habitats (e.g., coral reefs, mangroves, or tidal flats)?② Does the project site encompass the protected habitats of endangered speciesdesignated by the country's laws or international treaties and conventions?③ If significant ecological impacts are anticipated, are adequate protectionmeasures taken to reduce the impacts on the ecosystem?④ Is there a possibility that the project will adversely affect aquatic organisms? Ifimpacts are anticipated, are adequate measures taken to reduce the impacts onaquatic organisms?⑤ Is there a possibility that the project will adversely affect vegetation andwildlife? If impacts are anticipated, are adequate measures taken to reduce theimpacts on vegetation and wildlife?
① The project site does not encompass primeval forests, tropical rain forest orecologically valuable habitats.② It is found that a species classified in vulunerable on IUCN red list is said to belocated around the Sutami power station according to ANDAL report.③ Significant ecological impact is not expected by conducting proposedrehabilitation activities.④ Proposed rehabilitation activities is not expected to affect adverse impact toaquatic organisms.⑤ Propsed rehabilitation activities is not expected to affect adverse impact tovegetation and wildlife.
(3) Management ofAbandoned Sites
① Are environmental protection and restoration plans (such as landfill gas andleachate collection and treatment systems, prevention of illegal dumping, andreforestation) after facility closure considered?② Is a sustainable management framework for the abandoned sites established?③ Are adequate financial provisions secured to manage the abandoned sites?
①-③ Proposed rehabilitation activities does not include construction of new wastetreatment plan, therefore impacts from ①-③ are not expected.
4 SocialEnvironment
(1) Resettlement
① Is involuntary resettlement caused by project implementation? If involuntaryresettlement is caused, are efforts made to minimize the impacts caused by theresettlement?② Is adequate explanation on relocation and compensation given to affectedpersons prior to resettlement?③ Is the resettlement plan, including proper compensation, restoration oflivelihoods and living standards developed based on socioeconomic studies onresettlement?④ Does the resettlement plan pay particular attention to vulnerable groups orpersons, including women, children, the elderly, people below the poverty line,ethnic minorities, and indigenous peoples?⑤ Are agreements with the affected persons obtained prior to resettlement?⑥ Is the organizational framework established to properly implement resettlement?Are the capacity and budget secured to implement the plan?⑦ Is a plan developed to monitor the impacts of resettlement?
①-⑦ Involuntary resettlement is not expected.
3 NaturalEnvironment
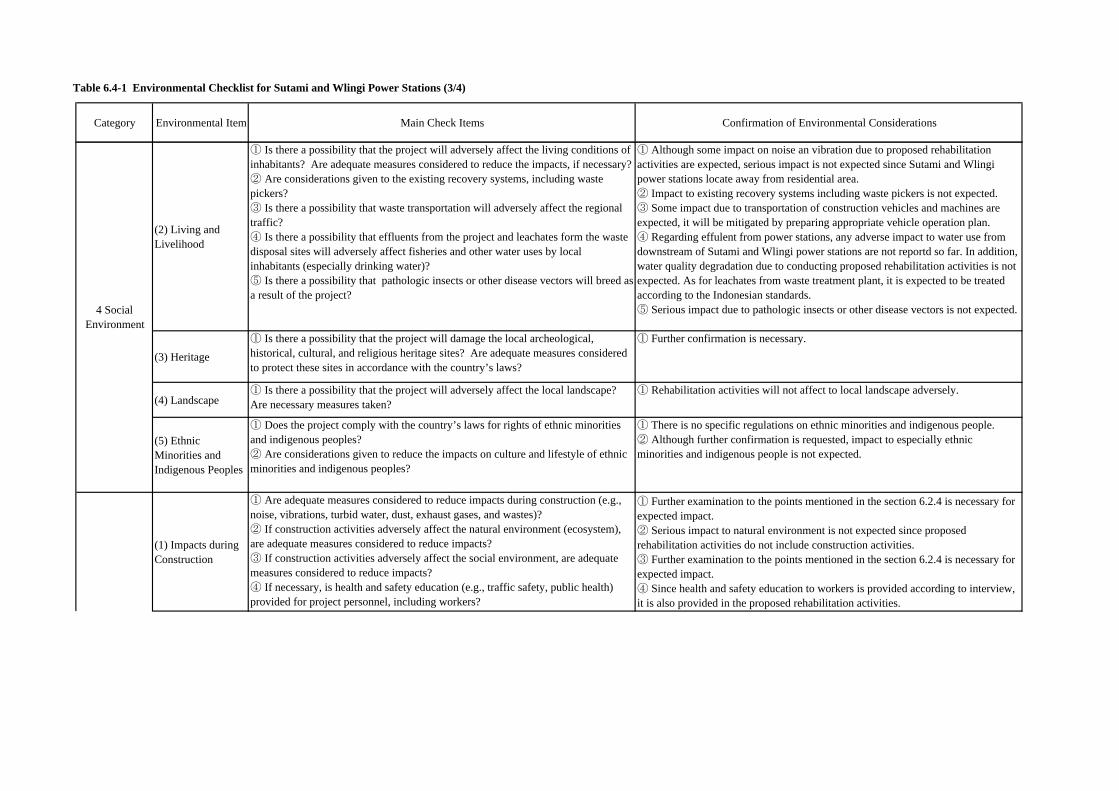
Table 6.4-1 Environmental Checklist for Sutami and Wlingi Power Stations (3/4)
Category Environmental Item Main Check Items Confirmation of Environmental Considerations
(2) Living andLivelihood
① Is there a possibility that the project will adversely affect the living conditions ofinhabitants? Are adequate measures considered to reduce the impacts, if necessary?② Are considerations given to the existing recovery systems, including wastepickers?③ Is there a possibility that waste transportation will adversely affect the regionaltraffic?④ Is there a possibility that effluents from the project and leachates form the wastedisposal sites will adversely affect fisheries and other water uses by localinhabitants (especially drinking water)?⑤ Is there a possibility that pathologic insects or other disease vectors will breed asa result of the project?
① Although some impact on noise an vibration due to proposed rehabilitationactivities are expected, serious impact is not expected since Sutami and Wlingipower stations locate away from residential area.② Impact to existing recovery systems including waste pickers is not expected.③ Some impact due to transportation of construction vehicles and machines areexpected, it will be mitigated by preparing appropriate vehicle operation plan.④ Regarding effulent from power stations, any adverse impact to water use fromdownstream of Sutami and Wlingi power stations are not reportd so far. In addition,water quality degradation due to conducting proposed rehabilitation activities is notexpected. As for leachates from waste treatment plant, it is expected to be treatedaccording to the Indonesian standards.⑤ Serious impact due to pathologic insects or other disease vectors is not expected.
(3) Heritage
① Is there a possibility that the project will damage the local archeological,historical, cultural, and religious heritage sites? Are adequate measures consideredto protect these sites in accordance with the country’s laws?
① Further confirmation is necessary.
(4) Landscape① Is there a possibility that the project will adversely affect the local landscape?Are necessary measures taken?
① Rehabilitation activities will not affect to local landscape adversely.
(5) EthnicMinorities andIndigenous Peoples
① Does the project comply with the country’s laws for rights of ethnic minoritiesand indigenous peoples?② Are considerations given to reduce the impacts on culture and lifestyle of ethnicminorities and indigenous peoples?
① There is no specific regulations on ethnic minorities and indigenous people.② Although further confirmation is requested, impact to especially ethnicminorities and indigenous people is not expected.
(1) Impacts duringConstruction
① Are adequate measures considered to reduce impacts during construction (e.g.,noise, vibrations, turbid water, dust, exhaust gases, and wastes)?② If construction activities adversely affect the natural environment (ecosystem),are adequate measures considered to reduce impacts?③ If construction activities adversely affect the social environment, are adequatemeasures considered to reduce impacts?④ If necessary, is health and safety education (e.g., traffic safety, public health)provided for project personnel, including workers?
① Further examination to the points mentioned in the section 6.2.4 is necessary forexpected impact.② Serious impact to natural environment is not expected since proposedrehabilitation activities do not include construction activities.③ Further examination to the points mentioned in the section 6.2.4 is necessary forexpected impact.④ Since health and safety education to workers is provided according to interview,it is also provided in the proposed rehabilitation activities.
4 SocialEnvironment
Table 6.4-1 Environmental Checklist for Sutami and Wlingi Power Stations (4/4)
Category Environmental Item Main Check Items Confirmation of Environmental Considerations
(2) Monitoring
① Does the proponent develop and implement monitoring program for theenvironmental items that are considered to have potential impacts?② Are the items, methods and frequencies included in the monitoring programjudged to be appropriate?③ Does the proponent establish an adequate monitoring framework (organization,personnel, equipment, and adequate budget to sustain the monitoring framework)?④ Are any regulatory requirements pertaining to the monitoring report systemidentified, such as the format and frequency of reports from the proponent to theregulatory authorities?
①-④ Further examination is necessary since adequate monitoring and report ofmonitoring result are indispensable.
Reference toChecklist of OtherSectors
① Where necessary, pertinent items described in the Forestry Projects checklistshould also be checked (e.g., projects including large areas of deforestation).
① Proposed rehabilitation activities does not include construction of new wastetreatment plant.
Note on UsingEnvironmentalChecklist
① If necessary, the impacts to transboundary or global issues should be confirmed(e.g., the project includes factors that may cause problems, such as transboundarywaste treatment, acid rain, destruction of the ozone layer, or global warming).
① Impact to transboundary or global issues is not expected.
1) Regarding the term “Country’s Standards” mentioned in the above table, in the event that environmental standards in the country where the project is located diverge significantly from international standards, appropriate environmental considerations are made, if necessary. In cases where local environmental regulations are yet to be established in some areas, considerations should be made based on comparisons with appropriate standards of other countries (including Japan' experience).2) Environmental checklist provides general environmental items to be checked. It may be necessary to add or delete an item taking into account the characteristics of the project
and the particular circumstances of the country and locality in which it is located.
6 Note
5 Others
Table 6.4-2 Environmental Checklist for Mrica Reservoir (1/3)
Category Environmental Item Main Check Items Confirmation of Environmental Considerations
(1) EIA andEnvironmentalPermits
① Have EIA reports been officially completed?② Have EIA reports been approved by authorities of the host country’sgovernment?③ Have EIA reports been unconditionally approved? If conditions are imposed onthe approval of EIA reports, are the conditions satisfied?④ In addition to the above approvals, have other required environmental permitsbeen obtained from the appropriate regulatory authorities of the host country’sgovernment?
① It is necessary to confirm necessity of AMDAL approval with a localenvironmental agency since AMDAL approval is requested to channel constructionaccording to its length and sediment volume.② It is also necessary to confirm necessity of AMDAL approval regardingconstruction of weir since it is planned to be constructed in a reservoir.
(2) Explanation tothe Public
① Are contents of the project and the potential impacts adequately explained to thepublic based on appropriate procedures, including information disclosure? Isunderstanding obtained from the public?② Are proper responses made to comments from the public and regulatoryauthorities?
①-② It is expected that explanation to the public will be done in a process ofAMDAL study if it is necessary. Even though AMDAL approval is not necessary,appropriate explanation to public is requested to be carried out.
(1) Water Quality
① Is there a possibility that changes in river flow downstream (mainly water leveldrawdown) due to the project will cause areas that do not comply with the country’sambient water quality standards?
① Changes in river flow downstream will not be expected due to construction ofsand bypass tunnel and diversion weir.
(2) Wastes
① In the case of that large volumes of excavated/dredged materials are generated,are the excavated/dredged materials properly treated and disposed of in accordancewith the country’s standards?
① Generated waste will be treated and disposed properly according to Indonesianregulation.
(3) Subsidence
① Is there a possibility that the excavation of waterways will cause groundwaterlevel drawdown or subsidence? Are adequate measures taken, if necessary?
① It is expected that groundwater level will be drawdown due to project though itsimpact will be limited. Therefore, possibility of subsidence is considered aslow.Countermeasures will be examined accordingly.
(1) Protected Areas
① Is the project site located in protected areas designated by the country’s laws orinternational treaties and conventions? Is there a possibility that the project willaffect the protected areas?
① Impact to protected area is not expected.
(2) Ecosystem
① Does the project site encompass primeval forests, tropical rain forests,ecologically valuable habitats (e.g., coral reefs, mangroves, or tidal flats)?② Does the project site encompass the protected habitats of endangered speciesdesignated by the country’s laws or international treaties and conventions?③ If significant ecological impacts are anticipated, are adequate protectionmeasures taken to reduce the impacts on the ecosystem?④ Is there a possibility that hydrologic changes, such as reduction of the river flow,and seawater intrusion up the river will adversely affect downstream aquaticorganisms, animals, vegetation, and ecosystems?⑤ Is there a possibility that the changes in water flows due to the project willadversely affect aquatic environments in the river? Are adequate measures taken toreduce the impacts on aquatic environments, such as aquatic organisms?
①-② Since the protected area does not locate near the project site, habitation ofprotected species is not expected. However, further examination is necessary.③-④ Since decreasing volume of water inflow to the reservoir is expected, waterquality degradation of the reservoir and impact to downstream area are expected.⑤ Further examination of mitigation measures on aquatic environment mentioned inthe section 6.4.4 in the report is necessary.
1 Permits andExplanation
2 MitigationMeasures
3 NaturalEnvironment
Table 6.4-2 Environmental Checklist for Mrica Reservoir (2/3)
Category Environmental Item Main Check Items Confirmation of Environmental Considerations
(3) Hydrology① Is there a possibility that hydrologic changes due to the project will adverselyaffect surface water and groundwater flows?
① Sand bypass is planned to cross groundwater at some sections of branchdownstream. However, impact will be limited if it will be caused.
(4) Topography andGeology
① Is there a possibility that excavation of rivers and channels will cause a large-scale alteration of the topographic features and geologic structures in thesurrounding areas?
① Alternation of topographic features and geologic structure in the surroundingarea is not expected.
(1) Resettlement
① Is involuntary resettlement caused by project implementation? If involuntaryresettlement is caused, are efforts made to minimize the impacts caused by theresettlement?② Is adequate explanation on relocation and compensation given to affectedpersons prior to resettlement?③ Is the resettlement plan, including proper compensation, restoration oflivelihoods and living standards developed based on socioeconomic studies onresettlement?④ Does the resettlement plan pay particular attention to vulnerable groups orpersons, including women, children, the elderly, people below the poverty line,ethnic minorities, and indigenous peoples?⑤ Are agreements with the affected persons obtained prior to resettlement?⑥ Is the organizational framework established to properly implement resettlement?Are the capacity and budget secured to implement the plan?⑦ Is a plan developed to monitor the impacts of resettlement?
① Involuntary resettlement is not expected. However, there is a possiblity of landacquisition with involuntary resettlement when design is studied in detail.
(2) Living andLivelihood
① Is there a possibility that the project will adversely affect the living conditions ofinhabitants? Are adequate measures considered to reduce the impacts, if necessary?② Is there a possibility that the amount of water (e.g., surface water, groundwater)used by the project will adversely the downstream fisheries and other water uses?③ Is there a possibility that water-borne or water-related diseases (e.g.,schistosomiasis, malaria, filariasis) will be introduced?
① Temporal impact on noise and traffic congestion are expected, and furtherexamination to the points raised in the section 6.4.4 is necessary.②There is a risk of water quality degradation at downstream area, and thereforefurther examination to the points raised in the section 6.4.4 in the report isnecessary.③ According to information from Ministry of Helth in Indonesia, reservoir area isregarded as "middle risk" of malaria. Therefore, a risk of water-related diseases willbe expected, and examination of mitigation measures is necessary.
(3) Heritage
① Is there a possibility that the project will damage the local archeological,historical, cultural, and religious heritage sites? Are adequate measures consideredto protect these sites in accordance with the country’s laws?
① Further confirmation is necessary.
(4) Landscape① Is there a possibility that the project will adversely affect the local landscape?Are necessary measures taken?
① Impact to local landscape is not expected.
4 SocialEnvironment
3 NaturalEnvironment

Table 6.4-2 Environmental Checklist for Mrica Reservoir (3/3)
Category Environmental Item Main Check Items Confirmation of Environmental Considerations
(5) EthnicMinorities andIndigenous Peoples
① Does the project comply with the country’s laws for rights of ethnic minoritiesand indigenous peoples?② Are considerations given to reduce the impacts on culture and lifestyle of ethnicminorities and indigenous peoples?
① There is no specific regulations on ethnic minorities and indigenous people.However, consideration of human rights stipulated by the Indonesian regulation isnecessary.② Although further confirmation is requested, impact to especially ethnicminorities and indigenous people is not expected.
(1) Impacts duringConstruction
① Are adequate measures considered to reduce impacts during construction (e.g.,noise, vibrations, turbid water, dust, exhaust gases, and wastes)?② If construction activities adversely affect the natural environment (ecosystem),are adequate measures considered to reduce impacts?③ If construction activities adversely affect the social environment, are adequatemeasures considered to reduce impacts?④ If necessary, is health and safety education (e.g., traffic safety, public health)provided for project personnel, including workers?
①-③ Examination to the points raised in the section 6.4.4 is necessary.④ Health and safety education is necessary to be conducted during construction.
(2) Monitoring
① Does the proponent develop and implement monitoring program for theenvironmental items that are considered to have potential impacts?② Are the items, methods and frequencies included in the monitoring programjudged to be appropriate?③ Does the proponent establish an adequate monitoring framework (organization,personnel, equipment, and adequate budget to sustain the monitoring framework)?④ Are any regulatory requirements pertaining to the monitoring report systemidentified, such as the format and frequency of reports from the proponent to theregulatory authorities?
①Although detailed examination is necessary, it is requested to conduct continuousmonitoring on the items which are expected to cause impact.② It was confirmed from interview to relevant parties that monitoring items,frequency and method were appropriate.③ It was confirmed from interview to relevant parties that adequate monitoringframework is established in the proponent.④ Monitoring report system is not exactly described, but it is considered that suchsystem is already established through a routine work.
6 NoteNote on UsingEnvironmentalChecklist
If necessary, the impacts to transboundary or global issues should be confirmed(e.g., the project includes factors that may cause problems, such as transboundarywaste treatment, acid rain, destruction of the ozone layer, or global warming).
Impact to transboundary or global issues is not expected.
1) Regarding the term “Country’s Standards” mentioned in the above table, in the event that environmental standards in the country where the project is located diverge significantly from international standards, appropriate environmental considerations are made, if necessary. In cases where local environmental regulations are yet to be established in some areas, considerations should be made based on comparisons with appropriate standards of other countries (including Japan' experience).2) Environmental checklist provides general environmental items to be checked. It may be necessary to add or delete an item taking into account the characteristics of the project and the particular circumstances of the country and locality in which it is located.
5 Others

Chapter 7 Conclusion and Recommendation
Final Report Chapter 7 Conclusion and Recommendation
7 - 1
CHAPTER 7 CONCLUSIONS AND RECOMMENDATIONS
7.1 Conclusions
(1) Needs for Effective Use of Hydropower Stations
The installed capacity of generating facilities owned by PLN is 25,594 MW as of 2008. Out of
this capacity, the thermal power shares 72 % (as the total of steam at 33%, combined cycle at 29%
and gas at 10%), while hydropower has 14 % and diesel has 12%. Major role of hydropower in
the power network is for peak load operation, but they are forced to operate for base load operation
as long as water is available, to reduce fuel cost for thermal power plants. Java Bali power system
has higher priority on power development over the other systems since it shares 72% of the whole
power system in Indonesia with the biggest demand center of Jakarta. To cope with the growing
power demand estimated at 9.8% per year, the first crash program has been implemented with a
total of 10,000 MW coal-fired thermal power plants. Further, the second crash program is
on-going. The second program incorporates the development of hydropower and geothermal
power in addition to coal-fired power plants. Hydropower has a remarkable benefit in terms of
environmental and economical aspects because it uses renewable energy, and has low operation
cost.
Under such circumstance, the necessity of effective use of the existing hydropower stations has
been increasing not only to strengthen the power supply capacity through new development but
also to immediately realize a present energy consumption structure based on non-fossil fuels that
can ultimately contribute to the from reduction of greenhouse gas emissions.
(2) Sedimentation of Hydropower Stations
Sedimentation problem in the reservoir is one of the serious problems in the operation of
hydropower stations. The reservoir-type power station suffers from the decrease of dependable
power output due to reducing the effective storage volume and from the difficulty of utilizing
smooth intake water due to sedimentation around the intake. The run-of-river type power station
that has no storage volume also suffers from the intake problem as described above.
The geology of the Java Island in Indonesia consists mainly of erupted volcanic materials which
are easily eroded. Moreover, the watershed of the reservoir has considerable population and its
crop agriculture is flourishing.
Hence, from the geological and social environmental points of view, the sedimentation problems
are likely to occur in the reservoir located in Java Island.
Final Report Chapter 7 Conclusion and Recommendation
7 - 2
On the other hand, even if there are sedimentation problems in the reservoirs located in the
Sulawesi, the Kalimantan and the Sumatra islands, they can be considered not overly serious
comparing with the geological and social aspects in Java Island.
(3) Screening of Hydropower Stations
Four hydropower stations located in Java Island (i.e. Saguling in West Java, Soedirman in Central
Java and Sutami & Wlingi in East Java) were selected for further site investigations at the second
screening with high priority given based on the following criteria: i) regional effectiveness, ii)
degree of deterioration, iii) degree of sedimentation, iv) expected effect of rehabilitation, and iv)
urgency. The results of the site investigations for the four hydropower stations are as follows:
1) Sutami Hydropower Station (105 MW)
Sutami commenced the operation in 1973 and has been operating for over 36 years. The
generating equipment has been maintained well by power station staffs and severe damage or
heavy accident causing stoppage of the machines has not been recorded so far. Moreover,
major components such as turbine runner, generator, governor, AVR and control system have
not been rehabilitated since the commencement of its operation. Sutami places high priority
not only for power distribution to the regional area and also for black start of Paiton thermal
power plant. After the interruption of 150 kV transmission lines due to the eruption of Mud
Volcano in 2006, Sutami contributes more reliable and stable power supply to the regional area
than before.
2) Wlingi Hydropower Station (54 MW)
Wlingi has been operating for over 31 years as a cascade power station of Sutami since 1978.
Wlingi has the same function as Sutami, but major components such as turbine runner,
generator, governor, and control system have not been rehabilitated since its commencement
of operation.
3) Sedimentation Problems in Brantas River Basin
Sengguruh Dam, the Sutami Dam, Lahor Dam, Wlingi Dam and the Lodoyo Weir exist in the
Brantas River basin in the East Java province. Except Lahor Dam, these dams have
hydropower stations in the downstream. These dams have been constructed in the 1970s and
they have suffered from sedimentation problems. In particular, the Wlingi Reservoir was
almost filled with volcanic ashes due to the eruption of Mt. Kelud several times in the past.
At the moment, the dredging works at each dam above is carried out. In addition, sediment
bypass channel construction to divert sediment inflow from upstream to downstream of the
Wling Dam and sabo dam construction in the watersheds of Sengguruh Dam and Wlingi Dam
are on-going under the financial assistance of Japanese ODA and own fund of GoI by PJT I
and BBWS, through the Ministry of the Public Works.
According to PJB, the service life of Sutami Dam will be prolonged until around 2055 after the
Final Report Chapter 7 Conclusion and Recommendation
7 - 3
above works have been completed as scheduled. Meanwhile, operation of the Wlingi Dam is
expected to be extended depending on the effective operation of the above sabo dams and
sediment bypass channel.
4) Soedirman Hydropower Station (180.9 MW)
Soedirman has been operating for 21 years since 1988 and is well maintained by power station
staff. The reservoir is facing a serious sedimentation problem, but the power generation is
not affected at the moment. The control system was replaced with a computerized system
with automatic data logger in 2006.
5) Sedimentation Problems of Soedirman (Mrica) Reservoir
Since the Soedirman (Mrica) dam was constructed, sediment inflow into the reservoir, which is
more than expected, has been experienced. IP has predicted that in 2014, 80% (118.6 MCM)
of the gross reservoir capacity will be buried and sedimentation will reach up to the HWL in
2021. Under these circumstances, IP, in cooperation with the local government and other
agencies, is now executing watershed management such as construction of sabo dams and
campaign to residents on the present growing crop conversion, etc. so as to maintain the
reservoir function. However, because the annual sedimentation to the reservoir is very huge
and around 4.2 MCM, it is very questionable weather watershed management countermeasures
alone can solve the sedimentation problems or not.
The Soedirman (Mrica) Reservoir is utilized for downstream irrigation water supply (10,000
ha) and flood control besides power generation. Implementation of the radical
countermeasures to solve the sedimentation problems should be carried out not only to keep
function of water utilization but also to ensure flood control function of the Soedirman (Mrica)
Reservoir.
6) Saguling Hydropower Station (700 MW)
Saguling has been operating for 24 years since 1985 and is well maintained by power station
staffs. The generated power is directly connected to Java-Bali 500 kV transmission line
network. Saguling has an important function of LFC to stabilize the power system in
addition to peak and base load operations. Major components have not been rehabilitated so
far. Due to water quality and chemical contents, the cooling water system is damaged and
has suffered from frequent cleaning of filters. Thus, replacement of the existing governor
system and embedded cooling water pipes has been contracted under the financial assistance of
JBIC export credit line. It is being progressed now and just awaiting the effectiveness of the
contract.
7) Sedimentation Problems of Saguling Reservoir
Saguling Dam has a gross reservoir capacity of 875 MCM. According to IP, the annual
sedimentation to the reservoir is observed at around 4 MCM. However, since the reservoir
capacity is very big, and it can still be functional for around 30 years from now. The

Final Report Chapter 7 Conclusion and Recommendation
7 - 4
problems at the moment are the reservoir water pollution and intruded waste materials from
households. They are caused by large volume of sewage/ waste materials from households
and factories in Bandung City which is located in the watershed of the Saguling Reservoir and
has a population of 2,500,000. The solution to these problems is an urgent matter in this
region. The study for the water resources management plan in the Citram River basin
including the Saguling Reservoir watershed is now on-going under the ADB. The water
quality and the sediment problems in the Saguling Reservoir shall be solved as one of the main
components in the ADB study.
As a result of the evaluation after the site investigation, the following two (2) rehabilitation works
are proposed.
i) Rehabilitation works for the generating equipment in Sutami Hydropower Station
ii) Countermeasure for sedimentation in Soedirman (Mrica) Reservoir
The rehabilitation work at Sutami is proposed to be combined with the rehabilitation works at
Wlingi to enhance effectiveness because the both power stations were constructed in the 1970’s as
cascade power stations in the Brantas River.
(4) Rehabilitation Works in Sutami and Wlingi Hydropower Stations
1) Based on the following evaluation of major components of generating equipment, the outline
of recommended rehabilitation work is summarized below.
- Turbine runner: Corrosions of deep cavitations pitting are observed.
- Inlet valve: Water leakage is continuously observed.
- Generator: Residual life of stator coils has been evaluated as 2~3 years by examination
carried out in 2004, and temperature of thrust bearing is increased by more than 10 degree
against that for initial stage.
- Governor & AVR: Mechanical and analog type and no spare parts are available in the
market.
- Control and protection panel: Old fashion type (analog and mechanical relays) and no spare
parts are available in the market, and no automatic data logger is equipped with.
2) Scope of Rehabilitation Works
For Sutami Hydropower Station
Replacement of turbine runner, guide vanes, turbine bearing, inlet valve, governor, generator
stator and rotor windings, thrust bearing, AVR and control and protection panels
For Wlingi Hydropower Station
Replacement of runner blade, runner hub, guide vanes, turbine bearing, governor, generator
stator and rotor windings, thrust bearing and control and protection panels
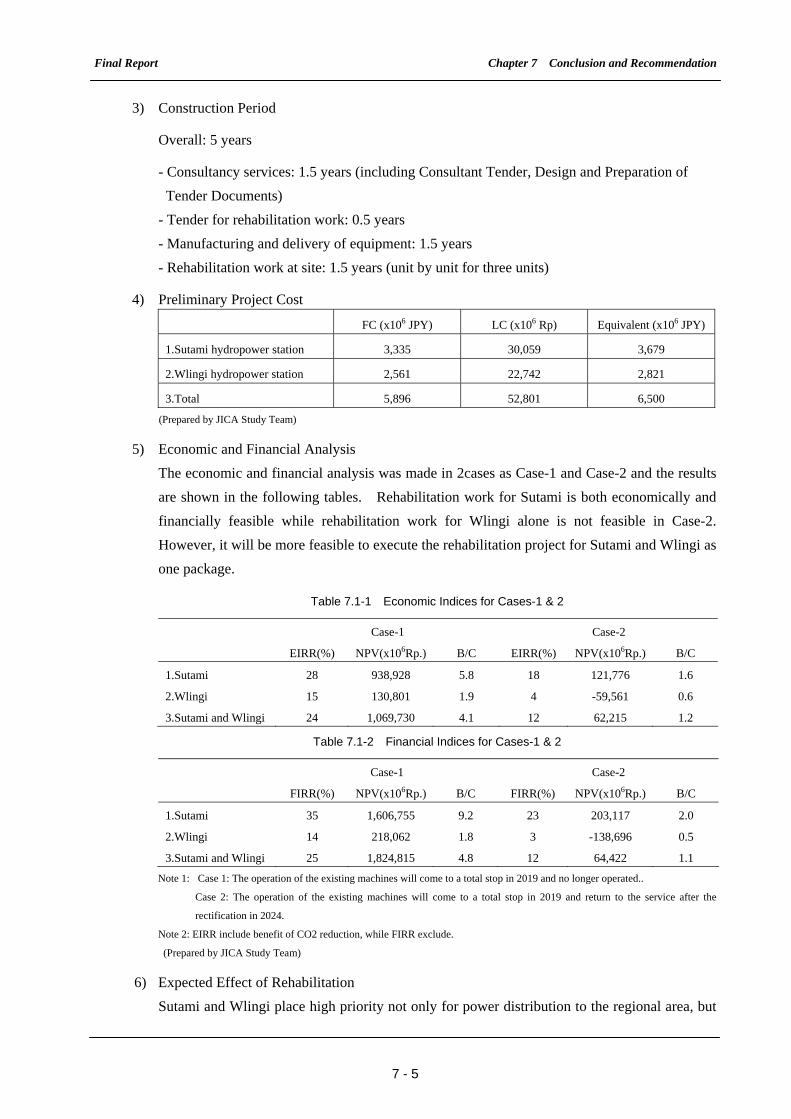
Final Report Chapter 7 Conclusion and Recommendation
7 - 5
3) Construction Period
Overall: 5 years
- Consultancy services: 1.5 years (including Consultant Tender, Design and Preparation of
Tender Documents)
- Tender for rehabilitation work: 0.5 years
- Manufacturing and delivery of equipment: 1.5 years
- Rehabilitation work at site: 1.5 years (unit by unit for three units)
4) Preliminary Project Cost
FC (x106 JPY) LC (x106 Rp) Equivalent (x106 JPY)
1.Sutami hydropower station 3,335 30,059 3,679
2.Wlingi hydropower station 2,561 22,742 2,821
3.Total 5,896 52,801 6,500
(Prepared by JICA Study Team)
5) Economic and Financial Analysis
The economic and financial analysis was made in 2cases as Case-1 and Case-2 and the results
are shown in the following tables. Rehabilitation work for Sutami is both economically and
financially feasible while rehabilitation work for Wlingi alone is not feasible in Case-2.
However, it will be more feasible to execute the rehabilitation project for Sutami and Wlingi as
one package.
Table 7.1-1 Economic Indices for Cases-1 & 2
Case-1 Case-2
EIRR(%) NPV(x106Rp.) B/C EIRR(%) NPV(x106Rp.) B/C
1.Sutami 28 938,928 5.8 18 121,776 1.6
2.Wlingi 15 130,801 1.9 4 -59,561 0.6
3.Sutami and Wlingi 24 1,069,730 4.1 12 62,215 1.2
Table 7.1-2 Financial Indices for Cases-1 & 2
Case-1 Case-2
FIRR(%) NPV(x106Rp.) B/C FIRR(%) NPV(x106Rp.) B/C
1.Sutami 35 1,606,755 9.2 23 203,117 2.0
2.Wlingi 14 218,062 1.8 3 -138,696 0.5
3.Sutami and Wlingi 25 1,824,815 4.8 12 64,422 1.1
Note 1: Case 1: The operation of the existing machines will come to a total stop in 2019 and no longer operated..
Case 2: The operation of the existing machines will come to a total stop in 2019 and return to the service after the
rectification in 2024.
Note 2: EIRR include benefit of CO2 reduction, while FIRR exclude.
(Prepared by JICA Study Team)
6) Expected Effect of Rehabilitation
Sutami and Wlingi place high priority not only for power distribution to the regional area, but
Final Report Chapter 7 Conclusion and Recommendation
7 - 6
also for power supply of black start of Paiton thermal power plant located in East Java. Upon
renovating the major components, Sutami and Wlingi are expected to have an extended life of
another 40 years, and thus Sutami and Wlingi continue to play an important function for
reliable and stable power supply in the regional area.
(5) Preliminary Study for Sediment Countermeasure for Soedirman (Mrica) Reservoir
In order to solve the serious sedimentation problems in the Serayu River basin, the local
government and IP have carried out lots of examination and countermeasures so far.
Referring to actual examples of sedimentation countermeasures in Japan, the Study has
examined the sedimentation countermeasures in the Serayu River basin from the sustainable
sediment management point of view. Results of the study are summarized as follows:
1) Establishment of Target of Sediment Management by River Basin Area and Time Frame
In order to achieve effective sediment management, the target shall be set in terms of each
river basin area (upstream river basin area, reservoir area, and downstream river basin
area) and time frame (shot-term, medium-term, and long-term).
2) Improvement of Sediment Balance
For sustainable sediment management, sediment imbalance due to the large amount of
trapped sediment in the Soedirman (Mrica) Reservoir shall be improved. Through this
preliminary study, the sediment diversion weir and sediment bypass tunnel are
recommended as an effective countermeasure to recover the reservoir storage volume.
Capacity and layout of the structures shall be examined based on the detailed investigation
results to be executed in a further study.
3) Recovery of the Reservoir Storage Volume
As a result of this study, dredging in the reservoir is effective for the recovery of the
reservoir storage volume. However, as regards the dredging volume and disposal
method of the dredged materials, the appropriate scale and method shall be examined
based on detailed investigation.
4) Execution of Environmental Monitoring in the Downstream Area and the Realization of
the Sustainable Watershed Sediment Management
In order to execute the sustainable river basin sediment management, monitoring the
environment in the downstream area is very necessary. Following the improvement of
the river basin sediment balance, the main items to be executed are as follows:
- Impacts on water utilization in the downstream area,
- Impacts on the aquatic life (in particular, fishes) and aquatic plant,
- Impacts on topography of the river and seashore such as riverbed fluctuation and
coastal encroachment, and
- Influence on the structures of the river and seashore.

Final Report Chapter 7 Conclusion and Recommendation
7 - 7
Finally, the sustainable river basin sediment management shall adopt the PDCA cycle.
5) Future Vision of the Watershed Sediment Management
Based on the examination results in Section 4.2, the future vision of the sustainable
sediment management in the Serayu River basin (i.e., long-term target) is summarized in
Table 7.1-3.
Table 7.1-3 Future Vision of River Basin Sediment Management
Area Target of the Sediment
Management Countermeasures to be Implemented /
Operation and Maintenance Up-stream Basin
Area
- Trapping of bed load
- Reduction of sediment inflow
- Sabo dams construction and the maintenance
- Revival of forest
- River basin conservation countermeasure
Reservoir Area - Passing the sediment inflow
- Recovery of the reservoir storage
volume
- Construction of sediment bypass tunnel and
appropriate operation and maintenance
- Execution of dredging in the reservoir and
appropriate disposal of the dredged material
Downstream
Basin Area
- Improvement of sediment balance
- Minimizing the negative impact in
the downstream area and maximizing
the positive impact in the whole area
- Execution of the environmental monitoring
- Execution of the sustainable sediment
monitoring through the PDCA cycle
(Prepared JICA Study Team)
6) Comprehensive Master Plan for the Watershed Sediment Management and Urgent
Countermeasure
The comprehensive master plan for the watershed sediment management shall be
performed first. Further, the road map for the appropriate sediment balance planning,
sedimentation countermeasures, and O&M planning shall be prepared.
Based on the master plan, the urgent sedimentation countermeasures in the Serayu River
basin shall be executed.
(6) Environment
1) Current Environmental Condition at Each Reservoir
i) Pollution Control
According to the defined framework in PJB or IP, water quality monitoring is regularly
conducted at each reservoir. It was found that eutrophication is progressing at Sutami,
Wlingi and Saguling reservoirs. The major reasons of eutrophication were considered as
domestic garbage, wastewater and agricultural activities at the river basin area. With
respect to Soedirman (Mrica) reservoir, COD and Cd exceeded the Indonesian standard.
ii) Natural and Social Environment
The project area at each reservoir is not classified as the protected area according to
existing information and interviews with relevant parties. However, there are several
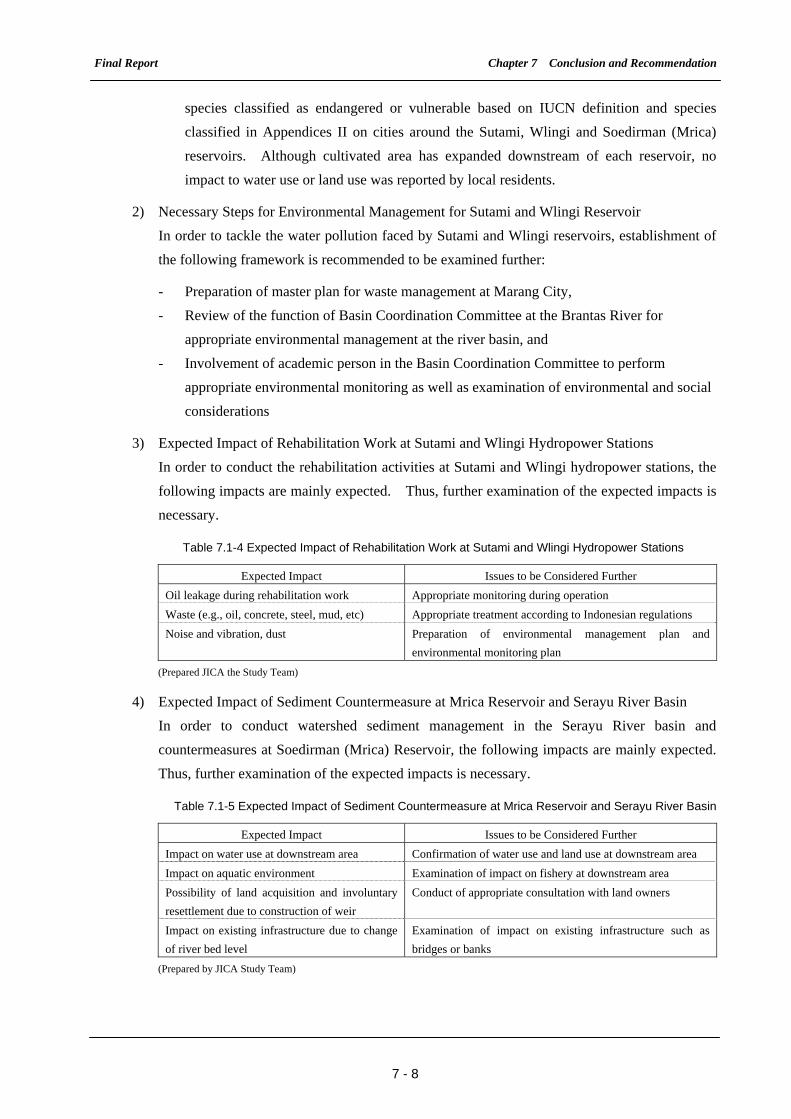
Final Report Chapter 7 Conclusion and Recommendation
7 - 8
species classified as endangered or vulnerable based on IUCN definition and species
classified in Appendices II on cities around the Sutami, Wlingi and Soedirman (Mrica)
reservoirs. Although cultivated area has expanded downstream of each reservoir, no
impact to water use or land use was reported by local residents.
2) Necessary Steps for Environmental Management for Sutami and Wlingi Reservoir
In order to tackle the water pollution faced by Sutami and Wlingi reservoirs, establishment of
the following framework is recommended to be examined further:
- Preparation of master plan for waste management at Marang City,
- Review of the function of Basin Coordination Committee at the Brantas River for
appropriate environmental management at the river basin, and
- Involvement of academic person in the Basin Coordination Committee to perform
appropriate environmental monitoring as well as examination of environmental and social
considerations
3) Expected Impact of Rehabilitation Work at Sutami and Wlingi Hydropower Stations
In order to conduct the rehabilitation activities at Sutami and Wlingi hydropower stations, the
following impacts are mainly expected. Thus, further examination of the expected impacts is
necessary.
Table 7.1-4 Expected Impact of Rehabilitation Work at Sutami and Wlingi Hydropower Stations
Expected Impact Issues to be Considered Further
Oil leakage during rehabilitation work Appropriate monitoring during operation
Waste (e.g., oil, concrete, steel, mud, etc) Appropriate treatment according to Indonesian regulations
Noise and vibration, dust Preparation of environmental management plan and
environmental monitoring plan
(Prepared JICA the Study Team)
4) Expected Impact of Sediment Countermeasure at Mrica Reservoir and Serayu River Basin
In order to conduct watershed sediment management in the Serayu River basin and
countermeasures at Soedirman (Mrica) Reservoir, the following impacts are mainly expected.
Thus, further examination of the expected impacts is necessary.
Table 7.1-5 Expected Impact of Sediment Countermeasure at Mrica Reservoir and Serayu River Basin
Expected Impact Issues to be Considered Further
Impact on water use at downstream area Confirmation of water use and land use at downstream area
Impact on aquatic environment Examination of impact on fishery at downstream area
Possibility of land acquisition and involuntary
resettlement due to construction of weir
Conduct of appropriate consultation with land owners
Impact on existing infrastructure due to change
of river bed level
Examination of impact on existing infrastructure such as
bridges or banks
(Prepared by JICA Study Team)

Final Report Chapter 7 Conclusion and Recommendation
7 - 9
7.2 Recommendations
7.2.1 Rehabilitation Works at Sutami and Wlingi Hydropower Stations
(1) Timing of Rehabilitation Works
The reliable life of hydropower plant prior to major rehabilitation is typically estimated between 30
and 50 years according to IEC 62256 depending on type of unit, design, and severity of service.
Sutami and Wlingi hydropower stations were constructed in the 1970’s and their operating years
nearly reach their reliable lives. It is considered that their reliable and stable operations are
subject to high risks even if their equipment is maintained in good conditions. According to the
inspection carried out in 2004, the estimated residual life of the generator stator windings was
assessed at two years based on the calculated braking voltage of stator windings. In addition,
spare parts for the original equipment are no longer available in the market. Therefore, it is
recommended that the appropriate time for rehabilitation shall be initiated prior to the machines
experiencing severe problems with its major components such as water turbine, generator, and
governor etc. to avoid significant loss of revenue due to long term outage.
(2) Maintenance and Inspection of Generating Equipment
The maintenance work of hydropower generating equipment was previously carried out under time
based maintenance (TBM) through annual inspection, general inspection every three years and
major overhaul every six years. Recently, however, TBM is modified to condition based
maintenance (CBM) in order to reduce the maintenance cost. Therefore, it is required to monitor
and record the conditions and status of equipment in a more precise manner to correctly judge the
degree of damage. The inspection items being conducted so far are not fully covered for such
purpose due to non-availability of testing apparatus, e.g., testing equipment for measurement of
breaking down voltage of generator windings. Procurement of testing equipment and tools
especially for electrical equipment, such as generator windings, governor and excitation equipment
is recommended.
(3) Recommended Scheme for Rehabilitation Work
To accelerate the implementation of rehabilitation project at Sutami and Wlingi Hydropower
Stations, the executing agency is recommended to secure the fund financed by international donors.
For that purpose, a feasibility study for the project including the following contents has to be
carried out as the next step.
1) Detailed Site Survey for each Hydropower Station
To grasp and analyze the conditions of generating equipment, detailed inspections are to be
carried out under the complete shutdown of the equipment.

Final Report Chapter 7 Conclusion and Recommendation
7 - 10
2) Determination of Rehabilitation Scope
Based on the result of the detailed site survey, needs for the rehabilitation work are to be
confirmed again and scope of the work, target equipment for replacement, including several
alternatives are to be determined.
3) Determination of Specifications and Quantities of the Equipment
Specifications and quantities of the target equipment are to be determined.
4) Formulation of Work Program
To minimize the power outage period, work program, which can be realize short-term and
efficient replacement work is to be formulated.
5) Cost Estimate
Based on the specifications, quantities and work program, detailed project costs are to be
estimated considering the equipment price levels and the trends of material price fluctuations
at the time of the feasibility study.
6) Economic and Financial Analysis
Based on the cost estimate, economic and financial analyses including sensitivity analysis are
to be carried out.
7) Necessity of IEE or EIA
Since the major components of the project is rehabilitation work, it is considered that
implementation of the project will hardly affect to the environment. However, IEE or EIA
including environmental monitoring program for noise, vibration, dusts, wastes, soil pollution
by leakage oil during the work is to be carried out, if necessary.
8) Others
- Possibility for CDM application
- TOR for the consulting services, etc.
The executing agency of Indonesia is recommended to make a request for the above feasibility
study to international donors.
For your reference, in January 2008, the Government of Japan established new official
development assistance (ODA) scheme, called “Climate Change Program Loan (“Cool Earth
Loan”)”, as part of the Cool Earth Partnership to provide ODA loan with special interest rates for
the purpose of supporting implementation of recipients’ programs to address global warming.
The Government of Japan has already provided the loan to the Government of Indonesia since
2008 to support Indonesia’s efforts to address climate change issues under its National Action Plan
Addressing Climate Change.
Since this rehabilitation project has little environmental load and avoids development of new
thermal power plants that produce lots of greenhouse effect gas, it is recommended to accelerate
Final Report Chapter 7 Conclusion and Recommendation
7 - 11
the project utilizing such ODA scheme more effectively after completion of the feasibility study.
7.2.2 Watershed Sediment Management for Serayu River Basin
For the sustainable sediment management in the Serayu River basin, the watershed sediment
management shall be planned and executed to maximize the whole benefit in the Serayu River
basin. From this point of view, organization of the implementation and O&M for the watershed
sediment management is recommended as follows:
1) Establishment of the Organization for the Watershed Sediment Management
For executing the sustainable sediment management effectively, proper coordination with
other organizations is absolutely imperative. Therefore, it is recommended that the
implementation organization of the watershed sediment management consisting of the local
government, IP, the Ministry of Public Works and the users within the river basin shall be
established for the Serayu River basin.
2) Participation of the Residents in Decision Making, Planning, O&M
Participation of residents in the Serayu River basin in the decision making, the river basin
conservation countermeasures, and planning and operation of the sediment management are
recommended from the sustainable watershed sediment management point of view.
3) Initiation of Watershed Sediment Management with Financial Support
IP and the local government have performed appropriate countermeasure for sediment control
in the Serayu River basin. However, due to their limited competence and funding, the scale
of the countermeasures is too small to get effective results on the sediment issues.
Therefore, it is strongly recommended that the watershed sediment management measure in
the Serayu River basin as well as countermeasure for the Mrica reservoir should be initiated as
a practical solution with definite financial support.
4) Implementation Procedure and Study Items of the Master Plan for Watershed Sediment
Management in Serayu River Basin.
As reference, the required study items to be conducted during master plan stage for the
sediment management plan and the implementation procedure so as to execute the sustainable
watershed management plan are respectively shown in Table 7.2-1 and Figure 7.2.-1.
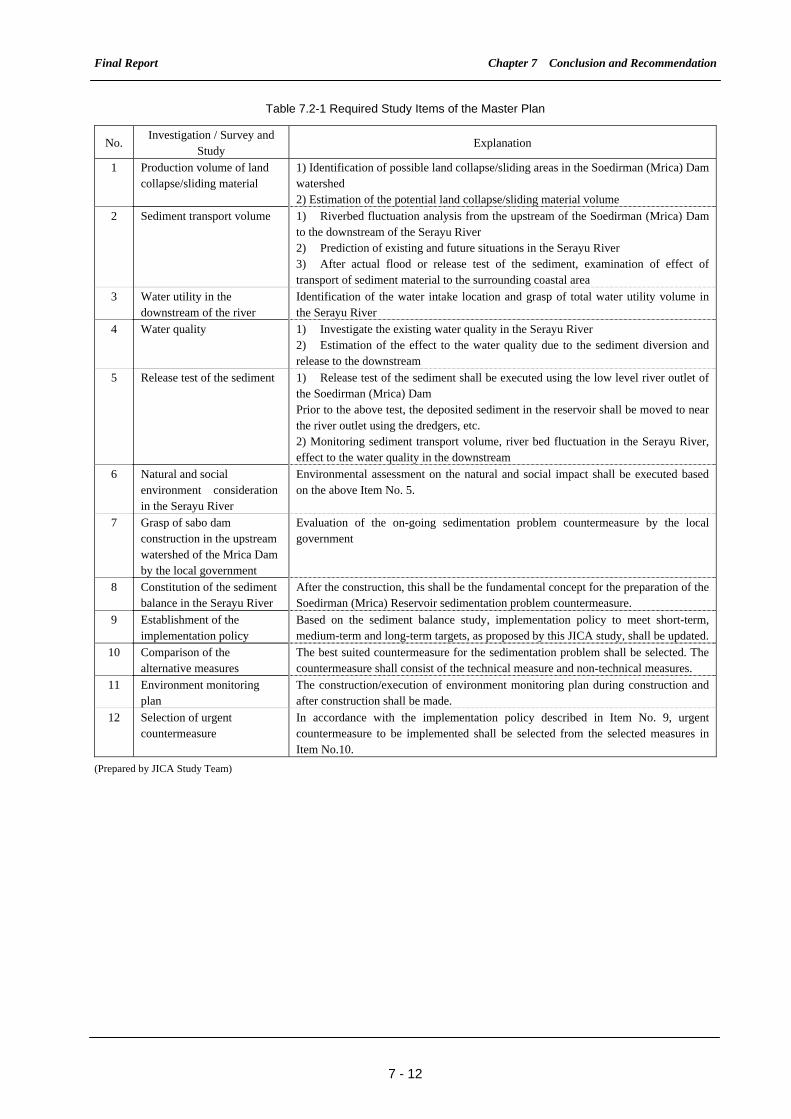
Final Report Chapter 7 Conclusion and Recommendation
7 - 12
Table 7.2-1 Required Study Items of the Master Plan
No. Investigation / Survey and
Study Explanation
1 Production volume of land collapse/sliding material
1) Identification of possible land collapse/sliding areas in the Soedirman (Mrica) Dam watershed 2) Estimation of the potential land collapse/sliding material volume
2 Sediment transport volume 1) Riverbed fluctuation analysis from the upstream of the Soedirman (Mrica) Dam to the downstream of the Serayu River 2) Prediction of existing and future situations in the Serayu River 3) After actual flood or release test of the sediment, examination of effect of transport of sediment material to the surrounding coastal area
3 Water utility in the downstream of the river
Identification of the water intake location and grasp of total water utility volume in the Serayu River
4 Water quality 1) Investigate the existing water quality in the Serayu River 2) Estimation of the effect to the water quality due to the sediment diversion and release to the downstream
5 Release test of the sediment 1) Release test of the sediment shall be executed using the low level river outlet of the Soedirman (Mrica) Dam Prior to the above test, the deposited sediment in the reservoir shall be moved to near the river outlet using the dredgers, etc. 2) Monitoring sediment transport volume, river bed fluctuation in the Serayu River, effect to the water quality in the downstream
6 Natural and social environment consideration in the Serayu River
Environmental assessment on the natural and social impact shall be executed based on the above Item No. 5.
7 Grasp of sabo dam construction in the upstream watershed of the Mrica Dam by the local government
Evaluation of the on-going sedimentation problem countermeasure by the local government
8 Constitution of the sediment balance in the Serayu River
After the construction, this shall be the fundamental concept for the preparation of the Soedirman (Mrica) Reservoir sedimentation problem countermeasure.
9 Establishment of the implementation policy
Based on the sediment balance study, implementation policy to meet short-term, medium-term and long-term targets, as proposed by this JICA study, shall be updated.
10 Comparison of the alternative measures
The best suited countermeasure for the sedimentation problem shall be selected. The countermeasure shall consist of the technical measure and non-technical measures.
11 Environment monitoring plan
The construction/execution of environment monitoring plan during construction and after construction shall be made.
12 Selection of urgent countermeasure
In accordance with the implementation policy described in Item No. 9, urgent countermeasure to be implemented shall be selected from the selected measures in Item No.10.
(Prepared by JICA Study Team)

Final Report Chapter 7 Conclusion and Recommendation
7 - 13
Figure 7.2-1 Proposed Implementation Procedure
(Prepared by JICA Study Team)
Wat
ersh
ed S
edim
ent
Man
agem
ent
Mas
ter
Pla
n S
tudy
(2)
Wat
ersh
ed S
edim
ent
Bal
ance
Stud
y
(1)
Dat
a C
olle
ctio
n an
d F
ield
Surv
ey
(3)
Wat
ersh
ed S
edim
ent
Con
trol
and
Mon
itor
ing
Stud
y
(3)-
1 U
pstr
eam
Bas
in A
rea
(3)-
2 R
eser
voir
Are
a
(3)-
3 D
owns
trea
m B
asin
Are
a
(4)
Env
iron
men
tal I
mpa
ctA
sses
smen
t
(5)
Stu
dy f
or I
mpl
emen
tati
onS
truc
ture
Roa
d M
ap f
or W
ater
shed
Sed
imen
t M
anag
emen
t
(5)
Tec
hnic
al C
ount
erm
easu
re
(2)
Est
ablis
h Se
dim
ent
Man
agem
ent
Pla
n
(2)
-1 S
hort
-ter
m T
arge
t
(2)
-2 M
ediu
m-t
erm
Tar
get
(
2)-3
Lon
g-te
rm T
arge
t
(5)-
2Urg
ent
Cou
nter
mea
sure
(5)-
1 P
rior
ity
Ord
er o
fT
echn
ical
Cou
nter
mea
sure
s
(4)
Non
-tec
hnic
al C
ount
erm
easu
re
(3)
Env
iron
men
tal M
onit
orin
g P
lan
(1)
Impr
ovem
ent
Pla
n of
Impl
emen
tati
on S
truc
ture
Urg
ent
Cou
nter
mea
sure
s
Fea
sibi
lity
Stud
y of
Urg
ent
Cou
nter
mea
sure
Impl
emen
tati
on o
fU
rgen
t C
ount
erm
easu
re
Sus
tain
able
Wat
ersh
edS
edim
ent
Man
agem
ent
Env
iron
men
tal M
onit
orin
g w
ith
PD
CA
Man
agem
ent
Impl
emen
tati
on S
truc
ture
of
Sed
imen
t M
anag
emen
t
Impl
emen
tati
on A
genc
y
Pub
lic
Wor
ks
Loc
alG
over
nmen
tsIn
done
sia
Pow
erS
tak
ehol
ders
- Ref
ores
tati
on- W
ater
she d
Con
serv
atio
n
- Qua
lity
and
Vol
ume
Con
trol
of S
edim
ent F
lush
.- I
mpr
ovem
ent o
f Res
v.O
pera
tion
- O&
M o
f Sab
o-da
m- R
iver
ban
kpr
otec
tion
,S
eash
ore