Embed Size (px)
Citation preview
194
Chapter 4: Predicted 3D Structures for mouse I7 and rat I7 olfactory receptors and comparison of predicted odor recognition
profiles with experiment
Adapted from published article (Hall et al., 2004)
ABSTRACT
The first step in the perception of an odor is the activation of one or more
olfactory receptors (ORs) following binding of the odorant molecule to the OR. In order
to initiate the process of determining how the molecular level receptor-odorant
interactions are related to odor perception, we used the MembStruk computational
method to predict the three-dimensional structure of the I7 OR for both mouse and rat.
We then used the HierDock ligand docking computational method to predict the binding
site and binding energy for the library of 56 odorants to these receptors for which
experiment response data are now available (Bozza et. al. 2002). We find that the
predicted 3D structures of the mouse and rat I7 OR lead to predictions of odorant binding
that are in good agreement with the experimental results, thus validating the accuracy of
both the 3D structure and the predicted binding site. In particular we predict that
heptanal and octanal both bind strongly to both mouse and rat I7 ORs, which conflicts
with the older literature (Krautwurst et al. 1998) but agrees with recent experiments
(Bozza et al. 2002). To provide the basis of additional validations of our 3D structures,
we also report the odorant binding site for a new odorant (8-hydroxy-octanal) with a
novel functionality designed to bind strongly to mouse I7. Such validated computational
195
methods should be very useful in predicting the structure and function of many other
ORs.
1.0 INTRODUCTION
The early stage in odorant detection involves binding of the odorant molecule to an
Olfactory Receptor (OR) (Buck and Axel 1991; Lancet et al 1993) followed by activation
of the OR through release of the G-protein fragments. Each olfactory sensory neuron
expresses only one OR type, but a particular OR can respond to multiple odorants. A
particular ligand can also elicit response from multiple ORs. This leads to a unique
combination of OR responses for each odorant (Malnic et al 1999). Thus the mammalian
olfactory system uses a combinatorial response to discriminate thousands of odorants
(Sicard and Holley 1984, Malnic et al. 1999, Kajiya et. al. 2001).
ORs belong to the superfamily of membrane bound G-protein coupled receptors
(GPCRs) (Buck and Axel 1991, Mombaerts 1999). There are 913 ORs in mouse
(Godfrey et al 2004) and 339 ORs in human (Malnic et al 2004) making it an extremely
forbidding task to experimentally (or computationally) elucidate the details by which
odorants activate each of the ORs. There is almost no molecular level information on
how and where each odorant binds to the OR or when and how this leads to their
activation. The major impediment to obtaining this molecular level information is that
there is no experimental three dimensional structural information available for any OR of
any species of life! Indeed considering all forms of life there is an experimental 3D
structure for only a single GPCR, bovine rhodopsin (Grigorieff et al., 1996). This is
because it has not yet been possible to obtain crystals suitable for diffraction studies of
these membrane bound proteins, despite years of intense effort.
196
Consequently, we have developed computational techniques (MembStruk)
suitable for predicting the three-dimensional structures of GPCRs. The original version
of MembStruk1.0, was validated on bacteriorhodopsin and used for prediction of
structure of OR-S25 (Floriano et al 2000). Subsequent improved version of
MembStruk2.0 (with optimization of rotational orientations of the helices) have been
validated for bovine rhodopsin, where it leads to a CRMS (coordinate root-mean-square)
error of 2.8 Å in the transmembrane (TM) domains (Vaidehi et al 2002, Trabanino et al.,
2004) compared to the crystal structure (Palcezwski 2000; Poincelot et al., 1970). We
have also validated the MembStruk2.0 predicted structures for human β1 and β2
adrenergic receptors (Vaidehi et al 2002, Freddolino et al 2004), and human dopamine
D2 receptor (Kalani et al 2004). Since no experimental structural data are available for
direct validation of our predicted structures for these systems, we used the HierDock2.0
method (Floriano et al. 2000, Vaidehi et al. 2002) to predict the binding sites of ligands to
the predicted 3D structures of these GPCRs. These binding sites were then compared to
the numerous experimental mutation and binding studies carried out in developing
subtype specific agonist and antagonist pharmaceuticals. We found that the predicted
binding site of these ligands all agree quite well with all available experimental mutation
data. This validation of the techniques gives us confidence to now apply these techniques
(MembStruk and HierDock) to the more complex problem of ORs, where all available
information suggests much less selectivity than for the rhodopsin, adrenergic, and
dopamine receptors.
There has been some progress in determining which odorants lead to activation of
specific mammalian ORs. However, the experiments are laborious and results are
197
available on only a few ORs for a relatively small library of odorants (Kiefer et al., 1996;
Zhao et al 1998; Bozza et al 1998; Mori et al 1999; Malnic et al 1999; Rubin et al 1999;
Duchamp-Viret 1999; Kratwurst et al 1998; Araneda et al 2001; Kajiya et. al. 2001).
Consequently, we have chosen to apply the MembStruk and HierDock methods to these
few more well studied ORs as the first step in approaching the much more complicated
task of elucidating the structures and function for the whole set of mammalian ORs.
Our first report on the structure and ligand binding for an OR (Floriano et al
2000) was for the S25 mouse OR where it was known that only two of twenty four
simple aliphatic odorants were agonists for this ORS25. Here we correctly predicted that
the two known cases do bind much more strongly than the other twenty two odorants.
Here we report a more complete validation by comparing the calculated binding energies
of 56 odorants to the intracellular Ca2+ imaging measurements to the rat and mouse I7
OR. Prior to publication of these experimental results (Bozza et al 2002), we arranged to
carry out a blind test of our methods. Tom Bozza and Peter Mombaerts (Rockefeller
University) sent us the names of the 56 odorants (shown in Table I) for which they had
measured the intracellular calcium influx response for the I7 OR both rat and mouse, but
they provided no experimental data until after we reported to them our calculated binding
sites and energies, reported herein. We predicted the structure and odorant binding
energies of R-I7 and M-I7 using MembStruk1.0 and HierDock2.0. They then provided
us with the list of experimental agonists for these two ORs, which then was published
(Bozza et al 2002). As shown in this paper, the calculated binding energies correlate
well, but not perfectly to the experimental activation profiles (correctly showing that
binding to aldehydes is favored while binding to such chemical classes as acids and
198
alcohols are not favored). In addition, our predictions confirmed in advance the result
that both rat and mouse I7 receptor are activated by both heptanal and octanal.
After making these blind predictions, we made significant improvements to the
MembStruk structure prediction methods for our studies on biogenic amine receptors,
where there are large amounts of experimental data on mutations and ligand binding
affinities. These improved methods have now been applied to mouse and rat I7 ORs,
leading to results that are in significantly improved agreement with experimental
measurements of the intracellular calcium imaging results. Based on our best predictions
of the structure and binding site, we have designed three new odorants with two
functional groups that we predict will bind to mouse and rat I7 receptors. Experimental
tests on these compounds would provide additional tests on how well the theory can be
trusted for predictions prior to experiment.
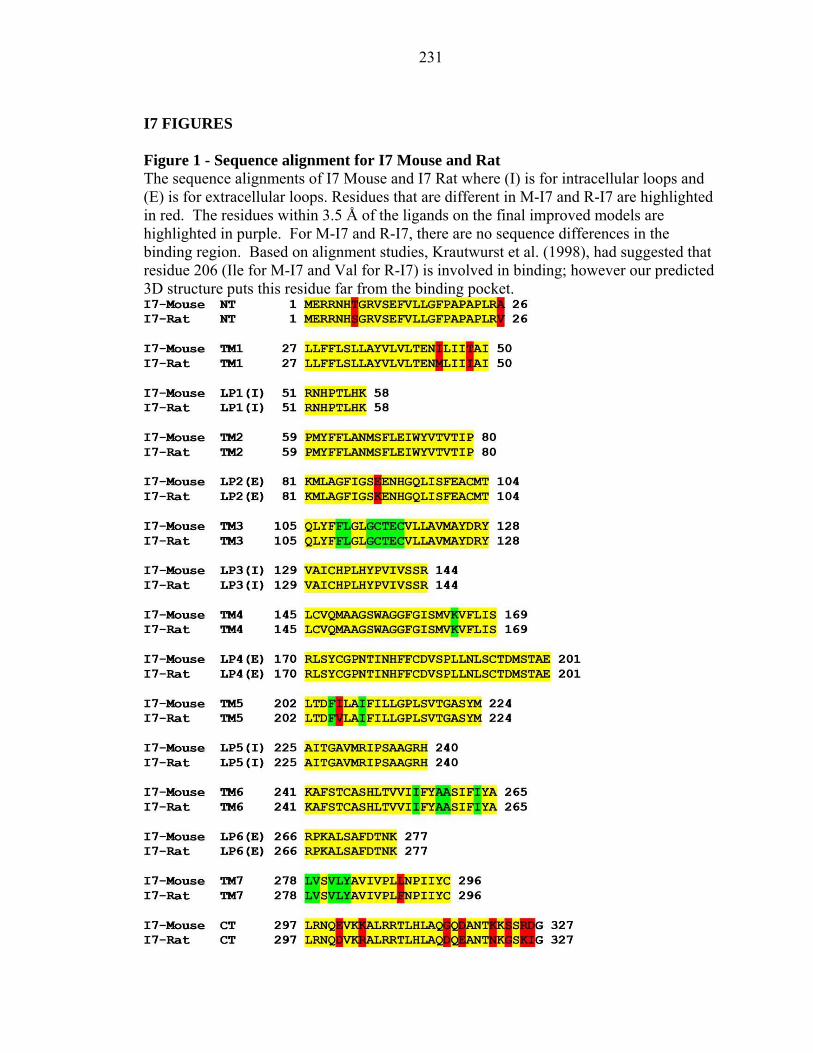
The mouse I7 (M-I7) and rat I7 (R-I7) ORs both contain 301 residues. They have
95% sequence identity, differing by only 15 residues, 4 of which are located in the TM
region (see Figure 1). Despite the high similarity of M-I7 and R-I7, their odorant
activities are somewhat different (Krautwurst et al 1998, Zhao et al 1998, Wetzel et al
1999, Araneda et al 2000, Bozza et al 2002, Levasseur et al 2003). These differences and
similarities in odor recognition make M-I7 and R-I7 good candidates to test how well our
modeling techniques can discriminate odor differentiation resulting from slight changes
in sequence. Previous modeling of R-I7 based on bacteriorhodopsin structure was
reported by Singer 2000.
2.0 RESULTS AND DISCUSSION
199
We report here the predictions for the 3D atomic-level structures of the M-I7 and
R-I7 ORs, the binding sites for the odorants that activate these receptors and the relative
binding energies for the odorants in these sites. We find results that correlate well with
the experimental intracellular calcium ion influx measurements (Bozza et al. 2002,
Bozza, private communication, Araneda et al. 2000).
2.1 Prediction of the three-dimensional structure of M-I7 and R-I7 ORs
The details of the methods used for predicting the structure and function of M-I7
and R-I7 ORs are described in the appendix I7. However in the next section, a brief
outline of the methods as applied to M-I7 and R-I7 are given.
2.1.1 Predicted Structures for M-I7 and R-I7.
To predict the TM regions we aligned the sequences for M-I7 and R-I7 along with
21 other rat and mouse ORs that had similar homology, and these alignments were used
to predict the TM region based on hydropathicity profiles (Trabanino et al., 2004). The
predicted TM regions for M-I7 are compared in Figure 1. Using the predicted TM
regions, we applied the MembStruk1.0 method to predict the 3D structures. Two sets of
structures were predicted using MembStruk1.0 and subsequently MembStruk2.0
methods. The first structures using MembStruk1.0 (described in Floriano et al 2000) are
denoted as preM-I7 and preR-I7. These structures were used for the predictions made in
the blind study, prior to the publication of the experimental odorant activation assays
(Bozza et al 2002). Subsequently the improved version of MembStruk2.0 method was
used [described in the appendix and in Vaidehi et al 2002] to obtain the final structures of
M-I7 and R-I7. These improvements in MembStruk2.0 used the calculated potential
energy to determine the optimum rotational orientation of the helices, rather than just the
200
hydrophobic moment as in MembStruk1.0. These were motivated by studies we were
doing on the structures of dopamine and adrenergic receptors (Kalani et al 2004,
Freddolino et al 2004). In addition, we used the predicted structure of M-I7 and the high
sequence homology between R-I7 and M-I7 to build a homology model for R-I7 based on
the predicted M-I7 structure as template. Below we refer to this as the R-I7(hom)
structure.
For each of these 3D structures, we applied HierDock2.0 (Vaidehi et al. 2002) to
predict the odorant binding sites and binding energies of the 62 molecule odorant library.
Since the results using as preM-I7 and preR-I7 were obtained prior to knowledge of the
experimental results, we consider it valuable to report them here. Hence the methods
used to these results are described in detail in the appendix found in the supplementary
material (Appendix I7). However the main body of the results and the analysis of the
binding sites have been done with the predictions with R-I7(hom) and M-I7 that are in
better agreement with experiment.
2.1.2 Comparison of the Predicted M-I7 and R-I7(hom) Structures.
A standard way to compare different structures for the same protein is to
determine the coordinate root-mean-square (CRMS) difference between the structures
(after matching the center of mass and moments of inertia). However since CRMS is an
average quantity it does not have the discrimination required to understand how the
differences in structure might affect function. Consequently, we developed the
“MembComp” method for comparing the structural features of two GPCRs. Here we
start with the reference plane intersecting hydrophobic center (Trabanino et al. 2004) of
each TM helix of the final structure, compare such helical characteristics as helical bends
201
and tilts (Trabanino et al 2004, Filizola et al. 1998) for each of the 7 TM domains. These
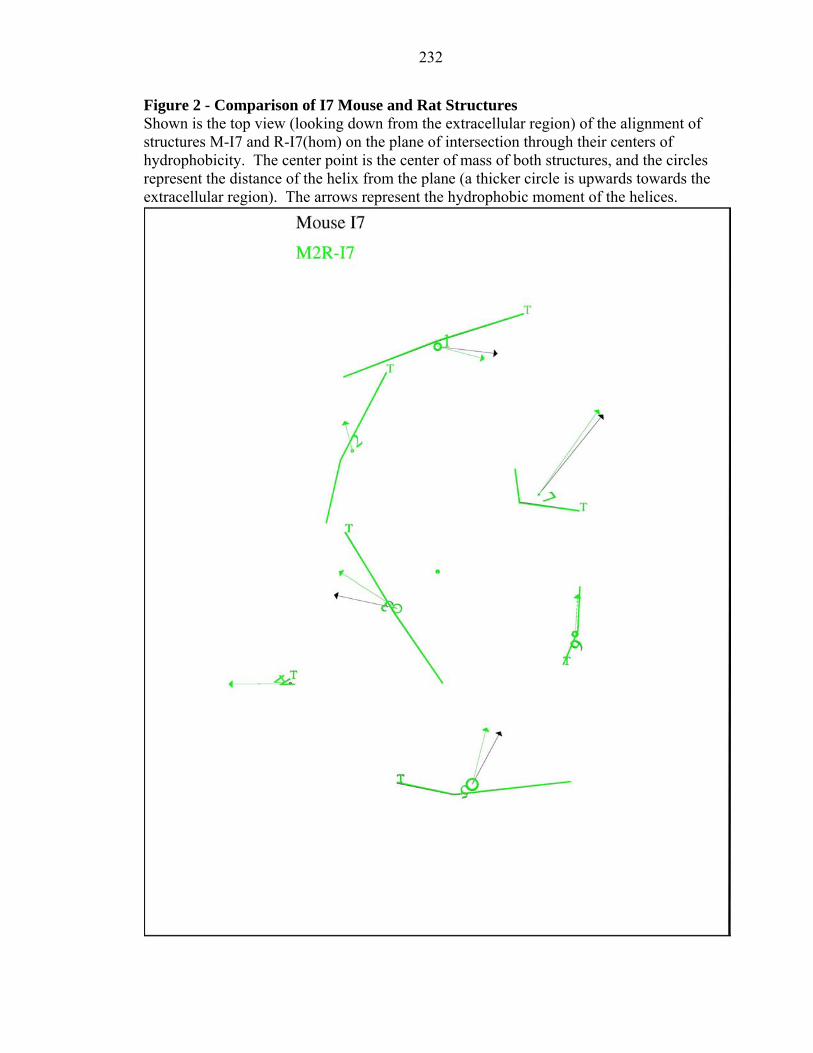
helical properties are summarized in Table II and Figure 2. These results show that the
M-I7 and R-I7(hom) structures are remarkably similar with only slight differences in their
hydrophobic moments, as expected by the 95% sequence identity. The main chain atoms
in the TM region differ by a CRMS of only 1.5Å.
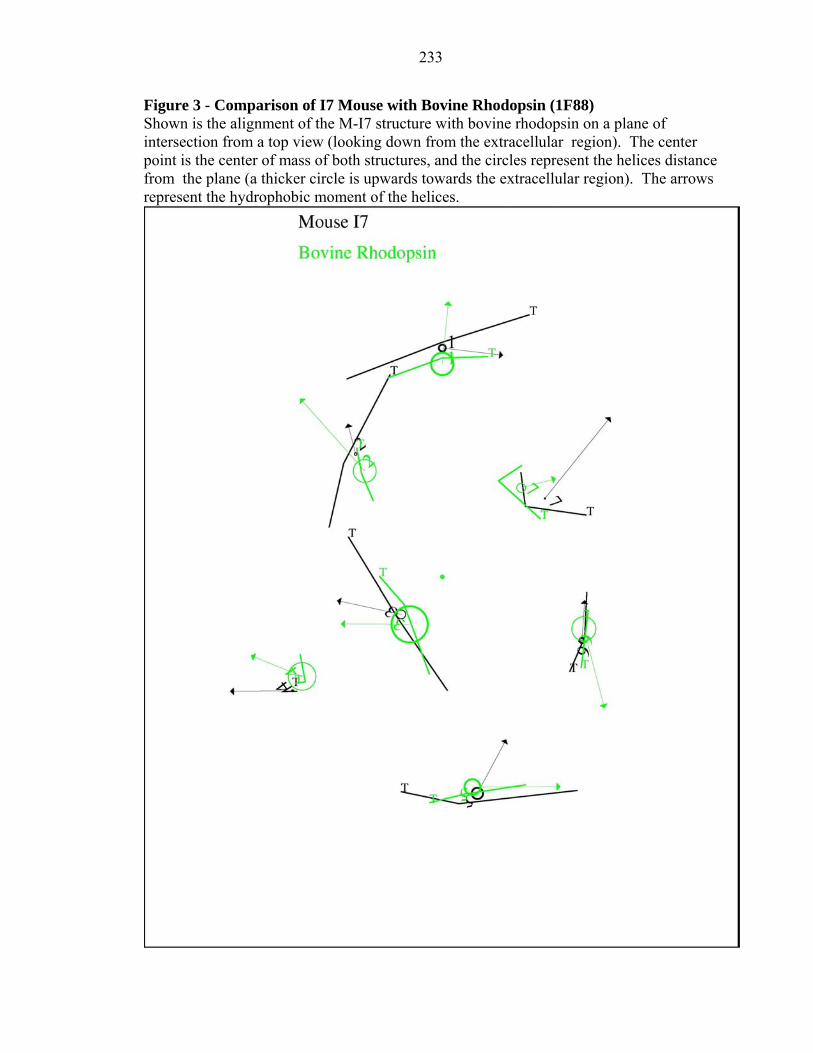
Table III compares the structural features between M-I7 and bovine rhodopsin
(which have a sequence identity of 11%), while Figure 3 compares them graphically.
The CRMS difference between these structures is 6.22 Å, with the largest differences in
the hydrophobic moments of TM6 and a salt bridge from TM6 to the IC2 loop in
rhodopsin. With such a large difference in structure, we expect that using bovine
rhodopsin as the template for homology structure predictions may not lead to useful
predicted structures for the ORs.
2.2 Experimental methods to determine odorant activation profiles
The odorant activation profiles for the M-I7 and R-I7 ORs were determined
experimentally by Dr. Tom Bozza of Rockefeller University, using fura-2 calcium
imaging in acutely dissociated olfactory sensory neurons. KCl and forskolin were used
as positive control stimuli (see Bozza et al. 2002). These experiments were carried out
by first grouping the odorants into six sets or mixtures (A through F) as shown in Table I.
Then for those mixtures with a positive response, the mixtures were separated into
individual components to determine which odorant was causing the activation of the OR
(Bozza et. al. 2002). We had no access to these experimental results nor did we make use
of literature data (Araneda et al. 2000), until the predictions of binding energies using the
preM-I7 and preR-I7 predicted structures were completed and sent to Bozza.
202
2.3 Predicted Binding Site and Binding Energy for odorants in M-I7 and R-I7 ORs
2.3.1 Identification of the putative odorant Binding Site.
We predicted the putative binding site for each of the 62 test odorants to both R-
I7 and M-I7, by using HierDock2.0 to scan the entire receptor structure. The first step
was to partition the entire receptor into 13 overlapping binding regions containing all the
internal voids and surface accessible voids present in the predictions protein structures.
Then we applied the HierDock2.0 protocol (described in Vaidehi 2002 and summarized
in the appendix) to docking the potential odorants to each of these regions. The best
binding region of these 13 regions for all of the test odorants was found to be located
between TM helices, 3, 4, 5 and 7 in both the OR structures.
2.3.2 Binding energies of odorants in the preM-I7 and preR-I7 structures.
Having located the binding region, the HierDock2.0 protocol (detailed in the
appendix) was again used to dock all 62 odorants in this putative binding region for both
M-I7 and R-I7 and to calculate the binding energy. The calculated binding energies of
odorants in the initial preR-I7 and preM-I7 structures are shown in Table IV. The
odorants with the best binding energies are marked in red (predicted binding energy
greater than 30 kcal/mol, none seen in this table) while the second best are marked in
yellow (predicted binding energies above 25 kcal/mol and below 30 kcal/mol), followed
by cyan (for 20 to 25 kcal/mol) and purple (for 15 to 20 kcal/mol). As indicated in Table
IV, the pattern of predicted binding energies is in fair agreement with experimental
intracellular calcium concentration measurements for both R-I7 and M-I7 structures. For
example, we predicted that both heptanal and octanal bind strongly to both M-I7 and R-I7
in disagreement with the published experiments (Krautwurst et al. 1998), but as we
203
learned later this does agree with the new experiments (Bozza et al. 2002). Overall 25%
of the odorant predicted to be good binders (colored yellow) were confirmed by
experiment, while 17% of the odorants with medium affinity (cyan) predictions were
confirmed, 10% of the weak binding odorants (marked in purple), and 7% of the
unmarked were observed to be agonists. Comparison of the calculated binding energies
to the experimental data available in literature (Araneda et al. 2000, Levasseur et al.
2003), we find that 50% of the good binding odorants (marked in yellow) are also found
to be agonists with experiments. For example, nonanal and decanal were shown to be
agonists for R-I7 (Araneda et al. 2000, Levasseur et al. 2003), which is in agreement with
the calculated binding energies in Table IV. The blind predictions correctly concluded
that aldehydes would be the main group activating R-I7 and M-I7.
2.3.3 Binding Energies of the Odorants in the R-I7(hom) and M-I7 refined structures:
Although the MembStruk1.0 calculations led to results in fair agreement with the
measured activation profiles for R-I7 and M-I7 receptors, there were several false
positives (e.g., lilial, lyral, and benzaldehyde) in the prediction. Later the MembStruk1.0
method was improved while we were predicting the structure and function for the
dopamine and adrenergic receptors, for which there is abundant mutation data available
to validate the predicted binding sites.
After completing the computational results in the blind test, we applied the
improved MembStruk2.0 method to again predict the 3D structures of the I7 receptors.
Then we used these new I7 structures with HierDock2.0 to predict the binding site and
binding energy for the 62 odorants. The calculated binding energies of the odorants for
the improved structures are shown in Table V.
204
To simplify comparisons the calculated binding energies of the 62 ligands were
categorized into seven grades. They are class A: the best binding odorants with binding
energies ranging from 30 to 40 kcal/mol (colored in red in Tables IV and V), class B(25
to 30 kcal/mol; yellow) , class C: (20 to 25 kcal/mol cyan) , class D (15 to 20 kcal/mol
purple), class E: (10 to 15 kcal/mol no color), class F: (0 to 10kcal/mol, no color), and
class G negative binding energy indicating no binding, no color.
Comparing to experiment (see Table V) we find the following:
• Among class A: M-I7 has six aldehydes (of which four were observed experimentally
to be agonists) and one ketone (not an agonist experimentally). While R-I7 has five 5
aldehydes (of which all but decanal was observed experimentally to be agonists by
Bozza, while decanal was also observed to be agonist by Araneda et al. 2000) and
one ester (not an agonist experimentally).
• Among class B: M-I7 has nine aldehydes (of which four were observed agonists
experimentally) and one alcohol (not observed to be an agonist). While for R-I7 there
are six aldehydes (of which two were observed to be agonists experimentally by
Bozza and nonanal reported to be an agonist in the literature Araneda et al. 2000), one
ketone(not observed to be an agonist), and one alcohol (not observed to be an
agonist).
• Among class C: M-I7 has one alcohol, four esters, and three ketones none of which
were observed to be agonists experimentally. While R-I7 has four aldehydes, two
alcohols, two esters, and three ketones none of which were agonists.
• Among classes D-G, were the other 38 odorants for M-I7 and 37 odorants for R-I7,
none of which were observed to be agonists.
205
Overall there is good agreement between the calculated binding energies and
measured intracellular calcium response. Thus 62% (69% including decanal in I7 rat) of
class A odorants were observed to be agonists experimentally while 33% (39% including
nonanal in I7 rat) of class B odorants, and none of the 5 lower binding classes (with 75%
of the odorants) were observed to be agonists. Clearly the predictions identified
aldehydes as the prominent binders to I7, which correlates well with the experimental
observation that only aldehydes activate these ORs. Most of the experimental agonists
(56% including decanal and nonanal for I7 rat) are in the top predicted binders shown in
red (predicted binding energy greater than 30 kcal/mol). The rest of the experimental
agonists (44%) are the next best binders shown in yellow.
The false positives in the calculations could be due to 1) inaccuracies in the
calculation of the binding energies such as no explicit inclusion of entropy or room
temperature effects or 2) the fact that some of these odorants predicted as false positives
do bind but may not activate the ORs and could act as antagonists.
The available experimental data involves measuring the increase in calcium ion
concentration in individual olfactory sensory neurons, which is a measure of activation
by the odorant and not just the binding whereas the theory calculates binding site and
binding energy of the odorant but not the activation process of the ORs. Strong binding
is a necessary but not a sufficient condition for activation, and hence our calculated
binding energies should best be compared to measured binding constants. Unfortunately,
such data is scarce and are not yet available for these mammalian ORs. Thus some
odorants predicted to have good binding energies may not bind in the correct
configuration to activate the OR serving perhaps as an antagonist rather than an agonist.
206
For example, we predict lilial and lyral to be in the top (red) group of good
binders, whereas the experiments did not find them to activate the receptors (Bozza et al.
2002). There are two possible explanations for this discrepancy between binding energy
and measured activation 1) the experiments tested these odorants only in a mixture. This
makes the comparison of theory with experiment ambiguous, since a mixture might
contain an antagonist ligand that would compete with an agonist in the mixture. 2) The
other possibility is that lilial and lyral themselves could be antagonists to these rat and
mouse I7 ORs. In section 3.0 we discuss competitive binding experiments that could test
if some odorants predicted to be top binders are not observed to activate because they are
antagonists or because that are agonists but inhibited by antagonists.
2.3.4 Residues predicted to be directly involved in binding of odorants to the R-I7 and M-
I7 OR structures.
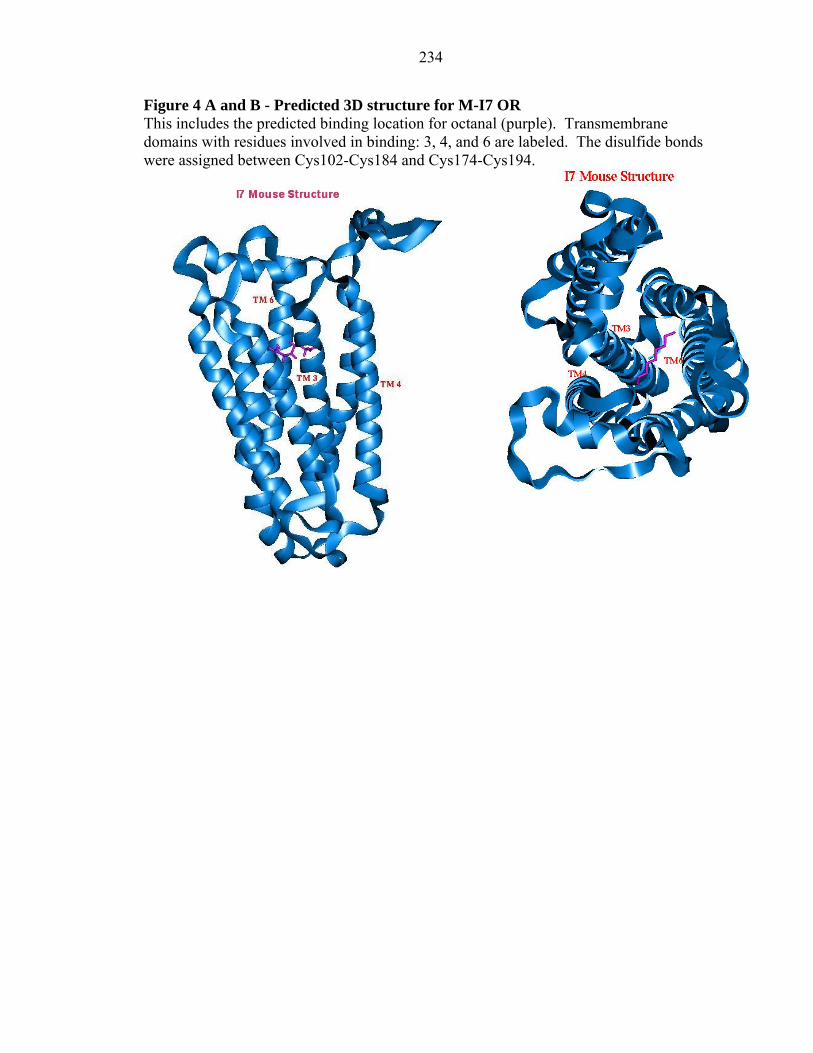
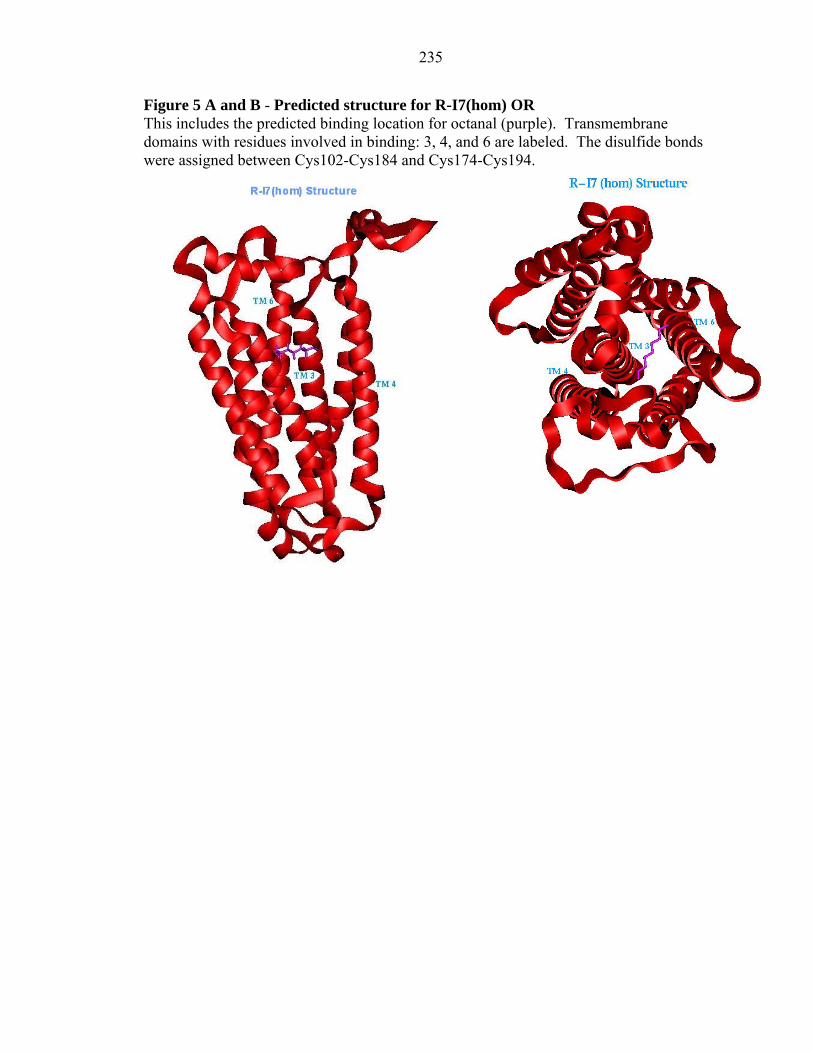
Figures 4 and 5 show the predicted binding sites for octanal in M-I7 and R-
I7(hom). Octanal was predicted as a good binder and shown experimentally to be an
agonist for both M-I7 and R-I7 (Araneda et al. 2000, Bozza et al. 2002). The Figures 4a
and 5a indicate the binding pocket depth as ~ 10 Å deep from the extracellular surface.
This is similar to the epinephrine-binding pocket of the beta-adrenergic receptor (βAR)
(Freddolino et al. 2004, Strader et al. 1989) and other ORs (Vaidehi et al. 2002) and to
11cis-retinal pocket in bovine rhodopsin (Palceszswki et al. 2000). These figures show
that the ligand binding pocket is located inbetween TM helices 3, 4, and 6. The residues
making direct contact with the odorant are in the hypervariable region in the sequence
alignment of ORs (Pilpel and Lancet 1999, Singer et al. 1995 a&b, Mombaerts 1999,
207
Buck and Axel 1991), consistent with their involvement in differential odor binding for
different OR subtypes.
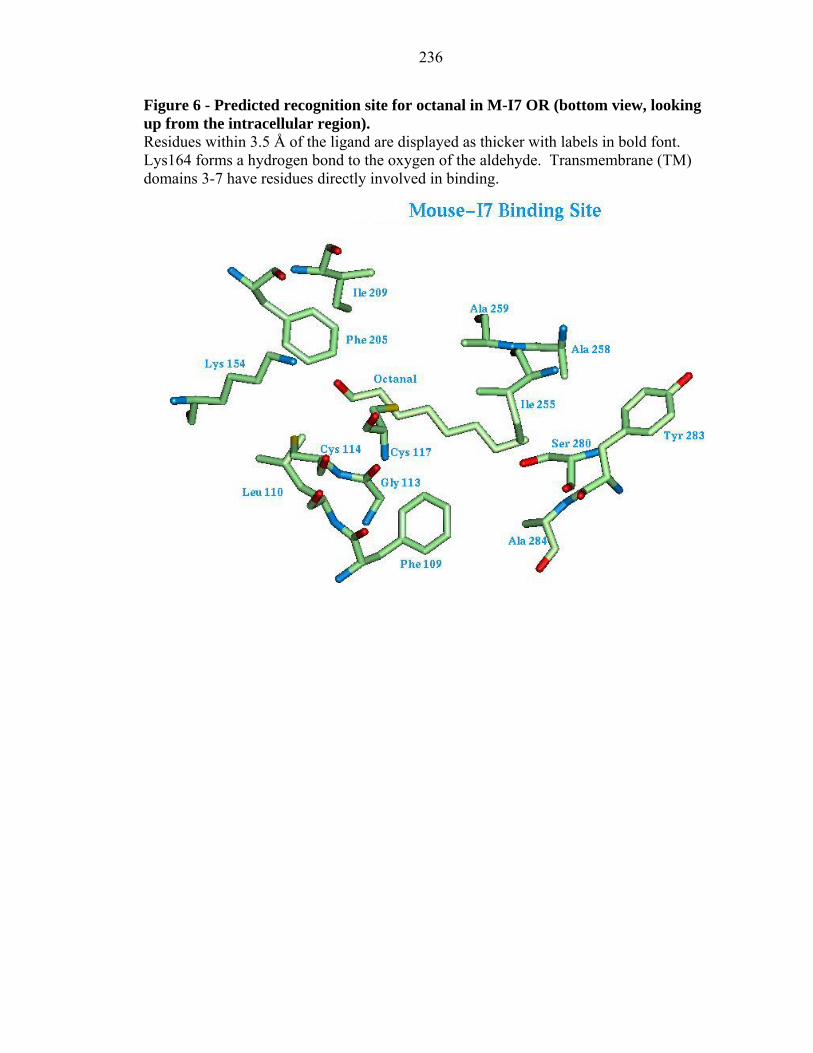
The details of the binding site of octanal in M-I7 and R-I7 structures are shown in
Figures 6 and 7 respectively. We find that Lys 164 is hydrogen bonded to the polar
moiety for all the positive agonists, making it one of the critical residues for the binding
of aldehydes. This could be directly tested experimentally by mutating this residue to
uncharged polar residues (Tyr, Thr), which might switch receptor specificity toward
odorants with polar but uncharged functional groups (say alcohols or ketones) or by
mutating it to a nonpolar residue, which should lead to a dramatically different binding
profile (or possibly to misfolding). Other residues that are involved in binding are: Ile
255, Ala 258, Ala 259, Ser 280, and Tyr 283. As detailed later in the text, mutating these
residues might modulate the length of the alkyl chain recognized by these receptors.
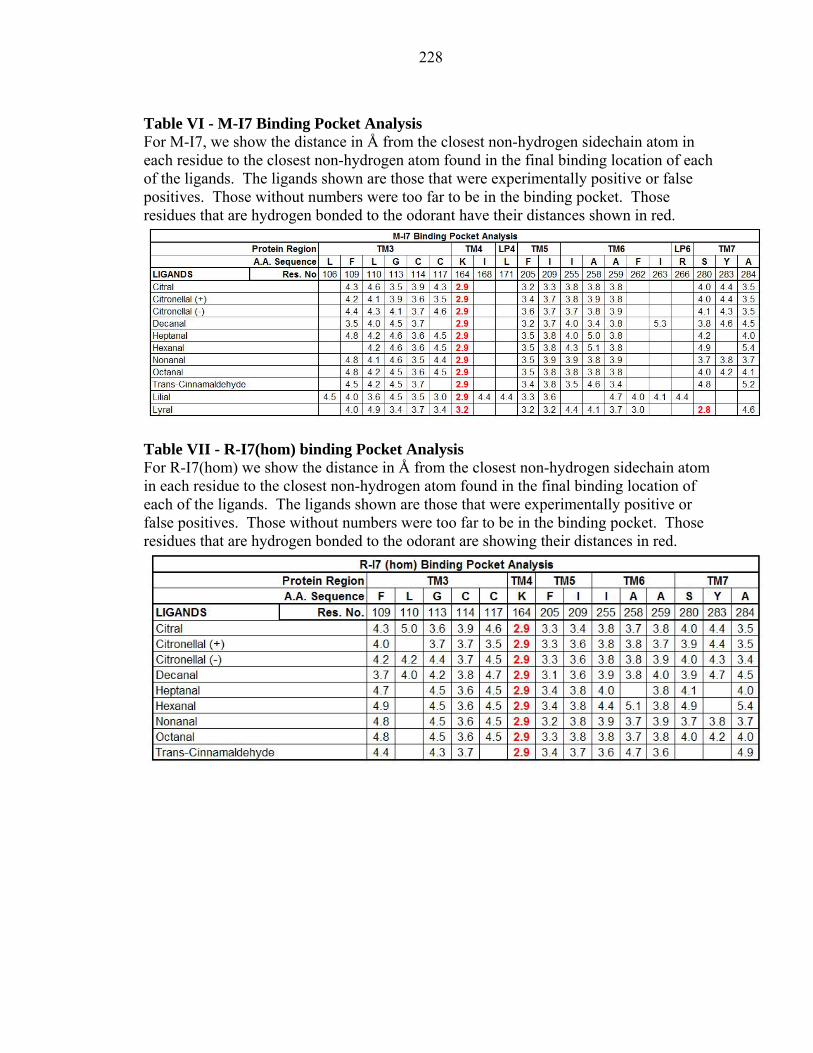
Tables VI and VII show the distances of the residues in the binding site of R-I7(hom) and
M-I7 structures for the aldehydes predicted to be the best binders.
2.3.4 Description of binding sites of odorants with good binding energies.
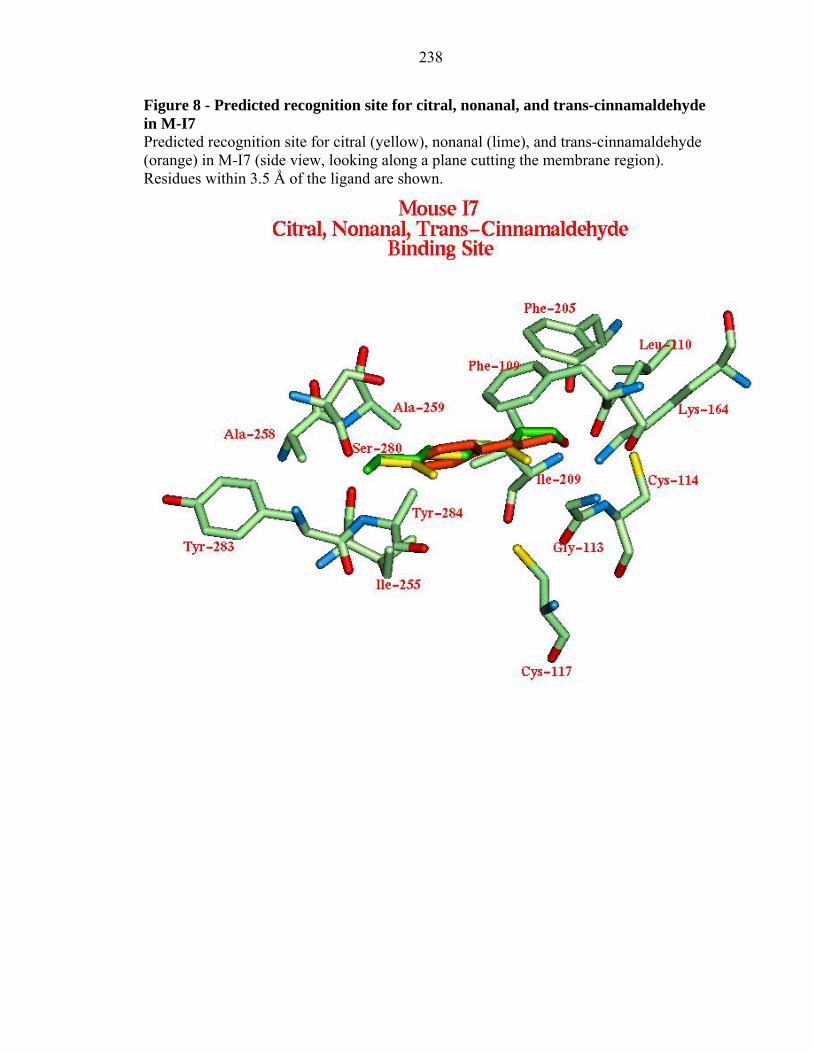
2.3.4a Citral, citronellal (+) and (-), heptanal, hexanal, nonanal, and trans-
cinnamaldehyde to M-I7:
The binding site and orientation of citral, citronellal (+) and (-), heptanal, hexanal,
nonanal, and trans-cinnamaldehyde were all the same as octanal (Figure 6). This is
shown in Figure 8 for citral (yellow), nonanal (lime), and trans-cinnamaldehyde (orange).
For each ligand, the long axis of the odorant is parallel to the membrane. In all these
agonists the aldehyde functional group makes a hydrogen bond to Lys 164. The size of
the odorant that can fit sufficiently near Lys 164 to hydrogen bond is modulated by Cys
208
114, Cys 117, and Phe 205. The length of the odorant binding in this mode is limited by
the Ile 255, Ala 258, Ala 259, Ser 280, and Tyr 283. This suggests the residues that might
be mutated to modify the binding profile and thereby validate our predictions.
2.3.4b Octanal, citral, citronellal (+) and (-), heptanal, hexanal, nonanal, and trans-
cinnamaldehyde to R-I7(hom):
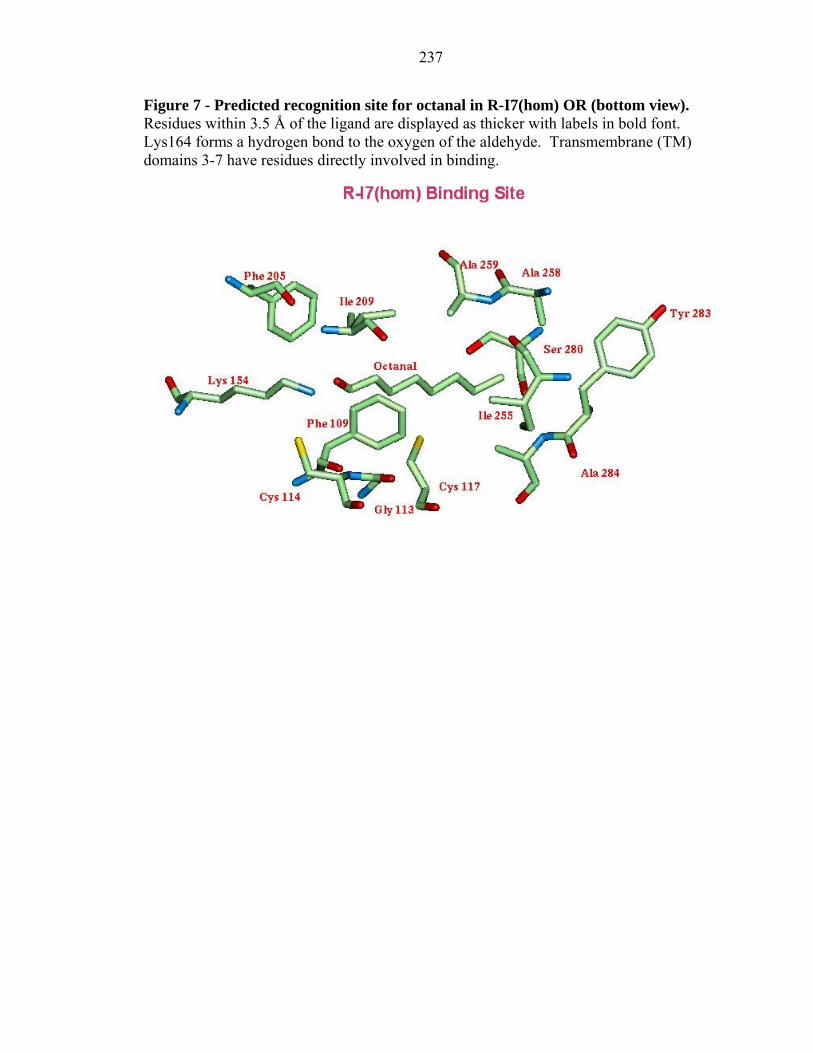
The predicted binding site of these eight ligands in R-I7(hom) (see Figure 7) has
the aldehyde functional group hydrogen bonded to Lys 164. The binding site near Lys
164 is shaped into a narrow groove lined by the residues: Cys 114, Cys 117, Phe 205, and
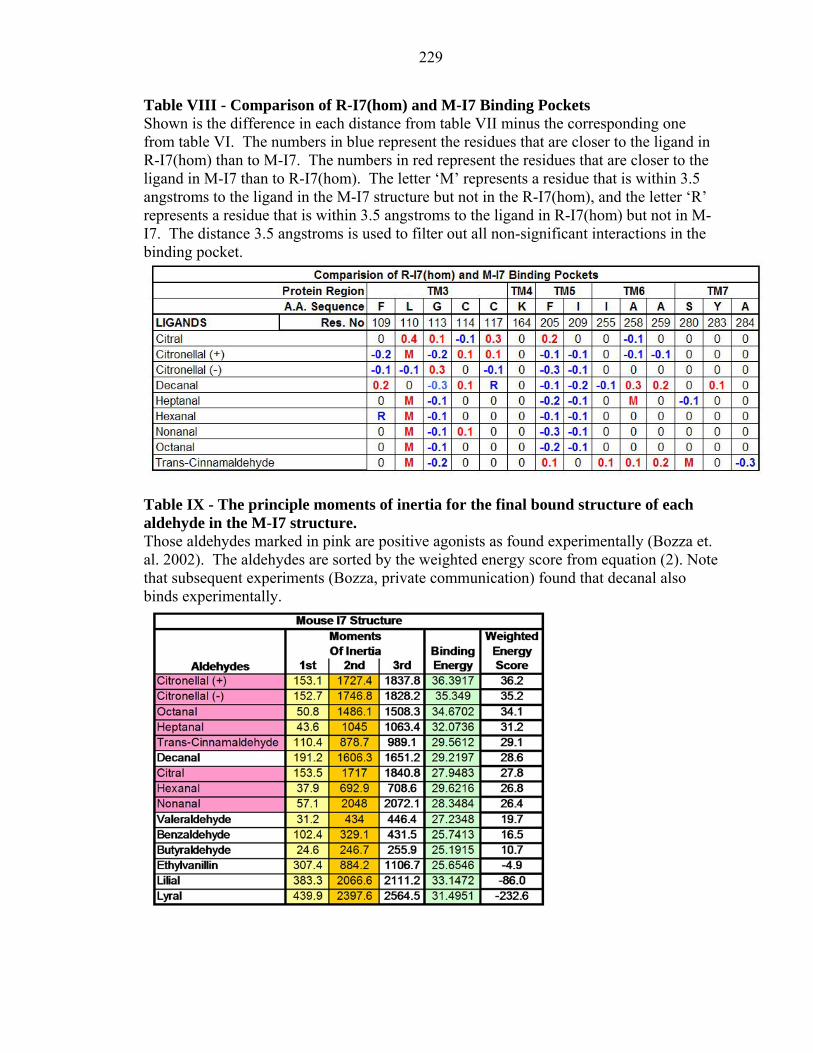
Ile 209 which is very similar in R-I7(hom) and M-I7. Table VIII shows the differences in
the binding pocket for the experimentally observed agonists and for decanal. The main
difference between these two receptors is that Leu 110 is closer to the binding pocket in
M-I7 while Phe 205 and Ile 209 are farther away from the binding pocket in M-I7. This
may explain why citronellal binds more strongly to M-I7. The residues near Lys 164
form a groove that is narrower in R-I7(hom) than the corresponding groove in M-I7, and
the residues that limit the length of the ligand: Ile 255, Ala 258, Ala 259, Ser 280, and
Tyr 283 are generally closer in R-I7(hom), which may explain why the longer ligand
nonanal is experimentally observed in M-I7 and not in R-I7(hom). However, there is a
report that nonanal is experimentally observed but with a weaker response (Araneda et al.
2000). These distances differ just slightly for each ligand, and the long axis of the
odorant is again perpendicular to the membrane. Since our calculations indicate similar
binding constants for these ligands, it could be that any differences observed
experimentally might arise from other factors such as the ease of activation following
binding of agonist which might be affected by residues remote from the active site.
209
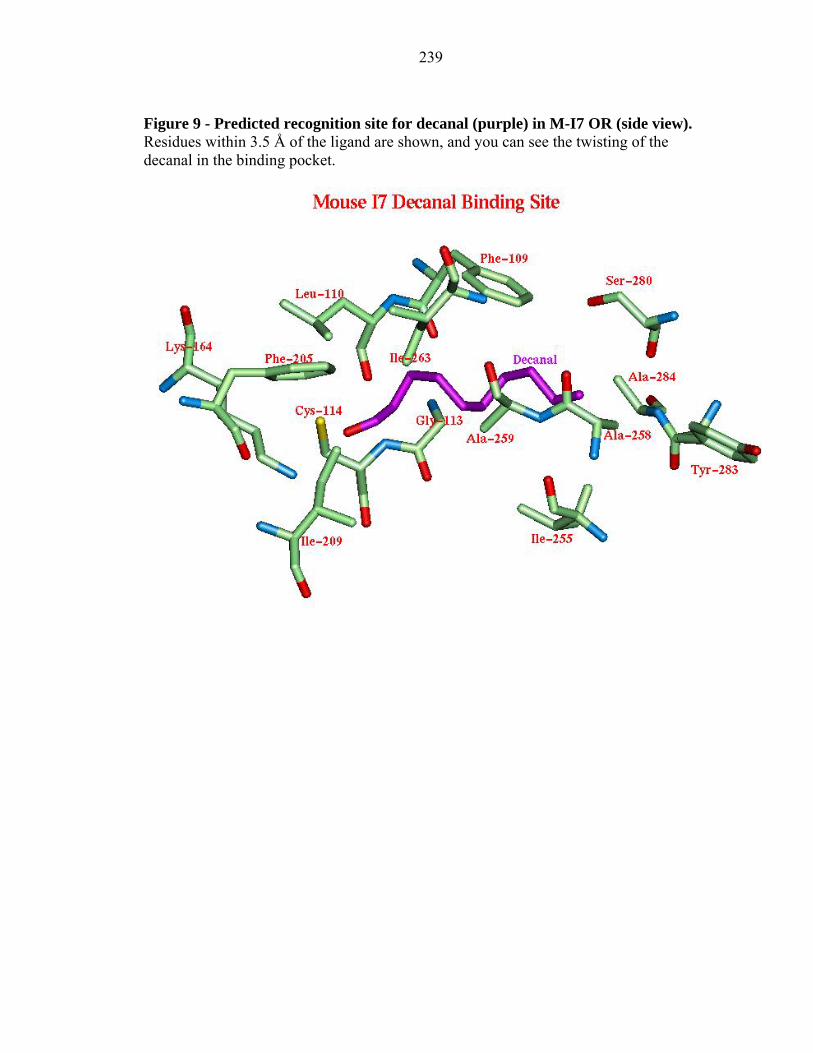
2.3.4c Decanal to M-I7 and R-I7(hom):
We find that decanal binds to a site in M-I7 and R-17(hom) very similar to
octanal; however, decanal must twist along its long axis (horizontal) in order to fit into
the binding site. This is due to Ile 255, Ala 258, Ala 259, Ser 280, and Tyr 283 that
hinder the length of this aldehyde (see Figure 9 for M-I7). The initial experimental
results (Bozza et al. 2002) did not find activation by decanal, but as discussed in section
3.0, experiments done after the calculations show that it does lead to activation but is
slower than heptanal in I7 mouse. Indeed Araneda et al. 2000 also find that decanal
activates I7 rat. The twisting of the molecule to fit the binding site could cause strain and
could be the cause for the slow activation, which caused it to be missed as an agonist in
the initial experiments.
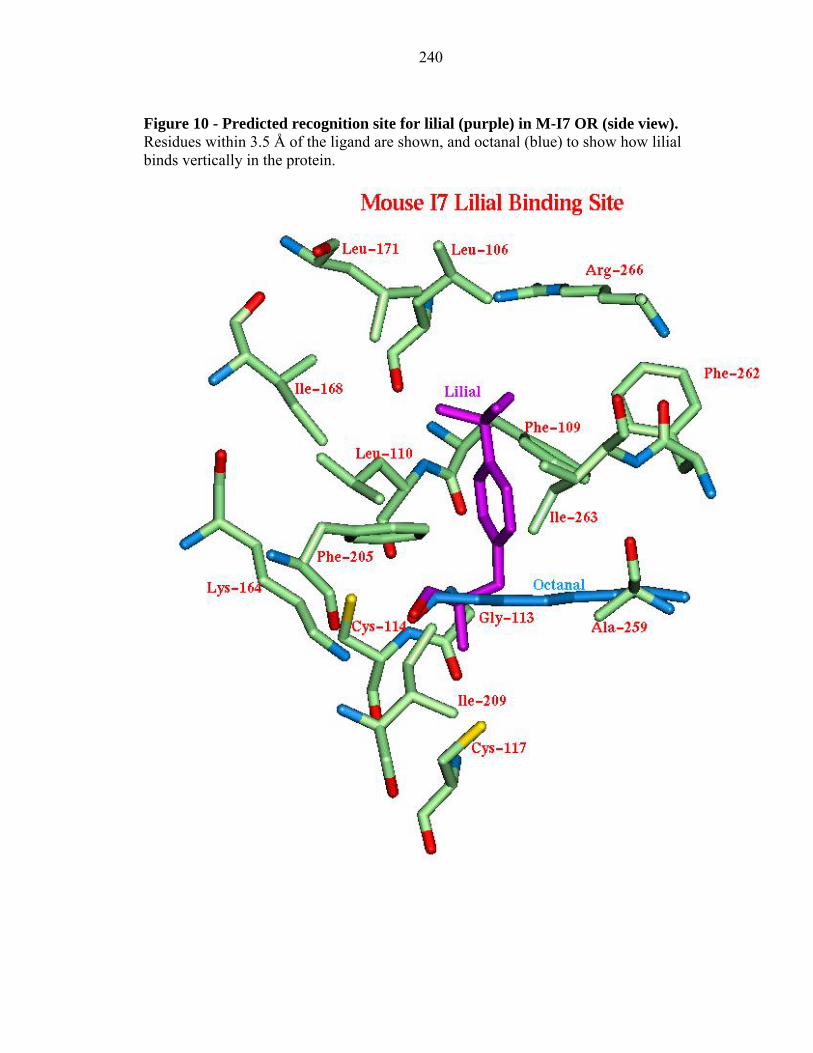
2.3.4d Lilial to M-I7 and R-I7(hom):
We predict that lilial binds strongly, but it was not found experimentally to be a
positive agonist. Indeed the predicted binding site for lilial is quite different than for the
observed agonists, being nearly vertical (see Figure 10 for M-I7). This vertical binding
(parallel to the membrane) of this odorant is stabilized by the hydrophobic residues: Leu
106, Phe 109, Leu 110, Ile 168, Phe 205, Phe 262, and Ile 263. These residues form a
hydrophobic tunnel that might act as a path for the aldehydes to enter into the binding
pocket. In the bovine rhodopsin crystal structure, The extracellular loop II is closed
down into the TM region with 11cis-retinal bound. With lilial bound in its vertical
binding site, this loop cannot close in the same way, perhaps explaining why lilial does
not activate the OR. This speculation that lilial may serve as a competitive antagonist
was tested experimentally (see Section 3.0) and found not to be the case.
210
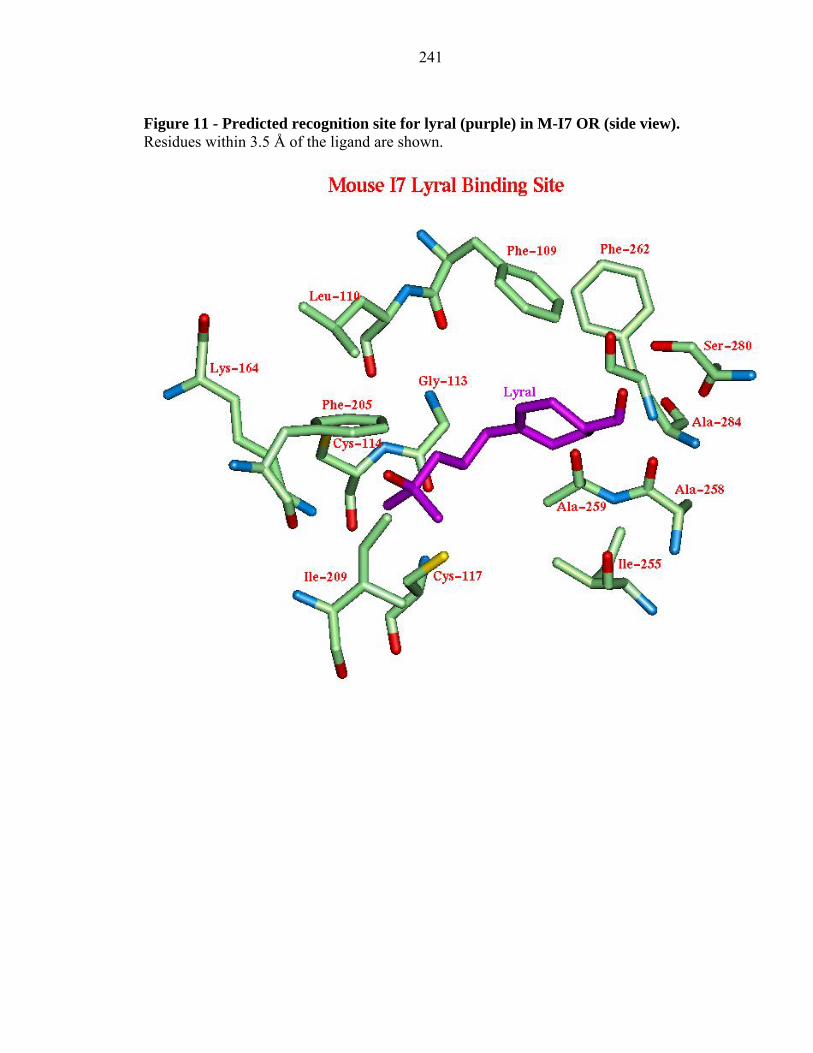
2.3.4e Lyral to M-I7 and R-I7(hom):
We predict that lyral binds strongly, but it was not found experimentally to be an
agonist. Indeed the predicted binding configuration for lyral is quite different than the
observed agonists. The binding site is similar to the M-I7 octanal site with the exception
that the aldehyde functional group of lyral is hydrogen bonded to Ser 280 while the
alcohol functional group at the other end is hydrogen bonded to Lys 164 (see Figure 11).
Although this reversed binding site leads to a good predicted binding energy, its reversed
orientation may be responsible for its inability as a positive agonist. This may indicate
that strong binding to Lys 164 is necessary for activation. Thus lyral may serve as a
competitive antagonist.
2.3.4f Summary of binding studies:
To summarize the results on binding studies, we used HierDock to predict the
most probable binding site of octanal for the M-I7 and R-I7(hom) structures and to
predict the binding of all 62 odorants to this binding site. The corresponding binding
energies are shown in Table V, where we find a good comparison with the experiments.
Again both M-I7 and R-I7 are predicted to bind both heptanal and octanal. As discussed
above some of the experiments in literature had indicted that heptanal activates M-I7 but
not R-I7 while octanal activates R-I7 but not M-I7 (Krautwurst et al. 1998) but later
experiments (Bozza et. al. 2002) find that both lead to activation. The calculated binding
energies also agree with literature that nonanal and decanal activate I7 rat (Araneda et al.
2000, Levasseur et al. 2003). Lys164 forms a hydrogen bond with the aldehyde group of
the aldehyde agonists, This was also previously observed by Singer 2000.
2.4 Agonists, Antagonists, Binding of Mixtures
211
A difficulty in comparing the calculated binding energies directly to the
experimental activation data is that a strongly bound odorant could be an agonist
(eliciting intracellular calcium ion influx) or an antagonist (preventing activation of the
OR). However, most experiments on ORs detect only agonists. Consequently, we are
particularly concerned about comparing the calculated binding energies of odorants to
experiments done only on mixtures, since a mixture containing an antagonist might mask
the activation by an agonist (Cromarty and Derby 1998). There could also be cases
where two ligands both interact with the same receptor, which is outside the scope of our
current studies. Antagonists could be sought experimentally by competitive binding
studies of suspected antagonists against known agonists. This might identify OR
inhibitors that could impair the detection of specific odorants. We have compared the
predicted binding energies only to the experimental agonists that have been tested as
individual odorants. For cases in which only mixtures were known to not elicit activation
of the ORs, we did not assume that the single components are non-binders.
3.0 Proposed competitive experiments and verification
Based on the first generation of predicted structures (pre-RI7 and pre-MI7) for rat
and mouse I7, we predicted three ligands: decanal, lyral, and lilial to have good binding
energies (within the top ten percent) which were not observed agonists to these ORs.
Since cinnamaldehyde (an observed agonist) was predicted to bind in a similar location
and structure as lilial and lyral and with a similar binding energy, we speculated that lilial
and lyral might be antagonists. Similarly heptanal (an observed agonist) is predicted to
bind in location and structure similar to decanal and with a similar binding energy, but
again decanal did not elicit activation response. At that stage, we proposed three
212
experiments that could be done to test for competitive binding to M-I7: 1)
cinnamaldehyde vs. lilial, 2) cinnamaldehyde vs. lyral, and 3) decanal vs. heptanal.
3.1 Competitive activation assays for decanal and lilial
The proposed competitive experiments were carried out to test the above
suggestions (Bozza, private communication). Specifically, Bozza tested whether decanal
or lilial can inhibit responses to the known I7 agonists heptanal or cinnamaldehyde,
respectively.
In the new experiments on decanal using a variety of concentrations, it was found
to be an agonist but slower than heptanal or cinnamaldehyde. Concentration of the ligand
can affect the binding affinity (Levasseur et al. 2003), and thus suggesting that nonanal
and decanal are weaker agonists to I7 rat (Araneda et al. 2000).
However, the experimental results showed that lilial does not behave as a robust
inhibitor of cinnamaldehyde for mouse I7 OR (Bozza, private communication). Thus the
predicted binding of lilial must be assumed to be a false positive, while experiments show
that decanal does activate the receptor, as predicted by the theory.
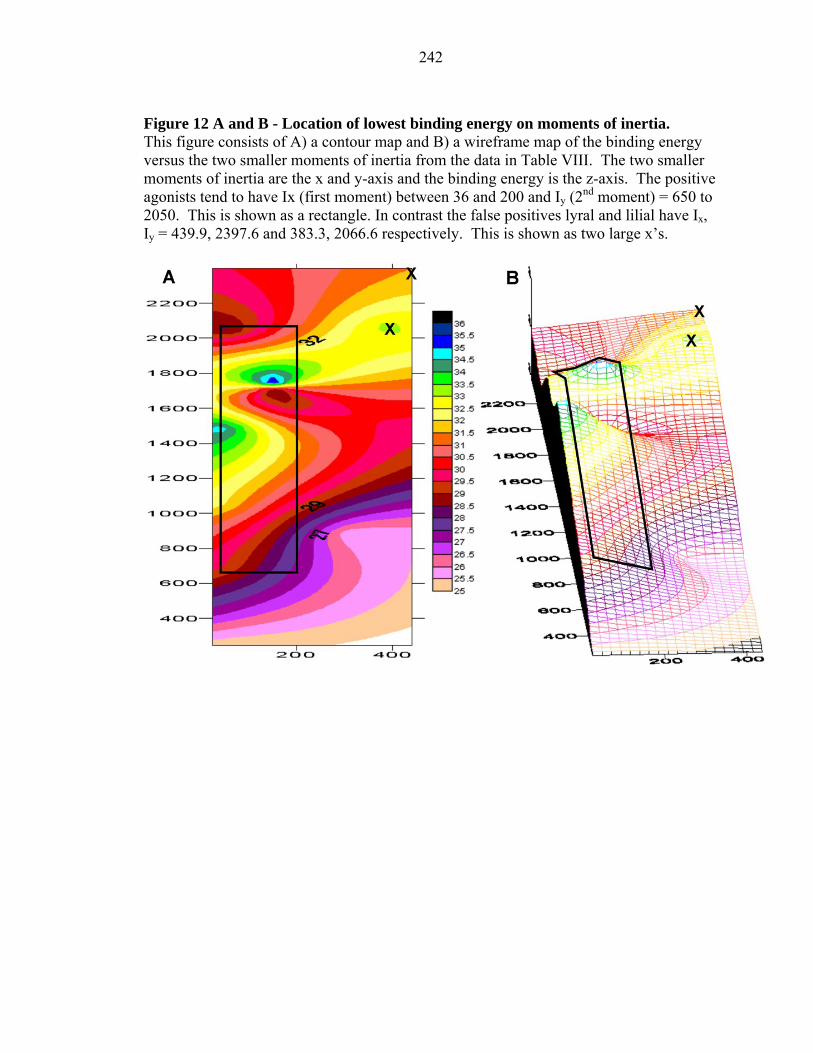
4.0 Filtering false positives with moments of inertia
Since the competitive experiments suggested that lilial neither agonizes nor
antagonizes I7, we suspected that there might be a size restriction on which ligands could
bind and activate the I7 mouse OR, as also discussed in Araneda et al. 2000. Such a
restriction might result from difficulties in the odorant successfully diffusing into the
binding site. To test this idea we calculated the moments of inertia for the final bound
structures of all the aldehydes to the M-I7 model (see Table IX). The moments of inertia
were calculated by assigning each atom with it’s atomic weight and then finding the axis
213
that correspond to the highest distribution of the mass of the ligand. These numbers
represent the general size of the ligand, since the larger the number the farther away from
the axis the density is. Since the agonists all have a small first moments of inertia
number, this means that the binding site prefers a long narrow shape opposed to a rounder
or fatter one. This correlates well with the observations that molecular length is critical
for rat I7 that are found in Araneda et. al. 2000. This first small moments of inertia
component is aligned with the long axis of the ligand. We found that the two smaller
moments of inertia for lilial and lyral are larger than those for the odorants compounds
observed to be agonists to M-I7. Indeed Figure 12 shows that comparing these two
moments with the binding energy scores leads to a contour map (Figure 12) in which all
false positives are well separated from the true positives for the M-I7 profile.
Based on these results we defined the new scoring function in equation (1) that
combines these two moments of inertia with the docking energy score. This equation was
developed to fit the preferred moments of inertia trend observed in Figure 12. Those
ligands observed to be in the right shape (by moments of inertia) were weighted to keep
most of their original energy scores, while those that are farther from the right shape are
given increasingly larger penalties to the original energy score. Sorting the aldehydes
with this new weighted score puts all the observed agonists at the top (Table IX), plus it
suggests that decanal is a weaker agonist. This provides an empirical relation that can be
used to testing for new agonists.
( )1600
13752
80
1201
44
⎟⎟⎟⎟⎟
⎠
⎞
⎜⎜⎜⎜⎜
⎝
⎛−
−
⎟⎟⎟⎟⎟
⎠
⎞
⎜⎜⎜⎜⎜
⎝
⎛−
−= InertiaOfMoment
InertiaOfMoment
ScoreEnergyBindingScoreEnergyWeighted
ndst
214
After determining that this expression works for aldehydes, we applied it to the
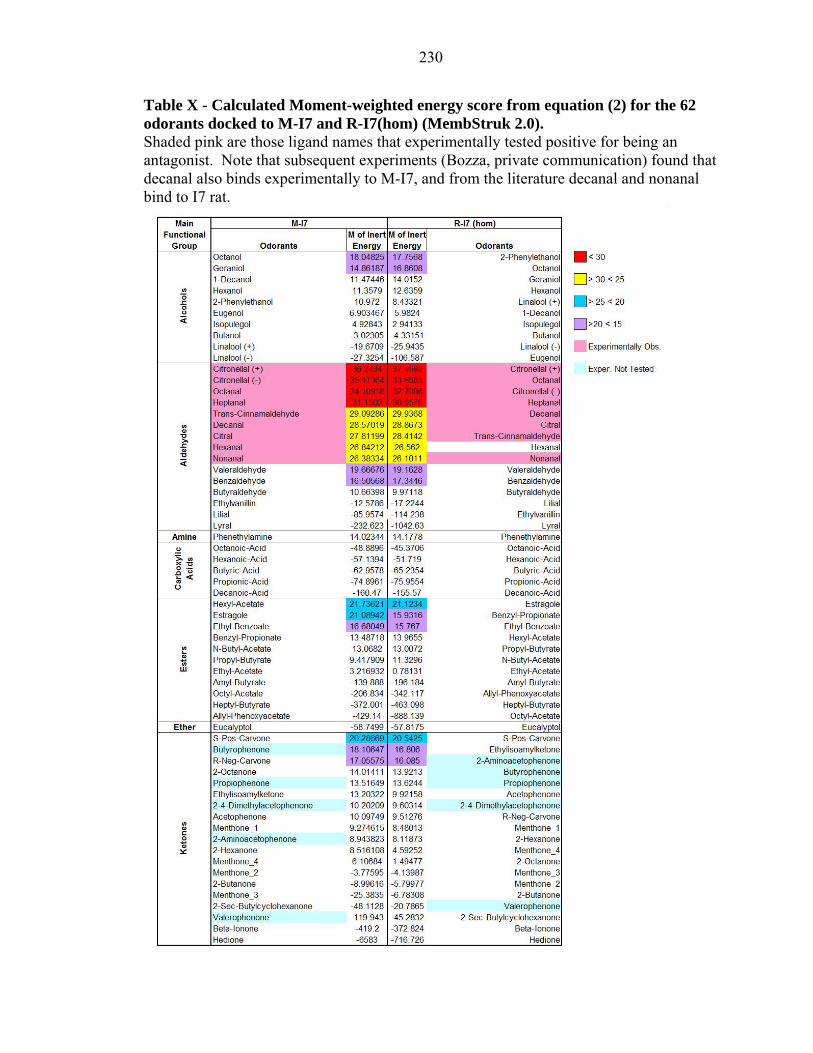
other molecules in the odorant library for both mouse and rat I7 (see Table X). We found
a good correlation to experimental activation measurements (now including decanal as a
positive agonist for mouse I7). Thus we find that 100% of class A (8 compounds), 90%
(including the literature results for decanal and nonanal for I7 rat) of class B (10
compounds) and, none of the poor binder classes were observed (106 compounds) to be
agonists. Of course the use of such an empirical relation to predict the agonists is not
fully satisfactory. Thus we will continue to search for improved atomistic methods that
predict correctly the ligands that activate these receptors without the use of empirical
data.
5.0 DISCUSSION
The correlation between the calculated binding energies and the measured
experimental calcium ion influx suggests that the combination of experimental functional
assays with OR structure prediction will make it possible to identify potential odors for
other ORs. Even more important the knowledge of the detailed binding site suggests site-
directed mutations experiments that would validate the predictions. Indeed the theory
could be used to determine mutations that would increase the selectivity for particular
odorants or even to modify the ORs to be selective against new odorants. Theoretical
predictions provide an atomic level understanding of the odorant binding to ORs. This
might be used to enhance the development of biosensors for the fragrance and food
industries, industrial and environmental safety, and explosives and narcotics detection.
Additional experiments to directly test the predictions made here would be most
useful. Such comparisons could help develop knowledge based methods to predict the
215
function of GPCRs in terms of pharmacaphore models that might accelerate the
predictions of the response patterns of new odorants.
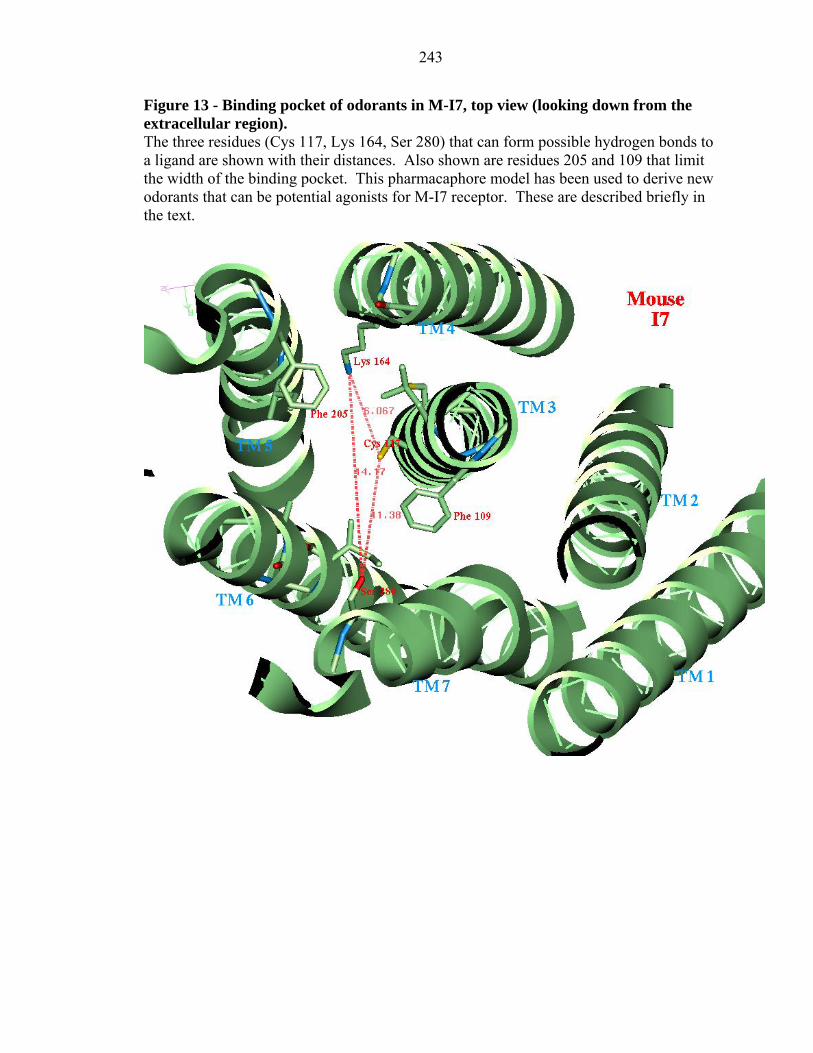
6.0 PROPOSED EXPERIMENTS:
The in-depth analysis of the dimensions of the binding site of odorants in the final
structure of M-I7 from Section 2.3 shows that Lys 164, Cys 117, and Ser 280 are main
contributors to ligand binding. Indeed the Lys 164 might well play an essential role
beyond the binding mode we have studied. We suggest that Lys 164 might form a
Schiff’s base with the aldehyde agonists just as is known to occur with 11cis-retinal in
bovine rhodopsin. Thus the first step of noncovalent binding which we find to strongly
prefer aldehyde, might position the aldehyde for a subsequent formation of the Schiff’s
base, which could be responsible for the changes in conformation that lead to activation.
If such chemical events play a special role in activation, it could have a significant impact
on how we think about the binding in ORs and we strongly suggest experimental tests of
these highly speculative suggestions. For example, mutating Lys164 to such polar groups
as Arg or His might still bind an aldehyde but would not form a Schiff base. Similarly
mutation to Asn or Gln or even Ser, Thr, or Tyr might still bind an aldehyde but would
not accommodate the covalent attachment. This might explain the preference of I7
towards aldehydes.
Lys 164, Cys 117, and Ser 280 along with Phe 205 and Phe 109 cap the width of
the binding pocket, forming a pocket that is ~8 Å long and ~4 Å deep (see Figure 13).
Using this predicted binding pocket, we now consider the design of novel odor agonists
that should bind strongly to the mouse I7 receptor and may lead to activation. We
considered several multi-functional potential ligands, which we subjected to the
216
HierDock2.0 protocol. The best of these suggested potential odorants (8-hydoxy-octanal)
has two chemical functional groups, with character very different than the known
agonists for I7. 8-hydroxy-octanal has the following strong interactions with I7: Lys 164
to the aldehyde functional group, and Ser 280 to the alcohol group. Thus experiments on
the binding of this compound would serve as a good test on the value of the theory to
predict binding and activity.
7.0 Summary and Conclusions
We have used MembStruk2.0 and HierDock2.0 methods to predict the structures
and odorant binding sites of 56 odorants in two closely related ORs: mouse and rat I7.
The predicted binding site of odorants is located in TM domains 3, 4 and 6. In particular
Lys164, Phe109, Cys114, Cys117, and Ile255 of TM4 are predicted to be involved in
recognition of octanal and other aldehydes in the I7 receptor. This suggests that mutation
experiments could be used to test further our predictions. Thus the mutation of Lys164
should dramatically change the recognition profile of M-I7 and R-I7.
The calculated binding energy of octanal and heptanal to both M-I7 and R-I7 are
nearly equal and hence we predicted that both heptanal and octanal would activate the
receptors. This was subsequently confirmed by experimental measurements on the
intracellular calcium concentration influx. Also out of the top 10% of the calculated best
binding odorants, 62% were observed to be agonists experimentally and out of the next
15% in the binding energy list, 33% were observed to be agonists. None of the bottom
75% of the worst binders was observed to be agonist. This provides an overall
validation of the predicted structures for these proteins and of the methods.
217
The results presented here demonstrate significant progress toward predicting
structure and function of olfactory receptors (and other GPCRs). Each of these
predictions can be directly tested experimentally. Development of the atomistic structural
models for ORs with specific binding requirements for specific odorants to provide
information that could be valuable in making the connection between binding, processing
to the cortex, to eventually perception and psychological response. Understanding these
relationships could have significant impact on the fragrance and food industries, and
might be useful in developing artificial olfaction sensors.
Indeed as the accuracy of the predicted OR structures are validated, it should be
practical and useful to predict the 3D structures of all 913 mouse ORs and all 339 human
ORs. Then it would be practical to predict the binding of large odorant libraries to all
olfactory receptors to obtain overall binding profiles that could be most useful in tracing
through the processing connecting molecular recognition to odorant recognition.
9.0 Acknowledgements
We thank Dr. Thomas Bozza and Prof. Peter Mombaerts of Rockefeller
University for their suggestion of the blind test on I7 and their assistance in this
collaboration. Our special thanks to Dr. Thomas Bozza for conducting some competitive
assay experiments proposed by us.
This work was initiated with support by ARO-MURI (Dr. Robert Campbell) with
some of the HierDock work supported by NIH (BRGRO1 andGM625523). The
computational facilities used here were supported by an IBM-SUR grant and by an ARO-
DURIP grant. Other facilities of the Materials and Process Simulation Center used in this
project are supported also by DOE (ASCI ASAP), General Motors, ChevronTexaco,
218
ONR, NSF (CHE and MRI), ARO, ONR, Beckman Institute, Seiko-Epson, NIH HD, and
Asahi Kasei.
219
10.0 REFERENCES
Araneda, R. C., Kini, A. D., and Firestein, S. (2000). The molecular receptive range of an odorant receptor. Nat. Neuroscience 3(12), 1248-1255.
Araneda, S., Mermet, N., Verjat, T., Angulo, J. F., Radicella. J. P. (2001) Expression of Kin17 and 8-OxoG DNA glycosylase in cells of rodent and quail central nervous system. Brain Res. Bull. 56(2), 139-46.
Appendix - http://www.wag.caltech.edu/GPCR/I7/appendix.html
Bower, M., Cohen, F. E., & Dunbrack, R. L., Jr. (1997) Prediction of protein side-chain rotamers from a backbone-dependent rotamer library: a new homology modeling tool. J. Mol. Biol. 267, 1268-1282
Bozza, T., Kauer, J.S. (1998) Odorant response properties of convergent olfactory receptor neurons. J. Neurosci. 18:4560-4569.
Bozza, T., Feinstein, P., Zheng, C., & Mombaerts, P. (2002). Odorant Receptor Expression Defines Functional Units in the Mouse Olfactory System. J. of Neuroscience 22(8):3033-3043
Buck L, Axel R. (1991). A Novel Multigene Family May Encode Odorant Receptors: A Molecular Basis for Odor Recognition. Cell 65, 175-187.
Connolly M.L. (1983). Solvent-Accessible Surfaces of Proteins and Nucleic Acids. Science 221, No. 4612, 709-713.
Cromarty SI, Derby CD. 1998. Inhibitory receptor binding events among the components of complex mixtures contribute to mixture suppression in responses of olfactory receptor neurons of spiny lobsters. J. Comparative Physiology A - Sensory Neural And Behavioral Physiology. 183:699-707.
Ding, H. Q., Karasawa, N. & Goddard III, W.A. (1992). Atomic level simulations on a million particles: The cell multipole method for Coulomb and London nonbond interactions. J. Chem. Phys. 97 (6), 4309-4315.
Ding, H.Q., Karasawa, N. & Goddard III, W.A. (1992). Atomic level simulations on a million particles: The cell multipole method for Coulomb and London nonbond interactions. Chem. Phys. Lett. 196(1), 6-10.
Donnelly, D. (1993). Modelling alpha-helical transmembrane domains. Biochem. Soc. T. 21(1), 36-39.
Duchamp-Viret, P., Chaput. M. A., and Duchamp, A. (1999) Odor Response Properties of Rat Olfactory Receptor Neurons. Science, 284, 2171-2174
Eisenberg D., Weiss R.M., Terwilliger, T.C., (1984). The Hydrophobic Moment Detects Periodicity In Protein Hydrophobicity. Proc. Natl. Acad. Sci. USA, 8, 140-144.
Ewing, T.A. & Kuntz, I.D. (1997). Critical evaluation of search algorithms for automated molecular docking and database screening. J Comput. Chem. 18(9), 1175-1189.
220
Floriano W.B., Vaidehi, N., Singer M.S., Shepherd G.M., Goddard III W.A. 2000. Molecular Mechanisms underlying differential odor responses of a mouse olfactory receptor. P. Natl. Acad. Sci. USA 97:10712-10716.
Freddolino, P.L., Kalani, M.Y., Vaidehi N., Floriano W.B., Hall, S.E., Trabanino R.J., Kam V.., and Goddard III W.A. 3D Structure for Human β2 Adrenergic Receptor and the binding site for Agonists and Antagonist, 2004, PNAS 101: 2736-2741
Gasteiger J, Marsili M. (1980). Iterative partial equalization of orbital electronegativity––a rapid access to atomic charges. Tetrahedron 36(22), 3219-3228.
Ghosh , A., Rapp, C.S. & Friesner, R.A. (1998). Generalized Born Model Based on a Surface Integral Formulation. J. Phys. Chem. B 102(52), 10983-10990.
Gimenez C. (1998). Composition and structure of the neuronal membrane: molecular basis of its physiology and pathology. Rev Neurol 26(15), 232-239.
Godfrey P.A., Malnic, B. and Buck, L.B., (2004), The mouse olfactory receptor gene family, Proc. Natl. Acad. Sci. USA, 101, 2156-2161.
Grigorieff, N., Ceska, T.A., Downing, K.H., Baldwin, J.M. & Henderson, R. (1996). Electron-crystallographic Refinement of the Structure of Bacteriorhodopsin. J. Mol. Biol. 259(3), 393-421.
JAGUAR v. 4.0– Schrodinger Co, Portland Oregon.
Jain, A., Vaidehi, N. & Rodriguez, G. (1993). A Fast Recursive Algorithm for Molecular Dynamics Simulation. J. Comp. Phys. 106(2), 258-268.
Kajiya, K., Inaki, K., Tanaka, M., Haga, T., Kataoka, H., and Touhara, K. (2001). Molecular bases of odor discrimination: Reconstitution of olfactory receptors that recognize overlapping sets of odorants. J. of Neuroscience 21 (16):6018-6025 Aug. 15
Kalani, M.Y., Vaidehi, N., Freddolino P.E., Floriano W.B., Hall, S.E., Trabanino, R.J., Kam V., and Goddard III, W.A. Structure and function of human D2L receptor, 2004, PNAS 101: 3815-3820
Kiefer H, Krieger J, Olszewski JD, von Heijne G, Prestwich GD, Breer H. (1996). Expression of an Olfactory Receptor in Escherichia coli: Purification, Reconstitution, and Ligand Binding. Biochemistry 35(50), 16077-16084.
Krautwurst, D., Yau, K.W. & Reed, R.R. (1998). Identification of Ligands for Olfactory Receptors by Functional Expression of a Receptor Library. Cell 95(7), 917-926.
Kuntz I.D., Blaney J.M., Oatley S.J., Langridge R., Ferrin T.E. (1982). A geometric approach to macromolecule-ligand interactions. J. Mol. Biol. 161(2), 269-288.
Lancet D, Sadovsky E, Seidemann E. (1993) Probability model for molecular recognition in biological receptor repertoires: significance to the olfactory system. Proc Natl Acad Sci U S A. 90(8), 3715-9.
Levasseur, G., Persuy, M., Grebert, D., Remy, J., Salesse, R., and Pajot-Augy, E. (2003). Ligand-specific dose-response of heterologously expressed olfactory receptors. Eur. J. Biochem. 270 (13):2905-2912
221
Lim, K-T, Brunett, S., Iotov, M., McClurg, R.B., Vaidehi, N., Dasgupta, S., Taylor, S. & Goddard III, W.A. (1997). Molecular dynamics for very large systems on massively parallel computers: The MPSim program. J Comput. Chem. 18(4), 501-521.
MacKerell, A.D., Bashford, D., Bellott, M., Dunbrack, R.L., Evanseck, J.D., Field, M.J., Fischer, S., Gao, J., Guo, H., Ha, S., Joseph-McCarthy, D., Kuchnir, L., Kuczera, K., Lau, F.T.K., Mattos, C., Michnick, S., Ngo, T., Nguyen, D.T., Prodhom, B., Reiher, W.E., Roux, B., Schlenkrich, M., Smith, J.C., Stote, R., Straub, J., Watanabe, M., Wiorkiewicz-Kuczera, J., Yin, D. & Karplus, M. (1998). All-Atom Empirical Potential for Molecular Modeling and Dynamics Studies of Proteins. J. Phys. Chem. B 102(18), 3586-3616.
Malnic, B., Hirono, J., Sato, T. & Buck, L.B. (1999). Combinatorial Receptor Codes for Odors. Cell 96(5),713-723.
Malnic B., Godfrey P. A., and Buck, L.B., (2004), The human olfactory receptor gene family, Proc. Natl. Acad. Sci. USA, 101, 2584-2589.
Filizola, Marta, Perez, Juan J., & Carteni-Farine, Maria (1998). BUNDLE: A program for building the transmembrane domains of G-protein-coupled receptors. J. Computer-Aided Molecular Design 12, 111-118
Mathiowetz, A.M., Jain, A., Karasawa, N., & Goddard III, W.A. (1994). Protein Simulations using Techniques Suitable for Very Large Systems: the Cell Multipole Method for Nonbond Interactions and the Newton-Euler Inverse Mass Operator Method for Internal Coordinate Dynamics. Proteins 20, 227.
Mayo, S. L., Olafson, B.D. & Goddard III, W.A. (1990). DREIDING: a generic force field for molecular simulations. J. Phys. Chem. 94(26), 8897-8909.
Mombaerts P. (1999). Seven-transmembrane proteins as odorant and chemosensory receptors. Science 286(5440), 707-711.
Mori, K., Nagao, H., and Yoshihara, Y. (1999) The Olfactory Bulb: Coding and Processing of Odor Molecule Information. Science 286: 711-715.
Palczewski, K., T. Kumasaka, T. Hori, C. Behnke, H. Motoshima, B. Fox, I. Trong, D. Teller, T. Okada, R. Stenkamp, M. Yamamoto, and M. Miyano. (2000) Crystal structure of rhodopsin: a G-protein-coupled receptor. Science. 289:739–745.
Pilpel Y, Lancet D. (1999). The variable and conserved interfaces of modeled olfactory receptor proteins. Prot. Sci. 8(5), 969-977.
Poincelot, R.P., Millar, P.G., Kimbel, R.L, Jr., Abrahamson, E.W. (1970). Determination of the chromophoric binding site in native bovine rhodopsin. Biochemistry 9(8), 1809-1816.
Rappé, A.K. & Goddard III, W.A. (1991). Charge equilibration for molecular dynamics simulations. J. Phys. Chem. 95(8), 3358.
Rubin, B. D., and Katz, L. C.(1999) Optical Imaging of Odorant Representations in the Mammalian Olfactory Bulb. Neuron. 23, 499-511.
222
Sachdeva A, Sachdeva OP, Gulati SP, Kakkar V. (1993). Nasal mucociliary clearance & mucus pH in patients with diabetes mellitus. Indian J. Med. Res. B 98, 265-268.
Schertler, G.F.X. (1998). Structure of rhodopsin. Eye 12, 504-510.
Sicard, G., and Holley, A. (1984) Receptor cell reponses to odorants – similarities and differences among odorants. Brain Res. 292, 283-296
Singer, M.S. (2000). Analysis of the Molecular Basis for Octanal Interactions in the Expressed Rat I7 Olfactory Receptor. Chem. Senses 25, 155-165
Singer, M.S. & Shepherd, G.M. (1994). Molecular modeling of ligand-receptor interactions in the OR5 olfactory receptor. Neuroreport. NeuroReport 5(10), 1297-300.
Singer, M.S., Weisinger-Lewin, Y., Lancet, D. & Shepherd, G.M. (1995a). Positive selection moments identify potential functional residues in human olfactory receptors. Receptors Channels 4(3), 141-147.
Singer, MS, Oliveira L., Vriend G., and Shepherd G. M. (1995b). Potential ligand-binding residues in rat olfactory receptors identified by correlated mutation analysis. Receptors Channels, 3(2), 89-95
Strader, C.D., Sigal, I.S. & Dixon R.A.F. (1989). Structural basis of beta-adrenergic receptor function. FASEB J. 3(7), 1825-1832.
Tannor, D. J., Marten, B., Murphy, R., Friesner, R.A., Sitkoff, D., Nicholls, A., Ringnalda, M., Goddard III, W.A. and Honig, B. (1994). Accurate First Principles Calculation of Molecular Charge Distributions and Solvation Energies from Ab Initio Quantum Mechanics and Continuum Dielectric Theory. J. Am. Chem. Soc. 116(26), 11875.
Trabanino R.J., Hall, S.E., Vaidehi N., Floriano W.B., and Goddard III W.A. (2004). First Principles Predictions of the Structure and Function of G-Protein Coupled Receptors: Validation for Bovine Rhodopsin. BioPhys. J. 2004 86: 1904-1921
Vaidehi, N., Jain, A., & Goddard III, W.A. (1996). Constant Temperature Constrained Molecular Dynamics: The Newton-Euler Inverse Mass Operator Method. J. Phys. Chem. 100(25), 10508.
Vaidehi, N., Floriano, W. B., Trabanino, R., Hall, S. E., Freddolino, P., Choi, E. J., Zamanakos, G., and William A. Goddard II, (2002). Prediction of structure and function of G protein-coupled receptors. Proc. Nat. Acad. Sci. Vol. 99, no. 20, 12622-12627. Vriend, G. (1990). WHAT IF: A molecular modeling and drug design program. J. Mol.
Graph. 8(1), 52-56.
Wetzel CH, Oles M, Wellerdieck C, Kuczkowiak M, Gisselmann G, Hatt H (1999) Specificity and sensitivity of a human olfactory receptor functionally expressed in human embryonic kidney 293 cells and Xenopus Laevis oocytes. J Neurosci 19: 7426-7433.
223
Zamanakos, G. (2001). A fast and accurate analytical method for the computation of solvent effects in molecular simulations. PhD Thesis, Physics, California Institute of Technology, Pasadena, CA
Zhao, H., Ivic, L., Otaki, J. M., Hashimoto, M., Mikoshiba, K., Firestein, S., (1998) Functional Expression of a Mammalian Odorant Receptor. Science, 279, 237-241
224
I7 TABLES
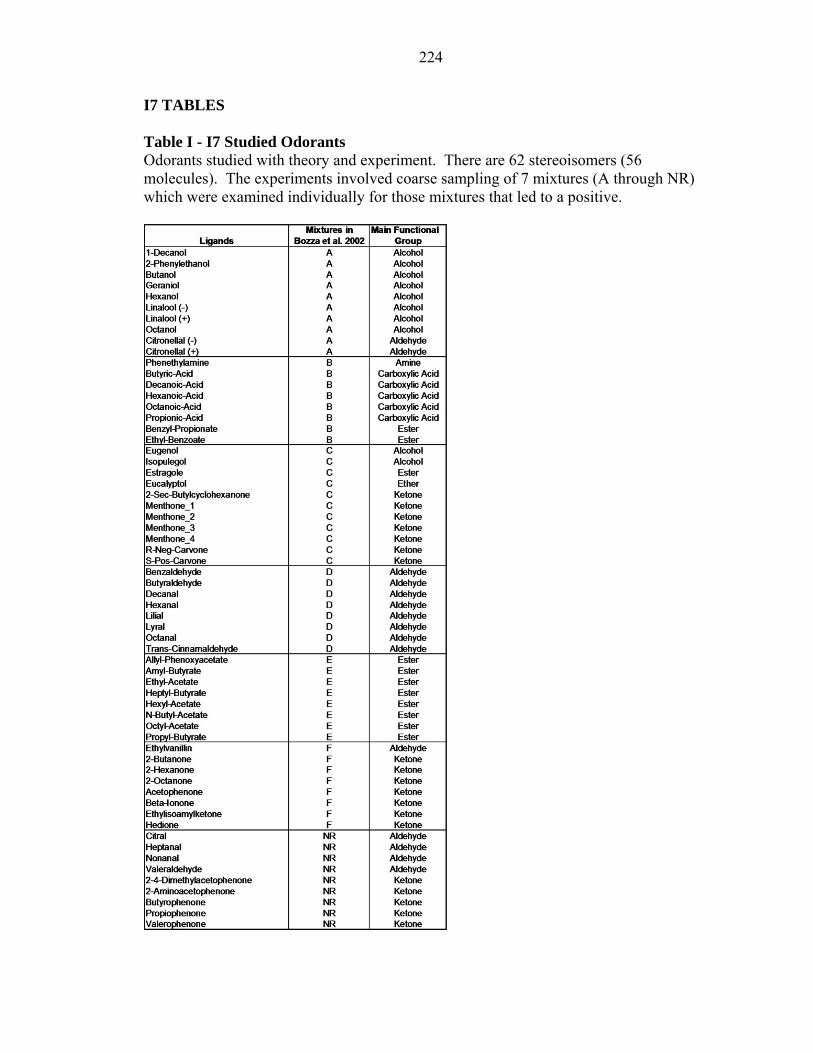
Table I - I7 Studied Odorants Odorants studied with theory and experiment. There are 62 stereoisomers (56 molecules). The experiments involved coarse sampling of 7 mixtures (A through NR) which were examined individually for those mixtures that led to a positive.
225
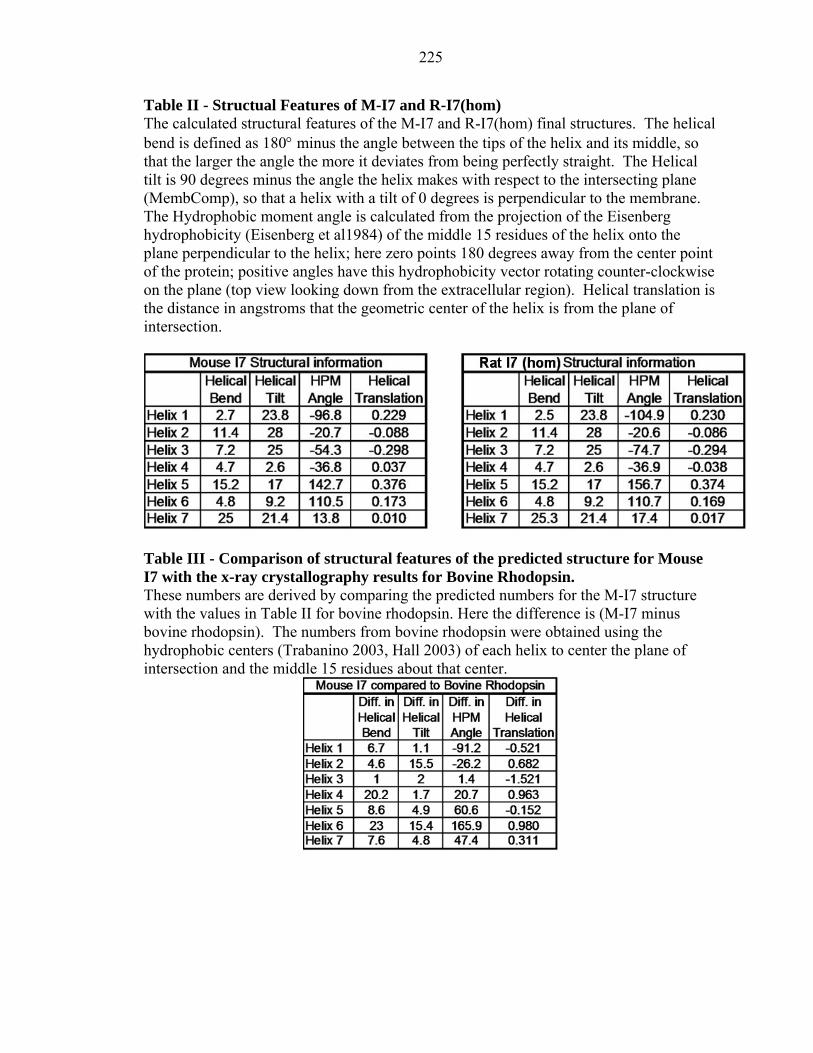
Table II - Structual Features of M-I7 and R-I7(hom) The calculated structural features of the M-I7 and R-I7(hom) final structures. The helical bend is defined as 180° minus the angle between the tips of the helix and its middle, so that the larger the angle the more it deviates from being perfectly straight. The Helical tilt is 90 degrees minus the angle the helix makes with respect to the intersecting plane (MembComp), so that a helix with a tilt of 0 degrees is perpendicular to the membrane. The Hydrophobic moment angle is calculated from the projection of the Eisenberg hydrophobicity (Eisenberg et al1984) of the middle 15 residues of the helix onto the plane perpendicular to the helix; here zero points 180 degrees away from the center point of the protein; positive angles have this hydrophobicity vector rotating counter-clockwise on the plane (top view looking down from the extracellular region). Helical translation is the distance in angstroms that the geometric center of the helix is from the plane of intersection.
Table III - Comparison of structural features of the predicted structure for Mouse I7 with the x-ray crystallography results for Bovine Rhodopsin. These numbers are derived by comparing the predicted numbers for the M-I7 structure with the values in Table II for bovine rhodopsin. Here the difference is (M-I7 minus bovine rhodopsin). The numbers from bovine rhodopsin were obtained using the hydrophobic centers (Trabanino 2003, Hall 2003) of each helix to center the plane of intersection and the middle 15 residues about that center.
226
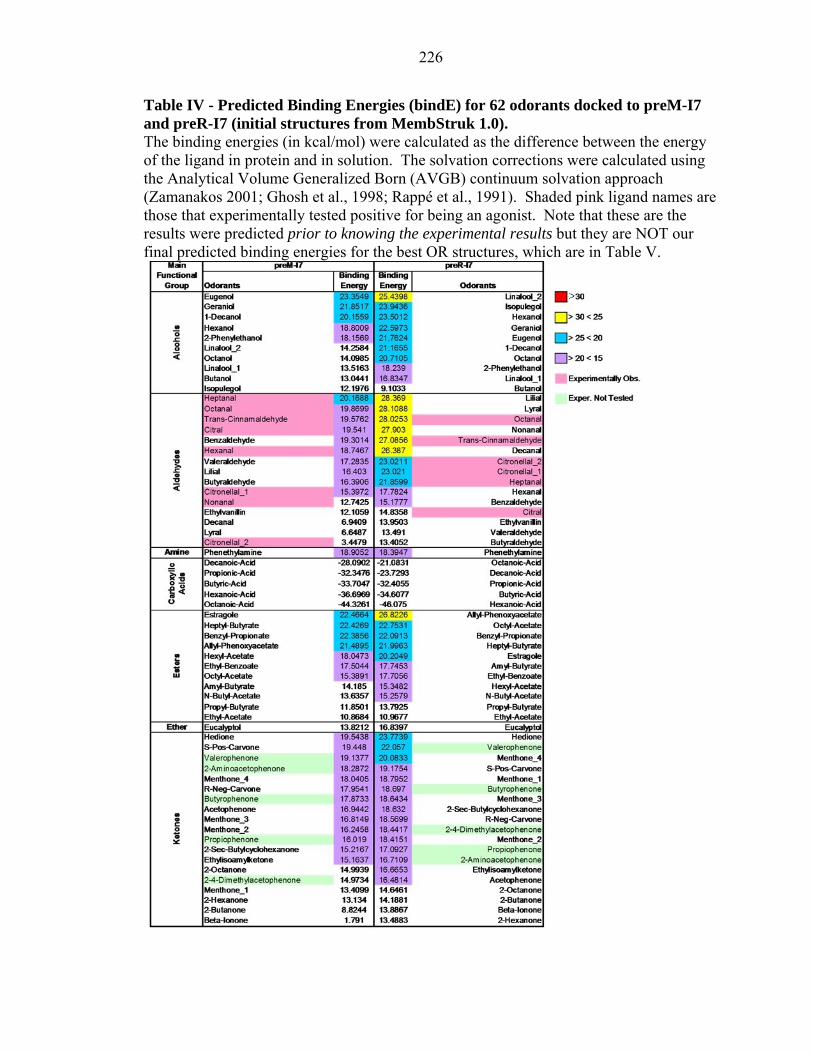
Table IV - Predicted Binding Energies (bindE) for 62 odorants docked to preM-I7 and preR-I7 (initial structures from MembStruk 1.0). The binding energies (in kcal/mol) were calculated as the difference between the energy of the ligand in protein and in solution. The solvation corrections were calculated using the Analytical Volume Generalized Born (AVGB) continuum solvation approach (Zamanakos 2001; Ghosh et al., 1998; Rappé et al., 1991). Shaded pink ligand names are those that experimentally tested positive for being an agonist. Note that these are the results were predicted prior to knowing the experimental results but they are NOT our final predicted binding energies for the best OR structures, which are in Table V.
227
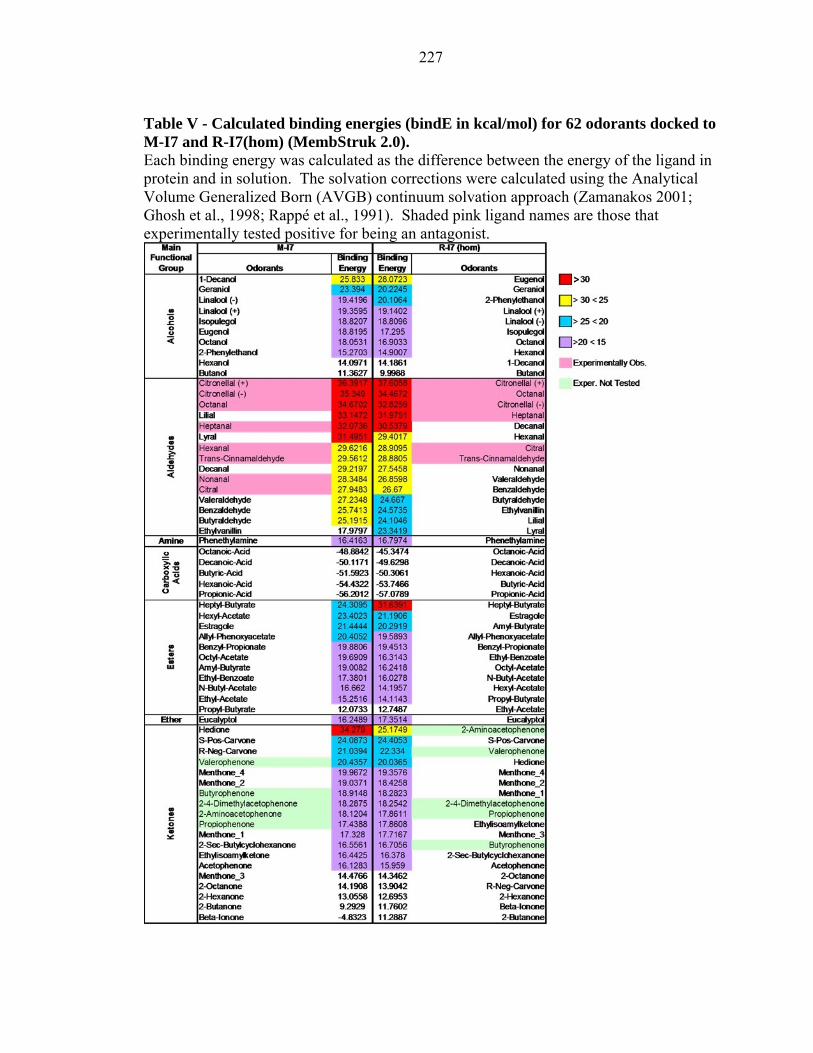
Table V - Calculated binding energies (bindE in kcal/mol) for 62 odorants docked to M-I7 and R-I7(hom) (MembStruk 2.0). Each binding energy was calculated as the difference between the energy of the ligand in protein and in solution. The solvation corrections were calculated using the Analytical Volume Generalized Born (AVGB) continuum solvation approach (Zamanakos 2001; Ghosh et al., 1998; Rappé et al., 1991). Shaded pink ligand names are those that experimentally tested positive for being an antagonist.
228
Table VI - M-I7 Binding Pocket Analysis For M-I7, we show the distance in Å from the closest non-hydrogen sidechain atom in each residue to the closest non-hydrogen atom found in the final binding location of each of the ligands. The ligands shown are those that were experimentally positive or false positives. Those without numbers were too far to be in the binding pocket. Those residues that are hydrogen bonded to the odorant have their distances shown in red.
Table VII - R-I7(hom) binding Pocket Analysis For R-I7(hom) we show the distance in Å from the closest non-hydrogen sidechain atom in each residue to the closest non-hydrogen atom found in the final binding location of each of the ligands. The ligands shown are those that were experimentally positive or false positives. Those without numbers were too far to be in the binding pocket. Those residues that are hydrogen bonded to the odorant are showing their distances in red.
229
Table VIII - Comparison of R-I7(hom) and M-I7 Binding Pockets Shown is the difference in each distance from table VII minus the corresponding one from table VI. The numbers in blue represent the residues that are closer to the ligand in R-I7(hom) than to M-I7. The numbers in red represent the residues that are closer to the ligand in M-I7 than to R-I7(hom). The letter ‘M’ represents a residue that is within 3.5 angstroms to the ligand in the M-I7 structure but not in the R-I7(hom), and the letter ‘R’ represents a residue that is within 3.5 angstroms to the ligand in R-I7(hom) but not in M-I7. The distance 3.5 angstroms is used to filter out all non-significant interactions in the binding pocket.
Table IX - The principle moments of inertia for the final bound structure of each aldehyde in the M-I7 structure. Those aldehydes marked in pink are positive agonists as found experimentally (Bozza et. al. 2002). The aldehydes are sorted by the weighted energy score from equation (2). Note that subsequent experiments (Bozza, private communication) found that decanal also binds experimentally.
230
Table X - Calculated Moment-weighted energy score from equation (2) for the 62 odorants docked to M-I7 and R-I7(hom) (MembStruk 2.0). Shaded pink are those ligand names that experimentally tested positive for being an antagonist. Note that subsequent experiments (Bozza, private communication) found that decanal also binds experimentally to M-I7, and from the literature decanal and nonanal bind to I7 rat.
231
I7 FIGURES Figure 1 - Sequence alignment for I7 Mouse and Rat The sequence alignments of I7 Mouse and I7 Rat where (I) is for intracellular loops and (E) is for extracellular loops. Residues that are different in M-I7 and R-I7 are highlighted in red. The residues within 3.5 Å of the ligands on the final improved models are highlighted in purple. For M-I7 and R-I7, there are no sequence differences in the binding region. Based on alignment studies, Krautwurst et al. (1998), had suggested that residue 206 (Ile for M-I7 and Val for R-I7) is involved in binding; however our predicted 3D structure puts this residue far from the binding pocket.
232
Figure 2 - Comparison of I7 Mouse and Rat Structures Shown is the top view (looking down from the extracellular region) of the alignment of structures M-I7 and R-I7(hom) on the plane of intersection through their centers of hydrophobicity. The center point is the center of mass of both structures, and the circles represent the distance of the helix from the plane (a thicker circle is upwards towards the extracellular region). The arrows represent the hydrophobic moment of the helices.
233
Figure 3 - Comparison of I7 Mouse with Bovine Rhodopsin (1F88) Shown is the alignment of the M-I7 structure with bovine rhodopsin on a plane of intersection from a top view (looking down from the extracellular region). The center point is the center of mass of both structures, and the circles represent the helices distance from the plane (a thicker circle is upwards towards the extracellular region). The arrows represent the hydrophobic moment of the helices.
234
Figure 4 A and B - Predicted 3D structure for M-I7 OR This includes the predicted binding location for octanal (purple). Transmembrane domains with residues involved in binding: 3, 4, and 6 are labeled. The disulfide bonds were assigned between Cys102-Cys184 and Cys174-Cys194.
235
Figure 5 A and B - Predicted structure for R-I7(hom) OR This includes the predicted binding location for octanal (purple). Transmembrane domains with residues involved in binding: 3, 4, and 6 are labeled. The disulfide bonds were assigned between Cys102-Cys184 and Cys174-Cys194.
236
Figure 6 - Predicted recognition site for octanal in M-I7 OR (bottom view, looking up from the intracellular region). Residues within 3.5 Å of the ligand are displayed as thicker with labels in bold font. Lys164 forms a hydrogen bond to the oxygen of the aldehyde. Transmembrane (TM) domains 3-7 have residues directly involved in binding.
237
Figure 7 - Predicted recognition site for octanal in R-I7(hom) OR (bottom view). Residues within 3.5 Å of the ligand are displayed as thicker with labels in bold font. Lys164 forms a hydrogen bond to the oxygen of the aldehyde. Transmembrane (TM) domains 3-7 have residues directly involved in binding.
238
Figure 8 - Predicted recognition site for citral, nonanal, and trans-cinnamaldehyde in M-I7 Predicted recognition site for citral (yellow), nonanal (lime), and trans-cinnamaldehyde (orange) in M-I7 (side view, looking along a plane cutting the membrane region). Residues within 3.5 Å of the ligand are shown.
239
Figure 9 - Predicted recognition site for decanal (purple) in M-I7 OR (side view). Residues within 3.5 Å of the ligand are shown, and you can see the twisting of the decanal in the binding pocket.
240
Figure 10 - Predicted recognition site for lilial (purple) in M-I7 OR (side view). Residues within 3.5 Å of the ligand are shown, and octanal (blue) to show how lilial binds vertically in the protein.
241
Figure 11 - Predicted recognition site for lyral (purple) in M-I7 OR (side view). Residues within 3.5 Å of the ligand are shown.
242
Figure 12 A and B - Location of lowest binding energy on moments of inertia. This figure consists of A) a contour map and B) a wireframe map of the binding energy versus the two smaller moments of inertia from the data in Table VIII. The two smaller moments of inertia are the x and y-axis and the binding energy is the z-axis. The positive agonists tend to have Ix (first moment) between 36 and 200 and Iy (2nd moment) = 650 to 2050. This is shown as a rectangle. In contrast the false positives lyral and lilial have Ix, Iy = 439.9, 2397.6 and 383.3, 2066.6 respectively. This is shown as two large x’s.
243
Figure 13 - Binding pocket of odorants in M-I7, top view (looking down from the extracellular region). The three residues (Cys 117, Lys 164, Ser 280) that can form possible hydrogen bonds to a ligand are shown with their distances. Also shown are residues 205 and 109 that limit the width of the binding pocket. This pharmacaphore model has been used to derive new odorants that can be potential agonists for M-I7 receptor. These are described briefly in the text.


![Untitled-1 [insurem.com.mx]insurem.com.mx/MercadoLibre/Catalogo HardWare.pdfintel CORE i7 intel CORE i7 intel CORE i7 intel CORE i7 inter CORE inside inter CORE inside inter CORE inside](https://img.pdfslide.us/doc/110x75/5ea5f42d3dcb49308f6ef996/untitled-1-hardwarepdf-intel-core-i7-intel-core-i7-intel-core-i7-intel-core.jpg)