Embed Size (px)
Citation preview

89
CHAPTER 4
PATENTS IN CHEMICAL SCIENCES
A country without a patent office and good patent law is just a crab and cannot travel
any way but sideways and backwards.
-Mark Twain
CHAPTER 4
PATENTS IN CHEMICAL SCIENCES 89-122
4.1 Chemical sciences: an overview 90
4.2 Progress of chemical industries in Germany, UK, USA and
India: A brief outline
93
4.3 The chemical industry 94
4.4 Growth of patents in general 95
4.5 Importance of patent literature in chemical sciences 104
4.6 Growth of patents in chemical sciences 105
4.7 Patent trends in scientific area 119
References 121

90
Chapter 4: Patents in Chemical Sciences
Man‟s quest for knowledge has led to creation and accumulation of tremendous amount
of information. It has continued since the dawn of civilization to present days. Thus,
developed knowledge and information over a period of time is valuable for entire
mankind and therefore liable to be preserved. With the invention of paper man has been
able to communicate this knowledge to others by writing in various forms and formats.
4.1 Chemical Sciences: An Overview
The word chemistry comes from the earlier study of alchemy (Wikipedia,
http://en.wikipedia.org/wiki/History_of_chemistry), which is basically a quest to make
gold from earthen starting materials. In the course of time, an alchemist was called a
'chemist' in popular speech, and later „-ry‟ was suffixed to „chemist‟ to describe the art
of „chemistry‟. Chemistry is now understood as the science of matter from atomic to
molecular scale and underpins virtually all other aspects of science. Chemistry controls
tastes and flavors of the world which appears around us in all perspectives. Chemical
behavior and interaction of elements and molecules gives the energy needed to heat
homes, to drive cars and to power our lives. This chemical behavior governs the
distribution of natural resources that are needed and industrial processes required to
extract them. In turn, man relies on chemistry to turn them into products. Chemical
sciences cover both chemistry in its traditional form, and also chemistry that falls within
other disciplines of science.
Chemistry (from Egyptian kēme (chem), meaning „earth‟) is the science concerned with
composition, structure, and properties of matter, as well as changes it undergoes during
chemical reactions. Historically, modern chemistry evolved out of alchemy following
the chemical revolution (1773). Chemistry is a physical science related to studies of
various atoms, molecules, crystals and other aggregates of matter, whether in isolation
or combination, which incorporates the concepts of energy and entropy in relation to the
spontaneity of chemical processes.

91
The definition of chemistry invariably changed gradually from time to time, as new
discoveries and theories added to the functionality of science. Some of the standard
definitions used by various chemists are:
Alchemy (330) – the study of the composition of waters, movement, growth,
embodying, disembodying, drawing the spirits from bodies and bonding the spirits
within bodies
Chymistry (1661) – the subject of the material principles of mixt bodies
Chymistry (1663) – a scientific art, by which one learns to dissolve bodies, and draw
from them the different substances on their composition, and how to unite them again,
and exalt them to an higher perfection
Chemistry (1730) – the art of resolving mix, compound, or aggregate bodies into their
principles; and of composing such bodies from those principles
Chemistry (1837) – the science concerned with the laws and effects of molecular
forces
Chemistry (1947) – the science of substances: their structure, their properties, and the
reactions that change them into other substances
Chemistry (1998) – the study of matter and the changes it undergoes.
Disciplines within chemistry are traditionally grouped by the type of matter being
studied or the kind of study. These include inorganic chemistry, the study of inorganic
matter; biochemistry, the study of substances found in biological organisms; physical
chemistry, the energy-related studies of chemical systems at macro, molecular and sub
molecular scales; analytical chemistry, the analysis of material samples to gain an
understanding of their chemical composition and structure. Many more specialized
disciplines have emerged in recent years, e.g. neurochemistry, the chemical study of the
nervous system, Nanotechnology, Stem cells etc.
4.1.1 Subdivisions of Chemistry:
Chemistry is typically divided into several major sub-disciplines. There are also several
main cross-disciplinary and more specialized fields of chemistry.

92
1) Analytical Chemistry : analysis of materials to find chemical composition and
structure
2) Biochemistry: study of chemicals and chemical reactions taking place in living
organisms. Medicinal chemistry, neurochemistry, molecular biology, genetics are
the related divisions.
3) Inorganic Chemistry: relates to study of properties and reactions of inorganic
compounds
4) Materials Chemistry: preparation, characterization, and understanding of substances
with useful functions those are unique to materials and chemistry of condensed
phases.
5) Nuclear Chemistry: study of subatomic particles coming together and making
nuclei.
6) Organic Chemistry: study of the structure, properties, composition, mechanisms,
and reactions of organic compounds. An organic compound is defined as any
compound based on a carbon skeleton.
7) Physical Chemistry: study of the physical and fundamental basis of chemical
systems and processes. In particular, the energetic and dynamics of such systems
and processes are of interest to physical chemists. The study includes chemical
thermodynamics, chemical kinetics, electrochemistry, statistical mechanics, and
spectroscopy. Physical chemistry has large overlap with molecular physics.
8) Theoretical Chemistry: study of chemistry via fundamental theoretical reasoning, in
particular the application of quantum mechanics to chemistry is called quantum
chemistry.
9) Computational Chemistry: the development of computers has allowed a systematic
development of computational chemistry, which is the art of developing and
applying computer programs for solving chemical problems.
Other fields in chemical sciences include astrochemistry, atmospheric chemistry,
chemical engineering, chemical biology, chemo-informatics, electrochemistry,
environmental chemistry, flavor chemistry, flow chemistry, geochemistry, green
chemistry, histochemistry, hydrogenation chemistry, materials science, mathematical

93
chemistry, medicinal chemistry, molecular biology, nanotechnology, natural product
chemistry, oenology, organometallic chemistry, petrochemistry, pharmacology,
photochemistry, phytochemistry, polymer chemistry, solid-state chemistry,
sonochemistry, supramolecular chemistry, surface chemistry, synthetic chemistry,
immunochemistry and thermochemistry.
4.2 Progress of Chemical Industries in Germany, UK, USA & India: A Brief
Outline
4.2.1 German Industry: Germans were very quick in development of chemical
industry. The dyestuff industry taken shape in pre war period in Germany. This
followed the development of drug industry, perfumery, explosives etc. Germany was
the sole country and having monopoly in fine chemicals till World War II.
4.2.2 British Industry: GB had to develop its own industry for various reasons like cut
off from the German supply during World War I, prevalence of disease, shortage of
food, etc. This created an interest in developing chemical industry in GB.
4.2.3 American Industry: The stoppage of supply from Germany made America to
develop its own Chemical Industry. The attempts made by Prof Derick, C.G. and Prof
Roger Adams of University Illinois made efforts in developing chemical industry.
Eastman Kodak Developed “Department of Synthetic Chemistry” and developed 150
chemicals and today they have more than 3000 useful chemicals. Today America is the
biggest chemical manufacturer in the world. The industries like DuPont, Monsanto
Chemicals, Carbon & Carbide Corporation, Dow Chemical, and many others form the
major units in the American chemical industry.
4.2.4 Indian Industry: In India many chemicals like alum, nitre and saltpeter were
manufactured from ancient times. Earlier days in India, dyestuffs, coloring matters,
crude drugs, medicines, extraction of essence, were prepared but in an unorganisized
fashion. After World War I the development of chemical industry in India took shape
towards development. In 1921 about 14 large chemical industries were in India and by
1939 rose to 38, however the development leads to 517 industries in 1945. Fine

94
chemical industries developed very well in India after World War and Independence.
IISc Bangalore established for conducting research in the field of chemistry. Later
various efforts at University teaching level, establishment of research Laboratories, R
and D organizations made progress in chemical industry and the growth was 13.2% in
India during 1976 to 77 as indicated by Sukh Dev (1979). Since India had internal
market, the growth of chemical industry was immense.
Thus, fine chemical industries were developed everywhere covering inorganic
chemicals, organic chemicals and chemicals through biological processes by the end of
1950‟s.
4.3 The Chemical Industry:
The chemical industry comprises of companies that produce industrial chemicals.
Chemical industry is central to modern world economy, converting raw materials (oil,
natural gas, air, water, metals, and minerals) into more than 70,000 different products.
Innovative processes and products are patented by these companies to maintain
monopoly. Chemicals are used to make a wide variety of consumer goods, as well as
thousands of inputs to agriculture, manufacturing, construction, and service industries.
The chemical industry itself consumes 26% of its own output. Major industrial
customers include rubber and plastic products, textiles, apparel, petroleum refining,
pulp and paper, and primary metals. Chemical industry is nearly a $3 trillion global
enterprise, and the EU and US chemical companies are the world's largest producers.(
Wikipedia, http://en.wikipedia.org/wiki/Chemical_industry) The Chemical industry is
grouped into four categories i.e. basic chemical industries, life sciences based chemical
industries, speciality chemical industries, consumer product industry.
Basic Chemicals: Basic chemicals or „commodity chemicals‟ are a broad chemical
category including polymers, bulk petrochemicals and intermediates, other derivatives
and basic industrials, inorganic chemicals, and fertilizers.

95
Life Science Chemicals: These include differentiated chemical and biological
substances, pharmaceuticals, diagnostics, animal health products, vitamins, and crop
protection chemicals.
Speciality Chemicals or Fine Chemicals: These covers relatively high valued, rapidly
growing chemicals with diverse end product markets. Products include electronic
chemicals, industrial gases, adhesives and sealants as well as coatings, industrial and
institutional cleaning chemicals, and catalysts. Specialty Chemicals are referred to as
„fine chemicals‟.
Consumer Products: This includes direct product sale of chemicals such as soaps,
detergents, and cosmetics.
The largest corporate producers worldwide, with plants in various countries, are BASF,
Dow, Degussa, Eastman Chemical Company, Shell, Bayer, INEOS, ExxonMobil,
DuPont, SABIC, Braskem and Mitsubishi, along with thousands of smaller firms.
The chemical industry has shown rapid growth for more than fifty years. The fastest
growing areas have been in manufacture of synthetic organic chemicals and polymers.
Historically and presently, the chemical industry has been concentrated in three areas of
the world, Western Europe, North America and Japan (the Triad). The European
Community remains the largest producer followed by USA and Japan. The growth in
China, India, Korea, the Middle East, South East Asia, etc. has been instrumental in the
changing structure of the global chemical industry.
Although the pharmaceutical industry is often considered a chemical industry, it has
many different characteristics that put it in a separate category. Other closely related
industries include petroleum, glass, paint, ink, sealant, adhesive, and food processing
manufacturers.
4.4 Growth of Patents in General:
The chemical industry is always contributing to development of new areas and
processes. The research in chemical sciences is continuous and reported through various
96
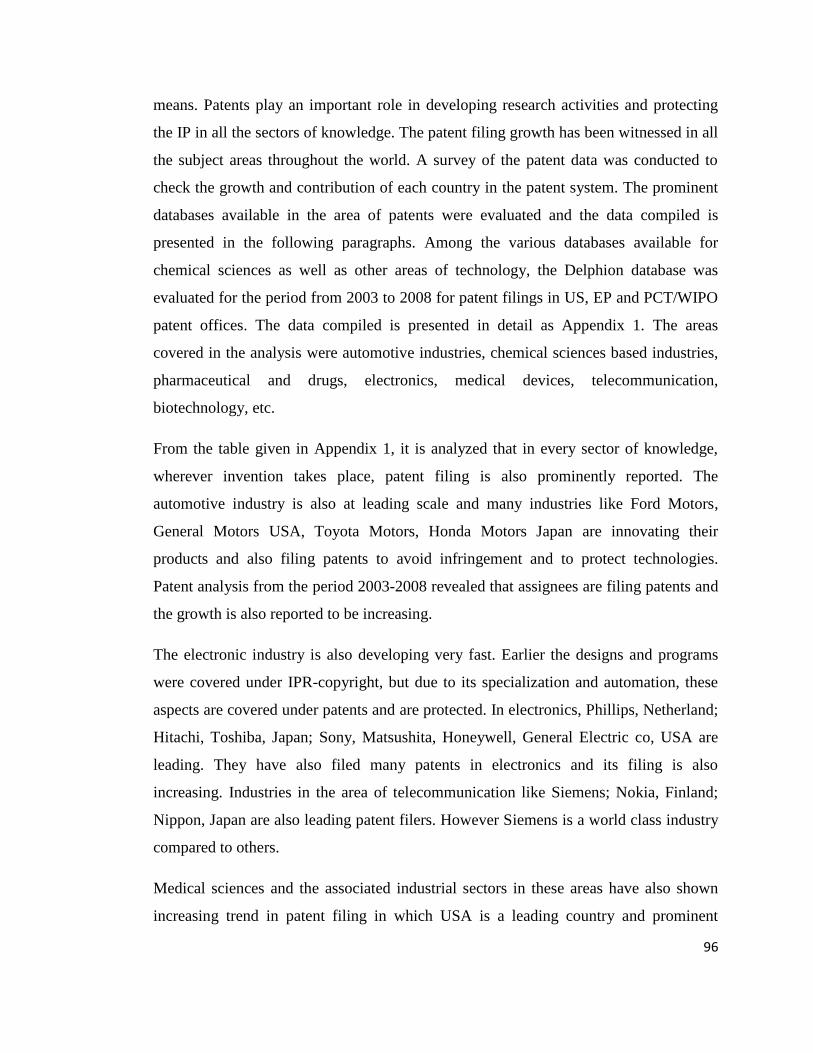
means. Patents play an important role in developing research activities and protecting
the IP in all the sectors of knowledge. The patent filing growth has been witnessed in all
the subject areas throughout the world. A survey of the patent data was conducted to
check the growth and contribution of each country in the patent system. The prominent
databases available in the area of patents were evaluated and the data compiled is
presented in the following paragraphs. Among the various databases available for
chemical sciences as well as other areas of technology, the Delphion database was
evaluated for the period from 2003 to 2008 for patent filings in US, EP and PCT/WIPO
patent offices. The data compiled is presented in detail as Appendix 1. The areas
covered in the analysis were automotive industries, chemical sciences based industries,
pharmaceutical and drugs, electronics, medical devices, telecommunication,
biotechnology, etc.
From the table given in Appendix 1, it is analyzed that in every sector of knowledge,
wherever invention takes place, patent filing is also prominently reported. The
automotive industry is also at leading scale and many industries like Ford Motors,
General Motors USA, Toyota Motors, Honda Motors Japan are innovating their
products and also filing patents to avoid infringement and to protect technologies.
Patent analysis from the period 2003-2008 revealed that assignees are filing patents and
the growth is also reported to be increasing.
The electronic industry is also developing very fast. Earlier the designs and programs
were covered under IPR-copyright, but due to its specialization and automation, these
aspects are covered under patents and are protected. In electronics, Phillips, Netherland;
Hitachi, Toshiba, Japan; Sony, Matsushita, Honeywell, General Electric co, USA are
leading. They have also filed many patents in electronics and its filing is also
increasing. Industries in the area of telecommunication like Siemens; Nokia, Finland;
Nippon, Japan are also leading patent filers. However Siemens is a world class industry
compared to others.
Medical sciences and the associated industrial sectors in these areas have also shown
increasing trend in patent filing in which USA is a leading country and prominent

97
industries are Boston Scientific, Stryker Corp, Medtronics, etc. In various studies, it is
reflected that there is a continuous growth in patent filing in all sectors.
The growth is prominent among scientific disciplines like biotechnology, environmental
sciences, chemical, pharmaceutical and drug sciences. These types of industries are
mainly concerned with consumer products. The growth in chemical, pharmaceutical
sciences is more as compared to other industries as it has a prominent place in human
life. The industrial growth and patent filing growth is continuous in this area as new
innovative products, preparation, properties or uses are brought to the notice via patents.
In chemical sciences, almost all countries are filing patents but considering the output in
the form of patent filing, few countries like USA, UK, Germany, Japan, China, France
and Korea are leading. It is noticed that major industries file more than 500-600 patents
in a year. eg Bayer Germany, Dupont USA, etc. Thus, this study and analysis indicate
the global increase in patent filing numbers irrespective of subject discipline.
Patent filings from USPTO Patent Office (database) were analyzed to check the overall
growth. The data of the USPTO for filing patents during the period 1790 to 1976 are
reported below.
Table 4.1 Growth of Patents in USPTO (1790-1976)
Year Patents filed
for the
Invention
Year Patents filed
for the
Invention
1790 03 1865 6088
1795 12 1870 12137
1800 41 1880 12903
1805 57 1890 25313
1810 223 1900 24644

98
Year Patents filed
for the
Invention
Year Patents filed
for the
Invention
1815 173 1910 35141
1820 155 1920 37060
1825 304 1930 45226
1830 544 1940 42238
1835 752 1950 43040
1840 458 1960 47170
1845 473 1970 64427
1850 883 1972 74808
1855 1881 1974 76275
1860 4357 1976 70236
(Source: US Bureau of Census (1970-1977): Historical Statistics of United States
Colonial times to 1970 (1975) and US Bureau of the Census Statistical Abstracts of
United States 1977 (98th
edition 1977). Washington: GPO.)
This indicates steady and constant growth in patent filing noticed in USA since its
inception. Similarly, the present growth in patent filings at USPTO is also indicating
rise and from 2005 to 2008 voluminous growth has been reported.
PCT (WIPO) reported number of patents filed in different countries and based on this
data they have reported top 15 countries, of the world, which are at leading position in
patent filings. The data is presented in the following table.

99
Table 4.2 PCT International Applications (2003-2007) filed by leading countries.
Country 2003 2004 2005 2006 2007
estimate
2007
percent
2007
growth
United States of
America (US)
41030 43350 46803 50941 52280 33.5% 2.6%
Japan (JP) 17414 20264 24869 27033 27731 17.8% 2.6%
Germany (DE) 14662 15214 15984 16732 18134 11.6% 8.4%
Republic of Korea
(KR)
2949 3558 4688 5944 7061 4.5% 18.8%
France (FR) 5171 5184 5748 6242 6370 4.1% 2.1%
United Kingdom
(GB)
5206 5027 5084 5090 5553 3.6% 9.1%
China (CN) 1295 1706 2503 3951 5456 3.5% 38.1%
Netherlands (NL) 4479 4284 4500 4529 4186 2.7% -7.6%
Switzerland (CS) 2861 2898 3290 3577 3674 2.4% 2.7%
Sweden (CH) 2612 2851 2883 3316 3533 2.3% 6.5%
Italy (IT) 2163 2189 2349 2716 2927 1.9% 7.8%
Canada (CA) 2271 2104 2318 2566 2707 1.7% 5.5%
Australia (AU) 1680 1837 1996 2001 2054 1.3% 2.6%
Finland (FI) 1557 1672 1893 1845 1952 1.3% 5.8%
Israel (IL) 1129 1227 1454 1589 1683 1.1% 5.9%
All Others 8715 9245 10326 11084 10800 6.9% -2.6%
Total 115194 122610 136688 149156 156100 4.7%
(Source: WIPO/PCT patent filings in 2007, Geneva, February 21, 2008,
(Unprecedented Number of International PR/2008/536))

100
The analyzed data indicates growth of patents filed in different countries from the
period 2003-2007 and reports that every year there is an increase in global patent
filings. However USA, Japan, Germany, China, Korea are leading countries & France,
UK, Netherlands, Italy, Canada, Australia are next in line.
PCT (WIPO) data is also analyzed based on technological area in which patent
applications are being filed and the data is presented in the following table:
Table 4.3 Main fields of technology in which PCT applications were published (2003-
2007)
Technical Field 2003 2004 2005 2006 2007 Increase
Compared
with 2006
I Electricity - Electronics
1 Electrical devices,
electrical engineering,
electrical energy
7365 7568 8768 10069 11035 9.6%
2 Audio-visual technology 6057 6074 6713 7453 7759 4.1%
3 Telecommunications 10821 10441 11670 13634 15751 15.5%
4 Information technology 9917 9531 10992 13791 15109 9.6%
II Instruments
5 Semiconductors 4051 4109 4719 6111 6587 7.8%
6 Optics 2616 2563 3215 5898 5960 1.1%
7 Analysis, measurement,
control technology 11447 10869 11867 13225 13531 2.3%
8 Medical technology 8600 8877 9554 11249 11890 5.7%
9 Nuclear engineering 517 496 499 572 712 24.5%

101
Technical Field 2003 2004 2005 2006 2007 Increase
Compared
with 2006
III Chemicals - Materials
10 Organic fine chemistry 5225 5652 6112 6512 6082 -6.6%
11 Macromolecular chemistry,
polymers 3984 4002 4532 5904 5946 0.7%
12 Chemical engineering 3879 3702 4266 5680 5863 3.2%
13 Surface technology,
coating 3293 3326 3642 4361 4247 -2.6%
14 Materials, metallurgy 3037 3031 3252 3836 4045 5.4%
IV Pharmaceuticals -
Biotechnology
15 Biotechnology 8604 7609 7312 7413 7228 -2.5%
16 Pharmaceuticals, cosmetics 9976 9436 11090 13920 13936 0.1%
17 Agriculture and food 1660 1840 1949 2336 2309 -1.2%
V Process engineering
18 Industrial processes 5365 4909 4911 5010 5295 5.7%
19 Handling, printing 4540 4555 5401 6234 6261 0.4%
20 Agricultural and food
processing, machinery and
apparatus
1274 1334 1521 1504 1478 -1.7%
21 Materials processing,
textiles, paper 4780 4285 4763 5484 5312 -3.1%
22 Environmental technology 1314 1249 1380 1585 1780 12.3%

102
Technical Field 2003 2004 2005 2006 2007 Increase
Compared
with 2006
VI Machinery - Mechanics -
Transport
23 Machine tools 2485 2323 2773 3009 3132 4.1%
24 Engines, pumps, turbines 2820 2975 3205 3700 4170 12.7%
25 Thermal processes and
apparatus 1580 1542 1825 2062 2297 11.4%
26 Mechanical Components 3567 3720 4108 4748 5084 7.1%
27 Transport 4597 4883 5542 6078 6696 10.2%
28 Space technology and
weapons 494 436 536 513 507 -1.2%
VII Consumer goods - Civil
engineering
29 Consumer goods and
equipment 5757 6040 7228 8310 8629 3.8%
30 Civil engineering, building,
mining 3461 3847 3908 4399 4688 6.6%
(Source: WIPO/PCT patent filings in 2007, Geneva, February 21, 2008,
(Unprecedented Number of International PR/2008/536))
From the study of the patent filings at PCT by different countries in different
technological areas, it is noticed that all sectors of knowledge have shown growth in
patent filing. However, electronic, telecommunication, IT, medical technology,
chemicals and pharmaceuticals, nuclear energy, machinery and equipments are in front
line technologies during 2007.
The data presented by USPTO is analyzed and the patent filings by major countries are
reported in the following table. The data is evaluated for the period from 1993 to 2006.

103
Table 4.4 USPTO patent filings in different countries during 1993 to 2006
(Source: USPTO Data 2007)
Fig. 4.1 USPTO patent filings in different countries during 1993 to 2006
104
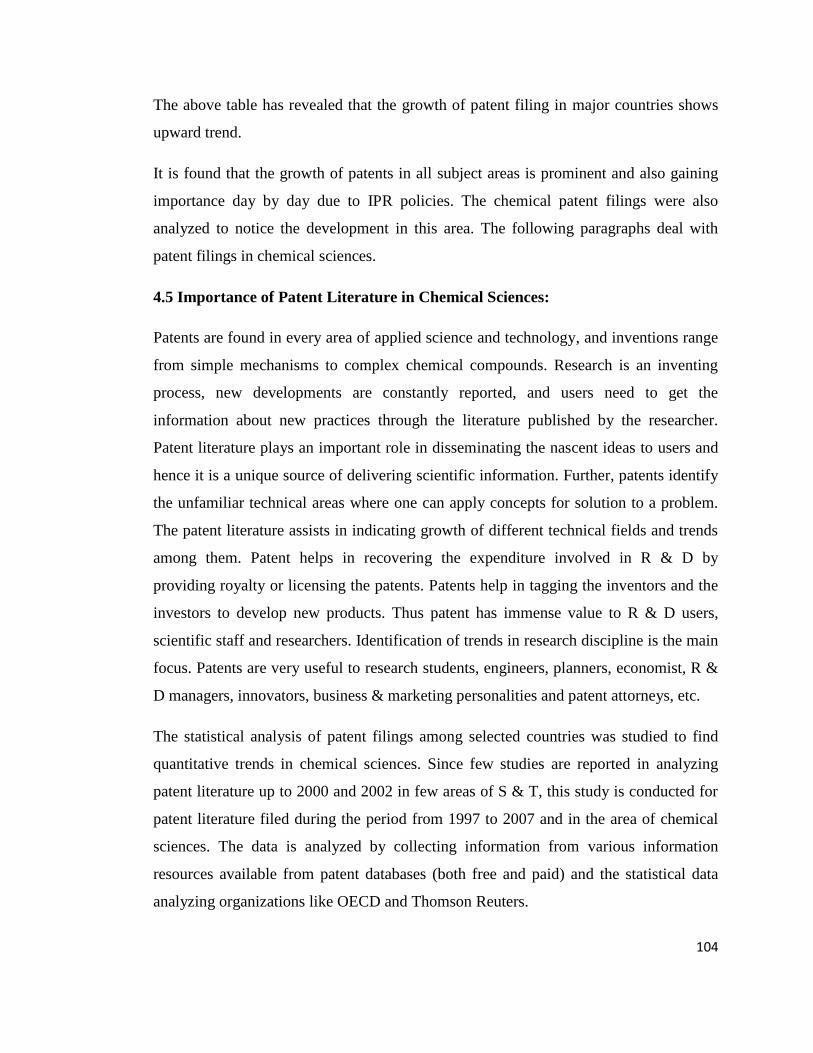
The above table has revealed that the growth of patent filing in major countries shows
upward trend.
It is found that the growth of patents in all subject areas is prominent and also gaining
importance day by day due to IPR policies. The chemical patent filings were also
analyzed to notice the development in this area. The following paragraphs deal with
patent filings in chemical sciences.
4.5 Importance of Patent Literature in Chemical Sciences:
Patents are found in every area of applied science and technology, and inventions range
from simple mechanisms to complex chemical compounds. Research is an inventing
process, new developments are constantly reported, and users need to get the
information about new practices through the literature published by the researcher.
Patent literature plays an important role in disseminating the nascent ideas to users and
hence it is a unique source of delivering scientific information. Further, patents identify
the unfamiliar technical areas where one can apply concepts for solution to a problem.
The patent literature assists in indicating growth of different technical fields and trends
among them. Patent helps in recovering the expenditure involved in R & D by
providing royalty or licensing the patents. Patents help in tagging the inventors and the
investors to develop new products. Thus patent has immense value to R & D users,
scientific staff and researchers. Identification of trends in research discipline is the main
focus. Patents are very useful to research students, engineers, planners, economist, R &
D managers, innovators, business & marketing personalities and patent attorneys, etc.
The statistical analysis of patent filings among selected countries was studied to find
quantitative trends in chemical sciences. Since few studies are reported in analyzing
patent literature up to 2000 and 2002 in few areas of S & T, this study is conducted for
patent literature filed during the period from 1997 to 2007 and in the area of chemical
sciences. The data is analyzed by collecting information from various information
resources available from patent databases (both free and paid) and the statistical data
analyzing organizations like OECD and Thomson Reuters.

105
The overall analysis of patent filing has indicated that there is an increase in all the
areas of knowledge and the chemical industries are also in leading position and the
patent filing trend is progressive.
4.6 Growth of patents in Chemical Sciences:
CAS/ACS is the main source for evaluation of growth in chemical sciences. CAS
publishes abstracts from scientific literature published throughout the world in the area
of chemical sciences from 1907. The historical development of abstracts covered from
1907-2007 is one of the pointers used for finding the developments in patent filing.
Hence, CAS information resources were consulted and data of abstracted literature was
collected for analysis purpose.
The statistical data recorded by CAS, regarding chemical patent publications, abstracted
in CA, reported during the period 1988 to 2007 are as under
Table 4.5 Year wise patent growth of chemical patents
Year Patents Increased by % Increase
% Increase
with
respect to
1988
1988 80795 - - -
1989 88099 7304 8.29 9.04
1990 91082 10287 11.29 12.73
1991 95526 14731 15.42 18.23
1992 98505 17710 17.97 21.91
1993 99411 18616 18.72 23.04
1994 107226 26431 24.64 32.71
1995 121214 40419 33.34 50.02
1996 121682 40887 33.60 50.60

106
Year Patents Increased by % Increase
% Increase
with
respect to
1988
1997 125883 45664 36.27 55.80
1998 117815 37020 31.42 45.81
1999 125393 44598 35.56 55.19
2000 146590 65795 44.88 81.43
2001 144498 63703 44.08 78.84
2002 167882 87087 51.87 107.78
2003 164344 83549 50.83 103.40
2004 173669 92874 53.47 114.95
2005 244575 163780 66.96 202.71
2006 248247 167452 67.45 207.25
2007 265637 184842 69.58 228.77
(Source: CAS statistical summary 2007.)
Fig 4.2 Year wise patent growth of chemical patents

107
The statistical analysis pointed out that the abstracted information in chemical sciences
is increasing every year. The growth in patent applications is reported to be 7 to 10 %
every year. From 1907 to 2001 CAS included about 7000000 patents and the rate of
increase per year was more than 50,000 patents per year alone in the area of chemical
sciences. Since 2000 onwards growth is continuous and more than 200000 patents are
filed per year. However the growth of patent literature in chemical sciences is also
prominent from 1988 onwards. In 1988, the growth rose from 9% to 70% in 2007
(cumulative growth is 228.77%).
Toussant (2002) predicted that patent trends in chemical sciences indicated growth.
CAS covers patent literature relevant to chemistry and chemical sciences contributing
43% of total coverage. The other areas contributing in CAS are physics 11%,
electronics 13%, textile 3% and transportation 15%. This indicated that chemical
sciences are at leading position.
However, a comparison between journal articles and patent literature abstracted in CA
from 1907-2007 are grouped in the following table alongwith % growth:
Table 4.6 Chemical Abstracts Publication Data Analysis
Publication
Period
Journal
articles
%Growth
in articles
Patents
Abstracted
% in Patents
abstracted
Avg
growth
1907 to 1918 153917 16.12 62048 5.7 increase 5171
1919 to 1929 224213 165 74662 377 increase 6787
1930 to 1940 437431 24.12 220829 82.6 decrease 20075
1941 to 1952 441309 58.53 131626 40.9 decrease 11966
1953 to 1963 1064178 130 217398 120 increase 19763
1964 to 1974 2435155 69 443366 121 increase 40306
1975 to 1985 3976226 20 723049 25 increase 65731
1986 to 1996 4969588 42 1074526 21 increase 97684
1997 to 2007 7197039 39 1924533 20 increase 174957

108
Fig. 4.3 Chemical Abstracts Publication Data Analysis
(Source: CAS Statistical summary 2008)
From the above table it is noticed that though the average growth is upward, decade
wise performance of the patent growth in chemical sciences is variable e.g. the average
growth during 1907-1929 was 31.25% whereas during 1930-1952 there was decrease in
patent filing by 67.76%. However, during 1953-1974 there was again an increase by
103.94%; during 1975-1996 there was increase in 48.61% and during 1997-2007, the
cumulative growth was 79.10%. This analysis indicates that there is a constant growth
in chemical sciences.
The analysis of patents covered in micropatent database published by Micropatents,
USA (commercial patent database) is evaluated and the data gathered is presented in the
following table. This database mainly covers the US, EP, WO, JP and DE patents form
1991. The patents in chemical sciences and organic chemistry are isolated from the
database using IPC code C07. (C= chemical sciences and C07= organic chemistry)
109
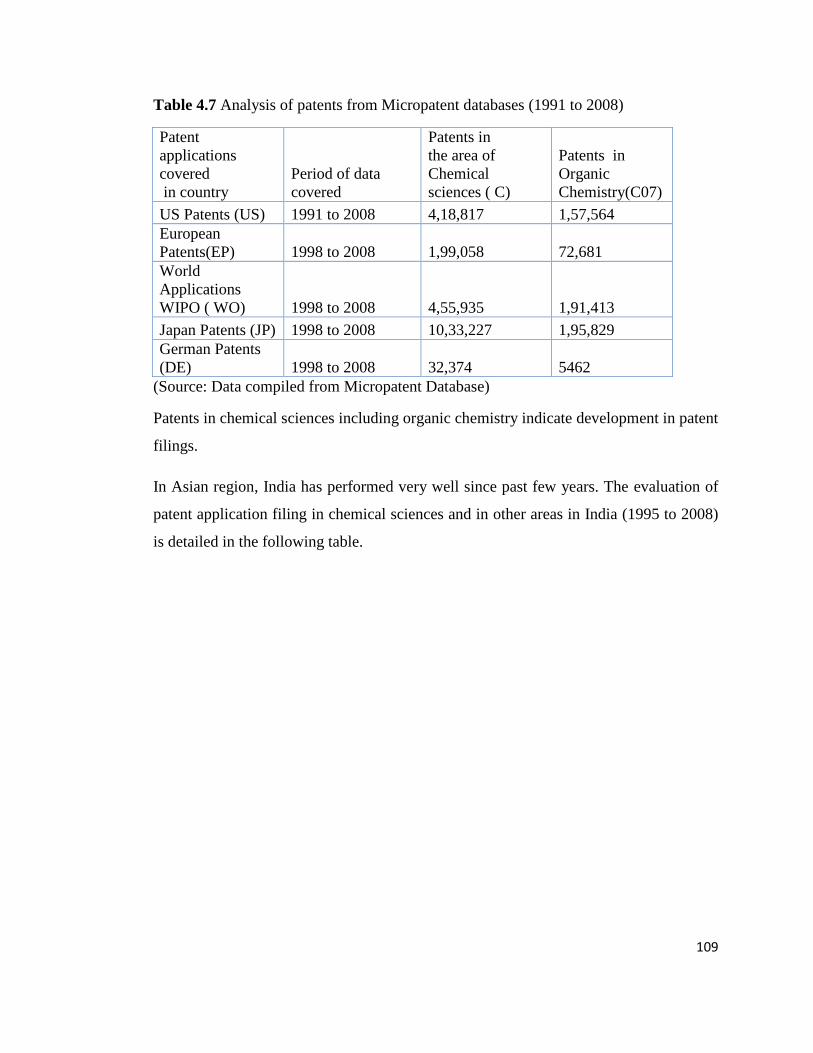
Table 4.7 Analysis of patents from Micropatent databases (1991 to 2008)
Patent
applications
covered
in country
Period of data
covered
Patents in
the area of
Chemical
sciences ( C)
Patents in
Organic
Chemistry(C07)
US Patents (US) 1991 to 2008 4,18,817 1,57,564
European
Patents(EP) 1998 to 2008 1,99,058 72,681
World
Applications
WIPO ( WO) 1998 to 2008 4,55,935 1,91,413
Japan Patents (JP) 1998 to 2008 10,33,227 1,95,829
German Patents
(DE) 1998 to 2008 32,374 5462
(Source: Data compiled from Micropatent Database)
Patents in chemical sciences including organic chemistry indicate development in patent
filings.
In Asian region, India has performed very well since past few years. The evaluation of
patent application filing in chemical sciences and in other areas in India (1995 to 2008)
is detailed in the following table.

110
Table 4.8 Patent applications Filed in various subjects in India during 1995 to 2008
year /
sub
Chemi
cal Sci
Applic
ations
filed
Drugs
Appli
cation
s
filed
Food
sci
appli
catio
ns
filed
Electric
al
Applica
tions
filed
Mechan
ical
Applica
tions
Filed
Com/E
le
applic
ations
filed
Biotec
hnol
Applic
ations
filed
General
Applica
tions
Filed
Total
Applica
tions
Filed
1995-96 1934 1000 104 1131 1599 - - 1268 7036
1996-97 1969 1124 121 1677 1656 - - 2015 8562
1997-98 2221 1481 112 2264 1760 - - 2317 10155
1998-99 2023 1555 140 1778 2125 - - 1333 8954
1999-00 840 1000 107 877 1187 - - 544 4555
2000-01 787 883 96 921 1106 - - 546 4339
2001-02 778 879 110 731 1174 - - 569 4241
2002-03 776 966 119 690 1257 - 46 562 4416
2003-04 2952 2525 123 2125 2717 - 23 2148 12613
2004-05 3916 2316 190 1079 3304 2787 1214 2659 17466
2005-06 5810 2211 101 1274 4734 5700 1525 3150 24505
2006-07 6354 3239 1223 2371 5536 5822 2774 1621 28940
2007-08 6375 4267 233 2210 6424 4842 1950 7110 35218
(Source: Annual Reports (1995-2008) published by Indian Patent Office)

111
Fig. 4.4 Patent applications Filed in various subjects in India during 1995 to 2008
The patents filed in chemical science, drugs, food science are showing steady growth.
This is an indication that the developing countries like India are also leading in
patenting activity due to globalization and collaboration. The growth as compared to
1995-96 (3038) rose by 257.96% in 2007-08 (10875) in these areas.

112
The Delphion patent database is very popular and provides data on patents published in
various countries. The data is compiled from this database on aspects like total patent
filings by all prominent countries of the world covering all sectors of knowledge.
Separate data is also compiled for the patents filed in chemical sciences alone. This data
is compiled using the IPC code i.e “C” for chemical sciences. This data is further
refined for organic chemistry patent coverage using the IPC code “C07”. The chemical
patent filing data is compiled using country code. The data is compiled for a period of
10 years. This database is user-friendly and helps in getting appropriate data, using
different searching elements. The span for the study is covered from 1964 to 2007.
Table 4.9 Chemical sciences patent data analyzed from Delphion Patent database (1964
to 2007)
Country / Year 1964-1976 1977-1986 1987-1996 1997-2007
All
(Complete Knowledge) 4268485 8420041 1150565 19486806
All ( Chemistry) 1056996 1879649 2215849 3545836
Organic chemistry 422077 660885 752574 1244075
INPADOC 302371 477633 423689 683604
USA (US) 60357 56928 71874 114027
European (EP) 0 10655 29639 44487
Japanese (JP) 41733 113158 148242 163735
WIPO (WO) 0 2511 33194 159710
German (DE) 17616 31981 45986 78512
ARIPO (AP) 1 20 621 4746
EAPO (EA) 0 0 18 6746
OAPI (OA) 492 665 632 2621
AT (Austria) 12409 18094 18170 31121

113
Country / Year 1964-1976 1977-1986 1987-1996 1997-2007
AU (Australia) 8017 23803 51681 98818
BE (Belgium) 31234 12236 1033 577
CA (Canada) 6069 21327 38235 71754
CH (Sweden) 22249 13220 1503 247
CN (China) 0 550 14688 98653
CS/CZ (Czech) 3432 11589 10414 11739
DK (Denmark) 9749 25418 22945 16222
ES (Spain) 11948 54042 21956 29033
FI (Finland) 3618 15747 24080 5067
FR (France) 50282 41468 13353 10458
GB (UK) 35736 40368 11145 9680
HU (Hungary) 3007 8067 22333 27873
IN (India) 631 1400 1696 2030
IT (Italy) 3366 13614 6867 3139
KR (Korea) 0 5618 11827 28078
NL (Netherlands) 34342 16891 4512 2955
NZ (New Zealand) 0 4339 9212 11671
PL (Polish) 2571 12606 8289 14952
RO (Romania) 1158 4730 1387 1043
RU / SU (Russia) 8427 15206 10041 16554
ZA (S. Africa) 6859 12984 14318 11888
(Source: Delphion Patent database)

114
Fig. 4.5 Graphical display of the chemical Patent publications in various countries
From the analysis it is noticed that there is a growth in patents as well as patent
databases developed specially for patent literature and it also provides precise

115
information. Since demand for patent information is increasing, the patent databases in
special subject areas are also increasing e.g. Delphion, Micropatent, Dolphin, CAS,
Drugpat. This is a clear indication of patent growth in chemical scienecs all over the
world.
From the USPTO data, it is revealed that patents filed during the period 1790 to 1890
were 4,28,622. But the growth of patent is alarming and during the period 1891 to 2005,
the number of patents published were 64,39,930. (USPTO, 2008). Considering the area
of chemical sciences, the USPTO data was evaluated and the following table describes
the patents filed from 1977 to 1992 (Pre 1993) & 1993 to 2006.
Table 4.10 Chemical patents granted by USPTO for prominent countries (1977 to
2006)
(Source: USPTO, 2007. Technology assessment and forecasting report)

116
Fig. 4.6 Patents granted by USPTO for prominent countries from 1977 to 2006
USPTO grants patents to non residents and prominent countries in this area are listed.
These are top countries among the patent filing countries. Among these, US, Japan,
Germany, UK and France are the leading countries. Korea entered late; still it is listed
among top countries. The patent data filed up to 1993 and from 1993 to 2006 indicated
that in case of USA there is an increase in patent filing and around 36% growth is seen
per year. Similarly in other countries, number of patents filed has almost doubled. The
statistical analysis indicates that the patent filing in chemical sciences is ever increasing.
The data collected form WIPO patent statistics for the patent filings in Chemical
sciences in general are presented in the following table.

117
Table 4.11 Chemical Patent Filings from WIPO (2001 to 2006)
Chemical Sciences 2001 2002 2003 2004 2005 2006
Organic fine
chemistry 64170 64026 59622 59835 63317 63981
Biotechnology 45573 47576 44632 41993 40861 43047
Pharmaceuticals 69355 69160 66050 68650 74254 83521
Macromolecular
chemistry, polymers 41842 38615 36656 36108 38137 37086
Food chemistry 21296 23535 24850 23110 24653 25610
Basic materials
chemistry 51058 48418 46106 45508 48040 49441
Materials,
metallurgy 39882 37451 36813 35579 37705 38988
Surface technology,
coating 41086 39478 39894 41208 42437 41491
Micro-structural and
nano-technology 3425 2770 2994 2967 3357 3332
Chemical
engineering 51319 48148 46306 44906 44845 44580
Environmental
technology 29889 28718 28636 28365 28650 27903
Total Chemistry
Patents 4,58,895 4,47,895 4,32,559 4,28,229 4,46,256 4,58,980
Organic Chemistry
Total 2,05,879 2,05,139 1,96,628 1,97,103 2,10,264 2,22,553
(Source: http://www.wipo.int/ipstats/en/statistics/patents/)
From the analysis of patent filings it is noticed that although chemical sciences are
leading in patent filings, the share of organic chemistry as one of the main components
in chemical sciences is nearly 50%. The remaining 50% is covered by different areas in
chemical sciences like biotechnology, pharmaceuticals, macromolecular chemistry,
polymers, food chemistry, materials chemistry, chemical engineering and
environmental sciences & technology etc. Similarly the data from EPO is also evaluated
from 2005 to 2009 and represented in the following table.

118
Table 4.12 Data from EPO Annual Reports 2005 to 2009
Subject Area IPC Code 2005 2006 2007 2008 2009
Inorganic Chemistry
C01 to
C05 1677 1800 1878 2074 1994
Organic Chemistry C07 7141 8200 8743 9023 8411
Orgnaic Molecular
Compounds C08 3331 3709 3835 4001 3681
Dyes and Petroleum
C09 to
C11 12613 2777 2920 3099 3894
Total 128679 135183 140725 146561 134542
(Source: www.epo.org/annual-reports/2005/statistics.html)
Fig. 4.7 Data from EPO Annual Reports 2005 to 2009
From the data it is revealed that EPO patent filings are indicating upward trend from
2005 to 2008, but in 2009 there was a slight deviation towards decreasing side. This is
due to the economic recession all over the world along with many other factors like
technological downfall, political, social, and economical fluctuations etc. This might
have been the cause of downtrend in patent filing, and it is predicted that it may restore
to its original form from 2010 onwards.

119
The above studies and analyses reveal that the growth in patent filing is increasing
globally. Since 2005, the growth in patents has doubled due to factors like globalization,
commercialization, technological developments, etc.
4.7 Patent Trends in Scientific Area:
Patent is one of the intellectual property rights, playing a vital role in scientific area of
the research. Patents are the documents, which have two aspects, legal and technical.
Hence this is a very unique information resource, which gives protection to the
invention in a country by a legal method.
From 1883 to 1959, the growth of patents was reported as 1.99%. During this period
patenting activity was more prominent in four countries viz. USA, Germany, UK and
France. From 1960 usage of patent system increased due to emergence of users from
new states or regions. Later, filing of patents in Japan and Soviet Union increased. From
1980, patent offices of USA, European Patent Offices, Republic of Korea and China
filed patents in large numbers. Among the 9 patent offices (Japan, Russia, EPO, US,
Korea, Germany, France, China), average annual growth from 1960-2005 was 3.35%.
Due to establishment of EPO in 1977, the filing of patents from Germany, France and
UK declined as many diverted to regional route for filing patents instead of using the
national route.
Since 1995, worldwide filing of patent applications has grown at an annual average rate
of 4.7% to a total of more than 1.6 million in 2005. In the area of chemical sciences, the
rate is also increasing but it is more in the pharmaceuticals, agriculture & food, and
surface technology. It is also reported that fastest growing technical fields from 2000 to
2004 were medical, audio-visual technology and information technology along with
chemical sciences. Trends in patent activity are a reflection of transition currently
occurring in worldwide industrial activity. Now a days a very high growth rate in use of
patent system is observed everywhere.
The WIPO patent report 2007 (WIPO, 2007) gives the statistical information on
worldwide patent activities and reports growth and development of the patent literature.
According to this report it is recorded that at the end of 2005 there were approximately

120
5.6 million patents in force worldwide. The patents granted worldwide have increased at
an average rate of 3.6% and reached to about 6,00,000 patents in 2005. Among the 5.6
Million patents in force in 2005, 49% patents were owned by the applicants from
countries like Japan and USA, and then followed by the European countries.
Asian economies were main factors responsible for highest recorded patent growth in
2007 with China, Japan and South Korea accounting for more than a quarter of new
registrations. (WIPO, 2007). China saw a 38.1% rise in the number of new patents over
the year 2006. The United States remains the world's leader, with an estimated 52,280
patents recorded in 2007, followed by Japan with 27,731. On a global basis, the number
of new patents reached a record of 156,100 (increase by 4.7%) from 2006. Asian rival,
India came up with 6354 new patents in 2007 compared to 840 in 1999.
The top 20 patent offices, according to the total number of fillings in 2005, were Japan,
USA, China, Korea, EPO, Germany, Canada, Russia, Australia, UK, India, France,
Brazil, Mexico, Hong Kong, Singapore, New Zealand, Poland, Thailand and Israel. The
largest number of patents granted worldwide originates from residents of Japan, USA,
Korea, Germany and France. These accounts for 74% of patents granted worldwide in
2005. In 2005, from the 5.6 million patents in force worldwide, 90% are accounted from
the patent offices of USA, Japan, Germany, Republic of Korea, UK, France, Spain,
China, Canada, Russia. From this information it is found that Japan, USA, Germany,
UK, France, Russia, Korea/China are the main countries contributing to patents.
The statistical information of patents is very alerting and hence this area is very popular
for carrying out research studies to find the development in chemical sciences and
compare the various aspects of patent as a prominent information resource to the
researchers.
The publication data of Chemical Abstracts since 1907 indicated that the abstracts
covered in CA are progressive in abstracting patent literature. It has increased from
55441 in 1977 to 265637 in 2007 (379.13% growth) (CAS, 2007). This indicator in
chemical sciences is measured as quantifiable aspect in considering the development in
patent literature. Biglu (2008) rightly pointed out that one of the most reliable ways to

121
track S & T activities is the study of scientific literature, which consists of periodical
articles, forms of scientific literature like patents, reviews and citations to literature etc.
The scientific literature is a mechanism for dissemination and archiving of research as
well as an object of study. Analysis of this data gives information on scientific
orientation and development of country as well as its participation in S & T worldwide.
Measuring the IPR activities especially in patents and patenting activities is also
essential to track developments. Such studies help in monitoring the patent trend
activities, which are now possible due to availability of improved quality data and
access to it and hence it is getting importance in the recent years. Patent data is also now
available in electronic media and it is possible to analyze this data in various aspects to
judge the trends and indicators of scientific output and information flow.
From the analysis of different patent information sources it is noticed that there is
increasing awareness of patent filings all over the world in all subject areas including
chemical sciences and the information resources are also known to the users and
information professionals very well because of the need to search information required
in R & D organizations. This study proves the hypothesis „There is a growing
awareness of significance of patents and related published literature in chemical
sciences‟.
References:
1. Biglu, M.H.(2008). Scientiometric study of Patent literature in medicine. In H.
Kretschmer & F Havemann (Eds) Proceedings of WIS 2008, Berlin,4th
International
Conference on webometrics and scientiometrics. Accessed at http://creative
commons.org/lisences/by/2.0 ( Accessed on 20 Feb 2008)
2. Chemical Abstracts Service (CAS). (2007). Statistical Summary, 2007. Columbus:
Author.
3. Delphion. Patent database. Accessed at http://www.delphion.com/ (Accessed on 25th
March 2010).

122
4. History of Chemistry. Accessed at http://www.columbia.edu/itc/chemistry/chem-
c2507/navbar/chemhist.html ( accessed on 2 Jan 2010)
5. Indian Patent Office (IPO). Annual Reports of Indian Patent Office (1995-2007)
6. Micropatent database. Accessed at http://www.micropat.com/static/index.htm.
(Accessed on 20th April 2010.)
7. Sukh Dev.(1979). „Chemistry, Chemical industry and Chemists in India‟. Journal of
Indian Chemical Society, 56, 1-6
8. Toussant, M.J.(2002). Trends and impacts in chemical patent Information.
Symposium on impact of American Inventors Protection Act (AIPA) 9th
April 2002
CAS. Accessed at
http://acscinf.org/docs/meetings/223nm/presentations/223nm48.pdf. (Accessed on
21st February 2010.)
9. US Bureau of Census (1970-1977): Historical Statistics of United States Colonial
times to 1970 (1975) and US Bureau of the Census Statistical Abstracts of United
States 1977 (98th
edition 1977). Washington: GPO.
10. USPTO (2007). Technology Assessment and Forecasting Report. (2007). Chemical
Classes 1977 to 2006. Accessed at www.uspto.gov. (Accessed on 2 Jan 2010)
11. Wikipedia. Chemical Industry. Accessed at
http://en.wikipedia.org/wiki/History_of_chemistry.( accessed on 2 Jan 2010)
12. Wikipedia. History of Chemistry. Accessed at
http://en.wikipedia.org/wiki/History_of_chemistry.( accessed on 2 Jan 2010)
13. World Intellectual Property Organization (WIPO). (2007 & 2008). The International
Patent System in 2007 & 2008. PCT Yearly Review: Developments and
Performance. Accessed at http://www.wipo.int/pct/en/activity/pct_2008.html.
(Accessed on 22nd April 2010).