Embed Size (px)
Citation preview

Activated carbon: prepared from various precursors 44
Ideal International E- Publication www.isca.co.in
Chapter 4
Optimization and Characterization Study of Preparation Factors of
Activated Carbon Derived from Coconut shell to Remove of H2S from
Wastewater
Omar Abed Habeeb a, c,, Ramesh Kanthasamy a*, Sumathi Sethupathib, Rosli Mohd. Yunus a
a Faculty of Chemical & Natural Resources Engineering, Universiti Malaysia Pahang,
Gambang, 26300, Kuantan, Malaysia.
b Faculty of Engineering and Green Technology, Universiti Tunku Abdul Rahman, Jalan
Universiti, Bandar Barat, 31900 Kampar, Perak, Malaysia
c North Refinery Company, Ministry of Oil of Iraq, Baiji, Salahaldeen, Iraq.
* Corresponding author: [email protected]
ABSTRACT
The main point of this work is to investigate the preparations variables of activated carbon
derived from coconut shell (CSAC) for removal of hydrogen sulfide (H2S) from wastewater.
The CSAC was chemically modified with potassium hydroxide (KOH). The central composite
design (CCD) under response surface methodology (RSM) was employed to prepare the CSAC.
The three preparation variables impact on the removal efficiency (%) of H2S were examined.
The preparation parameters to the responses were correlated by developing a quadratic model.
The analysis of variance shows the significant impact of variable on each experimental design
responses. The results show that the temperature of 857◦C, chemical impregnation ratio of 3.4
wt% and activation time of 66 min were the optimum conditions for CSAC preparation of with
removal efficiency of 88.8%.
Key Words: Coconut shell, Activated carbon, wastewater, hydrogen sulfide, Response surface
methodology.
1.0 INTRODUCTION
Hydrogen sulfide (H2S) is a very toxic and dangerous gas. There are many sources that
contributed to the emission of H2S to the environment. The petroleum refinery is considered as
the main source contributor of H2S. It is produced during the processing of crude oil to useful
product. The crude oil normally contains sulfur component and to remove the sulfur, process

Activated carbon: prepared from various precursors 45
Ideal International E- Publication www.isca.co.in
such as desulfurization, liquefied petroleum gases and distillation units in used in the crude oil
refinery. Therefore, these processing procedures will generate many wastes which are
dissolved inevitably in the water to produce hazardous sour water which consist of H2S. Hence,
it is a must the water to be treated before being discharge for reuse or discard to swamp
(Kazmierczak-Razna et al. 2015). There are many methods to removeH2S from wastewater,
such as biological, chemical and physiochemical (adsorption) methods (Siefers et al. 2010).
Amongst these methods, adsorption is the most effective method due to its excellent
performance and low cost (Foo and Hameed 2010).
Activated carbons (ACs) from agricultural wastes, such as date stones (Sekirifa et al. 2013),
sugar canes (Castro et al. 2000), nut shell (Hu and Vansant 1995), coconut shell (Yang et al.
2010), and sunflower straw (Foo and Hameed 2011) are the most widely used to remove the
different types of pollutants from wastewater. ACs have large adsorption capacity due to its
great permeability and large surface area which is created during the activation of carbonaceous
substances and carbonization. ACs are commonly used in industries as well. The two common
forms of ACs are granular forms with sizes ranging from 0.5 to 2.5mm to be used in adsorption
and columns, while powder forms with a size predominantly less than 0.15 mm to be used in
batch adsorption followed by filtration (Allen and Koumanova 2005) ; (Dabrowski et al. 2005).
Adsorption using ACs has been reported to be an effective method for the removal of pollutants
from water and air (Bansal and Goyal 2005). Availability, cost, low inorganic matter content,
low degradation during storage and ease of activation are the criteria needed to be considered
in the selection of the precursors (Dabrowski et al. 2005). Physical and chemical activation
methods are normally used for activation of chosen precursor. Physical activation is used to
activate the precursor to enhance the porosity, surface area and surface chemistry of materials.
It consist of two steps: thermal carbonization and activation. The carbonization process of raw
materials under high temperature is to increase the carbon content and reduced the other
component in the materials used. The activation process is conducted under gasified with an
oxidizing agent such as steam or carbon dioxide to enhance the porosity, surface area and
functional groups on the carbon surfaces. Chemical activation is done by chemical agents such
as alkaline hydroxides, zinc chloride, or phosphoric acid, and followed by carbonization under
inert gas and high temperature. The impregnated product must be washed to remove excess
chemical agent (Zhang, Shao, and Karanfil 2010). The chemical nature of ACs surface is very
important to determine the textural properties and of the adsorption capacity ACs. The
activated carbon surface is heterogeneous, consisting multiple faces/edges and layers of

Activated carbon: prepared from various precursors 46
Ideal International E- Publication www.isca.co.in
graphite sheets. The located some of elements such as halogen hydrogen, nitrogen, and
particularly oxygen on the edges are consisted of the chemisorbed foreign heteroatom (El-
Sayed and Bandosz 2004). In the interior of the graphite sheets, the edge sites seem to be more
reactive than the residing atoms. There are many processes that forms of surface chemical
functional groups such as the activation process of precursor like heat treatment and chemical
treatment (Moreno-Castilla 2004) ; (Derylo-Marczewska et al. 2008). There are two categories
of surface functional groups. First, basic groups consisting of pyrone, chromene, ethers and
carbonyls (Boehm 1994). Second, acidic groups which are mainly consisting of carboxylic,
lactones and phenols.
Moreover, the caustic carbon surface could help to immobilize the H2S species on the adsorbent
surface and would allow for greater removal efficiency due to the H2S is acidic. The caustic
materials such as NaOH or KOH is capable to improve the pH level of the carbon surface which
result an attractive adsorbent toward H2S. In this study, the preparation factors of ACs
produced from coconut shell are investigated. The design of experiment is implemented to
optimize the preparations factors of ACs to remove of H2S from wastewater. All the activities
of experimental planning, conducting experiments, and fitting models to the out puts responses
are involved in this method. Response surface methodology (RSM) is the useful tool for
optimizing the factors using center composite design (CCD). The objectives on this work are
to investigate the optimum preparation factors conditions needed to maximize the removal
efficiency (RE) (%) to remove dissolved H2S from wastewater.
2.0 METHODS AND MATERIALS
2.1. Preparation of activated carbon
Coconut shell is used to produce CSAC. The details of raw material preparation method of
precursors are detailed in our previous work (Habeeb et al., 2016). In this study, the precursor
was activated with KOH at different temperature and time with a constant heating rate of 10 ◦C/min. The KOH to precursor ratio was varied from 2:1 - 4:1. The precursor was blended with
KOH at different fertilization proportion (IR), using equation (1):
(1)
Where, WKOH is the weight (g) of KOH pallets and WC is the weight (g) of precursor.

Activated carbon: prepared from various precursors 47
Ideal International E- Publication www.isca.co.in
The procedures for activation process are explained in details in our previous study (Omar
Abed Habeeb, Ramesh Kanthasamy, Gomaa A.M. Ali and Yunus 2017). After activation
process, the samples are rinsed with hot distillate water and 1.0 M hydrochloric acid until the
pH of the washing solution achieved 6–7. The preparation factors ranges are shown in Table 1.
2.2. Modeling and optimization
2.2.1. Experiment design
Response surface methodology (RSM) is an accumulation of numerical and statistical methods
that are important for illustrating, examination, demonstrating and investigation of problems in
which a response of interest effected by a couple factors (Montgomery 2001). Central
composite design (CCD), three-level factorial design and Box–Behnken design are considered
the several classes of designs under RSM and they are the most common designs utilized by
the scholars. However, in current study the CCD was employed to study optimization and the
effect of factors toward their responses(Montgomery 2001). This method is suitable for fitting
a quadratic surface and it spreads to enhance the influential parameters with a minimum
number of experiments as well as examine the association between the parameters. The three
parameters investigated were the activation temperatures (T), mass ratio of KOH to Precursor
(IR) and the duration of time activation (t) and their related extends were 724– 1000 ̊C, 2:1–
4:1 and 60-120 min, respectively with response of removal efficiency.
The residual error was estimated by replicating the central point and based on the extend of
each elements (factor), the independent factors are coded to the (-1, 1) interval. The different
levels, that is to say, high and low, are coded +1 and -1 separately. The axial points are situated
at (0, 0, ±œ), (±œ, 0, 0), (0, ±œ, 0), what makes the design rotatable is the œ which represents
the axial point from the center. In order to set up an empirical model the responses were used
which in turn correlate the responses to three preparation elements using a second degree
polynomial equation as given by equation (2) (Zainudin et al. 2005):
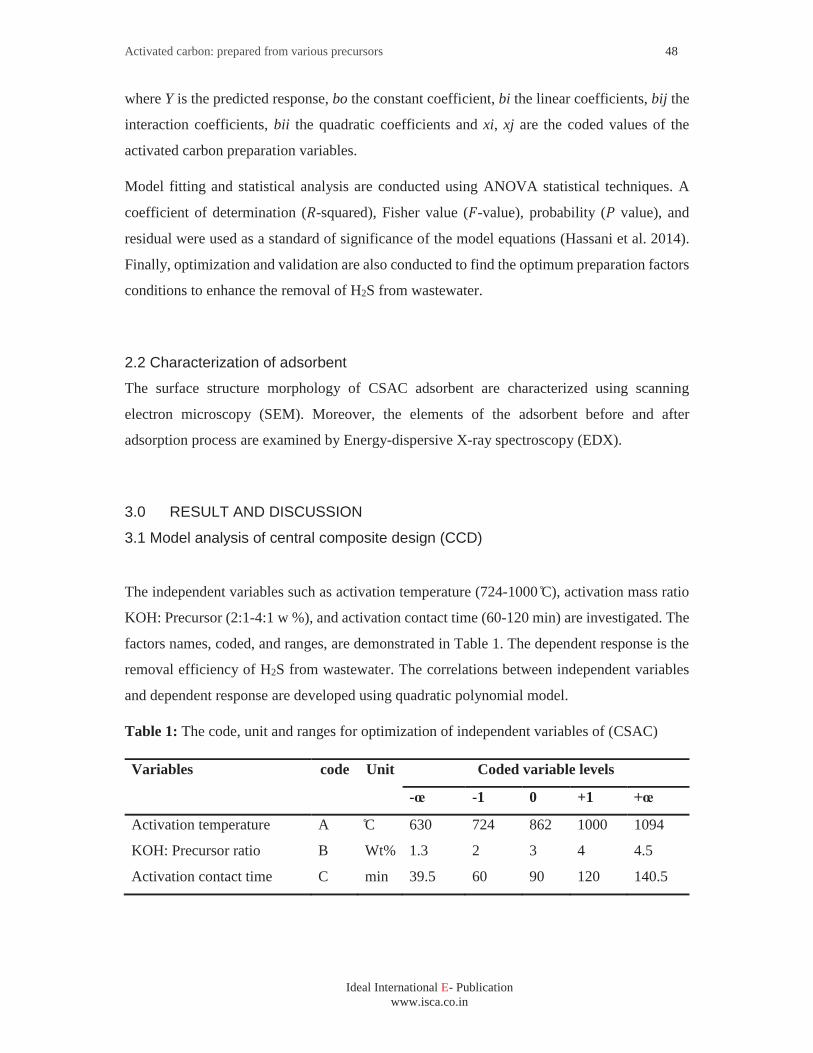
Activated carbon: prepared from various precursors 48
Ideal International E- Publication www.isca.co.in
where Y is the predicted response, bo the constant coefficient, bi the linear coefficients, bij the
interaction coefficients, bii the quadratic coefficients and xi, xj are the coded values of the
activated carbon preparation variables.
Model fitting and statistical analysis are conducted using ANOVA statistical techniques. A
coefficient of determination ( -squared), Fisher value ( -value), probability ( value), and
residual were used as a standard of significance of the model equations (Hassani et al. 2014).
Finally, optimization and validation are also conducted to find the optimum preparation factors
conditions to enhance the removal of H2S from wastewater.
2.2 Characterization of adsorbent
The surface structure morphology of CSAC adsorbent are characterized using scanning
electron microscopy (SEM). Moreover, the elements of the adsorbent before and after
adsorption process are examined by Energy-dispersive X-ray spectroscopy (EDX).
3.0 RESULT AND DISCUSSION
3.1 Model analysis of central composite design (CCD)
The independent variables such as activation temperature (724-1000 ̊C), activation mass ratio
KOH: Precursor (2:1-4:1 w %), and activation contact time (60-120 min) are investigated. The
factors names, coded, and ranges, are demonstrated in Table 1. The dependent response is the
removal efficiency of H2S from wastewater. The correlations between independent variables
and dependent response are developed using quadratic polynomial model.
Table 1: The code, unit and ranges for optimization of independent variables of (CSAC)
Variables code Unit Coded variable levels
-œ -1 0 +1 +œ
Activation temperature A ̊C 630 724 862 1000 1094
KOH: Precursor ratio B Wt% 1.3 2 3 4 4.5
Activation contact time C min 39.5 60 90 120 140.5
Activated carbon: prepared from various precursors 49
Ideal International E- Publication www.isca.co.in
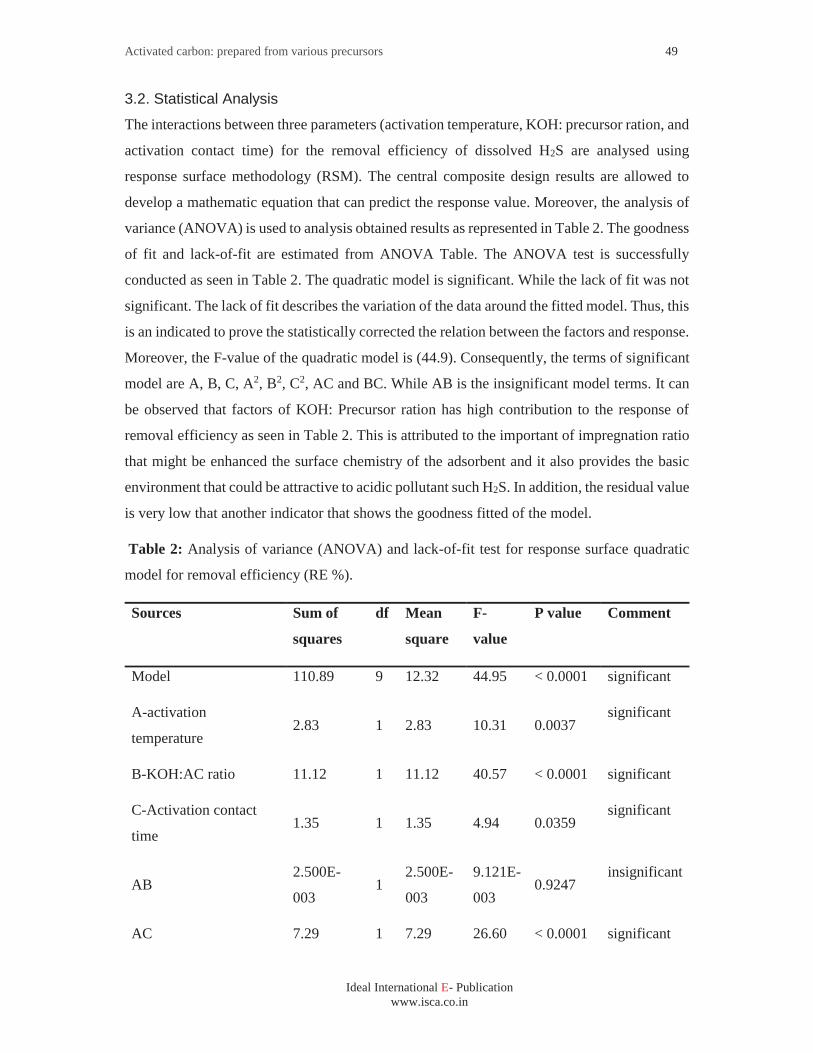
3.2. Statistical Analysis
The interactions between three parameters (activation temperature, KOH: precursor ration, and
activation contact time) for the removal efficiency of dissolved H2S are analysed using
response surface methodology (RSM). The central composite design results are allowed to
develop a mathematic equation that can predict the response value. Moreover, the analysis of
variance (ANOVA) is used to analysis obtained results as represented in Table 2. The goodness
of fit and lack-of-fit are estimated from ANOVA Table. The ANOVA test is successfully
conducted as seen in Table 2. The quadratic model is significant. While the lack of fit was not
significant. The lack of fit describes the variation of the data around the fitted model. Thus, this
is an indicated to prove the statistically corrected the relation between the factors and response.
Moreover, the F-value of the quadratic model is (44.9). Consequently, the terms of significant
model are A, B, C, A2, B2, C2, AC and BC. While AB is the insignificant model terms. It can
be observed that factors of KOH: Precursor ration has high contribution to the response of
removal efficiency as seen in Table 2. This is attributed to the important of impregnation ratio
that might be enhanced the surface chemistry of the adsorbent and it also provides the basic
environment that could be attractive to acidic pollutant such H2S. In addition, the residual value
is very low that another indicator that shows the goodness fitted of the model.
Table 2: Analysis of variance (ANOVA) and lack-of-fit test for response surface quadratic
model for removal efficiency (RE %).
Sources Sum of
squares
df Mean
square
F-
value
P value Comment
Model 110.89 9 12.32 44.95 < 0.0001 significant
A-activation
temperature 2.83 1 2.83 10.31 0.0037
significant
B-KOH:AC ratio 11.12 1 11.12 40.57 < 0.0001 significant
C-Activation contact
time 1.35 1 1.35 4.94 0.0359
significant
AB 2.500E-
003 1
2.500E-
003
9.121E-
003 0.9247
insignificant
AC 7.29 1 7.29 26.60 < 0.0001 significant

Activated carbon: prepared from various precursors 50
Ideal International E- Publication www.isca.co.in
BC 3.24 1 3.24 11.82 0.0021 significant
A2 75.64 1 75.64 275.94 < 0.0001 significant
B2 25.46 1 25.46 92.87 < 0.0001 significant
C2 2.57 1 2.57 9.39 0.0053 significant
Residual 6.58 24 0.27
Lack of Fit 2.12 5 0.42 1.80 0.1609 not
significant
3.3 Development of the equation of regression model
In addition, the CCD software is implemented to improve the empirical model. The correlation
coefficient and standard deviation were used to obviate the model developed fitness. The better
the model in forecasting the response is the smaller the standard deviation and the closer the 2 value is to unity (Alam et al. 2009). The statistical analysis of quadratic model for removal
efficiency is demonstrated in Table 3. It can be seen clearly that the R2 value of 0.944 with
small standard deviation 0.52. Moreover, the predicted R2 is in agreement with the adjusted R2
with only small differences between them. Therefore, the quadratic model is successfully
developed. The quadratic model equation suggested by the software can be written as shown
in equation (3). This equation can be used to predict the value of response (removal efficiency).
Furthermore, predicted vs actual values and normal plot of residual graphs are shown in Figure
1 (a, b) respectively. Figure 1 (a) represents the predicted vs actual values. This figure shows a
sufficient agreement between the predicted data from the mode and the ones obtained from
experiments. It is observed that the values are very close to the line which indicated the
experimental values are closed to predict one. Figure 1 (b) shows the normal plot of residual
error which demonstrated the residual error deviation from the model.

Activated carbon: prepared from various precursors 51
Ideal International E- Publication www.isca.co.in
Table 3: Regression statistics for removal efficiency RE (%) at equilibrium.
Source Standard
deviation
R2 Adjusted
R2
Predicted
R2
Comment
Linear 1.85 0.1302 0.0433 -0.0604
2FI 1.84 0.2199 0.0465 -0.0027
Quadratic 0.52 0.9440 0.9230 0.9011 Suggested
Cubic 0.48 0.9609 0.9355 0.9253 Aliased
Removal efficiency = 88.6+0.32A+0.638B-0.2226C-0.0125AB+0.675AC-0.45BC-1.83A2-
1.0625B2-0.337C2 (3)
(a)
Actual
Pred
icte
d
Predicted vs. Actual
82
84
86
88
90
82 84 86 88 90

Activated carbon: prepared from various precursors 52
Ideal International E- Publication www.isca.co.in
(b)
Figure1 (a) Actual and predicted curve. (b) Normal plot of residual
3.4 Effect of interaction factors
The effect of the factors interaction on the removal efficiency is demonstrated in Figure 2 (a,
b, & c). The interaction between activation temperature and KOH: Precursor ratio are
represented in Figure 2 (a). The two factors have affected the removal efficiency. It can be seen
there is no interaction as the activated temperature increasing, the impregnation ration
increased. However, the impact of the activation agent ratio has more significant effect on
removal efficiency than activation temperature. While, the Figure 2 (b) represents the effect of
interaction between activation temperature and activation contact time. The activation
temperature has a significant effect on the removal efficiency of H2S. The removal efficiency
was low at lower temperature of 724 ◦C and higher activation contact time of 120 min. Then,
it start increasing when the temperature increased and the time decreased until reach the
optimum removal efficiency of 88.8 % at activation temperature of 857 ◦C and activation
contact time of 70 min.
Externally Studentized Residuals
Nor
mal
% P
roba
bilit
y
Normal Plot of Residuals
-5.00 -4.00 -3.00 -2.00 -1.00 0.00 1.00 2.00
1
5
10
20
30
50
70
80
90
95
99

Activated carbon: prepared from various precursors 53
Ideal International E- Publication www.isca.co.in
Figure 2 (c) shows the interactions between activation time and the impregnation ratio. The
interaction plot shows the removal efficiency was very low at lower impregnation ratio and
activation contact time. In fact, the graph demonstrated that high contact time of 120 min and
low contact time of 60 min with low impregnation ratio are negatively affected the removal
efficiency (as seen from Figure 2 (c)). After that, the removal of H2S increasing with increased
of impregnation ratio and activation contact time until reach the optimum removal efficiency
of 88.8 % with impregnation ratio of 3.4 wt% and activation contact time of 70 min.
(a) (b)
(c)
Figure 2. The effect of interactions between factors on the removal efficiency
A: activation temperature
B: KOH:Precursor ratio
724.00 793.00 862.00 931.00 1000.00
RE%
(%)
83
84
85
86
87
88
89
90
Interaction
A: activation temperature
C: Activation contact time
724.00 793.00 862.00 931.00 1000.00
RE%
(%)
83
84
85
86
87
88
89
90
Interaction
B: KOH:Precursor ratio
C: Activation contact time
2.00 2.50 3.00 3.50 4.00
RE%
(%)
83
84
85
86
87
88
89
90
Interaction

Activated carbon: prepared from various precursors 54
Ideal International E- Publication www.isca.co.in
3.5 Effect of combined factors
The effect of activation temperature and KOH: Precursor ratio on the removal efficiency show
in Figure 3. The 3D plot presents impact of activation temperature with range between 724 to
1000 ̊C and activation agent mass ratio (KOH: Precursor) with range of (2:1-4:1 w%) on
removal efficiency. From the trend of plot, it can be observed that, impregnation ratio and
activation temperature have parallel contribution on removal efficiency. As increased in
activation temperature and impregnation ratio, the removal efficiency increased. At the low
activation temperature around 724 ̊C, the value of removal efficiency was very low. After that,
the removal efficiency start increased with increasing the activation temperature and
impregnation ratio until reach the optimum requirement of activation temperature and
impregnation ration for getting the optimum removal efficiency.
Moreover, the effect on the interaction between activation temperature and contact time on the
removal efficiency are demonstrated in Figure 4. The activation temperature with range (724-
1000 ̊C) and activation contact time range (60-120 min) have a significant effect on response
removal of H2S. The temperature of activated of adsorbent has more effect on removal of H2S
than activation time as seen in Figure 4. From the trend of 3D plot was observed that H2S
experienced lowest residual at a preparation conditions of activation temperature of 857 ̊C and
activation contact time of 66 min. Furthermore, the 3D plot of the interaction effect between
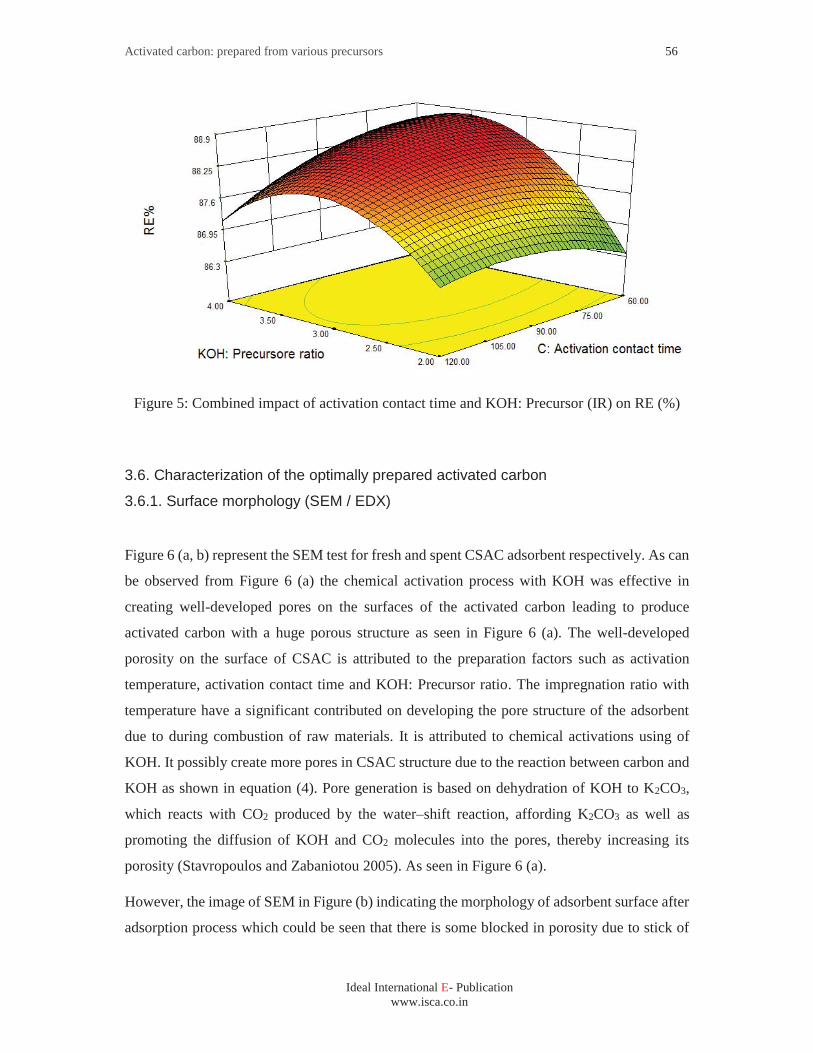
activation time and KOH: Precursors on the removal efficiency are shown in Figure 5. It can
be observed that the KOH: Precursors has a significant impact compared with the activation
time which has less contribution on the removal of H2S. The same trend was reported by
Chaudhary (Chaudhary and Balomajumder 2014) As can be concluded that all the preparation
factors of CSAC have a significant effect in different percentage that could contribute to
enhance the removal of H2S from synthetic wastewater.

Activated carbon: prepared from various precursors 55
Ideal International E- Publication www.isca.co.in
Figure 3: Combined impact of activation temperature and KOH: Precursor ratio on RE (%).
Figure4: Combined impact of activation time and activation temperature of AC on of RE (%).
Activated carbon: prepared from various precursors 56
Ideal International E- Publication www.isca.co.in
Figure 5: Combined impact of activation contact time and KOH: Precursor (IR) on RE (%)
3.6. Characterization of the optimally prepared activated carbon
3.6.1. Surface morphology (SEM / EDX)
Figure 6 (a, b) represent the SEM test for fresh and spent CSAC adsorbent respectively. As can
be observed from Figure 6 (a) the chemical activation process with KOH was effective in
creating well-developed pores on the surfaces of the activated carbon leading to produce
activated carbon with a huge porous structure as seen in Figure 6 (a). The well-developed
porosity on the surface of CSAC is attributed to the preparation factors such as activation
temperature, activation contact time and KOH: Precursor ratio. The impregnation ratio with
temperature have a significant contributed on developing the pore structure of the adsorbent
due to during combustion of raw materials. It is attributed to chemical activations using of
KOH. It possibly create more pores in CSAC structure due to the reaction between carbon and
KOH as shown in equation (4). Pore generation is based on dehydration of KOH to K2CO3,
which reacts with CO2 produced by the water–shift reaction, affording K2CO3 as well as
promoting the diffusion of KOH and CO2 molecules into the pores, thereby increasing its
porosity (Stavropoulos and Zabaniotou 2005). As seen in Figure 6 (a).
However, the image of SEM in Figure (b) indicating the morphology of adsorbent surface after
adsorption process which could be seen that there is some blocked in porosity due to stick of

Activated carbon: prepared from various precursors 57
Ideal International E- Publication www.isca.co.in
sulfur on the pore hole and also can be seen the some white particle on the surface which
indicated that the sulfur already stick on porous area.
6KOH + 2C 2K + 3H2 + 2K2CO3 (4)
(a) (b)
Figure 6 SEM image of (a) fresh (b) spent CSAC adsorbent
Moreover, the EDX test for the CSAC before and after adsorption process are shown in Figure
7 (a, b). As can be seen the peaks for the fresh CSAC represents the adsorbent components
which is (C, O and K). However, the peaks for the spent CSAC is representing the adsorbent
components after adsorption process which is shown clearly that there more peaks which is
represent the different components such as (C, O, K, and S). All composite components of the
adsorbent before and after adsorption process shown in Table 4. It can be seen that the
percentage of C, O, and K are decreased after the adsorption process. In fact, the most
interesting finding was that the percentage of K decreased to around 0.93 % after adsorption,
indicating that acid–base reaction occurs. Moreover, S content detected as 0.724, which is
another indicator for the possible occurrence of oxidation. In fact, during the adsorption process,
the acid/base reaction is occurred. The KOH provides a basic environment on the active sites
on the adsorbent which attracted the acidic dissolved H2S and its ions to produce the sulfide
salt and water as seen in equation (5). The reactions occurred on the surface of CSAC. From
that the percentage of C, O, and K are decreased as noticed in Table 4.
2KOH + H2S K2S + 2H2O (5)

Activated carbon: prepared from various precursors 58
Ideal International E- Publication www.isca.co.in
(a)
(b)
Figure 7 EDX test (a) Fresh. (b) Spent CSAC adsorbent.
Table 4: The components of activated carbon derived from coconut shell fresh and spent
adsorbent.
Element Component of fresh adsorbent
(Weight %)
Components of spent adsorbent
(Weight % )
Carbon (C) 76.575 73.24
Oxygen (O) 17.9 25.6
Potassium (K) 5.511 0.38
Sulfur (S) 0 0.724
4. 0 CONCLUSIONS
In this study the variables for preparations of CSAC for H2S removal from wastewater was
investigated. The optimum preparation variables conditions are examined. SEM and EDX

Activated carbon: prepared from various precursors 59
Ideal International E- Publication www.isca.co.in
characterizations are conducted. The result shows that the optimum conditions of factors are
temperature of 857 ◦C, chemical impregnation ratio of 3.4 wt% and activation time of 66 min
with removal efficiency of 88.8 %.
ACKNOWLEDGEMENTS
This work was funded by Faculty of Chemical & Natural Resources Engineering, University
Malaysia Pahang through a local research grant scheme.
REFERENCES Alam, Md Zahangir, Emad S Ameem, Suleyman A Muyibi, and Nassereldeen A Kabbashi. 2009. “The
Factors Affecting the Performance of Activated Carbon Prepared from Oil Palm Empty Fruit
Bunches for Adsorption of Phenol.” Chemical Engineering Journal 155 (1). Elsevier: 191–98.
Allen, S J, and B Koumanova. 2005. “Decolourisation of Water/wastewater Using Adsorption.” Journal
of the University of Chemical Technology and Metallurgy 40 (3): 175–92.
Bansal, Roop Chand, and Meenakshi Goyal. 2005. Activated Carbon Adsorption. CRC press.
Boehm, H P. 1994. “Some Aspects of the Surface Chemistry of Carbon Blacks and Other Carbons.”
Carbon 32 (5). Elsevier: 759–69.
Castro, Javier Blanco, Pablo R Bonelli, Elsa G Cerrella, and Ana L Cukierman. 2000. “Phosphoric Acid
Activation of Agricultural Residues and Bagasse from Sugar Cane: Influence of the Experimental
Conditions on Adsorption Characteristics of Activated Carbons.” Industrial & Engineering
Chemistry Research 39 (11). ACS Publications: 4166–72.
Chaudhary, Neeru, and Chandrajit Balomajumder. 2014. “Optimization Study of Adsorption
Parameters for Removal of Phenol on Aluminum Impregnated Fly Ash Using Response Surface
Methodology.” Journal of the Taiwan Institute of Chemical Engineers 45 (3). Elsevier: 852–59.
Dabrowski, a, P Podkościelny, Z Hubicki, and M Barczak. 2005. “Adsorption of Phenolic Compounds
by Activated Carbon--a Critical Review.” Chemosphere 58 (8): 1049–70.
Derylo-Marczewska, Anna, Andrzej Swiatkowski, Stanisław Biniak, and Mariusz Walczyk. 2008.
“Effect of Properties of Chemically Modified Activated Carbon and Aromatic Adsorbate
Molecule on Adsorption from Liquid Phase.” Colloids and Surfaces A: Physicochemical and
Engineering Aspects 327 (1). Elsevier: 1–8.
El-Sayed, Yehya, and Teresa J Bandosz. 2004. “Adsorption of Valeric Acid from Aqueous Solution
onto Activated Carbons: Role of Surface Basic Sites.” Journal of Colloid and Interface Science
273 (1). Elsevier: 64–72.
Foo, K. Y., and B. H. Hameed. 2010. “Insights into the Modeling of Adsorption Isotherm Systems.”

Activated carbon: prepared from various precursors 60
Ideal International E- Publication www.isca.co.in
Chemical Engineering Journal 156 (1): 2–10.
Foo, K Y, and B H Hameed. 2011. “Preparation and Characterization of Activated Carbon from
Sunflower Seed Oil Residue via Microwave Assisted K2CO3 Activation.” Bioresource
Technology 102 (20). Elsevier: 9794–99.
Habeeb O A, Ramesh K, Ali Gomaa A M, Yunus MYM, T K Thanusha, and O A Olalere. 2016.
“Modeling and Optimization For H2S Adsorption From Astewater Using Coconut Shell Based
Activated Carbon.” Australian Journal of Basic and Applied Sciences 10 (17 Sp.). AENSI
Publishing: 136–47.
Hassani, A., L. Alidokht, A. R. Khataee, and S. Karaca. 2014. “Optimization of Comparative Removal
of Two Structurally Different Basic Dyes Using Coal as a Low-Cost and Available Adsorbent.”
Journal of the Taiwan Institute of Chemical Engineers 45 (4). Elsevier: 1597–1607.
Hu, Zhonghua, and E F Vansant. 1995. “Carbon Molecular Sieves Produced from Walnut Shell.”
Carbon 33 (5). Elsevier: 561–67.
Kazmierczak-Razna, Justyna, Barbara Gralak-Podemska, Piotr Nowicki, and Robert Pietrzak. 2015.
“The Use of Microwave Radiation for Obtaining Activated Carbons from Sawdust and Their
Potential Application in Removal of NO2 and H2S.” Chemical Engineering Journal 269. Elsevier
B.V.: 352–58.
Montgomery, D C. 2001. “Design and Analysis of Experiments Fifth Edition. By John Wiley & Sons.”
Inc. All Rights Reserved.
Moreno-Castilla, Carlos. 2004. “Adsorption of Organic Molecules from Aqueous Solutions on Carbon
Materials.” Carbon 42 (1). Elsevier: 83–94.
Omar Abed Habeeb, Ramesh Kanthasamy, Gomaa A.M. Ali, Rosli bin Mohd., and Yunus. 2017.
“Optimization of Activated Carbon Synthesis Using Response Surface Methodology to Enhance
H2S Removal from Refinery Wastewater.” Journal of Chemical Engineering and Industrial
Biotechnology 1: 1–17.
Sekirifa, Mohamed L., Mahfoud Hadj-Mahammed, Stephanie Pallier, Lotfi Baameur, Dominique
Richard, and Ammar H. Al-Dujaili. 2013. “Preparation and Characterization of an Activated
Carbon from a Date Stones Variety by Physical Activation with Carbon Dioxide.” Journal of
Analytical and Applied Pyrolysis 99. Elsevier B.V.: 155–60.
Siefers, Andrea, Ning Wang, Andrew Sindt, John Dunn, James McElvogue, Eric Evans, and Tim Ellis.
2010. “A Novel and Cost-Effective Hydrogen Sulfide Removal Technology Using Tire Derived
Rubber Particles.” Proceedings of the Water Environment Federation 2010 (12). Water

Activated carbon: prepared from various precursors 61
Ideal International E- Publication www.isca.co.in
Environment Federation: 4597–4622.
Stavropoulos, G. G., and A. A. Zabaniotou. 2005. “Production and Characterization of Activated
Carbons from Olive-Seed Waste Residue.” Microporous and Mesoporous Materials 82 (1–2).
Elsevier: 79–85.
Yang, Kunbin, Jinhui Peng, C. Srinivasakannan, Libo Zhang, Hongying Xia, and Xinhui Duan. 2010.
“Preparation of High Surface Area Activated Carbon from Coconut Shells Using Microwave
Heating.” Bioresource Technology 101 (15). Elsevier Ltd: 6163–69.
Zainudin, Nor Fatiha, Keat Teong Lee, Azlina Harun Kamaruddin, Subhash Bhatia, and Abdul Rahman
Mohamed. 2005. “Study of Adsorbent Prepared from Oil Palm Ash (OPA) for Flue Gas
Desulfurization.” Separation and Purification Technology 45 (1). Elsevier: 50–60.
Zhang, Shujuan, Ting Shao, and Tanju Karanfil. 2010. “The Effects of Dissolved Natural Organic
Matter on the Adsorption of Synthetic Organic Chemicals by Activated Carbons and Carbon
Nanotubes.” Water Research 45 (3): 1378–86.