Embed Size (px)
Citation preview

75
CHAPTER 4
LESS THAN BOOK VALUE! WHAT A BARGAIN?How Helga learned to mistrust accountants
Helga, a psychologist, had always wanted to be an accountant. She bemoaned thefact that her discipline was subjective and lacked precision, and wished that she could workin a field where there were clear rules and principles. One day, she read an article in theWall Street Journal on Global Telecom, whose stock, the report said, was trading at half ofits book value. From her limited knowledge of accounting, Helga knew that book valuerepresented the accountant’s estimate of what the equity in the bank was worth. “If a stockis trading at less than book value, it must be cheap,” she exclaimed, as she invested heavilyin the stock.
Convinced that she was secure in her investment, Helga waited for the stock price tomove up to the book value of equity. Instead, it moved down. When she took a closer lookat Global Telecom, she learned that its management had a terrible reputation and that it hadeither lost money or made very little every year for the last 10 years. Helga still kept herfaith in the accounting value, convinced that, at worst, someone would buy the firm for thebook value. At the end of the year, her hopes were dashed. The accountants announced thatthey were writing down the book value of the equity to reflect poor investments that the firmhad made in the past. The stock price no longer was lower than the book value, but the bookvalue had come down to the price rather than the other way around. Helga never yearned tobe an accountant again.
Moral: The book value is an opinion and not a fact.
The book value of equity is the accountant’s measure of what equity in a firm isworth. While the credibility of accountants has declined over the last few years, there aremany who continue to believe that accountants provide not only a more conservative but alsoa more realistic measure of what equity is truly worth than financial markets which theyview as subject to irrational buying and selling. A logical consequence of this view is thatstocks that trade at substantially less than book value are under valued and those that trade atmore than book value are over valued. As you will see in this chapter, while this maysometimes be true, there are many stocks that deserve to trade at less than book value eitherbecause they have poor investments or high risk or both.

76
The Core of the StoryThe notion that stocks that trade at less than book value are undervalued has been
around for decades. It has been used as a value screen by investors and portfolio manager.Services that track mutual funds (Morningstar, Value Line and Lipper) have used it as theirbasis for categorizing funds into value and growth funds – value funds invest in stocks withlow price to book value ratios and growth funds in stocks with high price to book valueratios. As with PE ratios, rules of thumb abound – stocks that trade at less than book valueare under valued, whereas stocks that trade at more than twice book value are overvalued.
Why does this story carry so much weight with investors? There are several reasonsand two are considered below:
q Markets are less reliable than accountants when it comes to estimating value: Ifyou believe that markets are both volatile and irrational, and combine this with a trustin the inherently conservative nature of accounting estimates of value, it followslogically that you would put more weight on accounting estimate of values (bookvalue) than on market estimates of the same (market value). Thus, when a firm tradesat less than book value, you will be inclined to believe that it is markets that have amistaken estimate of value rather than accountants.
q Book value is liquidation value: In addition to the trust that some investors have inaccountants’ estimates of value, there is also the embedded belief that a firm, ifliquidated, would fetch its book value. If this is the case, proponents argue, a stockthat trades at less than book value is a bargain to someone who can liquidate itsassets and pay off its debt As investors, you can piggyback on such investors andgain as the stock price approaches book value.
The Theory: Price to Book Ratios and FundamentalsIn Chapter 3, you examined the variables that affect the price earnings ratio, by
going back to a simple valuation model and deriving the determinants of the multiple. Youwill follow the same path with price to book ratios. You will begin again with the definitionof the price to book ratio (and any variants thereof) and then evaluate the variables that maycause some companies to have high price to book ratios and others to have low price tobook ratios.
Defining the Price to Book Ratio
The price to book ratio is the ratio obtained by dividing the market price per shareby the book value per share at a point in time.

77
†
PBV = Price to Book = Market Price per shareBook Value per share
The price to book ratio is usually estimated using the current price per share in thenumerator and the book value per share in the denominator. The book value per share is thebook value of equity divided by the number of shares outstanding. There are far fewervariants of price to book ratios than there are in price earnings ratios. It is true that you canstill compute book value of equity per share based upon the actual number of sharesoutstanding (primary book value per share) or upon potential shares outstanding, assumingthat options get exercised (diluted book value per share). However, you do not have thevariants on current, trailing and forward values as you did for price earnings ratio. It isconventional to use as updated a measure of book value of equity per share as you can get.If firms report earnings annually, this will be based upon the equity in the last annual report.If firms report on a quarterly basis, you can use the equity from the most recent quarterlybalance sheet.
How accountants measure book valueTo understand book value, you should start with the balance sheet, shown in Figure
4.1, which summarizes the assets owned by a firm, the value of these assets and the mix offinancing, debt and equity, used to finance these assets at a point in time.
Assets Liabilities
Fixed Assets
Debt
Equity
Short-term liabilities of the firm
Intangible Assets
Long Lived Real Assets
Assets which are not physical,like patents & trademarks
Current Assets
Financial InvestmentsInvestments in securities &assets of other firms
Short-lived Assets
Equity investment in firm
Debt obligations of firm
Current Liabilties
Other Liabilities Other long-term obligations
Figure 4.1: The Balance Sheet
This is the accounting estimate of book value of equity
While this is the conventional format for balance sheets in the United States, there are mild
variations in how they are set up elsewhere in the globe. In parts of Asia, the assets are shown on
the right hand side and liabilities on the left hand side. German companies consolidate pension
fund assets and liabilities in corporate balance sheets.
What is an asset? An asset is any resource that has the potential to either generate futurecash inflows or reduce future cash outflows. While that is a general definition broad enoughto cover almost any kind of asset, accountants add a caveat that for a resource to be an asset,

78
a firm has to have acquired it in a prior transaction and be able to quantify future benefitswith reasonable precision. The accounting view of asset value is to a great extent groundedin the notion of historical cost, which is the original cost of the asset, adjusted upwards forimprovements made to the asset since purchase and downwards for the loss in valueassociated with the aging of the asset. This historical cost is called the book value. This isespecially true of fixed assets, such as land, building and equipment. While accountants aremore amenable to revaluing current assets, such as inventory and accounts receivable, andsome marketable securities at current market values, a process called marking to market, thebook value of all assets on a balance sheet often will bear little or no resemblance to theirmarket value.
Since assets are valued based upon historical cost, the liabilities suffer from thesame absence of updating. Thus, the debt shown on a firm’s balance sheet represents theoriginal amount borrowed from banks or bondholders, rather than an updated market value.What about the book value of equity? The value of equity shown on the balance sheetreflects the original proceeds received by the firm when it issued the equity, augmented byany earnings made since (or reduced by losses, if any) and reduced by any dividends paidout during the period. While these three items go into what you can call the book value ofequity, a few other items also end up in this estimate.1. When companies buy back stock for short periods, with the intent of reissuing the stock
or using it to cover option exercises, they are allowed to show the repurchased stock astreasury stock, which reduces the book value of equity. Firms are not allowed to keeptreasury stock on the books for extended periods and have to reduce their book value ofequity by the value of repurchased stock in the case of actions such as stock buybacks.Since these buybacks occur at the current market price, they can result in significantreductions in the book value of equity.
2. Firms that have significant losses over extended periods or carry out massive stockbuybacks can end up with negative book values of equity.
3. If a firm has substantial amount invested in marketable securities, any unrealized gain orloss in marketable securities that are classified as available-for-sale is shown as anincrease or decrease in the book value of equity in the balance sheet.
As part of their financial statements, firms provide a summary of changes in shareholdersequity during the period, where all the changes that occurred to the accounting (book value)measure of equity value are summarized.
As with earnings, firms can influence the book value of their assets by theirdecisions on whether to expense or capitalize items – when items are expensed they do notshow up as assets. Even when an expense is capitalized, the choice of depreciation method

79
can affect an asset’s book value; firms that use accelerated depreciation – where moredepreciation is claimed in the early years and less in the later years – will report lower bookvalues for assets. Firms can have an even bigger impact on the book value of equity whenthey take restructuring or one-time charges. In summary, any investment approach basedupon book value of equity has to grapple with these issues and the price to book ratio maynot be a good indicator of value for many companies.
Determinants of PBV ratiosConsider again the model presented in the last chapter for valuing a stock in a firm
where the dividends paid will grow at a constant rate forever. In this model, the value ofequity can be written as:
†
Value per share today =Expected Dividend per share next year
Cost of Equity - Expected Growth RateAs a simple example, consider investing in stock in Consolidated Edison, the utility thatserves much of New York City. The stock is expected to pay a dividend of $2.20 per sharenext year (out of expected earning per share of $3.30) the cost of equity for the firm is 8%and the expected growth rate in perpetuity is 3%. The value per share can be written as:
†
Value per share of Con Ed =$2.20
(.08 - .03)= $44.00 per share
To get from this model for value per share to one for the price to book ratio, you willdivide both sides of the equation by the book value of equity per share today. When you do,you obtain the discounted cash flow equation specifying the price to book ratio for a stablegrowth firm.
†
Value per share todayBook value of equity today
= PBV =
Expected Dividend per shareBook Value of Equity per share today
Cost of Equity- Expected Growth Rate
†
=
Expected Dividend per shareExpected EPS next year
* Expected EPS next yearBook Value of Equity per share today
Cost of Equity- Expected Growth Rate
=
†
Expected Payout Ratio * Return on Equity(Cost of Equity - Expected Growth Rate)
Consider again the example of Con Ed introduced in the last chapter. Recapping the facts,the stock is expected to pay a dividend of $2.20 per share next year out of expectedearnings per share of $3.30), the cost of equity is 8% and the expected growth rate in

80
perpetuity is 3%. In addition, assume that the book value of equity per share currently is$33. You can estimate the price to book ratio for Con Ed:
Price to Book Ratio for Con Ed
=
†
Expected Payout Ratio * Return on Equity(Cost of Equity - Expected Growth Rate)
=
†
(2.20/3.30) * (3.30/33)(.08 - .03)
= 1.33
The price to book ratio (PBV) will increase as the expected growth rate increases; highergrowth firms should have higher PBV ratios, which makes intuitive sense. The price to bookratio will be lower if the firm is a high-risk firm and has a high cost of equity. The price tobook ratio will increase as the payout ratio increases, for any given growth rate; firms thatare more efficient about generating growth (by earning a higher return on equity) will tradeat higher multiples of book value. In fact, substituting in the equation for payout into thisequation:Payout ratio = 1- g/Return on Equity
Price to Book Ratio =
†
(1- g/ Return on Equity) * Return on Equity(Cost of Equity - g)
=
†
(Return on Equity - g)(Cost of Equity - g)
The key determinant of price to book ratios is the difference between a firm’s return onequity and its cost of equity. Firms that are expected to consistently earn less on theirinvestments (return on equity) than you would require them to earn given their risk (cost ofequity) should trade at less than book value.
As noted in the last chapter, this analysis can be easily extended to cover a firm inhigh growth. The equation will become more complicated but the determinants of price tobook ratios remain the same – return on equity, expected growth, payout ratios and cost ofequity. A company whose stock is trading at a discount on its book value is not necessarilycheap. In particular, you should expect companies that have low returns on equity, high riskand low growth potential to trade at low price to book ratios. If you want to find undervalued companies then, you have to find mismatches – low or average risk companies thattrade at low price to book ratios while maintaining reasonable returns on equity.
Looking at the EvidenceSome investors argue that stocks that trade at low price-book value ratios are under
valued and there are several studies that seem to back a strategy of buying such stocks. You

81
will begin by looking at the relationship between returns and price to book ratios acrosslong time periods in the United States and extend the analysis to consider other markets.
Evidence from the United StatesThe simplest way to test whether low price to book stocks are good investments is to
look at the returns that these stocks earn, relative to other stocks in the market. Anexamination of stock returns in the United States between 1973 and 1984 found that thestrategy of picking stocks with high book/price ratios (low price-book values) would haveyielded an excess return of 4.5% a year.1 In another analysis of stock returns between 1963and 1990 firms were classified on the basis of price to book ratios into twelve portfolios,and firms in the highest price to book value class earned an average monthly return of0.30%, while firms in the lowest price to book value class earned an average monthly returnof 1.83% for the 1963-90 period. 2,
This research was updated to consider how well a strategy of buying low price tobook value stocks would have done in from 1991-2001 and compared these returns toreturns in earlier time periods. To make the comparison, the annual returns on ten portfolioscreated based upon price to book ratios at the end of the previous year were computed. Theresults are summarized in Figure 4.2.
1 Rosenberg, B., K. Reid, and R. Lanstein, 1985, Persuasive Evidence of Market Inefficiency, Journal of
Portfolio Management, v11, 9-17.
2 Fama, E.F. and K.R. French, 1992, The Cross-Section of Expected Returns, Journal of Finance, v47,
427-466. This study is an examination of the effectiveness of different risk and return models in finance. It
found that price to book explained more of the variation across stock returns than any other fundamental
variable, including market capitalization.

82
Data from Fama./French. The stocks were categorized based upon the ratio of price to book value
at the beginning of each year and the annual returns were measured over the next year. The average
annual return across each period is reported.
In each of the three sub-periods that you looked at stock returns, the lowest price to bookstocks earned higher returns than the stocks with higher price to book ratios. In the 1927-1960 period, the difference in annual returns between the lowest price to book stockportfolio and the highest was 3.48%. In the 1961-1990 sub-period, the difference in returnsbetween these two portfolios expanded to 7.57%. In the 1991-2001 period, the lowest priceto book stocks continued to earn a premium of 5.72% over the highest price to book stocks.Thus, the higher returns earned by low price to book stocks have persisted over longperiods.
As noted with price earnings ratios though, these findings should not be taken as anindication that low price to book ratio stocks earn higher returns than higher price to bookstocks in every period. Figure 4.3 reports on the difference between the lowest price to bookand highest price to book portfolio, by year, from 1960 to 2001.
Lowest 2 3 4 5 6 7 8 9 Highest
1927-19601961-1990
1991-2001
0.00%
5.00%
10.00%
15.00%
20.00%
25.00%
PBV Class
Figure 4.2: PBV Classes and Returns - 1927-2001
1927-1960 1961-1990 1991-2001
Low price to book stocks have earned higher annual returns than the rest of the market in every time period, but the results have been much stronger since 1961.

83
1927
1930
1933
1936
1939
1942
1945
1948
1951
1954
1957
1960
1963
1966
1969
1972
1975
1978
1981
1984
1987
1990
1993
1996
1999
D10-D1
-40
-20
0
20
40
60
80
100
Ann
ual R
etur
n on
low
PBV
- A
nnua
l Ret
urn
on h
igh
PBV
Year
Figure 4.3: Lowest versus Highest Price to Book Stocks - 1927-2001
Positive numbers indicate that low price to book stocks did better than high price to book stocks in that year.
The best ever year for low PBV stocks
Worst year for low PBV stocks
From Fama/French. This is the difference between the annual return on the lowest PBV stocks
(bottom 10%) and the highest PBV stocks (top 10%).
While low price to book stocks have outperformed high price to book stocks, on average,there have been extended periods when they have underperformed as well. In fact, looking atthe time periods where low price to book stocks have performed best – early in the 1930s,during the second world war, in the last 1970s and early in the 1990s – you can draw theconclusion that low price to book stocks perform best when the overall market is in thedoldrums, reflecting their status as defensive stocks.
A concern in investing is transactions costs. One study examined the question ofwhether low price to book stocks generate excess returns after transactions costs.3 Theauthors found that after adjusting for 1.0 percent transaction costs and annual rebalancing,investors would have outperformed the market by 4.82 percent over the 1963-1988 period,if they had invested in securities from small firms with low price to book ratios. Theyconcluded that the optimal time period for rebalancing these portfolios, where the payoff toupdating exceeded the transactions costs, was 2 years.
3 Patrick Dennis, Steven B. Perfect, Karl N. Snow, and Kenneth W. Wiles, "The Effects of Rebalancing
on Size and Book-to-Market Ratio Portfolio Returns," Financial Analysts Journal, May-June 1995.

84
Evidence from outside the United StatesThe finding that low price to book stocks earn higher returns than high price to
book stocks over extended periods is not unique to the United States. An analysis in 1991found that the book-to-market ratio had a strong role in explaining the cross-section ofaverage returns on Japanese stocks4. Extending the evaluation of price-book value ratiosacross other international markets, stocks with low price-book value ratios earned excessreturns in every market that was examined between 1981 and 1992.5 The annualizedestimates of the return differential earned by stocks with low price-book value ratios, overthe market index, in each of the markets studied is listed in Table 4.1:
Table 4.1: Return Premia for low Price to Book Portfolio by CountryCountry Added Return to low P/BV
portfolio
France 3.26%
Germany 1.39%
Switzerland 1.17%
U.K 1.09%
Japan 3.43%
U.S. 1.06%
Europe 1.30%
Global 1.88%
Extending this analysis to emerging markets, a study of Korean stocks uncovered the samerelationship between low price to book stocks and high returns.6
Thus, a strategy of buying low price to book value stocks seems to hold out muchpromise. Why don’t more investors use it then, you might ask? You will consider some ofthe possible problems with this strategy in the next section and screens that can be added onto remove these problems.
4 Chan, L.K., Y. Hamao, and J. Lakonishok, 1991, Fundamentals and Stock Returns in Japan, Journal of
Finance. v46. 1739-1789. They concluded that low price to book value stocks in Japan earned a
considerable premum over high price to book value stocks.
5 Capaul, C., I. Rowley and W.F. Sharpe, 1993, International Value and Growth Stock Returns,
Financial Analysts Journal, 27-36.
6 Sandip Mukherji, Manjeet S. Dhatt, and Yong H. Kim, A Fundamental Analysis of Korean Stock
Returns, Financial Analysts Journal, May/June 1997.

85
Crunching the NumbersIn this section, you will begin by looking at the distribution of price to book ratios
across companies in the United States and then consider differences in price to book ratiosacross sectors. Finally, you will generate a portfolio of stocks that have the lowest price tobook ratios in the market, with the intention of taking a closer look at these stocks in thenext section.
Distribution of Price to Book Ratios across the marketTo get a sense of what comprises a high, low or average price to book value ratio, the
ratio was computed for every firm listed in the United States and Figure 4.4 summarizes thedistribution of price to book ratios in October 2002.
0
100
200
300
400
500
600
700
0-0.
25
0.25
-0.5
0.5-
0.75
0.75
-1
1-1.
25
1.25
-1.5
1.5-
1.75
1.75
-2
2-2.
5
2.5-
3
3-4
4-5
5-1
0
>10
Figure 4.4: Price to Book Ratios : U.S. Companies - October 2002
More than 2000 firms trade at less than book value
More than 600 firms trade at more than 4 times book value
Data from Value Line. The number of firms in the U.S. market that trade in each price to book
ratio class is reported.
The average price to book ratio across all U.S. stocks in October 2002 was 3.05, but thisnumber is skewed by the presence of about 600 firms that trade at price to book ratios thatexceed 4. A more meaningful measure is the median price to book ratio of 1.30; roughlyhalf of all U.S. firms trade at price to book ratios that are less than this value.
Another point worth making about price to book ratios is that there are firms withnegative book values of equity – the result of continuously losing money – where price to

86
book ratios cannot be computed. In this sample of 7102 firms, there were 1229 firms wherethis occurred. In contrast, though, 2045 firms had negative earnings and PE ratios could notbe computed for them.
Price to Book Ratios by SectorPrice to book ratios vary widely across different sectors of the market. In some
sectors, a large percent of stocks trade at below book value. In others, it is not uncommon tosee stocks trading at 5 to 10 times book value. To examine differences in price to bookratios across sectors, the average price to book ratio was computed, by sector, for all firms inthe United States in October 2002. Table 4.2 lists the ten sectors with the highest and lowestprice to book ratios:
Table 4.2: Sectors with the Highest and Lowest Price to Book RatiosLowest Price to Book Sectors Highest Price to Book Sectors
Industry Name Price to Book Industry Name Price to BookPower 0.30 Biotechnology 4.27Investment Co. (Foreign) 0.63 Educational Services 4.50Maritime 0.74 Trucking/Transp. Leasing 4.51Entertainment 0.83 Information Services 4.83Electric Utility (West) 0.86 Pharmacy Services 4.84Steel (Integrated) 0.87 Drug 5.84R.E.I.T. 0.89 Medical Supplies 5.85Foreign Telecom. 0.94 Beverage (Alcoholic) 6.04Textile 0.98 Beverage (Soft Drink) 6.67Tire & Rubber 0.99 Household Products 7.99
Why are there such large differences across sectors? The answer lies in the earlier analysisof the fundamentals that determine price to book ratios. In particular, you should expect thatcompanies with high risk, low growth and, most importantly, low returns on equity to tradeat low price to book ratios. In table 4.3, the average returns on equity, expected growth ratesand market debt to capital ratios for the ten sectors with the highest and lowest price to bookratios are presented.
Table 4.3: Fundamentals of low price to book versus high price to book sectorsROE Beta Debt to Capital Expected growth rate
Low PBV Sectors 1.90% 0.93 50.99% 12.28%

87
High PBV Sectors 13.16% 0.89 10.33% 20.13%
The results conform to expectations. The sectors with the lowest price to book ratios haveaverage returns on equity well below those of the sectors with the highest price to bookratios, are exposed to more risk (especially financial leverage) and have much lowerprojected growth rates. In other words, there are good reasons why there are largedifferences in price to book ratios across sectors.
There is one more point that needs to be made about price to book ratios. Sincebook values are based upon accounting judgments, it should come as no surprise that thehighest price to book ratios are in sectors where the most important assets are kept off thebooks. In particular, the expensing of research and development expenses at biotechnologyand drug companies results in an book values being understated at these firms. Forbeverage and household product companies, the most important asset is often brand name,which is both intangible and not reflected in balance sheets. This, in turn, may explain whythese companies report high returns on equity and trade at high price to book ratios.
A Low Price to Book PortfolioIf you picked the stocks that trade at the lowest price to book ratios in the market,
what would you portfolio look like? To answer this question, all listed stocks in the UnitedStates in October 2002 that had a traded price available for them and positive book values ofequity were examined. The price to book ratios were computed for each of the firms in thissample of 5883 firms, The 195 firms that trade at less than 40% of their book value ofequity are listed in Table 4.4.

88
Table 4.4; Stocks with the lowest price to book ratios: October 2002 – United StatesCompany Name Price/BV Company Name Price/BV Company Name Price/BV Company Name Price/BVSpectraSite Hldgs Inc 0.01 Digital Lightwave 0.33 SonicWALL Inc 0.35 TTM Technologies Inc 0.42WorldCom Inc. 0.01 Net Perceptions Inc 0.32 Discovery Partners Intl Inc 0.40 Oglebay Norton Co. 0.42Vina Technologies Inc 0.18 PECO II Inc 0.16 Integrated Silicon Solution 0.37 Standard Management Corp 0.43Jupiter Media Metrix Inc 0.11 Ventiv Health Inc 0.26 Quanta Services 0.15 Chart Industries 0.43Metawave Communications Corp 0.08 Lexent Inc 0.35 REMEC Inc 0.40 Technology Solutions 0.43Beacon Power Corp 0.20 Travis Boats & Motors Inc. 0.14 eXcelon Corp 0.39 Tweeter Home 0.43DDi Corp 0.07 AES Corp. 0.09 CyberOptics 0.32 Captaris Inc 0.43Mississippi Chem Corp. 0.05 NMS Communications Corp 0.24 Olympic Steel Inc. 0.28 Net2Phone Inc 0.44Sorrento Networks Corp 0.14 EOTT Energy Partners-LP 0.26 McDermott Int'l 0.29 Resonate Inc 0.44BackWeb Technologies Ltd 0.14 Ceres Group Inc 0.28 Qwest Communic. 0.12 Chartered Semiconductor Mfg 0.44Leap Wireless Intl Inc 0.02 ACT Teleconferencing 0.37 Metris Cos. 0.15 Massey Energy 0.44SBA Communications Corp 0.02 Atlas Air Inc 0.14 Trans World Entertain 0.28 Oregon Steel Mills 0.44TranSwitch Corp. 0.10 MetaSolv Inc 0.26 DiamondCluster Intl Inc 0.26 Caliper Technologies Corp 0.44iBasis Inc 0.14 Management Network Grp Inc. 0.35 Dixie Group 0.37 Pinnacle Entertainment Inc 0.44Alamosa Hldgs Inc 0.05 Sapient Corp. 0.37 Sierra Wireless Inc 0.36 Proxim Corp Cl A 0.44UbiquiTel Inc 0.13 Electroglas Inc. 0.15 FPIC Insurance 0.37 Innotrac Corp 0.44Inktomi Corp 0.09 SatCon Technololgy 0.38 Alcatel ADR 0.20 R.J. Reynolds Tobacco 0.44Cylink Corp 0.31 KANA Software Inc 0.36 Park-Ohio 0.33 SportsLine.com Inc. 0.45ATS Medical 0.10 Pegasus Communications 0.29 Aquila Inc. 0.26 Sonus Networks Inc 0.45T/R Systems Inc 0.20 SIPEX Corp. 0.22 Integrated Elect. Svcs 0.28 Stolt-Nielsen ADR 0.45AHL Services 0.09 Factory 2-U Stores Inc 0.21 AAR Corp. 0.40 JNI Corp 0.45724 Solutions Inc 0.16 Aspen Technology Inc. 0.24 Milacron Inc. 0.33 Point 360 0.45Gilat Satellite 0.05 America West Hldg 0.08 HEALTHSOUTH Corp. 0.38 Books-A-Million 0.45Critical Path 0.35 Mail-Well Inc. 0.28 Hi/fn Inc 0.38 Cirrus Logic 0.45Petroleum Geo ADR 0.05 Pantry Inc. 0.26 MPS Group 0.35 Zygo Corp. 0.46Genaissance Pharmaceuticals 0.19 Armstrong Holdings 0.07 Three-Five Sys. 0.37 Edge Petroleum 0.46Synavant Inc 0.16 Mirant Corp. 0.08 Sierra Pacific Res. 0.32 Fleming Cos. 0.46Evergreen Solar Inc 0.12 Ditech Communications Corp 0.23 Allegheny Energy 0.20 Goodyear Tire 0.47Therma-Wave Inc 0.08 eBenX Inc 0.37 Advanced Micro Dev. 0.34 Callon Pete Co 0.47Corvis Corp 0.27 Analysts Int'l 0.35 Applica Inc 0.39 PDI Inc. 0.47Finisar Corp 0.13 Quovadx Inc 0.27 United Rentals 0.35 IMCO Recycling 0.47Airspan Networks Inc 0.15 Aclara Biosciences Inc 0.37 Cont'l Airlines 0.27 Chesapeake Corp. 0.47Seitel Inc. 0.07 Metalink Ltd 0.34 Bally Total Fitness 0.39 Docent Inc 0.47i2 Technologies 0.23 Value City Dept Strs 0.28 AmeriCredit Corp. 0.37 Salton Inc. 0.47Mobility Electronics Inc 0.37 QuickLogic Corp 0.34 Gentiva Health Services Inc 0.32 DigitalThink Inc 0.48Time Warner Telecom Inc 0.09 Corning Inc. 0.26 Allmerica Financial 0.18 RSA Security 0.49Vascular Solutions Inc 0.28 Artesyn Technologies Inc 0.28 Sea Containers Ltd. 'A' 0.37 Deltagen Inc 0.49Optical Communication Prods 0.39 Digi Int'l 0.35 Avnet Inc. 0.30 Applied Extrusion Tech. 0.49Allegiance Telecom 0.15 MicroFinancial Inc 0.20 Dura Automotive 'A' 0.36 Vignette Corp 0.49SMTC Corp 0.14 Calpine Corp. 0.28 Westar Energy 0.39 Marimba Inc 0.49Dynegy Inc. 'A' 0.06 EXFO Electro-Optical Engr 0.25 Delta Air Lines 0.28 TELUS Corporation 0.49Charter Communications Inc 0.15 MasTec Inc. 0.30 Carpenter Technology 0.38 Arris Group Inc 0.50Lucent Technologies 0.24 Hypercom Corp 0.37 TXU Corp. 0.38 MSC.Software 0.50U.S. Energy Sys Inc 0.31 Champion Enterprises 0.39 Integrated Information Sys 0.22 answerthink inc 0.50Braun Consulting Inc 0.32 Tesoro Petroleum 0.15 Click Commerce Inc 0.25 Ascential Software 0.50Latitude Communications Inc 0.24 Hawk Corp 0.32 G't Atlantic & Pacific 0.41 CNH Global N.V. 0.50AXT Inc 0.13 Spectrian Corp. 0.24 XETA Corp. 0.41 Maxtor Corp 0.50Digital Generation Sys 0.34 Trenwick Group Ltd 0.35 Interface Inc. 'A' 0.41Titanium Metals 0.10 GlobespanVirata Inc. 0.26 RWD Technologies 0.41Pemstar Inc 0.22 Spartan Stores Inc 0.22 Descartes Sys Group Inc 0.42

89
The Rest of the StoryThere are stocks that trade at low prices, relative to book value, that are not under
valued. As noted earlier in the chapter, low price to book ratios can be attributed to high riskor low returns on equity. In this section, you will consider the characteristics of the stocks inthe low price to book portfolio and examine potential problems for investment strategies.
High Risk StocksIs it possible that the higher returns earned by low price to book stocks can be
explained by the fact that they are riskier than average? Some of the studies referenced inthe last section attempted to test for this hypothesis by computing returns adjusted for risk –excess returns. The earlier ones did so by estimating the betas and returns after adjustingfor differences in betas for low price to book stocks and concluded that these stocks stillmade excess returns. Thus, stocks with low price to book value ratios earn excess returnsrelative to high price to book stocks, if you use conventional measures of risk and return,such as betas.
In recent years, other researchers have argued that these conventional measures ofrisk are imperfect and incomplete. Low price-book value ratios may operate as a measure ofrisk, since firms with prices well below book value are more likely to be in financial troubleand go out of business. Investors therefore have to evaluate whether the additional returnsmade by such firms justifies the additional risk taken on by investing in them.
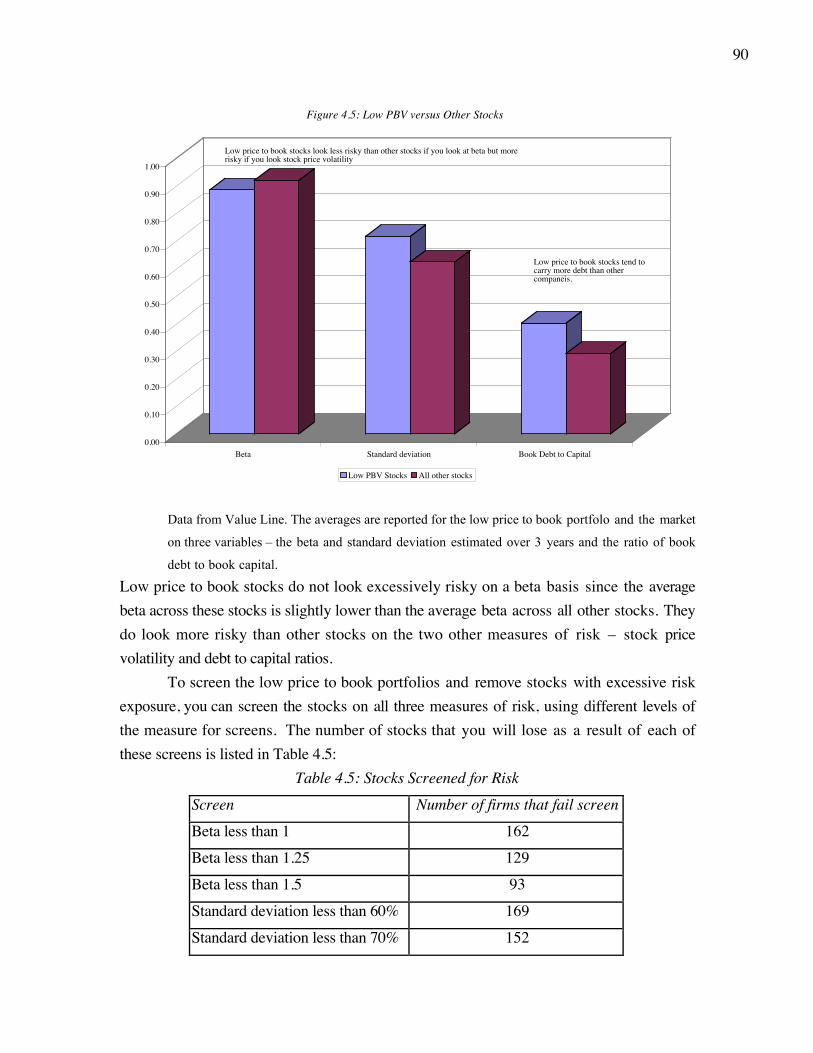
In Figure 4.5, you compare how stocks in the low price to book ratio portfolio thatyou constructed at the end of the last section measure up against the rest of the market onthree measures of risk.
• Beta: Beta operates as a standardized measure of how a stock moves with themarket. A beta greater than one indicates a stock with above-average risk.
• Standard deviation in stock prices over the past 3 years: Unlike beta, whichmeasures how a stock moves with the market, the standard deviation is ameasure of stock price volatility.
• Ratio of total debt to book value of capital: This is computed by dividing thetotal book value debt (short term and long term) by the book value of bothdebt and equity (capital). It is a measure of how much a firm owes and is ofimportance if you are concerned about distress and bankruptcy.
90
Data from Value Line. The averages are reported for the low price to book portfolo and the market
on three variables – the beta and standard deviation estimated over 3 years and the ratio of book
debt to book capital.
Low price to book stocks do not look excessively risky on a beta basis since the averagebeta across these stocks is slightly lower than the average beta across all other stocks. Theydo look more risky than other stocks on the two other measures of risk – stock pricevolatility and debt to capital ratios.
To screen the low price to book portfolios and remove stocks with excessive riskexposure, you can screen the stocks on all three measures of risk, using different levels ofthe measure for screens. The number of stocks that you will lose as a result of each ofthese screens is listed in Table 4.5:
Table 4.5: Stocks Screened for RiskScreen Number of firms that fail screenBeta less than 1 162Beta less than 1.25 129Beta less than 1.5 93Standard deviation less than 60% 169Standard deviation less than 70% 152
0.00
0.10
0.20
0.30
0.40
0.50
0.60
0.70
0.80
0.90
1.00
Beta Standard deviation Book Debt to Capital
Figure 4.5: Low PBV versus Other Stocks
Low PBV Stocks All other stocks
Low price to book stocks look less risky than other stocks if you look at beta but more risky if you look stock price volatility
Low price to book stocks tend to carry more debt than other companeis.

91
Standard deviation less than 80% 127Debt ratio less than 50% 61Debt ratio less than 60% 47Debt ratio less than 70% 21
A large number of the 195 stocks in the portfolio, are lost when the standard deviation andbeta screens are employed. Fewer firms are lost with a debt to capital ratio screen. If youadopt a composite risk measure that includes all three screens - stocks with betas that areless than 1.5, standard deviations in stock prices that are lower than 80% and debt to capitalratios smaller than 70%- the number of stocks in the low price to book portfolio drops to 51stocks.
Low Priced StocksStocks that trade at low price to book ratios often do so because their stock prices
have dropped precipitously. It should come as no surprise that a large number of low priceto book ratio stocks trade at very low prices and that many trade at less than a dollar pershare. Why would this matter? The transactions costs associated with buying stocks thattrade at low prices is often much higher than average or high priced stocks for threereasons:
a. The brokerage costs associated with buying stocks is generally a fixed cost for evenlots (lots of 100 shares) and this cost will increase as a percent of the investment asstock prices drop. If you trade through a broker who charges you $ 30 for an evenlot trade, the brokerage commission would increase from .3% of your investment, ifyou were buying 100 shares at $ 100 per share, to 3% if you were buying 100shares at $ 10 per share to 30% if you were buying 100 shares at $ 1 per share.Institutional and individual investors may be able to negotiate a reduction inbrokerage costs as they increase the number of shares they buy but the costs willstill increase as stock prices drop.
b. As stock prices drop below a certain level, institutional investors will often abandona stock. This will reduce the liquidity in the stock and increase the price impact thatyou have when you trade a stock. You will push up the stock price as you buy anddown as you sell, even with small trades.
c. The spread between the bid price (at which you can sell the stock) and the ask price(at which you can buy) tends to become a larger percent of the stock price as theprice drops. The loss of liquidity as investors flee the stock exacerbates the problem.

92
How big are the transactions costs associated with buying low priced stock? If you considerall three components of the cost – the commissions, the bid-ask spread and the price impact,the – the total costs can easily exceed 25% of your investment for stock trading at less thanone dollar and 15% for stock trading at less than two dollars. Since you can spread thesecosts out over time, the drag on your returns will be smaller the longer your time horizon.An investor with a ten-year horizon, for instance, will be able to spread the cost over tenyears, making a 25% up-front cost into a 2.5% cost per year.
The portfolio of low price to book stocks is examined in Figure 4.6, with stockscategorized based upon price levels, and the number of stocks that trade at different pricelevels is reported:
Data from Value Line. Many institutional investors avoid stocks that trade at less than $ 5 per
share, because the transactions costs are so high.
Note that 50 stocks, roughly a quarter of the entire portfolio, trade at less than a dollar ashare and another 50 stocks trade at between $ 1 and $ 2. If you invested in this portfolio,you would face substantial transactions costs and it is likely that these costs will wipe outany advantages to this strategy, at least in the short term.
It does make sense to screen the stocks in this portfolio for stock price levels. InTable 4.6, the number of companies that would survive a variety of price screens in the lowprice to book portfolio are listed.
0
5
10
15
20
25
30
35
Num
ber o
f sto
cks
< $0.50 $0.50-$1 $1 - $1.50 $ 1.50-$2 $ 2-$3 $3-$4 $4-$5 > $5Price Range
Figure 4.6: Price per share - Low PBV Portfolio
More than half the stocks in the portfolio trade for less than $ 2 a share. Only 33 firms trade at more than $ 5 a share.

93
Table 4.6: Price level Screens and low Price to Book StocksScreen Number of firms that fail screenPrice greater than $ 10 186Price greater than $ 5 160Price greater than $ 2 104
Which of these screens should you adopt? Your screens will have to become stricter (higherstock price minimums) as your time horizon becomes shorter. Assuming a five-year timehorizon, you should use at least a $ 2 minimum price screen. Consolidating this screen withthe risk screens in the last section, the portfolio of 195 stocks that you began the analysiswith would have dropped to 39 firms.
Poor Projects: Low Return on EquityThe most significant limitation of a strategy of buying low price to book value
stocks is that the low book value multiples may be well deserved if companies earn and areexpected to continue earning low returns on equity. In fact, the relationship between price tobook value ratios and returns on equity was considered earlier in this chapter. Stocks withlow returns on equity should trade a low price to book value ratios. In summary, then, as aninvestor you would want stocks with low price to book ratios that also had reasonable (if nothigh) returns on equity and limited exposure to risk.
Considering the low price to book portfolio of 195 stocks again, the returns onequity at these companies in the most recent year were examined. Figure 4.7 presents thedistribution of returns on equity across these stocks:

94
0
10
20
30
40
50
60
70
80
Num
ber o
f firm
s
< -20% -20 to -15% -15 to -10% -10% to -5% -5% to 0% 0% to 5% 5% to 10% 10% to 15% 15% to 20% >20%Return on Equity in most recent year
Figure 4.7: ROE for low Price to Book Stocks
More than two-thirds of the companies in the portfolio lost money, leading to negative returns on equity.
Data from Value Line. The return on equity for each company is computed by dividing the net
income in the most recent four quarters by the book value of equity at the beginning of the year.
It is quite clear that a large number of stocks in this portfolio are coming off awoeful earnings year. In fact, 143 of the 198 firms had negative returns on equity and 71 ofthese firms had returns on equity that were –20% or worse. If you compare the returns onequity on these firms to the average return on equity (of about 10%) for the entire U.S.market, only 15 firms in the sample did better than average. It is true that one year’s returnon equity can be misleading, especially when the most recent financial year (2001) was arecession year. You could have looked at average returns on equity over the last five years,but it is unlikely to change the overall conclusion. Stocks with low price to book ratios tradeat the levels they do because they have low or negative returns on equity.
Any investor interested in a low price to book strategy would be well servedapplying a return on equity test to the portfolio. Table 4.7 summarizes the number of stocksthat would have made the cut with a number of return on equity screens:
Table 4.7: Return on Equity Screens and low Price to Book StocksScreen Number of firms that fail screen
ROE greater than 0% 143
ROE greater than 5% 171
95
ROE greater than 10% 180
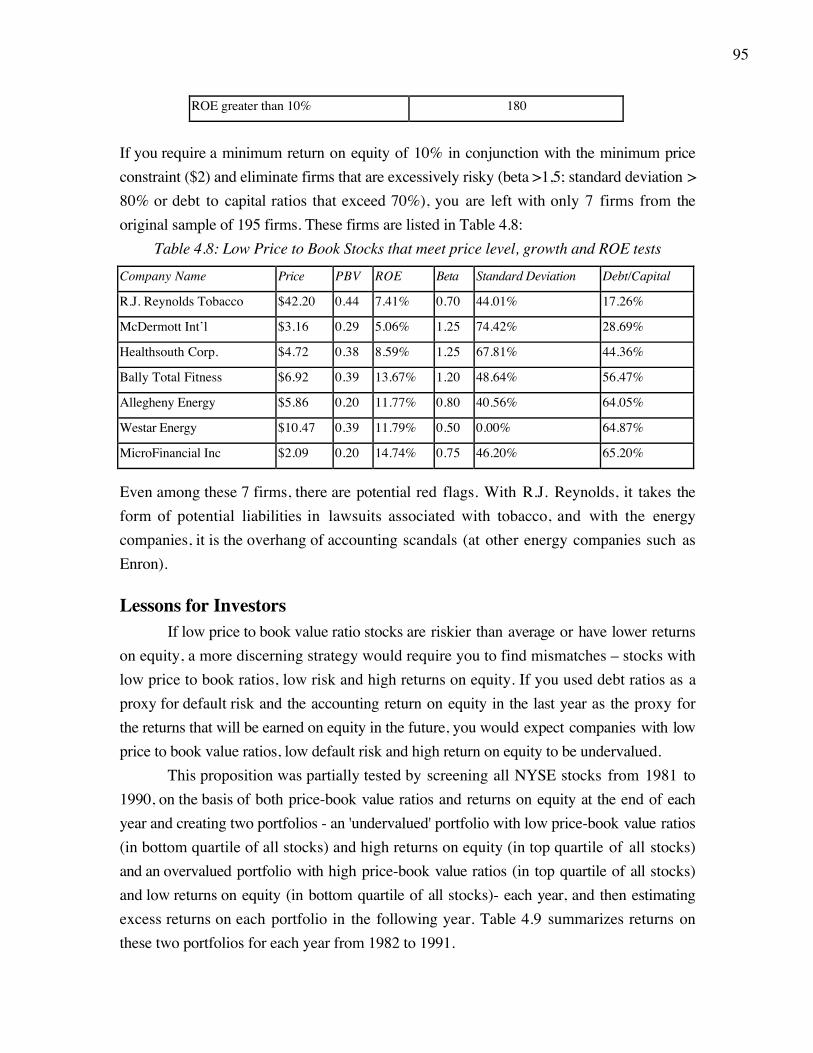
If you require a minimum return on equity of 10% in conjunction with the minimum priceconstraint ($2) and eliminate firms that are excessively risky (beta >1,5; standard deviation >80% or debt to capital ratios that exceed 70%), you are left with only 7 firms from theoriginal sample of 195 firms. These firms are listed in Table 4.8:
Table 4.8: Low Price to Book Stocks that meet price level, growth and ROE testsCompany Name Price PBV ROE Beta Standard Deviation Debt/Capital
R.J. Reynolds Tobacco $42.20 0.44 7.41% 0.70 44.01% 17.26%
McDermott Int’l $3.16 0.29 5.06% 1.25 74.42% 28.69%
Healthsouth Corp. $4.72 0.38 8.59% 1.25 67.81% 44.36%
Bally Total Fitness $6.92 0.39 13.67% 1.20 48.64% 56.47%
Allegheny Energy $5.86 0.20 11.77% 0.80 40.56% 64.05%
Westar Energy $10.47 0.39 11.79% 0.50 0.00% 64.87%
MicroFinancial Inc $2.09 0.20 14.74% 0.75 46.20% 65.20%
Even among these 7 firms, there are potential red flags. With R.J. Reynolds, it takes theform of potential liabilities in lawsuits associated with tobacco, and with the energycompanies, it is the overhang of accounting scandals (at other energy companies such asEnron).
Lessons for InvestorsIf low price to book value ratio stocks are riskier than average or have lower returns
on equity, a more discerning strategy would require you to find mismatches – stocks withlow price to book ratios, low risk and high returns on equity. If you used debt ratios as aproxy for default risk and the accounting return on equity in the last year as the proxy forthe returns that will be earned on equity in the future, you would expect companies with lowprice to book value ratios, low default risk and high return on equity to be undervalued.
This proposition was partially tested by screening all NYSE stocks from 1981 to1990, on the basis of both price-book value ratios and returns on equity at the end of eachyear and creating two portfolios - an 'undervalued' portfolio with low price-book value ratios(in bottom quartile of all stocks) and high returns on equity (in top quartile of all stocks)and an overvalued portfolio with high price-book value ratios (in top quartile of all stocks)and low returns on equity (in bottom quartile of all stocks)- each year, and then estimatingexcess returns on each portfolio in the following year. Table 4.9 summarizes returns onthese two portfolios for each year from 1982 to 1991.

96
Table 4.9: Returns on Mismatched Portfolios: Price to Book and ROE
Year Undervalued Portfolio Overvalued Portfolio S & P 500
1982 37.64% 14.64% 40.35%
1983 34.89% 3.07% 0.68%
1984 20.52% -28.82% 15.43%
1985 46.55% 30.22% 30.97%
1986 33.61% 0.60% 24.44%
1987 -8.80% -0.56% -2.69%
1988 23.52% 7.21% 9.67%
1989 37.50% 16.55% 18.11%
1990 -26.71% -10.98% 6.18%
1991 74.22% 28.76% 31.74%
1982-91 25.60% 10.61% 17.49%
The undervalued portfolios significantly outperformed the overvalued portfolios in eight outof ten years, earning an average of 14.99% more per year between 1982 and 1991, and alsohad an average return significantly higher than the S&P 500. While default risk was notadjusted for in this test, you could easily add it as a third variable in the screening process.
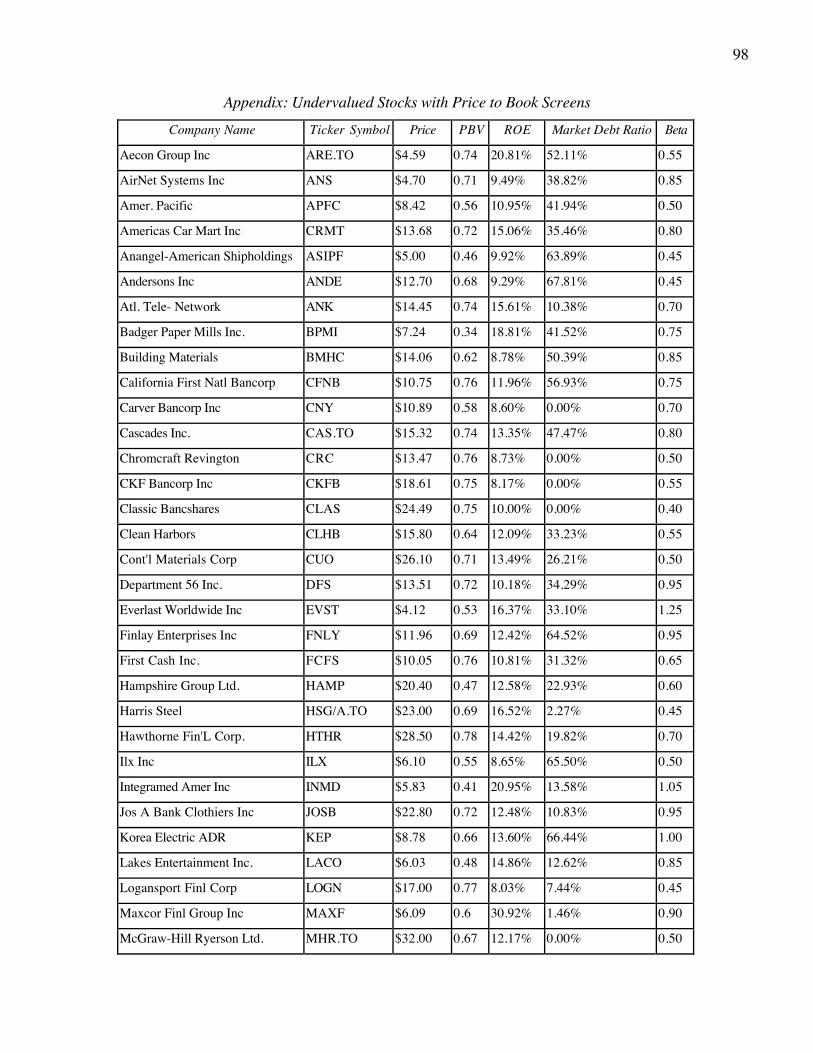
Going back the entire sample of stocks, a series of screens were constructed todevise a portfolio that meets multiple criteria in October 2002:Step 1: Only stocks with price to book ratios that were less than 0.80 were considered. Thisscreen is a little looser than the one used to get the 195 stocks in the previous section but itallows you to use tighter screens for risk and return on equity.Step 2: To control for risk, all firms that have betas greater than 1.5 or debt to capital ratios(in market value terms) that exceeded 70% were eliminated. The market value test wasadopted instead of the book value test because it is a stricter test for these stocks where themarket value of equity is less than the book value of equity. Screening for stocks with lowstandard deviations was considered but relatively few firms were eliminated. Hence, thisscreen was not included.Step 3: To control for price level, all firms that trade at prices less than $3 were eliminated.This test again is slightly stricter than the $2 minimum price level test that was used in thelast section, but it will reduce the overall transactions costs of the strategy.Step 4: To screen for a minimum return on equity, all firms that had returns on equity ofless than 8% in the most recent financial year were eliminated. This is looser than the 10%screen used in the prior section.
97
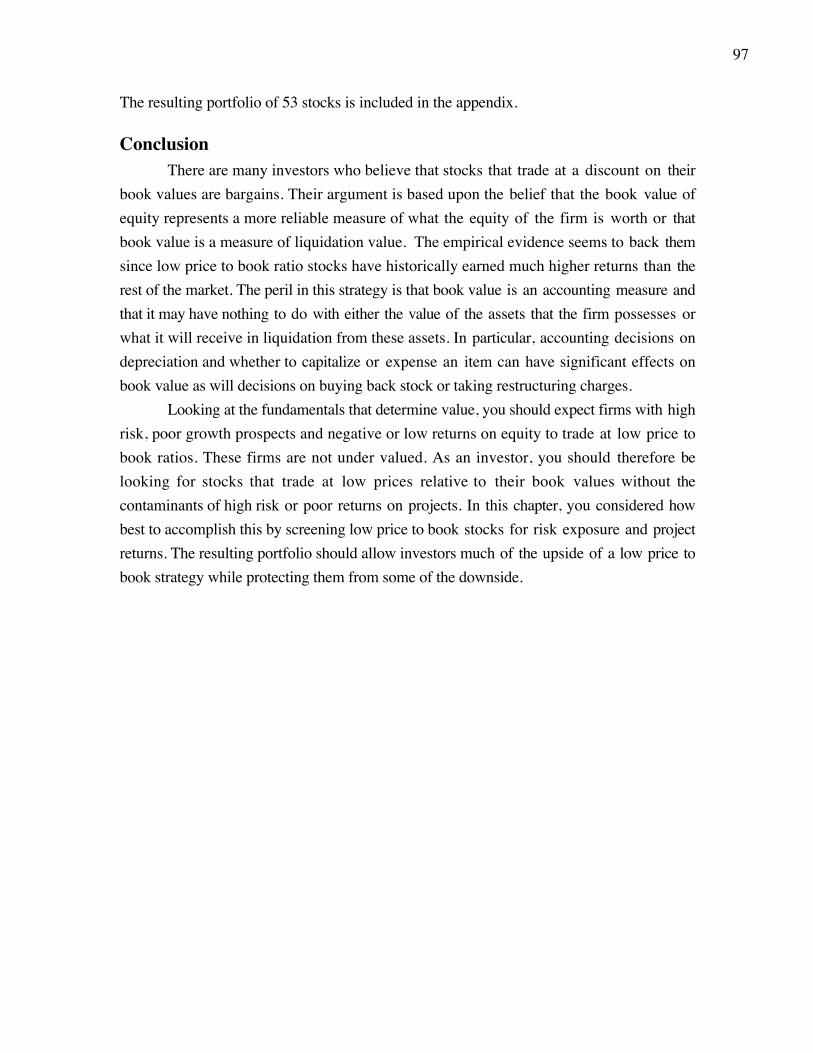
The resulting portfolio of 53 stocks is included in the appendix.
ConclusionThere are many investors who believe that stocks that trade at a discount on their
book values are bargains. Their argument is based upon the belief that the book value ofequity represents a more reliable measure of what the equity of the firm is worth or thatbook value is a measure of liquidation value. The empirical evidence seems to back themsince low price to book ratio stocks have historically earned much higher returns than therest of the market. The peril in this strategy is that book value is an accounting measure andthat it may have nothing to do with either the value of the assets that the firm possesses orwhat it will receive in liquidation from these assets. In particular, accounting decisions ondepreciation and whether to capitalize or expense an item can have significant effects onbook value as will decisions on buying back stock or taking restructuring charges.
Looking at the fundamentals that determine value, you should expect firms with highrisk, poor growth prospects and negative or low returns on equity to trade at low price tobook ratios. These firms are not under valued. As an investor, you should therefore belooking for stocks that trade at low prices relative to their book values without thecontaminants of high risk or poor returns on projects. In this chapter, you considered howbest to accomplish this by screening low price to book stocks for risk exposure and projectreturns. The resulting portfolio should allow investors much of the upside of a low price tobook strategy while protecting them from some of the downside.
98
Appendix: Undervalued Stocks with Price to Book ScreensCompany Name Ticker Symbol Price PBV ROE Market Debt Ratio Beta
Aecon Group Inc ARE.TO $4.59 0.74 20.81% 52.11% 0.55
AirNet Systems Inc ANS $4.70 0.71 9.49% 38.82% 0.85
Amer. Pacific APFC $8.42 0.56 10.95% 41.94% 0.50
Americas Car Mart Inc CRMT $13.68 0.72 15.06% 35.46% 0.80
Anangel-American Shipholdings ASIPF $5.00 0.46 9.92% 63.89% 0.45
Andersons Inc ANDE $12.70 0.68 9.29% 67.81% 0.45
Atl. Tele- Network ANK $14.45 0.74 15.61% 10.38% 0.70
Badger Paper Mills Inc. BPMI $7.24 0.34 18.81% 41.52% 0.75
Building Materials BMHC $14.06 0.62 8.78% 50.39% 0.85
California First Natl Bancorp CFNB $10.75 0.76 11.96% 56.93% 0.75
Carver Bancorp Inc CNY $10.89 0.58 8.60% 0.00% 0.70
Cascades Inc. CAS.TO $15.32 0.74 13.35% 47.47% 0.80
Chromcraft Revington CRC $13.47 0.76 8.73% 0.00% 0.50
CKF Bancorp Inc CKFB $18.61 0.75 8.17% 0.00% 0.55
Classic Bancshares CLAS $24.49 0.75 10.00% 0.00% 0.40
Clean Harbors CLHB $15.80 0.64 12.09% 33.23% 0.55
Cont'l Materials Corp CUO $26.10 0.71 13.49% 26.21% 0.50
Department 56 Inc. DFS $13.51 0.72 10.18% 34.29% 0.95
Everlast Worldwide Inc EVST $4.12 0.53 16.37% 33.10% 1.25
Finlay Enterprises Inc FNLY $11.96 0.69 12.42% 64.52% 0.95
First Cash Inc. FCFS $10.05 0.76 10.81% 31.32% 0.65
Hampshire Group Ltd. HAMP $20.40 0.47 12.58% 22.93% 0.60
Harris Steel HSG/A.TO $23.00 0.69 16.52% 2.27% 0.45
Hawthorne Fin'L Corp. HTHR $28.50 0.78 14.42% 19.82% 0.70
Ilx Inc ILX $6.10 0.55 8.65% 65.50% 0.50
Integramed Amer Inc INMD $5.83 0.41 20.95% 13.58% 1.05
Jos A Bank Clothiers Inc JOSB $22.80 0.72 12.48% 10.83% 0.95
Korea Electric ADR KEP $8.78 0.66 13.60% 66.44% 1.00
Lakes Entertainment Inc. LACO $6.03 0.48 14.86% 12.62% 0.85
Logansport Finl Corp LOGN $17.00 0.77 8.03% 7.44% 0.45
Maxcor Finl Group Inc MAXF $6.09 0.6 30.92% 1.46% 0.90
McGraw-Hill Ryerson Ltd. MHR.TO $32.00 0.67 12.17% 0.00% 0.50

99
National Sec Group Inc NSEC $14.88 0.68 9.20% 5.30% 0.50
Northwest Pipe Co NWPX $14.46 0.78 9.39% 40.70% 0.50
Novamerican Steel TONS $6.84 0.51 8.04% 59.92% 0.40
Nutraceutical Intl NUTR $9.75 0.49 10.75% 23.32% 0.95
O.I. Corp. OICO $4.06 0.73 12.65% 0.00% 0.40
Ohio Casualty OCAS $13.19 0.64 12.19% 0.00% 0.75
Old Dominion Freight ODFL $25.48 0.65 8.71% 33.98% 0.60
Paulson Capital PLCC $4.80 0.49 21.24% 0.09% 0.95
PC Mall Inc MALL $4.05 0.48 10.19% 9.75% 1.45
Q.E.P. Company Inc QEPC $4.06 0.56 8.94% 65.75% 0.60
Racing Champions RACN $15.50 0.63 12.84% 23.29% 1.35
Reitmans (Canada) Ltd. RET.TO $23.50 0.79 11.94% 0.00% 0.45
Seaboard Corp. SEB $230.00 0.59 10.11% 52.75% 0.65
Sportsmans Guide Inc SGDE $7.17 0.56 16.84% 0.04% 0.95
Stackpole Ltd. SKD.TO $23.05 0.75 9.11% 11.99% 0.75
Stratasys Inc SSYS $8.30 0.66 8.02% 5.66% 0.75
Supreme Inds Inc. STS $4.50 0.72 8.91% 25.87% 0.80
Todd Shipyard Cp Del TOD $14.20 0.67 10.63% 0.00% 0.50
Todhunter Int'l THT $10.70 0.7 10.13% 51.57% 0.40
Tommy Hilfiger TOM $7.28 0.77 8.98% 48.50% 1.30
United Auto Group UAG $13.37 0.67 8.67% 65.84% 1.20