Embed Size (px)
Citation preview

80
CHAPTER 4
INCREASE IN CRITICAL CLEARING TIME USING
SVC AND STATCOM IN TNEB
4.1 INTRODUCTION
The preliminary study conducted to evaluate the potential due to
the application of SVC and STATCOM on the TNEB 400 kV transmission
network, generators and their respective step-up transformers directly
connected to 400 kV substations in Tamil Nadu and nearby 400 kV
substations (Trivendrum, Chittoor etc.,) is presented in this chapter. The study
compares the results and effectiveness of SVC and STATCOM for enhancing
the transient stability of the system through the critical clearing time using
MiPower simulation software. The fault clearing time is increased up to the
critical clearing time to test the robustness of the system and the effectiveness
of the SVC and STATCOM.
4.2 LITERATURE REVIEW
An occurrence of three phase fault on the bus and clearance of the
fault within a short period of time (up to 100 ms) does not represent a large
risk to the power system in terms of transient stability. For this reason, it is
necessary to ensure that generators operating in the electric power system
have a critical clearing time higher than 100 ms.
The electric power system instability can be interpreted using
various methods depending on the system configuration and operational

81
status. Traditionally, the question of stability has been connected to maintain
synchronous operations. The production of electricity is secured primarily
using synchronous generators. For this reason, it is important to secure their
synchronism and therefore the question of stability has mainly hinged on the
transient stability of synchronous machinery and on the relationship between
the active power and the rotor angle of the generator. Electric power system
instability can also appear even if synchronous operation of the generators is
not interrupted (Eleschova et al 2010).
On 1st July 1957, TNEB came into being and has remained as the
energy provider and distributor all these years. During the period, the
Government has extended the electrical network to all villages and towns
throughout the state. After fifty three years of journey, on 1st November
2010, TNEB restructured itself into TNEB Limited, Tamil Nadu Generation
and Distribution Corporation (TANGEDCO) Limited and Tamil Nadu
Transmission Corporation (TANTRANSCO) Limited. Ministry of
Power, Government of India, has planned to supply “Power for all by 2012”.
To achieve this, TANGEDCO Limited is making progress in generation and
distribution sector. TNEB limited has completed the electrification of all
villages and towns. To satisfy the energy needs of the state, TANGEDCO
Limited has installed generating stations of capacity 10, 214 MW which
includes state, central share and independent power producers. Besides, the
state has installations in renewable energy sources like windmill up to 5400
MW. Due to the astronomical increase in the energy demand in future, the
state has proposed new generation projects for the next five years.
TANTRANSCO Limited has a total of 1309 substations with
HT(High Tension) and EHT(Extra High Tension) lines to a length of 1.69
lakh km. The voltage levels in use in TANTRANSCO Limited are 400 kV,
82
230 kV, 110 kV and 66 kV. In order to evacuate bulk power from one region
to another region, there is more scope for enhancing the transmission
capability to 765 kV level and setting up of 800 kV High Voltage DC system.
The Government of India has approved nondiscriminatory open access for the
transmission system. The Government of Tamil Nadu has also permitted third
party sale of power produced by independent power producer (IPPs), captive
power plants (CPPs) and other private power producers through short term
intra-state open access to HT consumers within Tamil Nadu. TANGEDCO
has a consumer base of about 212.76 lakh consumers. 100% rural
electrification has been achieved. Per Capita consumption of Tamil Nadu is
1080 Units. To achieve reliable and quality power supply, and to minimize
the loss of energy, Ministry of Power, Government of India, has launched the
restructured APDRP (Accelerated Power Development and Reform Program)
scheme under the eleventh five year plan (www.cea.nic.in\reports\planning\
power_scenario.pdf.).
4.3 PROBLEM STATEMENT
Load growth, equipment outage, unplanned maintenance, aging of
substation equipment and increasing stress on grid leads poor voltage profile,
network overloading, increase in losses and thermal damage of the equipment.
A better method to improve the utilization ratio of the existing electric
network is expected. As the awareness of environmental protection is
increasing, it becomes critical that the existing transmission and distribution
resources can be fully utilized. As the system network grows in complexity
and load consumption continues to increase, interface loading conditions are
expected to worsen, resulting in more acute transient problem and may lead to
disasters and blackouts, which have not only huge commercial loss, but also
needs high restoring time. Here, Tamil Nadu 400 kV transmission network
83
and nearby interconnected 400 kV substations (Trivendrum, Chittoor etc.) are
considered for the study. This has prompted the need to consider broad
utilization of FACTS technology, including SVC and STATCOM. SVC and
STATCOM can be inserted independently in the TNEB system to achieve
control function including enhancement of the transient stability using
MiPower simulation software.
4.4 GENERAL REPRESENTATION OF SVC AND STATCOM
The representation of both SVC and STATCOM are discussed in
sections 2.5 and 3.4 respectively. The SVC and STATCOM model used here
is shown in Figures 4.1 and 3.2 respectively.
4.5 TNEB 400 kV TRANSMISSION NETWORK
Tamil Nadu 400 kV transmission network and nearby
interconnected substations (Trivendrum, Chittoor etc.) are considered for the
purpose of identifying the critical clearing time at all 400 kV buses to ensure
rapid fault clearance and thereby maintaining the transient stability. The
system model includes the representation of thirty four 400 kV buses, eleven
generators, eleven transformers etc. Transmission network (only 400 kV) of
TNEB is modeled using MiPower. Transmission line parameters of various
conductors (Moose and Zeebra) are used as per manufacturer’s standard. Line
length and type of conductor are considered as per information available in
the Power Grid and Ministry of Power website. The generators directly
connected to TNEB 400 kV transmission network are modeled along with the
generator step-up transformers. The generator, AVR, TG and transformer data
are given in the Tables 4.1 to 4.4 respectively. The block diagrams of type1
AVR and TG are depicted in Figures 4.2 and 4.3 respectively.

84
Figure 4.1 Modeling of SVC
N[9]
N[8]N[6]N[5]N[12]
N[4]N[13]N[2]
N[3]
+
N[7]
N[10]
T=0.003
K = 1
K=2.23 K = 1.04
T=0.2 T=0.003Max=0.529
Min=-0.278
Max=1
Min=-1
Vref[1]
SVC
Q Supply

85
Table 4.1 Generator data in TNEB 400 kV transmission network
Generator NameRated
MVA
AVR
TypeTG No.
Model
type
Rated
Voltage(kV)P Schedule Q min Q max
Droop
Constant
Neyveli-1 247 1 1 2 11 163 0 130.03 4
Neyveli-Ext 295 1 1 2 11 225 0 156.60 4
Kudamkulam 1111.11 1 1 2 21 850 0 484.32 4
Tuticorin-ST4 555.56 1 1 2 21 450 0 242.17 4
Tuticorin 555.56 1 1 2 21 450 0 242.17 4
Ind-Bharath 666.67 1 1 2 21 600 0 290.60 4
Coastal Ene 666.67 1 1 2 21 510 0 290.60 4
Mettur 555.56 1 1 2 21 450 0 242.17 4
Chennai JV 733.33 1 1 2 21 637.5 0 319.64 4
North Chennai 666.67 1 1 2 21 510 0 290.60 4
North Chennai
ABAN 666.67 1 1 2 21 510 0 290.60 4

86
Figure 4.2 Block diagram of type1 AVR
-
-
+
+
-

87
Table 4.2 Type1 AVR data in TNEB 400 kV transmission network
Variable Description Data
Trec Input rectifier time constant in s 0.05
Ka Amplifier gain 200
Ta Amplifier time constant in s 0.1
Ke Exciter gain -0.05
Te Exciter time constant in s 0.5
Kf Regulator stabilizing circuit gain 0.05
Tf Regulator stabilizing circuit time constant 0.5
Vse1 Saturation function at 0.75 times maximum
field voltage
0.06
Vse2 Saturation function at maximum field voltage 0.3
Vrmax Maximum amplifier voltage 1
Vrmin Minimum amplifier voltage -1
Efdmax Maximum field voltage 4.3
Efdmin Minimum field voltage 0

88
Figure 4.3 Block diagram of TG
++
++ +
+
+
-
+
+
-

89
Table 4.3 TG data in TNEB 400 kV transmission network
Variable Description Data
Droop 0.04
Pmax Maximum power limit 1.1
Pmin Minimum power limit 0
Cmax Rate of valve opening 0.1
Cmin Rate of valve closing - 1
K1 + K2 Power extraction at HP turbine 0.276
K 3 + K 4 Power extraction at IP turbine 0.324
K 5 + K 6 Power extraction at LP turbine 0.4
T1 Phase compensation 1 0.1
T2 Phase compensation 2 0.03
T3 Servo time Constant 0.4
Thp HP section Time constant in s 0.26
Trh Reheat section Time constant in s 10
Tlp LP section Time constant in s 999
Tip
IP section Time constant (including re-
heater) in s0.5

90
Table 4.4 Transformer data in TNEB 400 kV transmission network
Sl.
No.Bus Name
MVA
Rating
Primary
Voltage
(kV)
Secondary
Voltage
(kV)
Zp.u.Taps(Min
and Max)
OCTC
(Taps)
1 Neyveli-1 250 400 11 0.14 1 and 9 OCTC(5)
2 Neyveli-Ext 300 400 11 0.14 1 and 9 OCTC(5)
3 Kudamkulam 1200 400 21 0.14 1 and 9 OCTC(5)
4Tuticorin-
ST4560 400 21 0.14 1 and 9 OCTC(5)
5 Tuticorin 560 400 21 0.14 1 and 9 OCTC(5)
6 Ind-Bharath 670 400 21 0.14 1 and 9 OCTC(5)
7 Coastal Ene 670 400 21 0.14 1 and 9 OCTC(5)
8 Mettur 560 400 21 0.14 1 and 9 OCTC(5)
9 Chennai JV 740 400 21 0.14 1 and 9 OCTC(5)
10North
Chennai670 400 21 0.14 1 and 9 OCTC(5)
11
North
Chennai
ABAN
670 400 21 0.14 1 and 9 OCTC(5)
Single line diagram of the TNEB 400 kV transmission network
system is shown in Figure A 1.2.

91
4.6 RESULTS WITH DISCUSSIONS
Critical clearing time is the principal criterion for the assessment of
transient stability. Fault should be cleared well within the critical clearing
time to maintain the transient stability of the power system, even while
critical clearing time is not the sufficient criterion to evaluate the transient
stability when considering various scenarios of severe fault occurrence in the
power system. The oscillation of generators is basically measured with
respect to infinite bus / grid which are represented as slack bus. The
oscillation level of the generator depends on the disturbance severity and its
time duration. If the generator oscillation goes beyond 180 degrees, the
generator loses its synchronism and will not be able to regain the steady state.
That is, the generator will not be synchronous with rest of the system. Hence,
180 degrees is standardized as the transient stability limit. Since a severe
fault (three phase fault) is assumed, the ability of the generator to remain in
synchronism depends on the fault clearing time. The time to clear the fault is
slowly increased up to the critical clearing time with the help of SVC and
STATCOM.
The effect of SVC and STATCOM on the transient stability of the
power system is analyzed by creating three phase to ground fault at various
buses using MiPower through the critical clearing time. By placing the SVC
and STATCOM independently at Sholinganallur, Neyveli, Karaikudi and
Salem 400 kV substations, the fault clearing time is increased up to the
critical clearing time. Critical clearing time for the various buses with SVC at
the 400 kV substations, are tabulated in Table 4.5 and compared with critical
clearing time without SVC.

92
Table 4.5 Critical clearing time of various 400 kV buses with and
without SVC
Bus
No.Bus Name
Bus
Description
Critical clearing time in ms
Without
SVC
SVC at
Sholinganallur
SVC at
Neyveli
SVC at
Karaikudi
SVC at
Salem
402 ALAM_4 Alamanthi 120 148 145 149 149
404 SVC_4 SVC 200 208 209 208 208
405 MLKTYR Malekuttaiyur 200 225 220 225 225
406 SHLGNR Sholinganallur 260 268 268 268 268
407 PONDI_4 Pondicherry 550 565 560 585 565
410 TRCHY_4 Trichy 250 290 295 290 290
411 KARKDI Karaikudi 180 190 190 188 188
412 MDRAI_4 Madurai 140 149 149 148 148
415 KYTHR_4 Kaythar 180 185 200 188 185
416 TM_WND TM_Wind 170 172 180 172 170
417 TRNVL_4 Tirunelveli 120 125 128 145 125
419 TRNDRM Trivandrum 190 700 800 800 800
420 TRVLM_4 Tiruvelam 170 250 260 250 260
421 SNGRPT Singarpet 220 220 225 228 228
422 PGLR_4 Pugalur 180 188 187 188 188
423 SALEM_4 Salem 170 172 175 170 170
424 UDMLPT Udumalpet 180 188 189 188 188
426 ARSR_4 Arasur 290 290 310 310 310
427 KRMDI_4 Karmadai 480 488 488 488 488
428 MVTPHA Muvattupuzha 310 315 320 310 310
429 N_TRCHR N_Trichur 310 310 310 325 310
431 HOSUR_4 Hosur 410 410 430 430 410
Total 5280 6056 6238 6253 6056
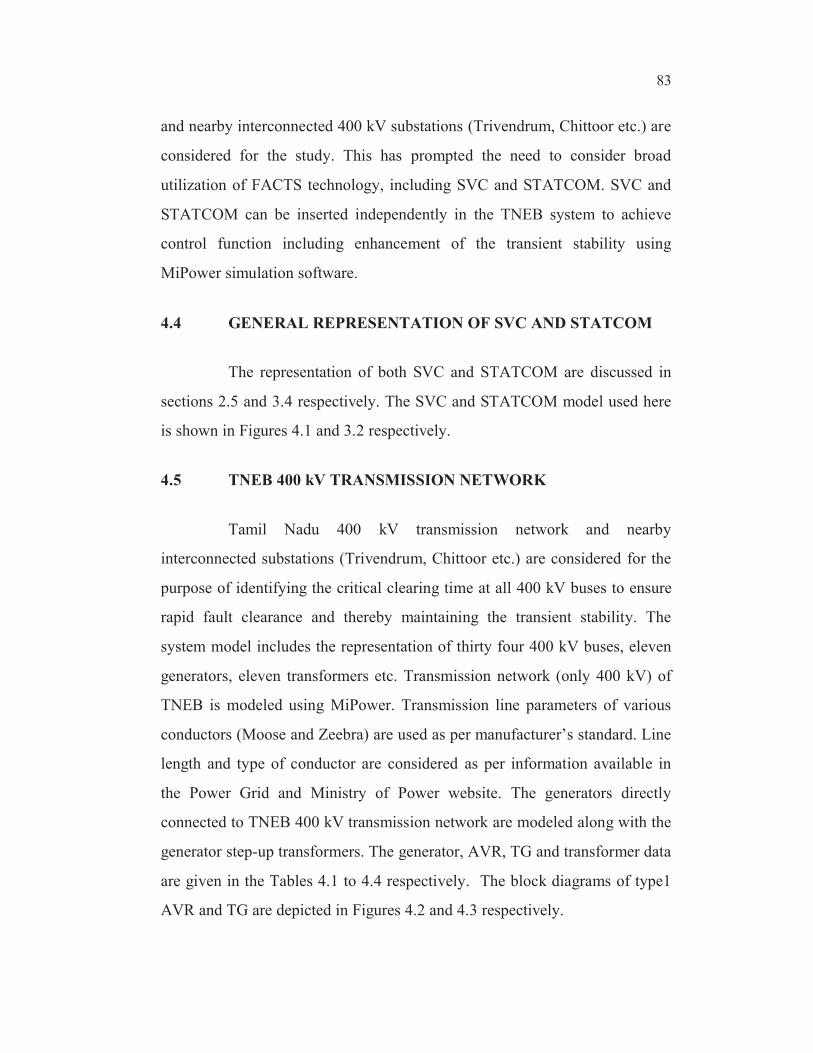
Critical clearing time for the various buses with STATCOM at the
400 kV substations, are tabulated in Table 4.6 and compared with critical
clearing time without STATCOM.
93
Table 4.6 Critical clearing time of various 400 kV buses with and
without STATCOM
Bus
No.Bus Name Bus Description
Critical clearing time in ms
Without
STATCOM
STATCOM
at
Sholinganallur
STATCOM
at
Neyveli
STATCOM
at
Karaikudi
STATCOM
at
Salem
402 ALAM_4 Alamanthi 120 149 149 150 152
404 SVC_4 SVC 200 215 208 210 209
405 MLKTYR Malekuttaiyur 200 225 225 230 228
406 SHLGNR Sholinganallur 260 275 273 270 272
407 PONDI_4 Pondicherry 550 565 565 580 572
410 TRCHY_4 Trichy 250 290 300 295 300
411 KARKDI Karaikudi 180 190 195 185 189
412 MDRAI_4 Madurai 140 145 146 149 145
415 KYTHR_4 Kaythar 180 185 188 210 185
416 TM_WND TM_Wind 170 175 175 180 175
417 TRNVL_4 Tirunelveli 120 120 130 150 125
419 TRNDRM Trivandrum 190 750 900 850 850
420 TRVLM_4 Tiruvelam 170 240 250 260 250
421 SNGRPT Singarpet 220 225 230 230 230
422 PGLR_4 Pugalur 180 190 190 195 190
423 SALEM_4 Salem 170 175 170 172 170
424 UDMLPT Udumalpet 180 185 190 185 185
426 ARSR_4 Arasur 290 300 290 290 310
427 KRMDI_4 Karmadai 480 490 490 495 490
428 MVTPHA Muvattupuzha 310 315 315 310 310
429 N_TRCHR N_Trichur 310 310 310 310 310
431 HOSUR_4 Hosur 410 420 425 425 430
Total 5280 6134 6314 6331 6134
Impact of FACTS device on the transient stability enhancement is
analyzed with the help of critical clearing time. Critical clearing time at
Alamanthi 400 kV substation without FACTS is 120 ms. Considering the
relay delay time (40 ms) and circuit breaker opening time (30 ms) in the
Alamanthi substation, the relay and circuit breaker fails to isolate the fault
during N-1 contingency ( i.e during struck breaker operation - after struck
breaker, all other breaker should open to isolate the fault) within the critical
clearing time. However, with FACTS installation at various buses, the critical

94
clearing time is increased from 120 ms to around 150 ms. This increased
cushion of 30 ms (1.5 cycle) will maintain the stability for three phase fault at
Alamanthi even for N-1 contingency.
The swing curves of generators in Neyveli-1, Neyveli-Ext,
Kudamkulam, Tuticorin-ST4 for a three phase fault at Alamanthi 400 kV
substation with and without SVC are presented here.
Figure 4.4 Swing curves of generators without SVC
The swing curves of generators in Neyveli-1, Neyveli-Ext,
Kudamkulam, Tuticorin-ST4 for 120 ms duration of a three phase fault at
Alamanthi 400 kV substation without SVC are shown in Figure 4.4. If the
95
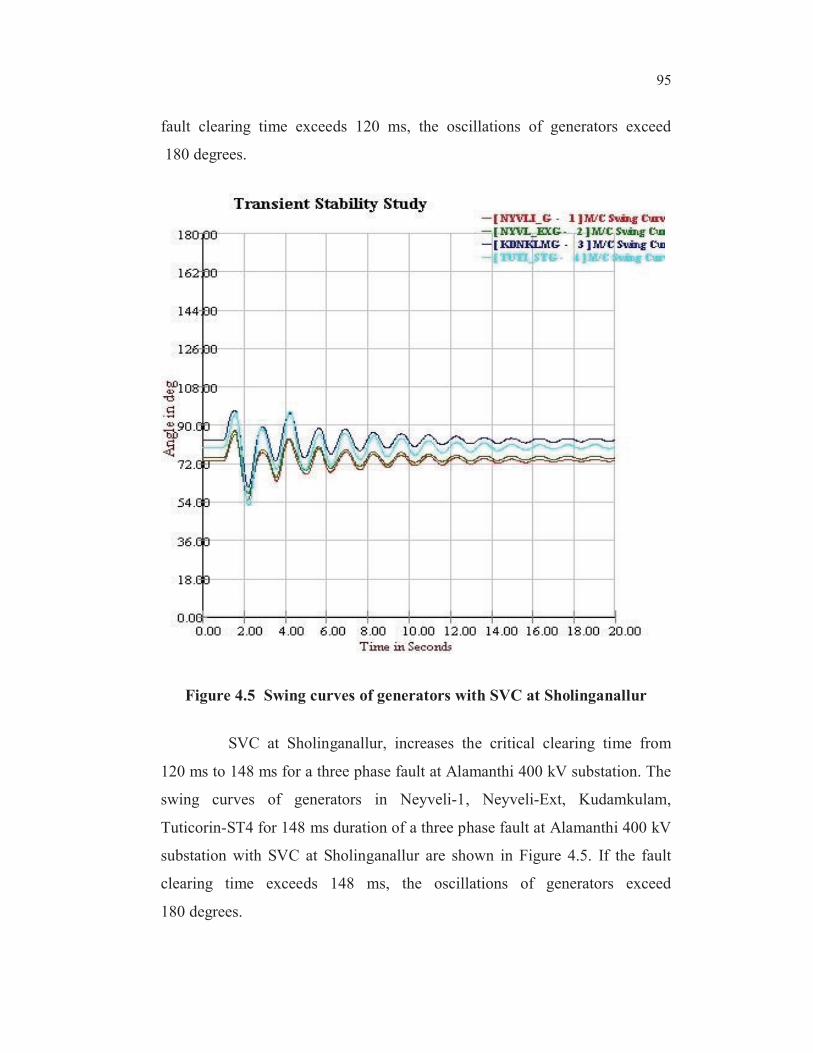
fault clearing time exceeds 120 ms, the oscillations of generators exceed
180 degrees.
Figure 4.5 Swing curves of generators with SVC at Sholinganallur
SVC at Sholinganallur, increases the critical clearing time from
120 ms to 148 ms for a three phase fault at Alamanthi 400 kV substation. The
swing curves of generators in Neyveli-1, Neyveli-Ext, Kudamkulam,
Tuticorin-ST4 for 148 ms duration of a three phase fault at Alamanthi 400 kV
substation with SVC at Sholinganallur are shown in Figure 4.5. If the fault
clearing time exceeds 148 ms, the oscillations of generators exceed
180 degrees.

96
Figure 4.6 Swing curves of generators with SVC at Neyveli
SVC at Neyveli, increases the critical clearing time from 120 ms to
145 ms for a three phase fault at Alamanthi 400 kV substation. The swing
curves of generators in Neyveli-1, Neyveli-Ext, Kudamkulam, Tuticorin-ST4
for 145 ms duration of a three phase fault at Alamanthi 400 kV substation
with SVC at Neyveli are shown in Figure 4.6. If the fault clearing time
exceeds 145 ms, the oscillations of generators exceed 180 degrees.

97
Figure 4.7 Swing curves of generators with SVC at Karaikudi
SVC at Karaikudi, increases the critical clearing time from 120 ms
to 149 ms for a three phase fault at Alamanthi 400 kV substation. The swing
curves of generators in Neyveli-1, Neyveli-Ext, Kudamkulam, Tuticorin-ST4
for 149 ms duration of a three phase fault at Alamanthi 400 kV substation
with SVC at Karaikudi are shown in Figure 4.7. If the fault clearing time
exceeds 149 ms, the oscillations of generators exceed 180 degrees.

98
Figure 4.8 Swing curves of generators with SVC at Salem
SVC at Salem, increases the critical clearing time from 120 ms to
149 ms for a three phase fault at Alamanthi 400 kV substation. The swing
curves of generators in Neyveli-1, Neyveli-Ext, Kudamkulam, Tuticorin-ST4
for 149 ms duration of a three phase fault at Alamanthi 400 kV substation
with SVC at Salem are shown in Figure 4.8. If the fault clearing time exceeds
149 ms, the oscillations of generators exceed 180 degrees.
Without FACTS, the critical clearing time at Trichy 400 kV
substation is 250 ms. With FACTS, this is improved to around 300 ms. This

99
will be certainly helpful to maintain the stability, when the backup protection
isolates the fault due to primary relay failure.
Similarly at all other buses, with FACTS devices the critical
clearing time has increased or maintained for three phase to ground faults.
The total critical clearing time of the system has significantly improved with
the help of FACTS devices.
4.7 CONCLUSION
The TNEB 400 kV transmission network is modeled using
MiPower. The critical clearing time is found at various 400 kV buses of
TNEB system and is tabulated. The proposed SVC and STATCOM model is
placed independently at Sholinganallur, Neyveli, Karaikudi and Salem
400 kV substations to identify the critical clearing time of various 400 kV
buses to ensure the rapid fault clearance and thereby maintaining the transient
stability. The critical clearing time increases appreciably after placing the
SVC and STATCOM independently in the TNEB 400 kV transmission
network. This is shown in Tables 4.5 and 4.6. It is evidenced that the transient
stability of the system has improved.
The result obtained in the TNEB system is valid only for the
present scenario. The study should be repeated as and when the considerable
capacity of new generation (> 500 MW) is added.